Rikeva Glacier, Novaya Zemlya 2000-2025 Retreat Releases New Island

Rikeva Glacier retreat in Landsat images from 2020 and 2025. Illustrates new island at Point A and retreat of land terminus at Point B and from headland at Point C.

Rikeva (Rykacheva) Glacier flows from the Northern Novaya Zemlya Ice Cap to the west coast and the Barents Sea. The glacier has been retreating rapidly like all tidewater glaciers in northern Novaya Zemlya (Pelto, 2016) (Carr et al 2014) identified an average retreat rate of 52 m/year for tidewater glaciers on Novaya Zemlya from 1992 to 2010. Maraldo and Choi (2025) identified frontal retreat rate of Novaya Zemlya glaciers from 1931-2021 and found an increased each decade since the early 1970s, reaching a peak retreat rate of 65 m/year between 2011 and 2021. We have observed the impact at Vilkitskogo Glacier and Krayniy Glacier,

In 2000 Rikeva Glacier extended beyond the island that would emerge at Point A. The landbased terminus lobe extended just beyond Point B. By 2013 the glacier had retreated adjacent to the island, with the island acting as a stabilizing point for the terminus. The terminus lobe had retreated just south and east of Point B.

Rikeva Glacier in Landsat images from 2000 and 2013 illustrating retreat to island at Point A and retreat of land terminus at Point B.

In 2018 Rikeva Glacier terminus rested on an island at Point A that acted as a buttress for the glacier terminus. By 2025 the glacier had retreated from the island with 4.5 km2 of glacier retreat since 2018 and 8 km2 of retreat since 2000.

Rikeva Glacier in Sentinel images from 2018 and 2025 illustrates retreat from Island at Point A.

Glacier Retreat Generating New Islands List

Climate change has been driving the recession of glaciers and ice sheets, which in turn has been changing our maps.  One notable category of physical geographic features indicative of the change due to the retreat is the formation of new islands.  Below is a list of new islands that this blog has identified and reported.  This is not a comprehensive list of all islands that have been formed.  

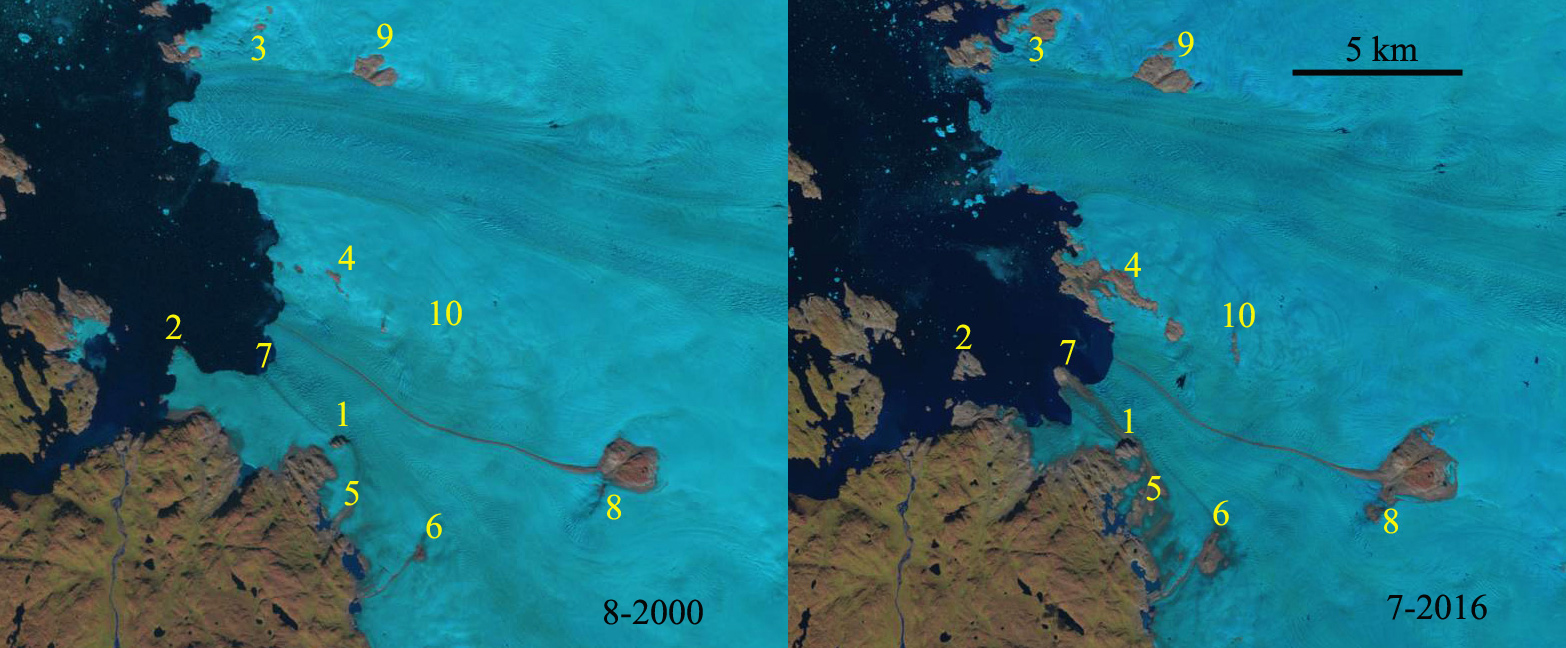
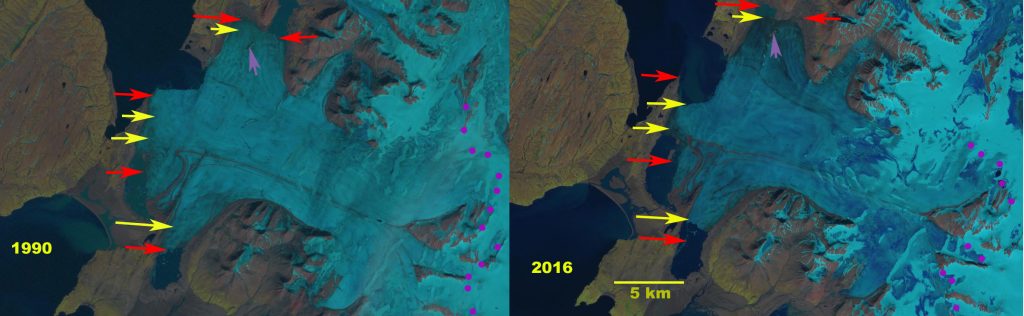
Upernavik Glacier, Greenland in Landsat images from August 2000 and August 2016.  Each Point is at the same location in both image, and the changes are noted in the discussion below.  The same locations are also identified in the July 2001 and Aug. 2016 image below. 
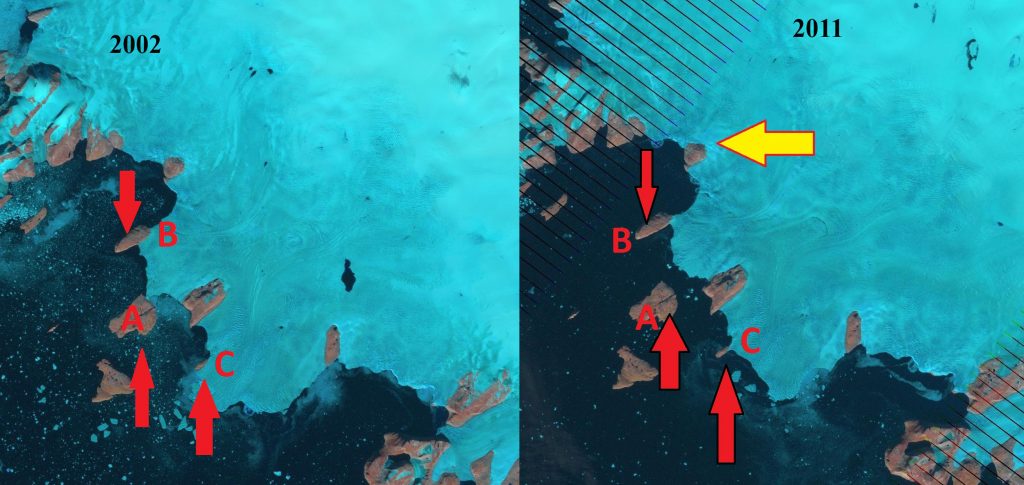
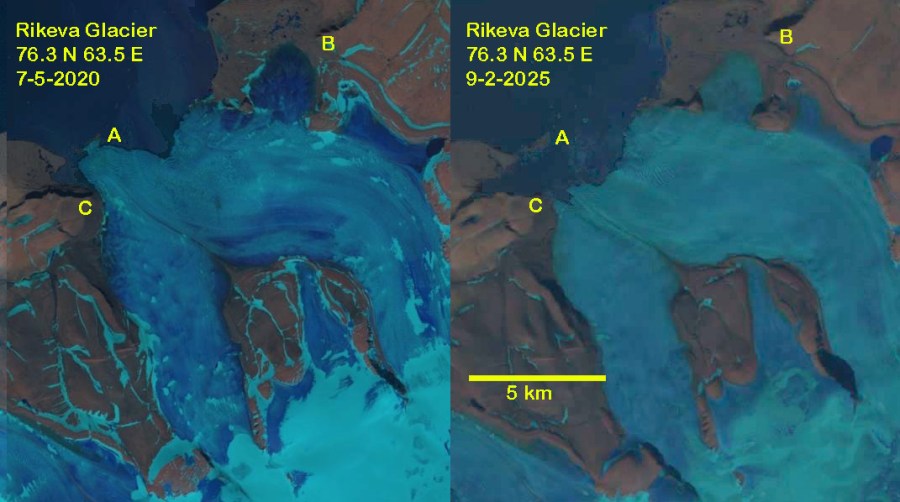
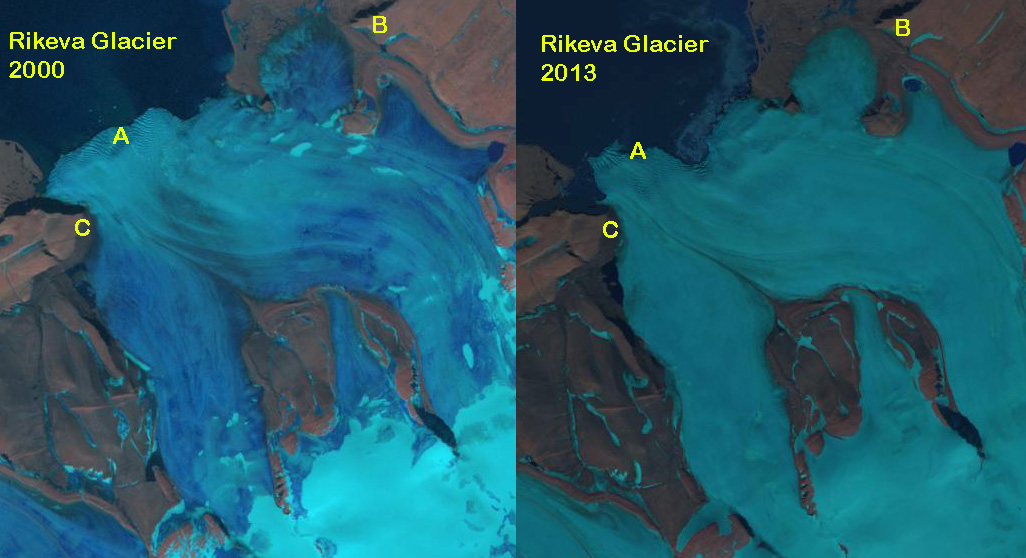
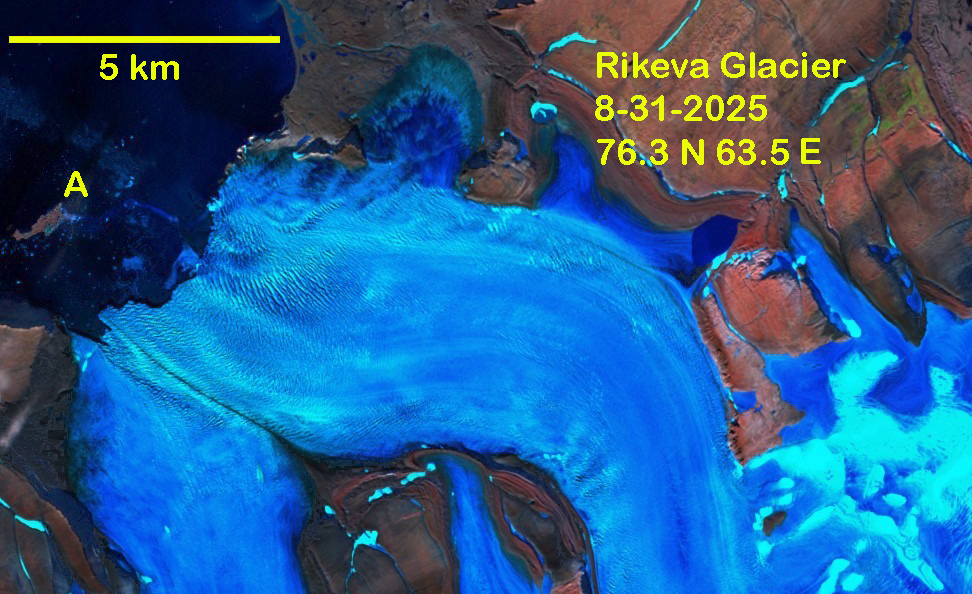
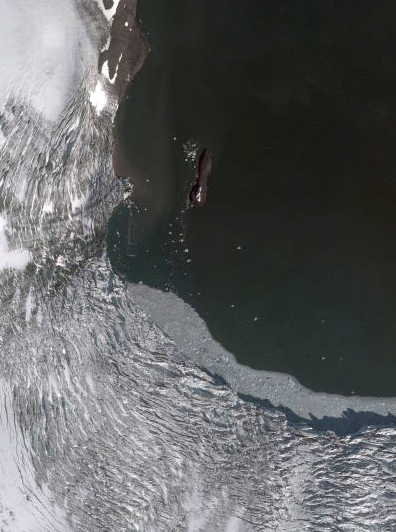
Kong OscarGreenland: Island A forms with B and C on the verge.

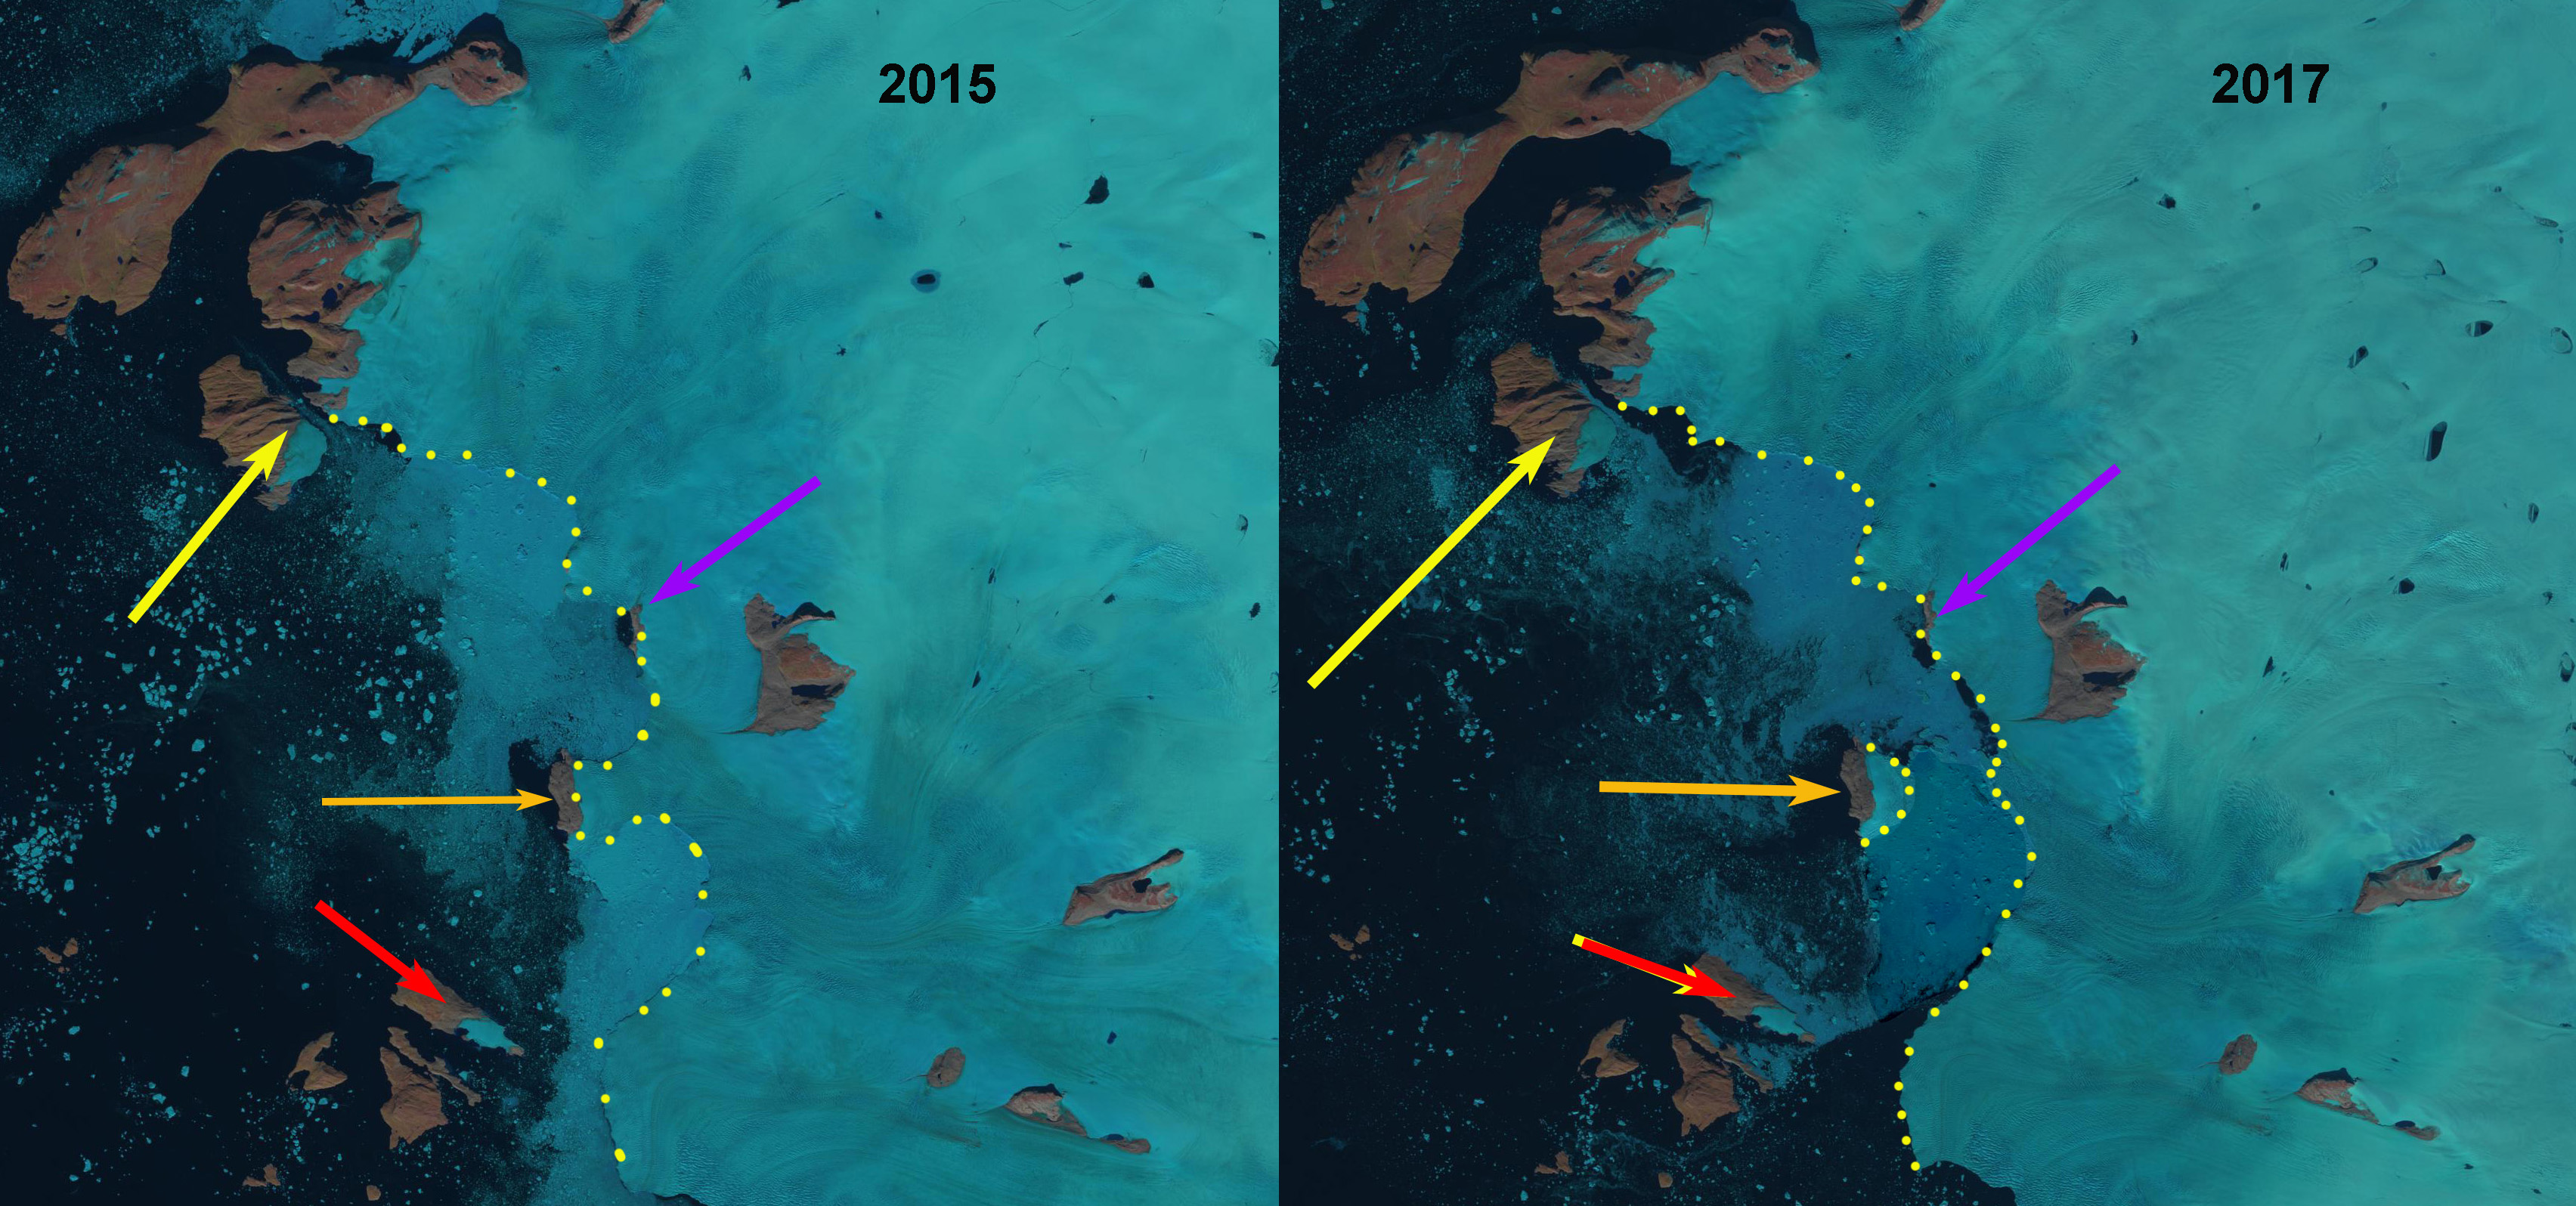
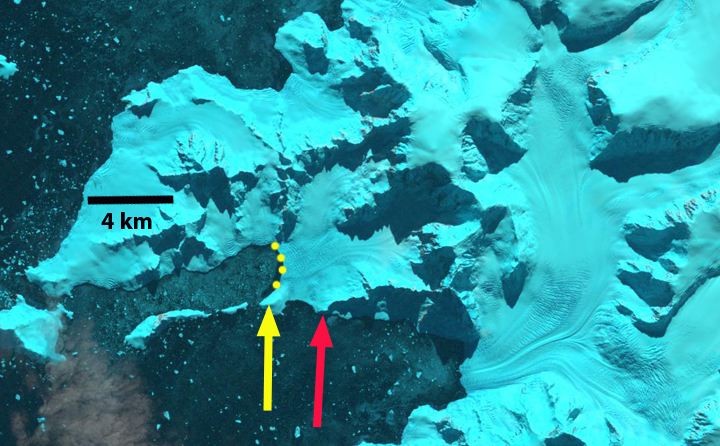
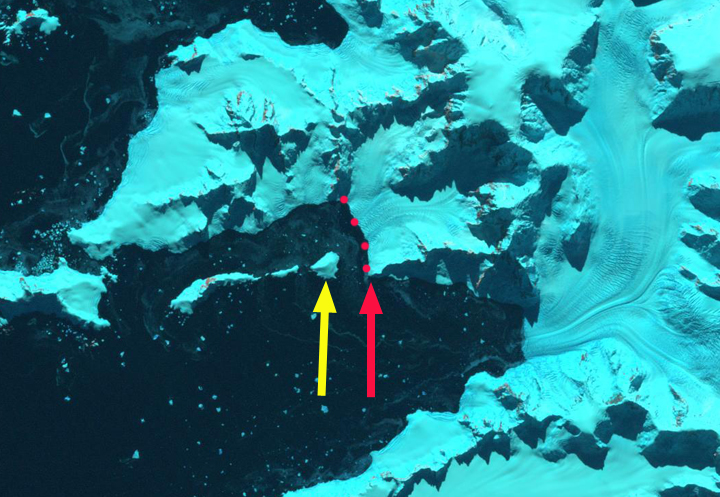
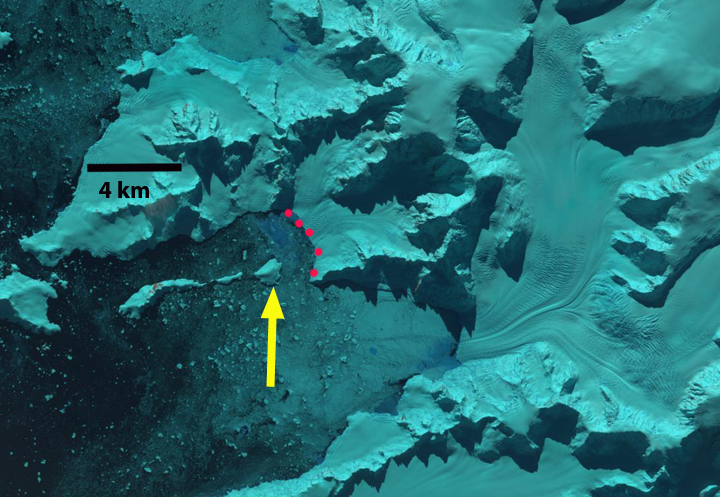
Steenstrup Glacier, Greenland front in 2015 and 2017 illustrating location with respect to the new islands at: Red Head-red arrow, Tugtuligssup Sarqardlerssuua at yellow arrow , and the 2017 new island at orange arrow.  Yellow dots indicate icefront and purple arrow another future island to be released from the glacier.  

corontation-compare-copy

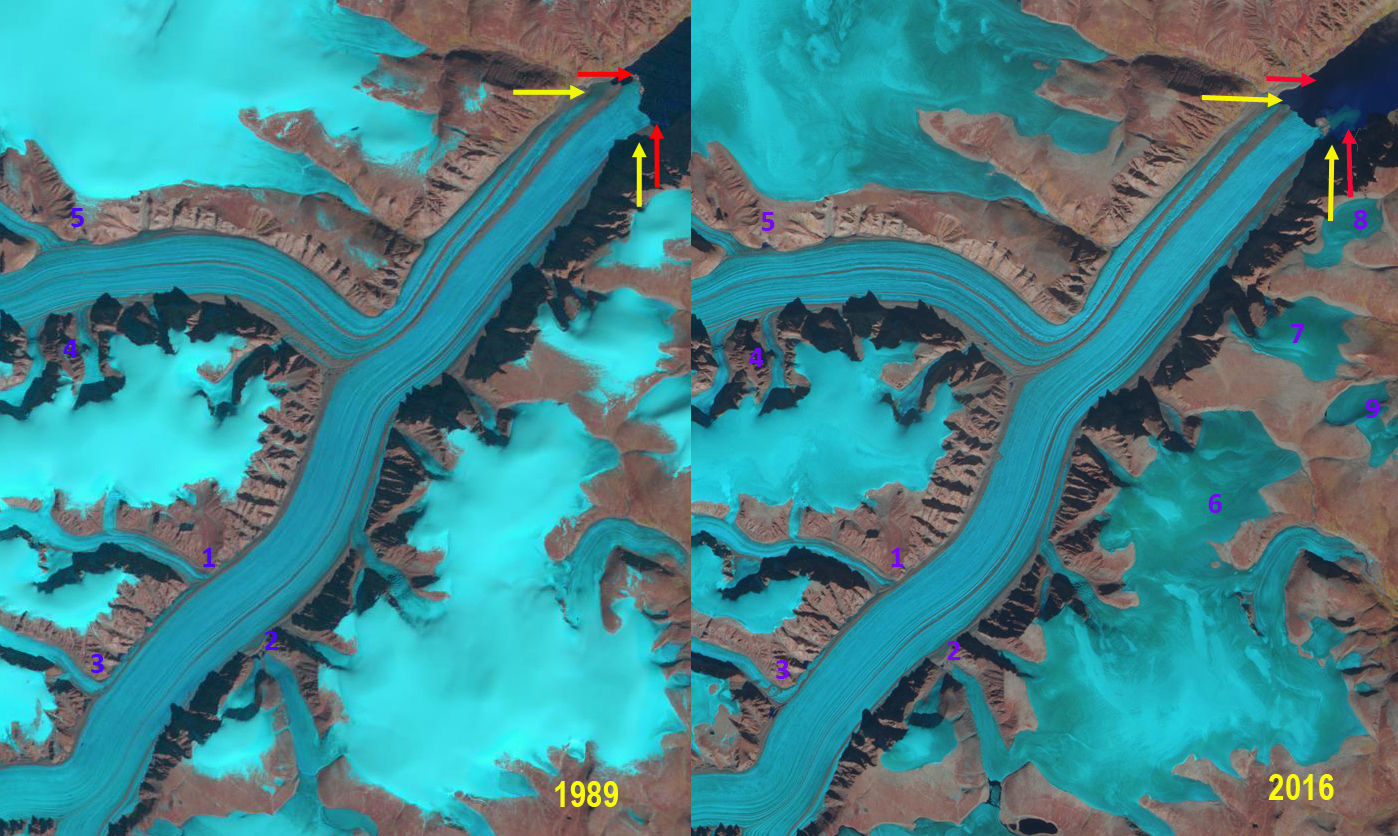
Coronation Glacier, Canada: A Landsat image from 1989 and a Sentinel 2 image from 2016 illustrate the retreat of Coronation Glacier.  Red arrows indicate the 1989 terminus and yellow arrows the 2016 terminus location.  Purple numbers 1-5 indicate locations of tributary retreat or thinning. Purple numbers 6-9 are icecaps that did not retain snowcover in 2016. 

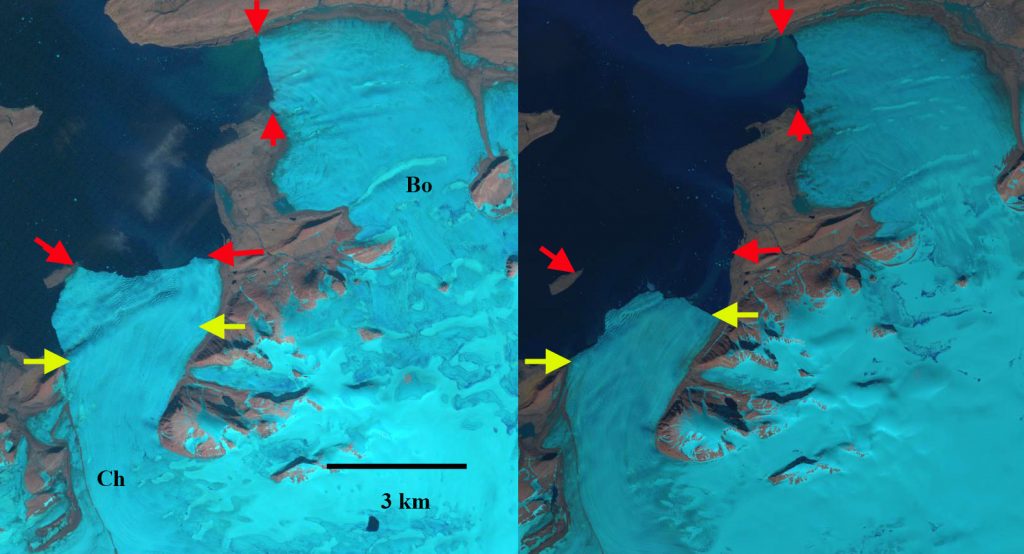
Chernysheva Glacier and Borozova, Novaya Zemlya comparison in 1990 and 2015 Landsat images. Red arrows indicates 1990 terminus and yellow arrow 2015 terminus position. Island has formed at the 1990 terminus position of Chernysheva.
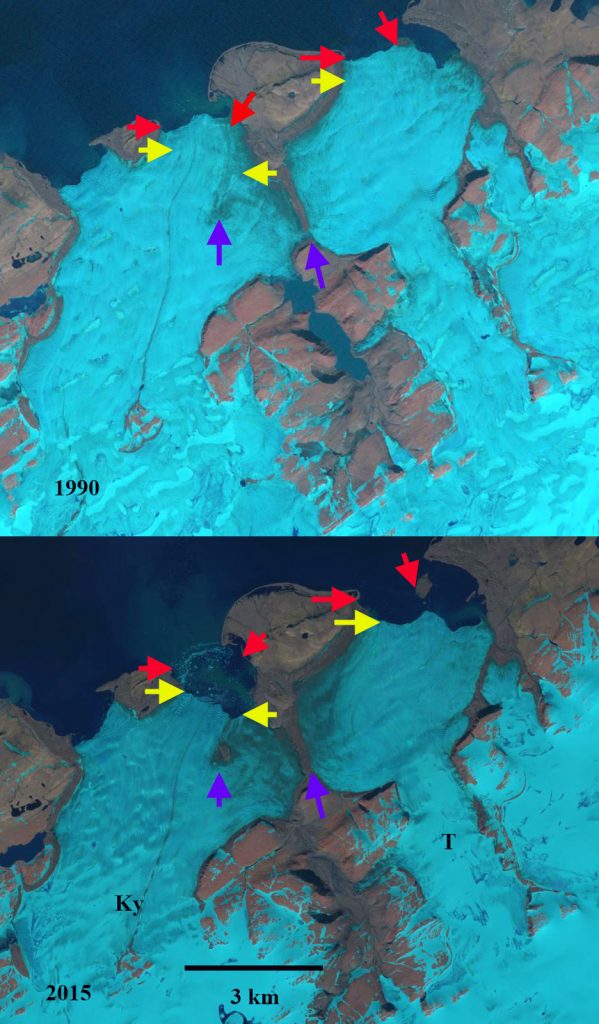
Tasija and Krayniy GlacierNovaya Zemlya: Tasija Glacier (T) and Krayniy Glacier (Ky) compared in 1990 and 2015 Landsat images.  Red arrows indicate 1990 terminus positions, yellow arrows 2015 terminus positions and purple arrows upglacier thinning. A new island formed upper right red arrow.

Nizkiy Glacier, Novaya ZemlyaNizky Glacier (N) and Glasnova Glacier (G) compared in 1990 and 2015 Landsat images.  Red arrows indicate 1990 terminus positions, yellow arrows 2015 terminus positions and purple arrows upglacier thinning.  An island has formed at the second red arrow from the bottom.

Krivosheina GlacierNovaya Zemlya:  Krivosheina Glacier compared in 1990 and 2015 Landsat images.  Red arrows indicate 1990 terminus positions, yellow arrows 2015 terminus positions and purple arrows upglacier thinning.  Point A indicates a new island that has formed.
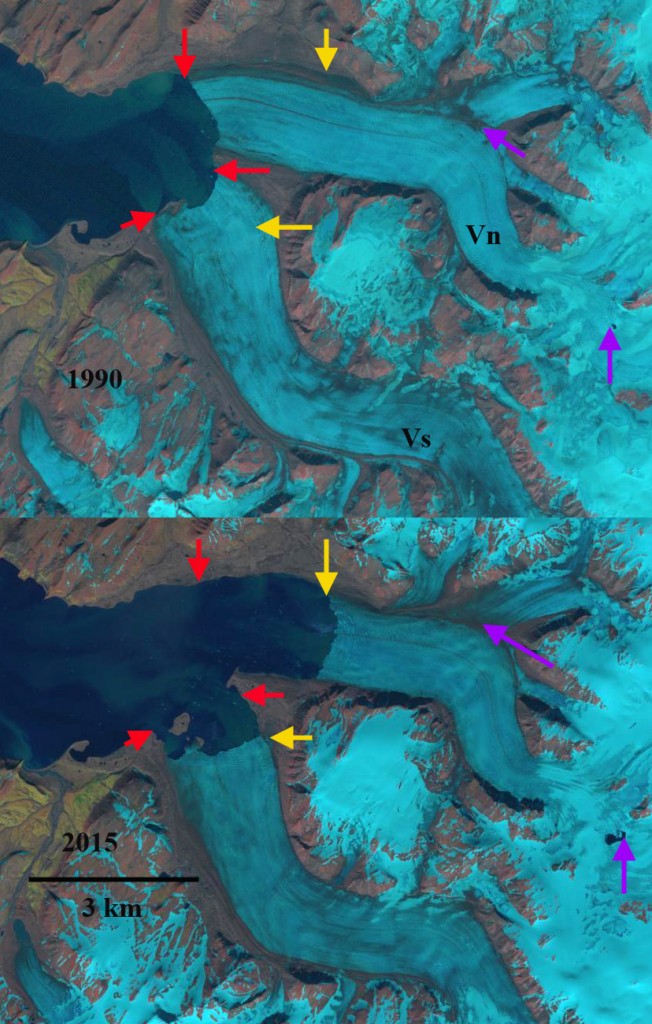
Vilkitskogo GlacierNovaya ZemlyaVilkitskogo South Glacier (Vs) and Vilkitskogo North Glacier (Vn) compared in 1990 and 2015 Landsat images.  Red arrows indicate 1990 terminus positions, yellow arrows 2015 terminus positions and purple arrows upglacier thinning.


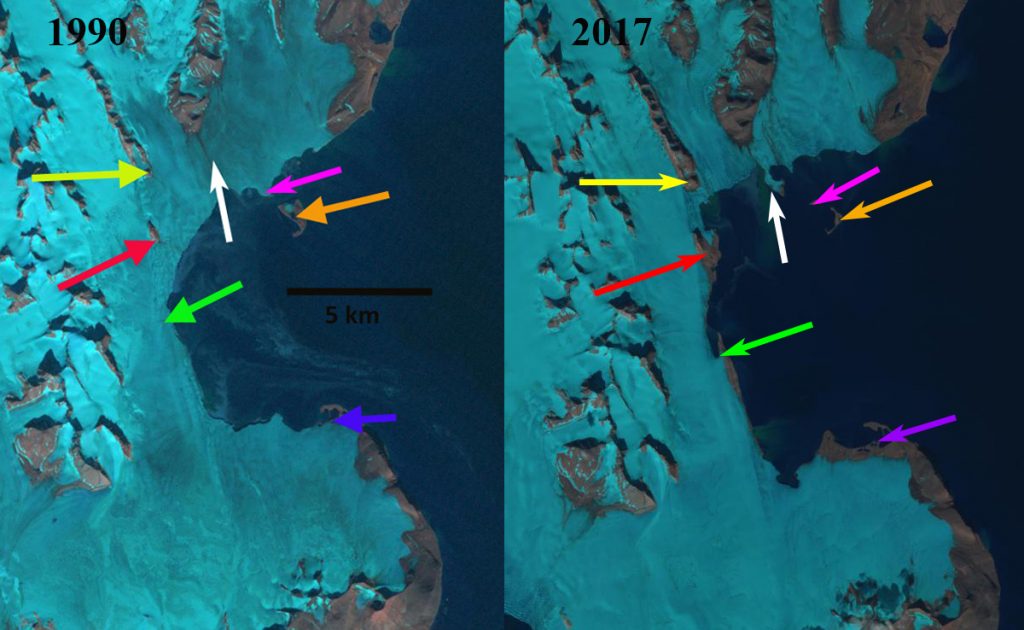
Vasilievebreen, Svalbard: retreat from 1990-2017 has led to the creation of one island at the pink arrow, while the island at the orange arrow has eroded and an island at the white arrow is on the verge of being released by the glacier.  

Samarinbreen, Svalbard: Landsat imagery from 1990-2014 illustrates that the retreat of the glacier has been 2.1 km including the formation of an island.

Leroux Bay Glacier Retreat-Island Formation, Antarctic Peninsula

Leroux Bay is on the west coast of the Antarctic Peninsula in Graham Land.  Numerous glacier drain from the Antarctic Peninsula into the ocean along this coast, and as they retreat the coastline is changing.    Air temperatures rose by 2.5°C in the northern Antarctic Peninsula from 1950 to 2000, which has led to recession of 87% glaciers and ice shelves on the Peninsula in the last two decades (Davies et al.,2012). Most spectacularly has been the collapse of Jones, Larsen A, Larsen B, Prince Gustav and Wordie Ice Shelves since 1995 (Cook and Vaughan, 2010). This has opened up our ability to examine sediments that had accumulated beneath the floating ice shelves.   The LARISSSA Project has been pursuing this option and utilized the Korean icebreaker ARAON to explore and map the bathymetry of Leroux Bay.  Last week Antarctica recorded its highest temperature at  the Argentine Base Esperanza on March 24th, 2015 located near the northern tip of the Antarctic Peninsula reported a temperature of 17.5°C (63.5°F). Here we examine the changes from 1990 to 2015 of glacier on the north side of Leroux Bay. 

LARSEN

Location of Glacier examined from USGS Map.

leroux bay ge

Google Earth image indicating glacier flow directions, blue arrows, island yellow arrow and glacier terminus red arrow.

In 1990 and 1991 the Leroux Bay Glacier extended to the yellow arrow, which is an island connected by the glacier to the mainland and acts as a stabilizing point for the glacier. The ice front is marked with yellow dots in both cases. The terminus region of the glacier is floating, making this a small ice shelf, fed by three tributaries, one from the north, one from the east and one from the northeast.  By 2001 the glacier front has retreated to the red arrow, losing most of the floating area, and the northern tributary now has an independent calving front.  The red arrow also points to the tip of a peninsula, another stabilizing point, the ice front is marked by the red dots for 2001 and 2015. The yellow arrow indicates the new island that is detached from the mainland. The two images from January 2015 and Late February 2015 indicate limited retreat an the north and south sides of the terminus, but retreat in the glacier center has led to a concave shaped calving front. Retreat from 1990 to 2015 averages 2.1 kilometers. The USGS map (Blue Line) indicates the terminus in the 1960’s was 3 km beyond the 1990 terminus location. The calving front remains active with extensive crevassing.  It is not clear simply from Landsat imagery if any of the glacier is afloat, if so it would likely be the southern half of the eastern tributary, There is limited melting in this region, so volume loss can occur via basal melt via ocean water or calving.  Even in a warm summer there is little visible evidence of surface melting in 2015. The widespread loss of mass from ice shelves in Antarctica is mainly via basal melting (Paolo et al, 2015). An examination of the coast in the region illustrates numerous other examples where glacier retreat has led to separation of islands, such as with the loss of the Jones Ice Shelf.

leroux bya 1990
1990 Landsat image

leroux bay 1991
1991 Landsat image
leroux bay 2001
2001 Landsat image
leroux bay 2015 early
January 2015 Landsat image
leroux bay 2015 late
Feb. 2015 Landsat image