35th Annual Field Observations of North Cascade Glaciers

The 2018 field season observations, conditions and summary. Field team Mariama Dryak, Erin McConnell, Jill Pelto and Mauri Pelto.

For the 35th consecutive year I headed to the North Cascade Range, Washington to monitor the response of glaciers to climate change.  Two of the glaciers the North Cascade Glacier Climate Project (NCGCP) monitors are now part of the 42 glaciers comprising the World Glacier Monitoring Service  (WGMS) reference glacier network, where annual mass balance has been assessed for more than 30 years consecutively.

The 2018 winter season featured relatively normal snowpack despite a winter of wide temperature fluctuations, February freezing levels 400 m below the mean and December 500 m above the mean. Summer melt conditions featured temperatures 1.1 C above the 1984-2017 mean. The summer melt season through August was warm and exceptionally dry, which has also helped foster forest fires. The melt rate during the August field season was 35% above normal.

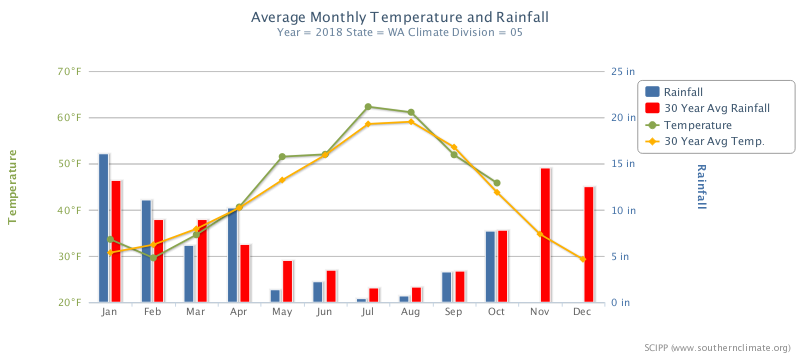
Washington Climate Division Five, western North Cascades

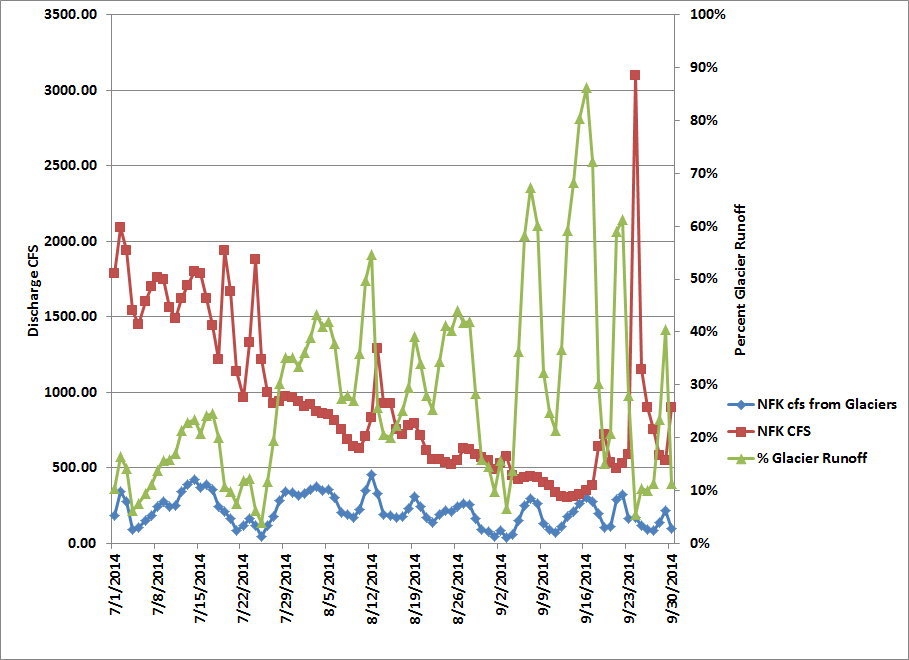
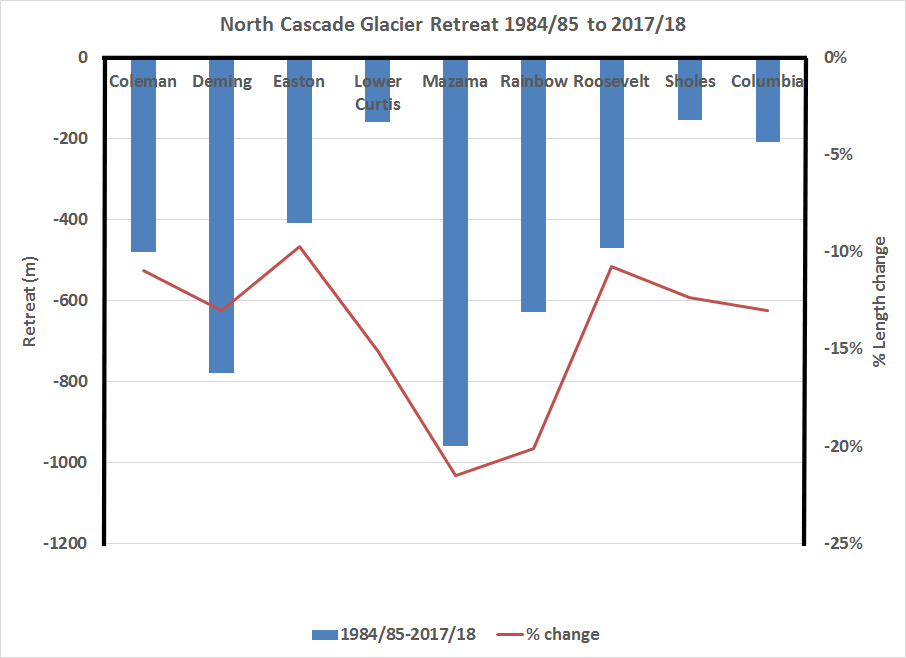
We assessed the mass balance of eight glaciers.  All eight will have significant negative mass balances in 2018, between -0.5 m and -1.0 m.  Retreat was measured on seven of the glaciers where the terminus was exposed, all had retreated since 2017 with the retreat ranging from 7-21 m. This continues the pattern of significant retreat each year that began in 2014. The overall length loss as a percentage of total length falls into a relatively narrow range of 10-22%.  The mass balance losses has also led to additional rock outcrops emerging in what had been the elevation of the accumulation zone.  We continued to measure runoff below Sholes Glacier and to assess crevasse depth.  The average crevasse depth in 2018 was 10 m, with the deepest at 16 m on Lower Curtis Glacier.

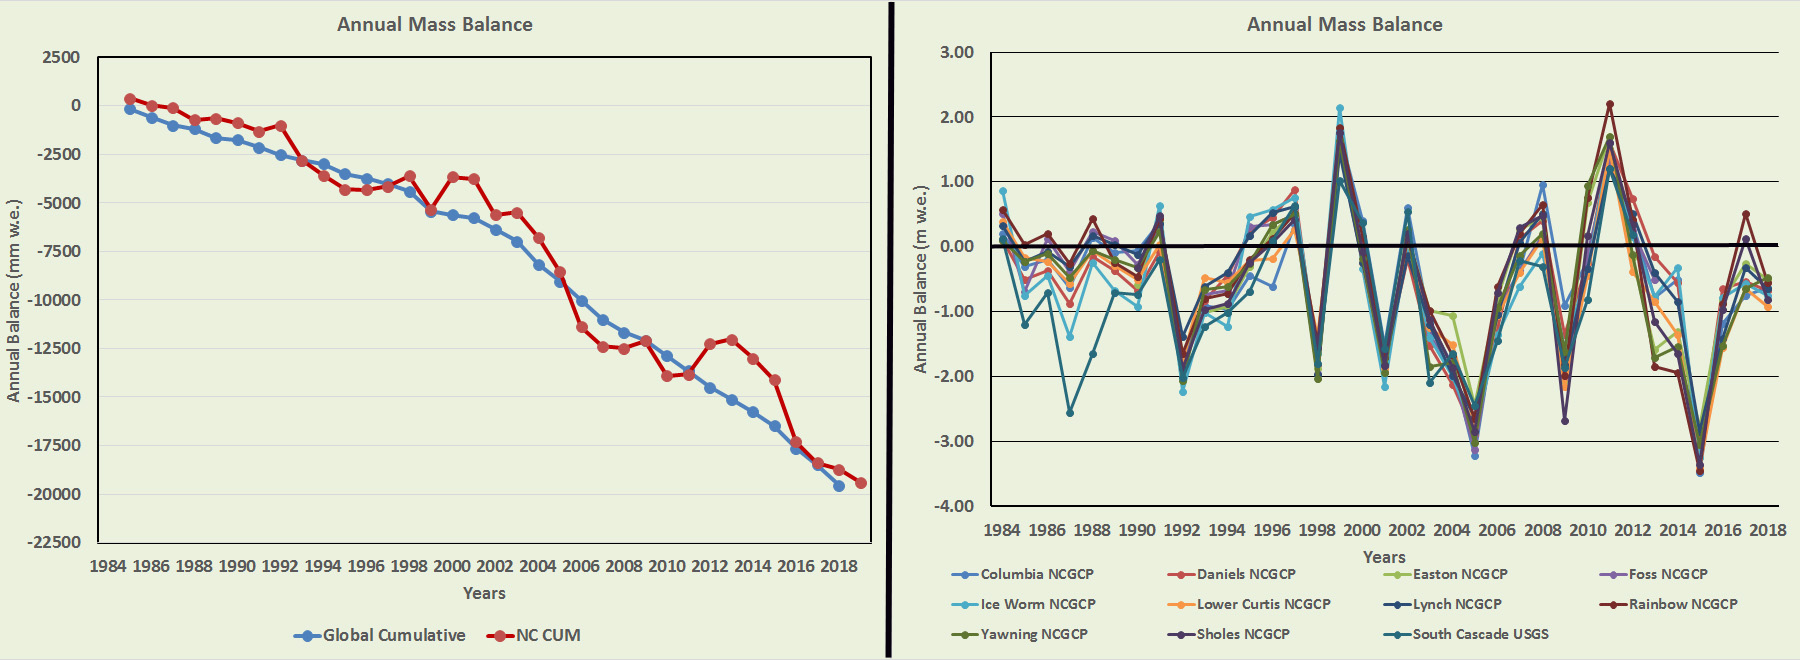
Annual  mass balance of North Cascade glaciers 1984-2018 (right).  Cumulative glacier mass balance from NCGCP compared to WGMS global cumulative mass balance.  Below is the retreat of selected North Cascade glaciers during the last 35 years, in meters and as a percentage of the total length.  Locations for all but Columbia Glacier are in image below. 

Mount Baker and Mount Shuskan glaciers identified in a Landsat image from 8-9-2018. Blue indicates mass balance and terminus change are observed.  Orange indicates only terminus change is observed. C=Coleman, D=Deming, E=Easton, LC=Lower Curtis, M=Mazama, N=Nooksack, P=Price, R=Rainbow, Rv=Roosevelt, SH=Sholes. 

Climate Driven Retreat of Mount Baker Glaciers and Changing Water Resources

breakfast2

We have spent 300 nights in a tent just on this mountain collecting data from 1984-2015 in this study that the book documents.

This post has the same title as a book released last month as part of the Springer Briefs in Climate Studies series.  The nice thing about publishing research emerging from 30 years of field research in a book  is that I had a chance to include 104 figures in 107 pages.   Here I give a brief synopsis of the book and a key figure from each of the six chapters.This book presents the impact of climate change on Mount Baker glaciers, USA, and the rivers surrounding them. Glaciers are natural reservoirs that yield their resource primarily on warm dry summer days when other sources are at their lowest yield. This natural tempering of drought conditions will be reduced as they retreat. Mount Baker, a volcano in the Cascades of Washington, is currently host to 12 principal glaciers with an area of 36.8 km2. The glaciers yield 125 million cubic meters of water each summer that is a resource for salmon, irrigation and hydropower to the Nooksack River and Baker River watersheds. Recent rapid retreat of all 22 glaciers is altering the runoff from the glaciers, impacting both the discharge and temperature of the Nooksack and Baker River. Over the last 30 years we have spent 270 nights camped on the mountain conducting 10,500 observations of snow depth and melt rate on Mount Baker. This data combined with observations of terminus change, area change and glacier runoff over the same 30 years allow an unusually comprehensive story to be told of the effects of climate change to Mount Baker Glaciers and the rivers that drain them.

Red Channel|Green Channel|Blue Channel

Chapter 1: Panchromatic sharpened Landsat image of the glacier of Mount Baker in Aug. 2014, rendered by Ben Pelto (UNBC).  

We have worked on each of these glaciers except Thunder Glacier.  After advancing from 1950-1979, the glaciers have all been in retreat, in 2015 the average retreat was 390 m since 1985. 

easston compare

Chapter 2 Comparison of Easton Glacier from our base camp in 2003 and 2015, where we have spent over 90 nights.  We measure the retreat of each glacier in the field as they respond to climate change.

fig 3-23

Chapter 3 looks at mass balance of glaciers in the area including the Sholes Glacier Daily ablation measurements over the last 30 years allow determination of a relationship between daily melt and air temperature. Other factors matter, but  air temperature does yield a good relationship.

nfk glacier contributiion


Chapter 4 Glacier runoff provides a critical water resource to the Nooksack River.  We measure meltwater runoff from Sholes Glacier and observe glacier melt on several glaciers in the basin.  This allows determination of the contribution of glaciers to the watershed.  In 2014 contributions from glaciers exceeded 40% of total North Fork Nooksack River streamflow on 21 days after Aug. 1.   This is a critical period for salmon migration in the watershed.

fig 5-6

Chapter 5 Glacier runoff is measured below the Sholes Glacier in conjunction with Oliver Grah and Jezra Beaulieu, Nooksack Tribe.  This is the record for part of the 2014 field season at the gage site.

fig 6-22

Chapter 6  Deming Glacier in 2011 Google earth image illustrating retreat. The glacier has retreated 420 m from 1979 to 2015.