31 years of observations on Retreating Columbia Glacier, Washington

For the last 31 years the first week of August has found me on the Columbia Glacier in the North Cascades of Washington. Annual pictures of the changing conditions from 1984 to 2014 are illustrated in the time lapse video below. This is the lowest elevation large glacier in the North Cascades. Columbia Glacier occupies a deep cirque above Blanca Lake and ranging in altitude from 1400 meters to 1700 meters. Kyes, Monte Cristo and Columbia Peak surround the glacier with summits 700 meters above the glacier. The glacier is the beneficiary of heavy orographic lifting over the surrounding peaks, and heavy avalanching off the same peaks. This winter has been the lowest year for snowpack in the North Cascades in the 32 years we have worked here.  Below is a comparison from August 1, 2011 with Blanca Lake below the glacier still frozen and a beautiful scene on April 4, 2015 with the lake not frozen taken by Karen K. Wang.  The winter in the region was unusually warm, but not as dry as in California; however, in the snowmelt and glacier fed river basins summer runoff will be low this year.


Blanca Lake Aug. 1, 2011 on left and April 4, 2015 on right (Karen K. Wang, www.karenkwang.com)
Blanca Lake Aug. 1, 2011 on left,  and April 4, 2015 on right (Karen K. Wang, www.karenkwang.com)

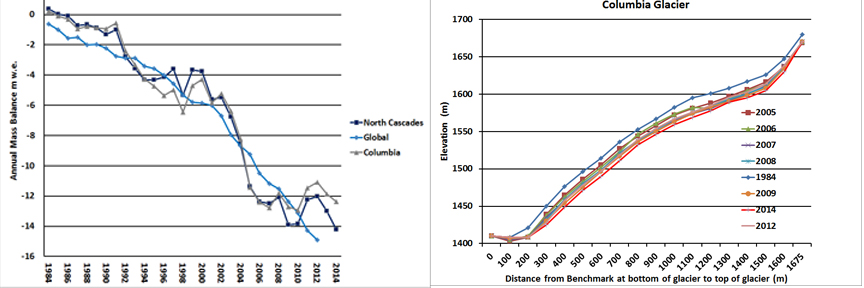
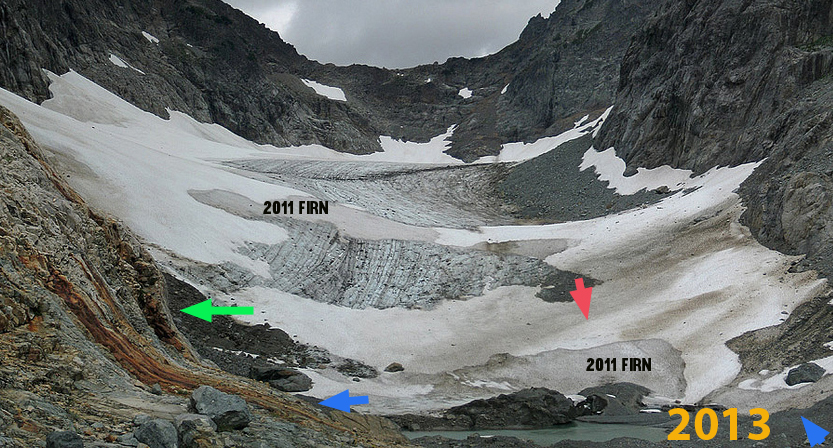
Over the last 31 years the annual mass balance measurements indicate the glacier has lost 14 meters of thickness. Given the average thickness of the glacier of close to 75 meters in 1984 this represents a 20% loss in glacier volume. During the same period the glacier has retreated 135 meters, 8% of its length. Most of the loss of volume of this glacier has been through thinning not retreat.  To survive a glacier must have a persistent and consistent accumulation zone (Pelto, 2010).  On Columbia Glacier in 1998, 2001, 2003, 2004, 2005, 2009 and 2013 limited snowpack was retained, resulting in thinning even on upper part of the glacier.  This thinning of the upper glacier indicates the lack of a persistent accumulation zone such as in 2005, note the exposed annual ice and firn layers green arrows, this indicates the lack of retained accumulation in recent years.  This indicates the glacier is in disequilibrium and cannot survive. Mapping of the glacier from the terminus to the head indicates a similar thinning along the entire length of the glacier.  The overall mass balance loss parallels that of the globe and other North Cascade glaciers in the last three decades.

columbia accumulation zone 2005

2005 Accumulation zone of Columbia Glacier


On left cumulative mass balance of Columbia Glacier compared to the WGMS global record and other North Cascade glaciers. On right change in surface elevation along the glacier from terminus to head indicating a 14-15 m thinning on average.

A comparison of images from  1986, 2007 and 2013 photograph provide a view of  glacier change at the terminus. The blue arrows indicate moraines that the glacier was in contact with in 1986, and now are 100 meters from the glacier. The green arrow indicates the glacier active ice margin in 1986 and again that same location in 2007 now well off the glacier. The red arrow indicates the same location in terms of GPS measurements, this had been in the midst of the glacier near the top of the first main slope in 1986. In 2007 this location is at the edge of the glacier in a swale. The changes are more pronounced in 2013 as the terminus slope continues to decrease. The low snowpack in 2015 on the glacier in March, 2-3 m versus 6-8 m, will lead to considerable changes in the terminus this summer, that we will assess.

1986 Terminus Columbia Glacier

columbia 2007 comp

2007 Terminus Columbia Glacier

columbia glacier2013 comp.

2013 Terminus Columbia Glacier

Jill Pelto painted the glacier as it was in 2009 (top) and then what the area would like without the glacier in the future, at least 50 years in the future (middle), and Jill at the sketching location (bottom), turned 180 degrees to view Blanca Lake. The lake is colored by the glacier flour from Columbia Glacier to the gorgeous shade of jade.

Clearly the area will still be beautiful and we will gain two new alpine lakes with the loss of the glacier. After making over 200 measurements in 2010 we completed a mass balance map of the glacier as we do each year. This summer we will be back again for the 32nd annual checkup.  There will be likely be record low snowpack, comparable to 2005 the worst year from 1984-2014.

2010 Mass Balance map of Columbia Glacier

Glacier Ground Truth-2012 Field Season

For the 29th summer in a row we will be measuring glacier mass balance in the field, in the North Cascades, Washington, over the next three weeks, no new posts during this period. Glacier mass balance is the most sensitive measure of glacier response to climate. In the past the only way to determine mass balance was detailed field measurements. Today there is sufficient satellite imagery to provide data that can be used in conjunction with ground truth to determine the mass balance of a glacier using a model. The ground truth we complete provides richer spatial detail than remote sensing can today. Satellite imagery provides excellent big picture and time specific data, but still needs ground truth. For example the National Operational Hydrologic Remote Sensing Center (NOHRSC) now provides daily snowpack and snowmelt maps that are based on satellite imagery and climate models. A snapshot is provided of two of these from early July 2012 in the area of Mount Baker, WA, where we will be working shortly note blue arrows indicating specific glaciers. The first image is the snowpack in snow water equivalent (SWE). It is assessed at over 30 inches remaining. The second is of the snowmelt in SWE for the same area over a 72 hour period ranging from 1.5 to 4 inches. NOHRSC products are not really designed for glaciated elevations or mid-summer conditions, the system has been well verified for most areas of our nation for most times of the normal snowcover season. The Sholes Glacier in summer fits neither. We will be measuring the snowpack at over 500 locations around the blue arrows. We will also be continuing to measure the snowmelt on the same glaciers as the summer progresses. Other satellite images provide a detailed look at a glacier, but are acquired only on occassion. This is indicated by the excellent images in Google Earth from Sept. 2009 and Sept. 2011 of Sholes Glacier which show a much different story in terms of snowpack extent. The blue dots indicate the 2009 snowline, where snow from the winter survived the summer melt season up to that date. In 2009 the glacier was 30% snowcovered at the end of the melt season, in 2011 the glacier was 95% snowcovered. We will be taking over 100 measurements of snow depth on this glacier to provide the detail that allows the pattern of snowcover alone to be used to identify the snowpack distribution and hence mass balance of the glacier.

Quien Sabe Glacier Retreat

The Quien Sabe Glacier in the North Cascades of Washington has experienced rapid retreat in the last 20 years. This glacier is the largest in Boston Basin near Cascade Pass, its name translates to “who knows?”, well we all know it is not enjoying recent climate. In the 1960 Austin Post photograph he gave to me in 1994, the glacier was heavily crevassed and advancing. By 1975 the advance had ceased, but little retreat occurred until 1987. This glacier faces south and is fed by avalanching off of Forbidden and Sahale Peak. The glacier retreated 1200 meters from its Little Ice Age maximum (moraine indicated with blue arrows) until 1950. Richard Hubley noted the advance by 1955, the total advance was 55 meters by 1975 (advance moraines noted with orange arrows). We were able to identify the advance moraine in 1985 when it was still quite evident. The smooth bedrock, Granodiorite in the basin, provides little friction for this glacier as it moves over the polished slabs. Today the terminus moraines from 1975 range from 150-250 meters from the current glacier terminus averaging just over 200 meters. For a glacier that averages 700 meters in length this is a significant loss of total area. There are a number of bedrock outcrops that have appeared above the terminus indicating how thin the terminal area is and that retreat is ongoing. . In 2009 the glacier lost almost all of its snowcover an occurrence that has become frequent in the last 18 years. In this August image the glacier is 25% snowcovered. Fortunately 2010 was a better year in terms of snowcover, with more than 50% of the glacier snowcovered at the end of the summer, photograph from Neil Hinckley.
Quien Sabe Glacier viewed from a similar location on the western side of the glacier in 1985 and 2007. The reduction in crevassing, thickness is evident as is the marginal retreat and emerging bedrock.

North Cascade Glacier 2010 Mass Balance Forecast

Beginning in 2006 the North Cascade Glacier Climate Project began to forecast glacier mass balance from atmospheric circulation index data. To be useful for water resource managers such a forecast must be made early in the spring. This is when snowpack begins melting at elevations below the glaciers and reservoirs can begin to be recharged. A first generation forecasting model that relied on October-March Pacific Decadal Oscillation and El Nino Southern Oscillation Index values was developed. The mass balance forecast method reliably determined if the mass balance of North Cascade glaciers would be negative, equilibrium or positive in 22 of the last 26 years. Most people may be under the impression that the snowmelt season is well underway, in fact 2010 has seen a record loss of snowpack extent through March this year in North America. A look at the snow cover depletion using data from the Rutgers Global Snow Lab beginning in either the 7th, 8th or 9th week and ending with the 14th week indicates this record melt. In the second image the rapid snow cover loss is further apparent. In the Northern Hemisphere for example February 2010 was the third most extensive snow cover extent of the last 44 years, March the 18th of the last 44 years, and April the 41st most of the last 44 years (Rutgers University Global Snow Lab). This change indicates a record snow cover melt off in 2010 for the last 44 years. This can happen on a glacier as well.However, for glaciers the snowmelt season usually ends close to May 1. The melt season in the North Cascades is still not upon us. Typical maximum accumulation occurs around May 10. The best long term snowpack data is for April 1, hence that date is often used to evaluate the end of winter snowpack for snow measurement stations most of which are well below glacier elevations. This year snowpack on April 1 averaged 0.82 meters. There has been no year with positive mass balance and snowpack on April 1 below 1.0 meters. If we look solely at the indices both PDO and ENSO had positive values this winter. This is similar to the case in 1987, 1993, 1994, 1995, 1998, 2003, 2004,and 2005 all negative balance years. The rule for the model is that if PDO and ENSO are positive glacier mass balance will be negative. Both of the indices reflect sea surface temperature in the Pacific, and positive values favor warmer SST’s near the west coast. Lastly we have the temperature forecast from NOAA for spring which for the area shows a high degree of confidence for above normal temperatures from April-June. All of the above indicate glacier mass balance will be negative in the North Cascades this year even though the galciers are deeply buried in snow right now.

Mass Balance of the Easton Glacier 2009

Immediately below is Easton Glacier on Mt. Baker in the North Cascades in late May 2009. The glacier is still completely snow covered. The bench where the small gray cloud shadows are at 6000 feet averages 20 feet of snow remaining.
easton 5-20-09 (1)Easton Glacier extends from the terminus at 5600 feet to the slopes near Sherman Crater at 9000 feet. Each summer since 1990 NCGCP has measured the mass balance of this glacier. View Youtube for a pictorial review of the full 2009 field season . The glacier has retreated 300 m since 1990. During this same period the glacier has lost a cumulative mean of 13 m of thickness. Given a thickness in 1990 between 60 and 75 m, this is about 20 % of the total glacier volume. The image below shows the terminus in 2009(green=2009, 2006=brown, red=2003, purple=1993 and yellow=1984). Measuring mass balance requires assessing snowpack depth and areal extent at the end of the summer melt season and the amount of melting in areas where blue ice or firn (snow more than a year old) is exposed. Below is measuring crevasse stratigraphy and below that emplacing a stake to measure ablation with weather instruments on it. f25f18

Mass Balance = residual snow accumulation – ice-firn melting.

The melt season began a bit late just when the May picture was taken Winter snowpack was between 75and 90% of normal in the area as of April 1. The melt season had been late to begin and snowpack by late May was near normal. Record heat was experienced at the end of May and the start of June, quickly causing snowpack to fall below normal.Each year we measure the snow depth via probing and crevasse stratigraphy at more than 200 locations. These depth measurements allow the completion of a map of snow distribution. This map is completed in early August and updated, based on a smaller number of observation in late September. The amount of melting is assessed from stakes emplaced in the glacier and the recession of the snowline in areas where snow pack depth has been assessed. below are images from early and then mid-August indicating the rise of the snowline. DSC02239easton8-16-09
A warm June and July caused exceptional snow pack melt and by early August when we began assessing snow pack depth retained, the snowcover had receded to the 6400 foot level, 300-400 feet higher than normal. Snowpack remained below normal all the way to the 8600 foot level. the snowpack since early July had been rising nearly 100 feet per week. By mid-August at right the snow line on the glacier averaged 6800 feet. By mid and Late September the snowline had risen to 7400 feet a rate of rise of 150 feet per week since mid-August. Below is an image from mid-September 2009. The amount of melting on the glacier in July was the highest we have measured totaling, 2.1 m. This led to the exposure of a couple of new bedrock knobs evident in the picture at right near the 2100 meters, black arrows. Overall the mass balance of the glacier in 2009 was a negative 2.06 m. This glacier averages 55-70 m in thickness and this mass balance loss represents a 3% volume loss in a single year for the glacier.