Climate Conditions Summary
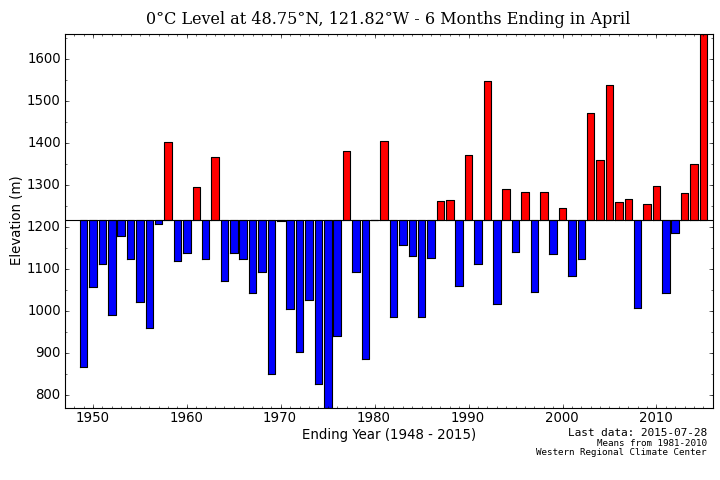
The winter season of 2023/24 yielded a low snowpack across the North Cascades. Snowpack at six longer Snotel stations was 0.63 m w.e on April 1, vs. a 1984-2024 average of 1.02 m. This was the third lowest snowpack of this period, with 2005 and 2015 being lower. The melt season in May and June was cool, helping extend the low snowpack at elevations above 1500 m. July rivaled 2015 for the warmest of the last 50 years, quickly melting back the snowpack by the start of August. The end of the melt season was fairly typical with several new snowfalls and periods of heat. The main melt season for the glaciers is June-September and this year the average temperature was 18.3 C, which is 1.3 C above the long term mean. This was the fourth year in a row above 18 C and thus the fourth consecutive year of large glacier mass balance losses. The cumulative impact is glacier recession, thinning, loss of a number of glacier and overall steeper/dirtier ice. We conducted detailed field work on eight glaciers.
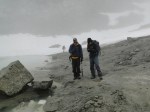
Glacier Mass Balance
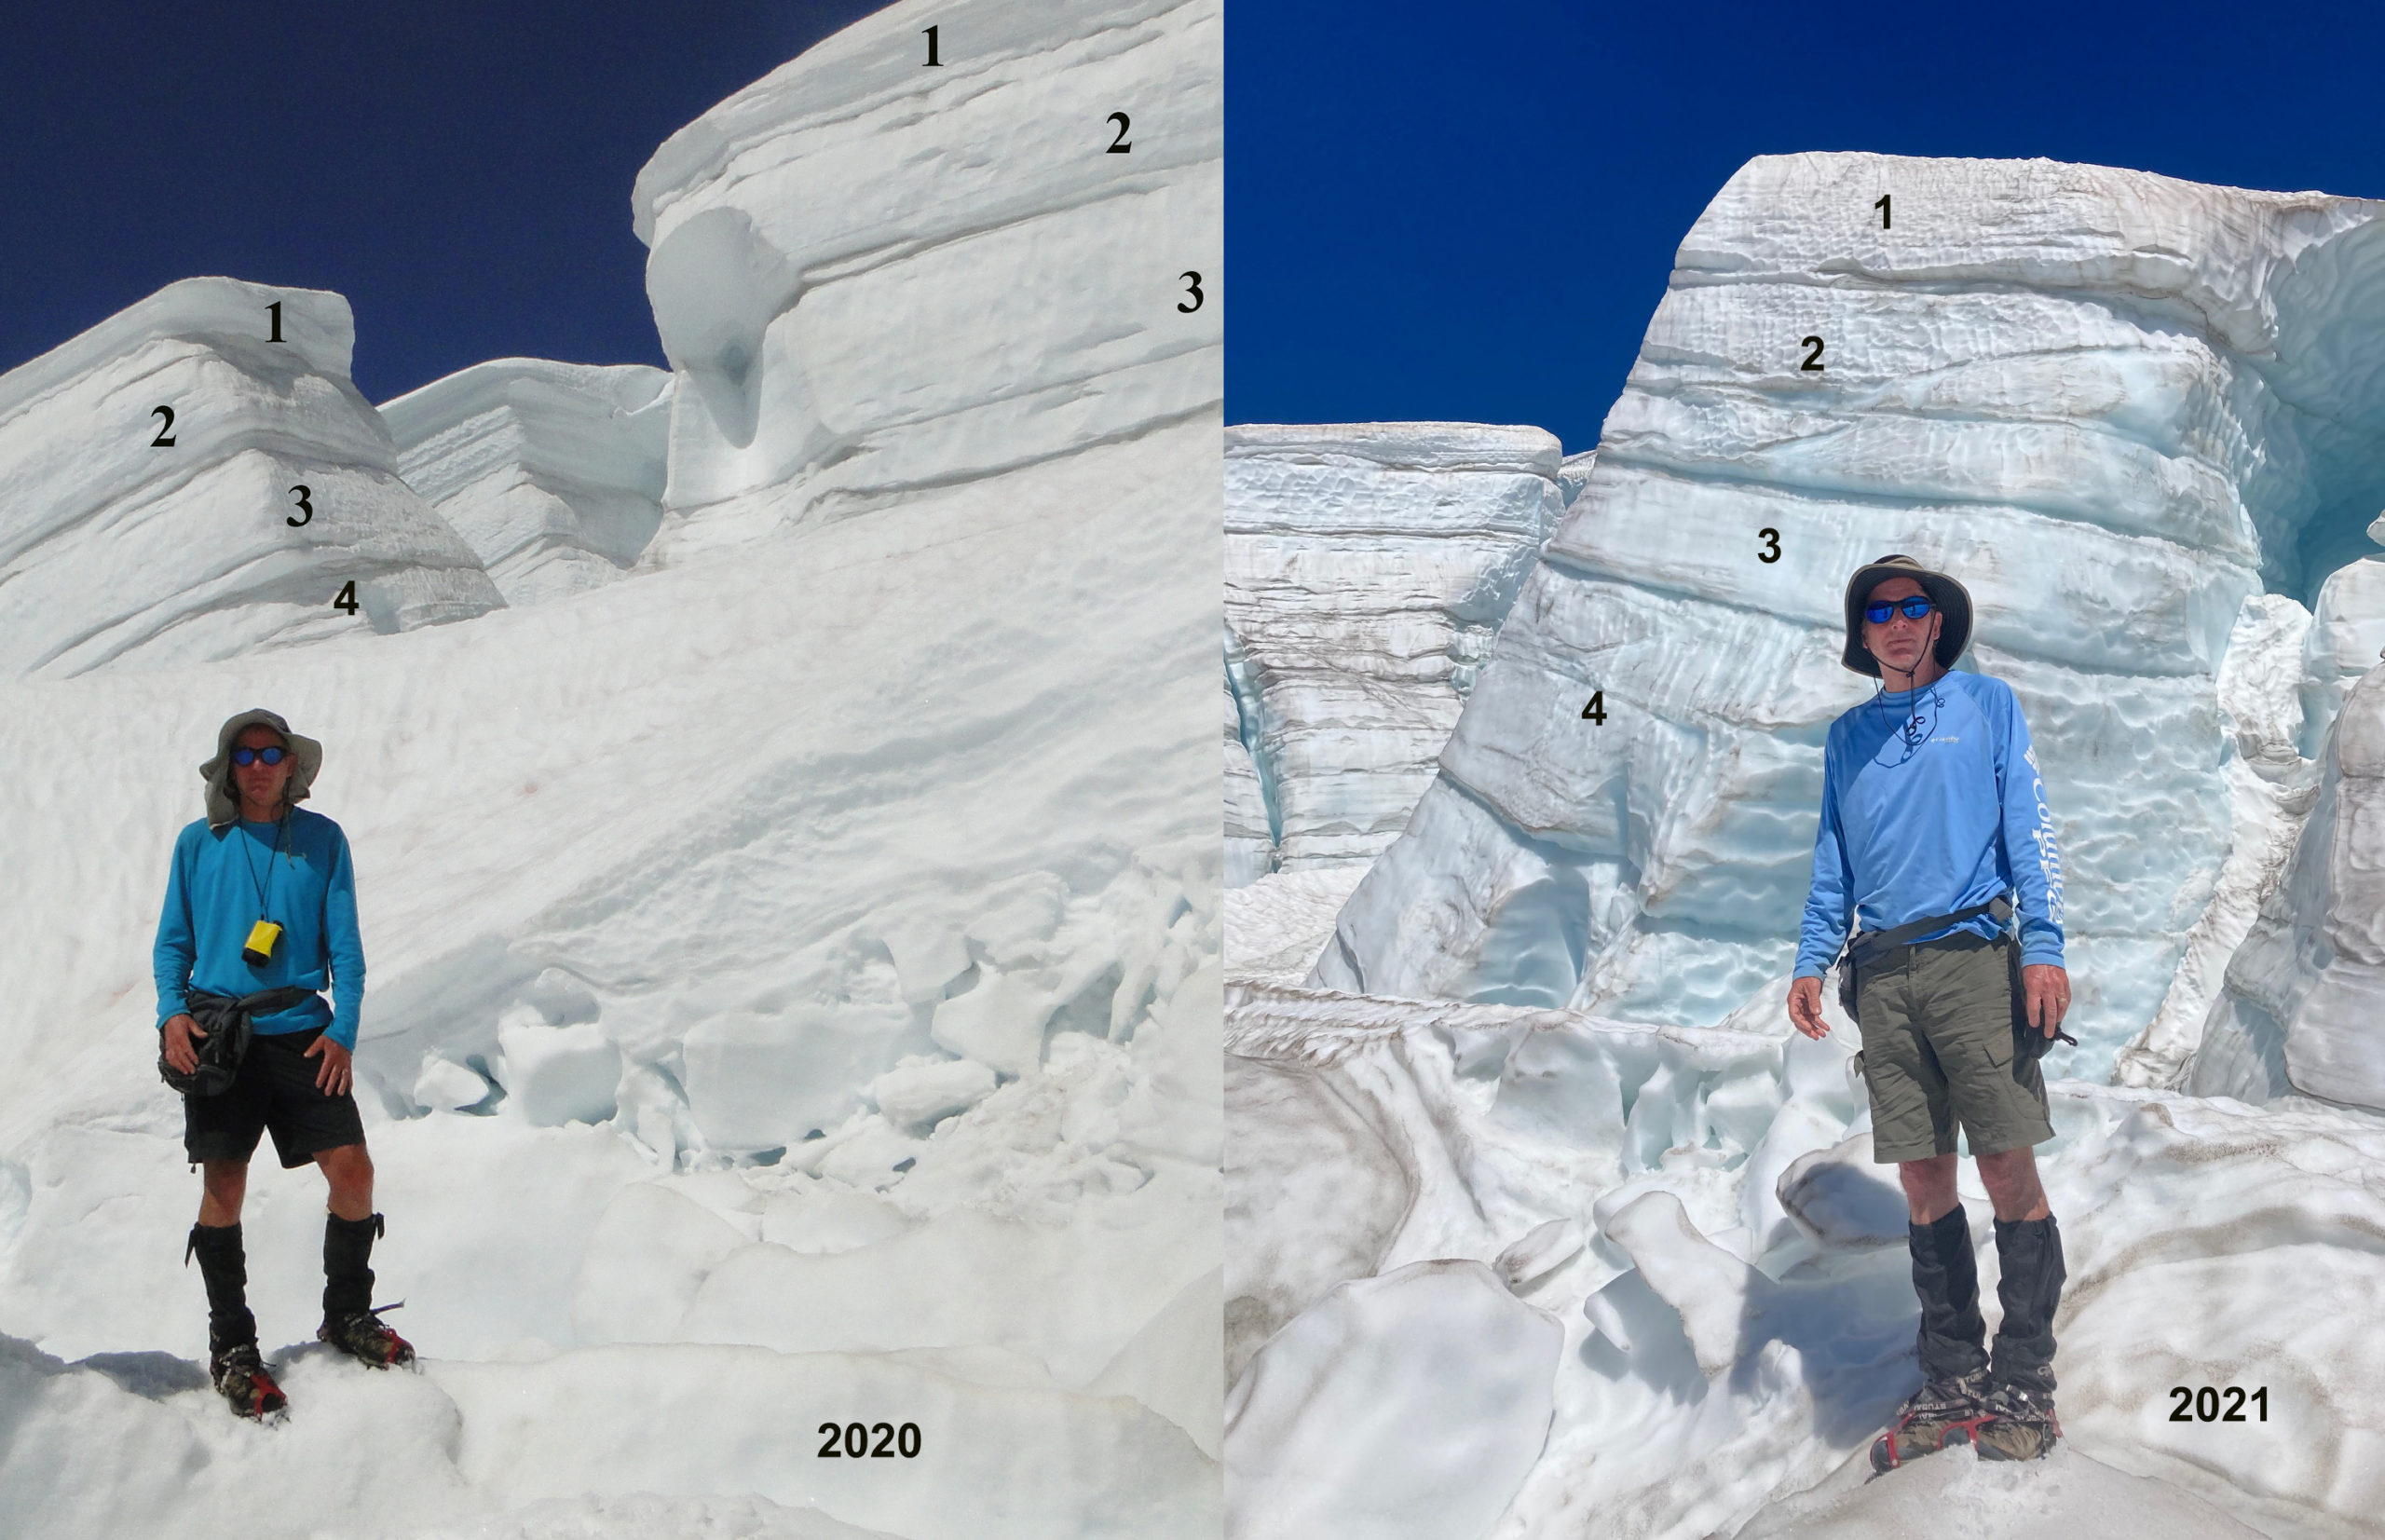
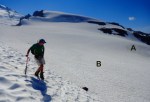
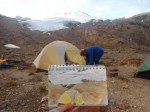
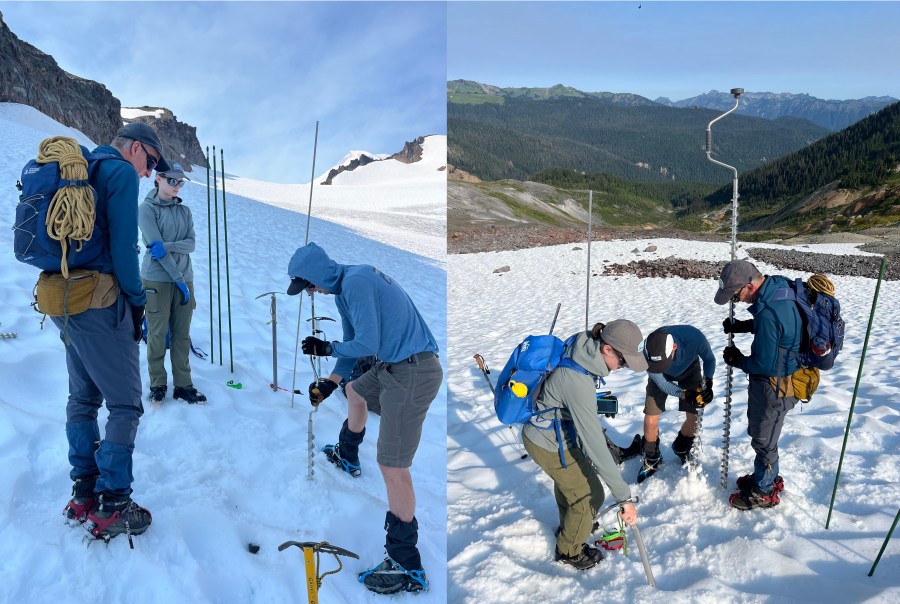
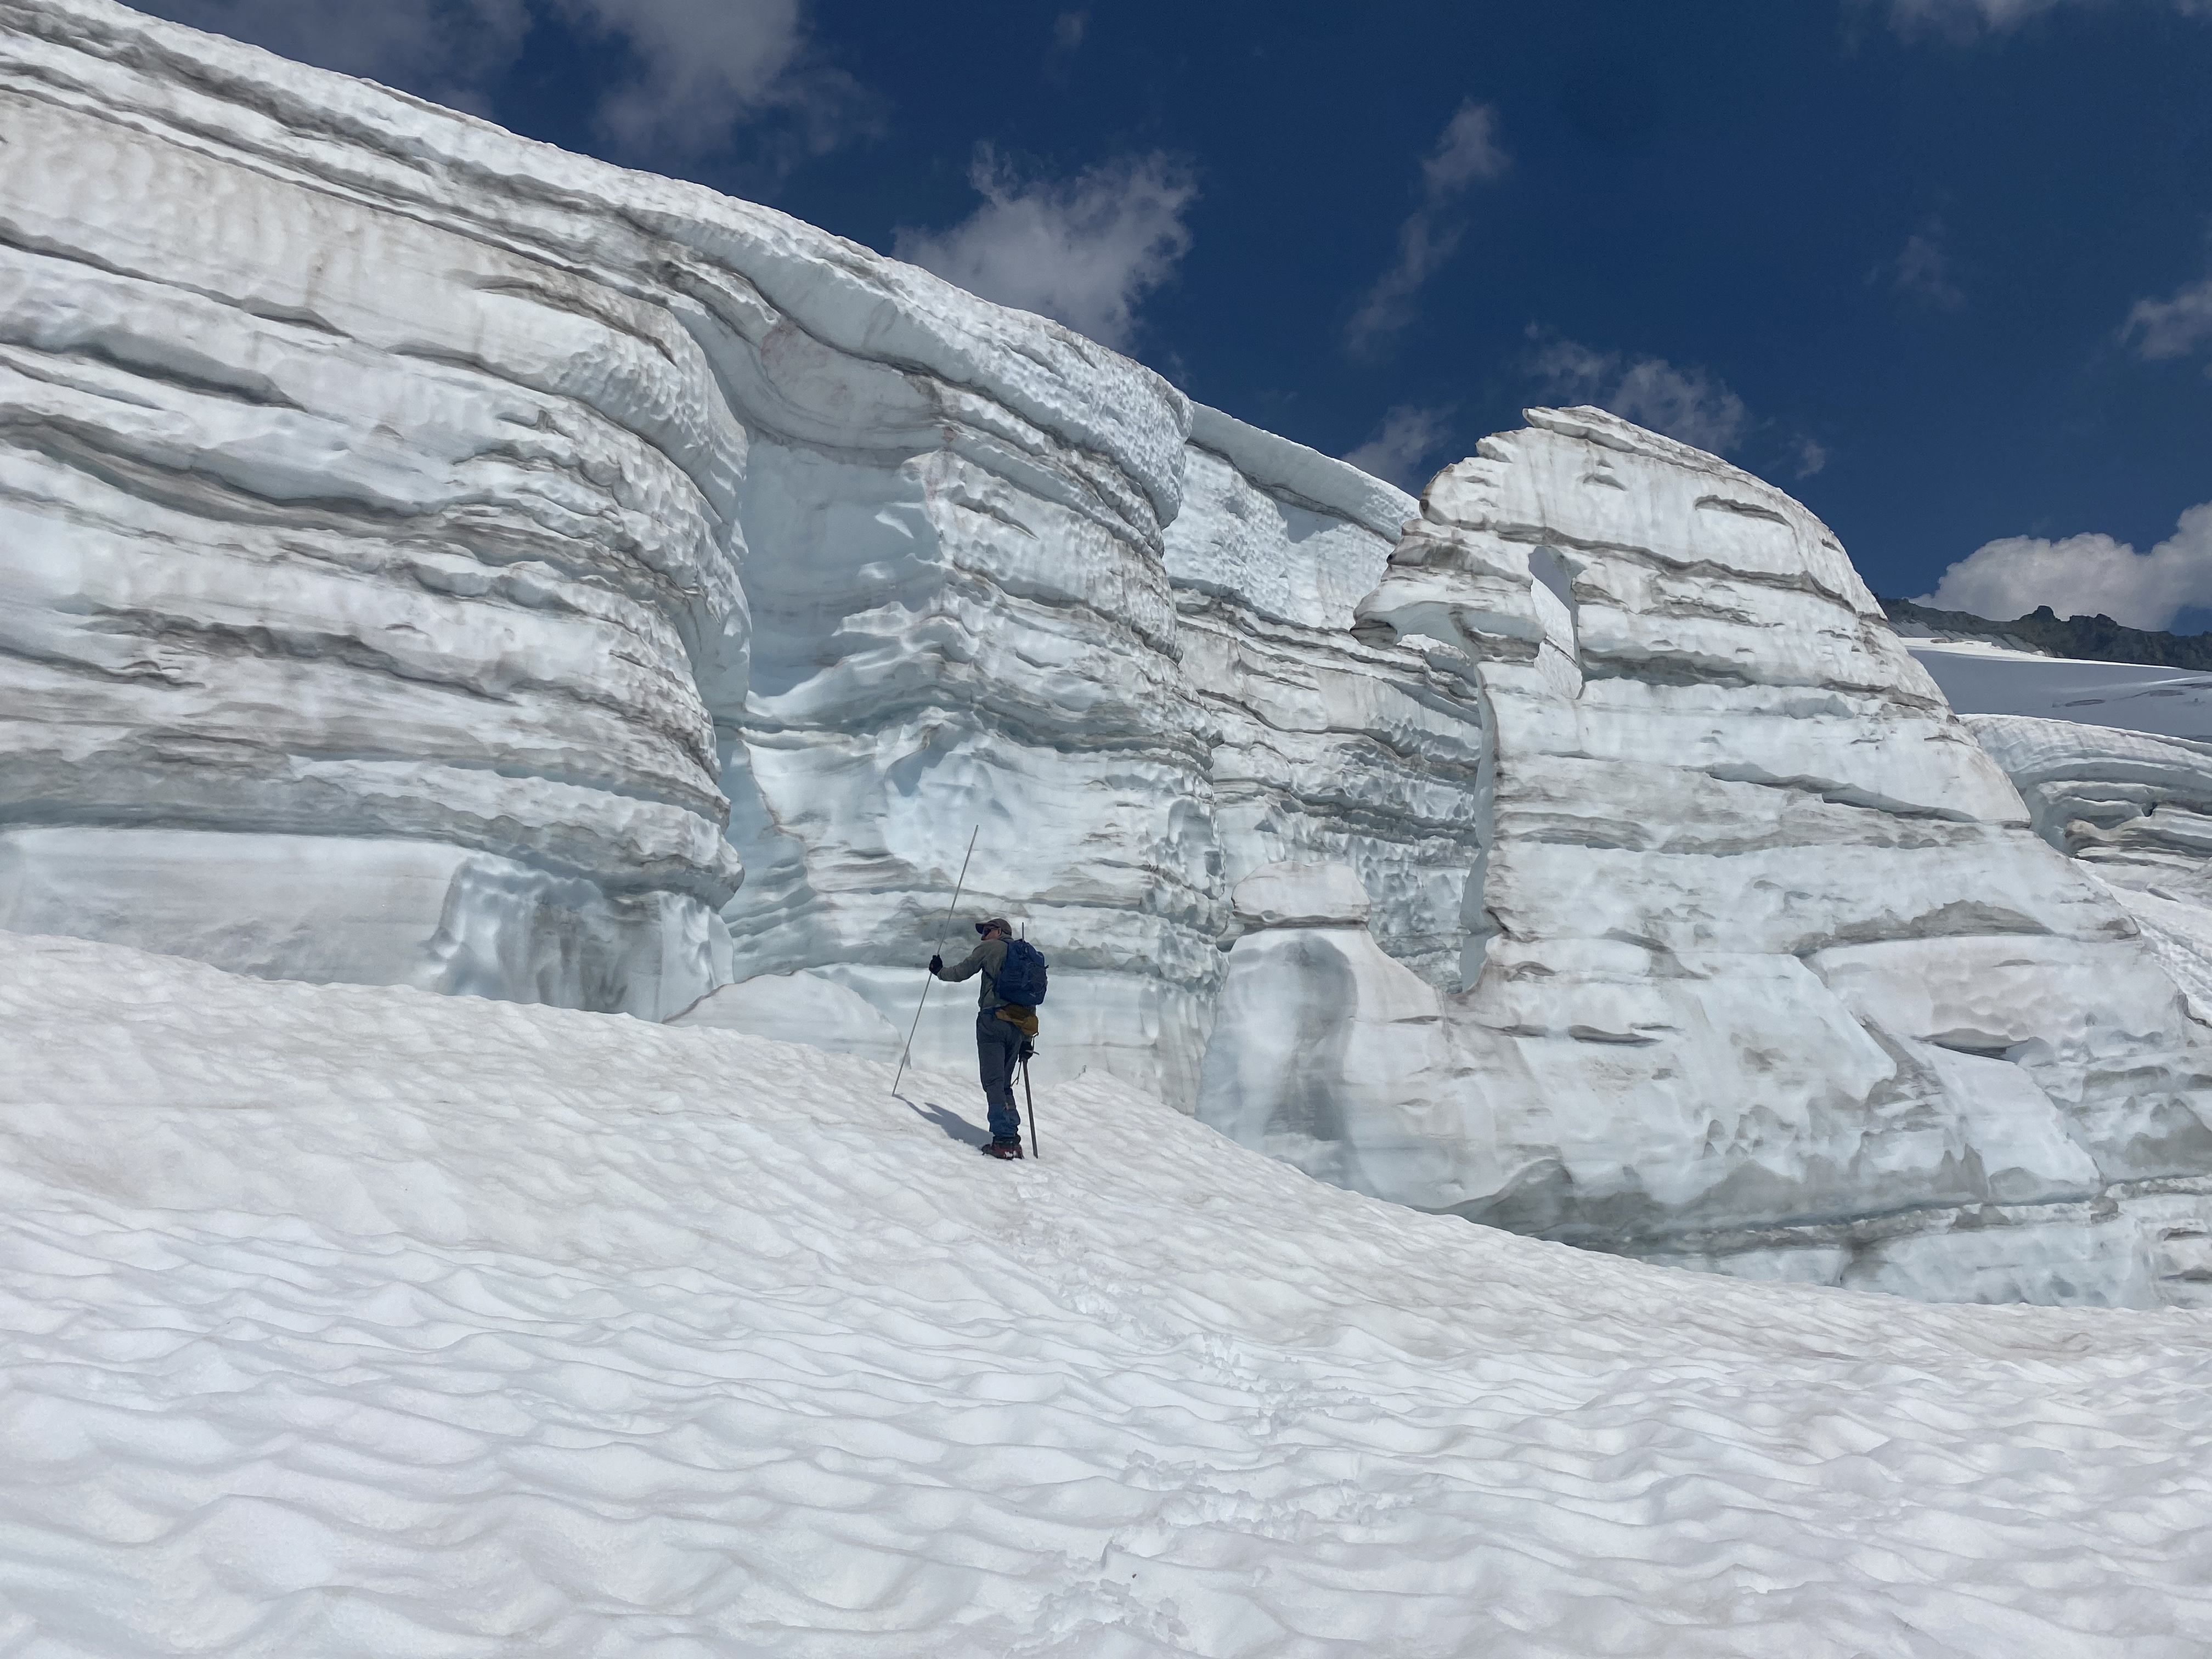
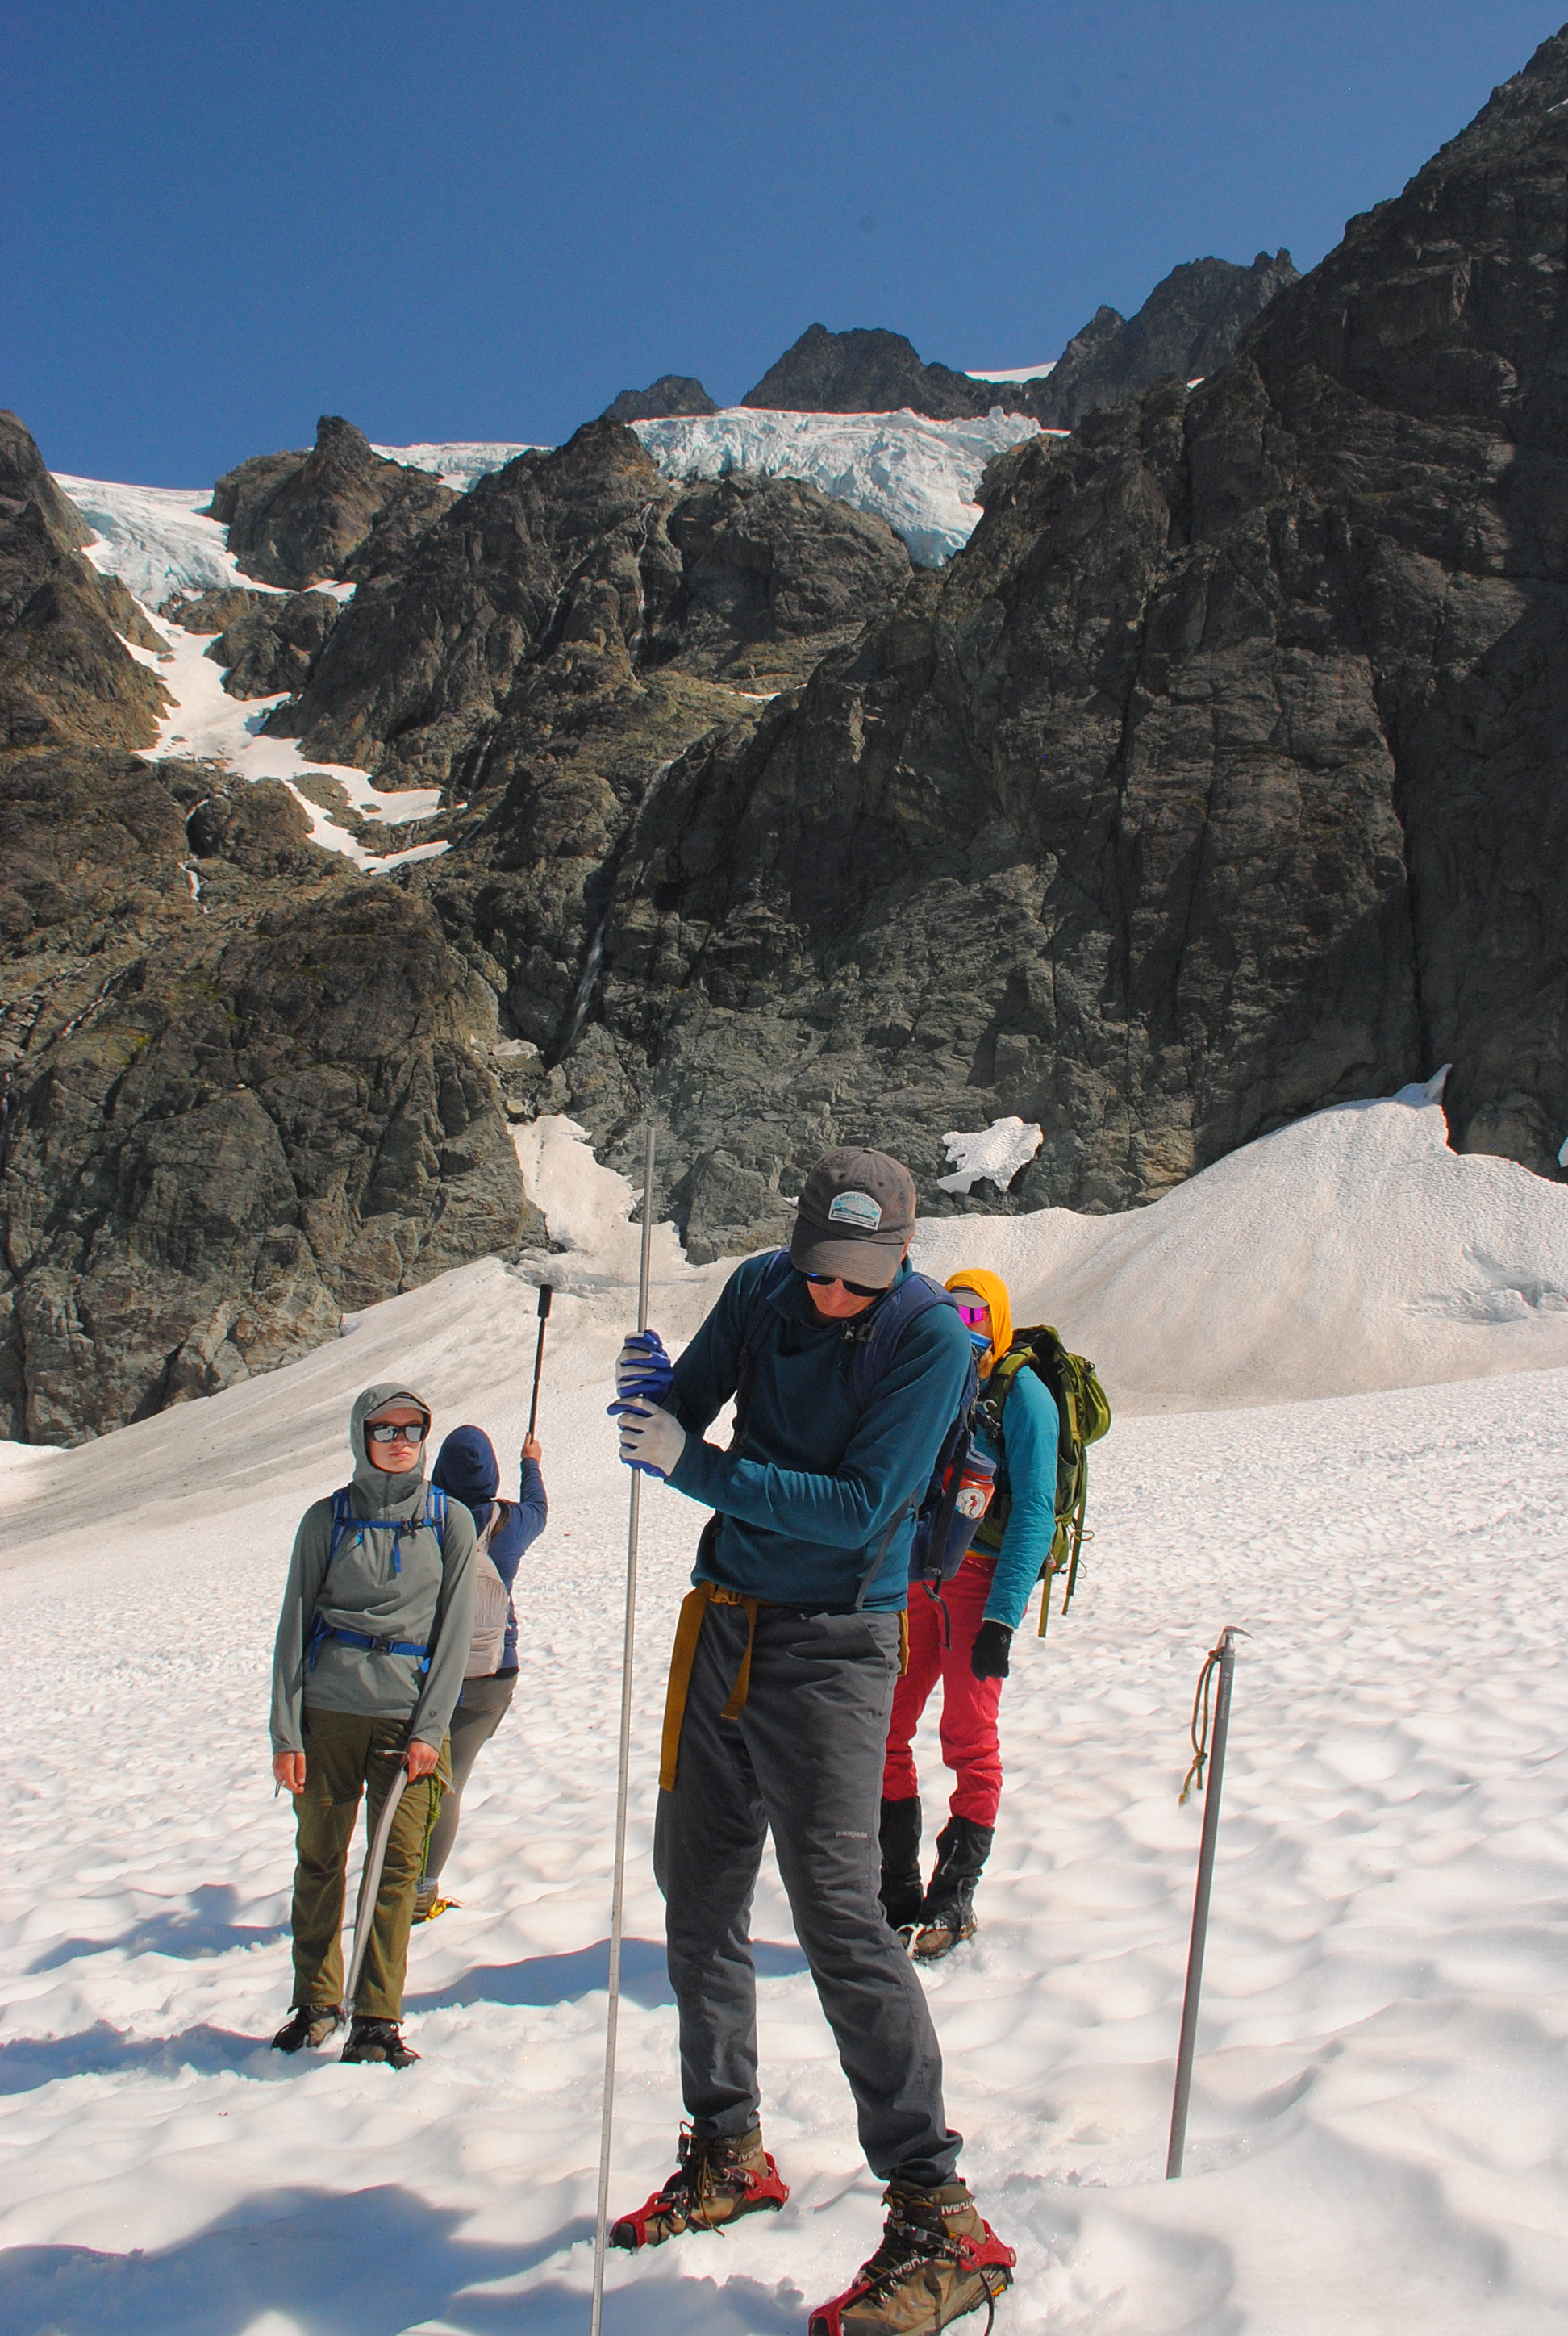
Annual mass balance is the difference between the mass of snow and ice accumulation on the glacier and the ablation of snow and ice on the glacier during a year. The data is reported in the average change across the glacier in water equivalent thickness. In 2024 we again utilized probing snow depth with a 12 foot long segmented steel probe (520 measurements), annual layer thickness measurement in vertically walled crevasses (140 measurements), and mapping snow line position in the field. To assess ablation we used snow line migration in satellite imagery and ablation stakes drilled into the glacier. The mass balance at the snowline is 0 m w.e., and as it transects areas of known snow depth that identifies ablation rate.


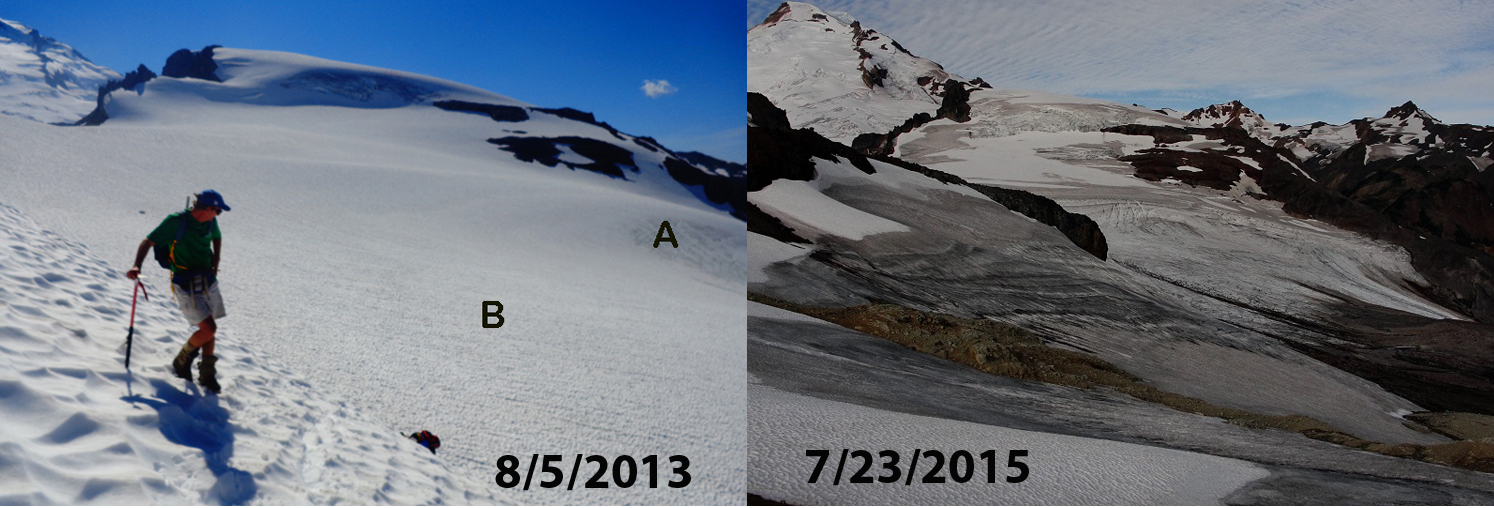
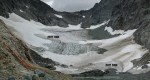
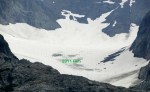
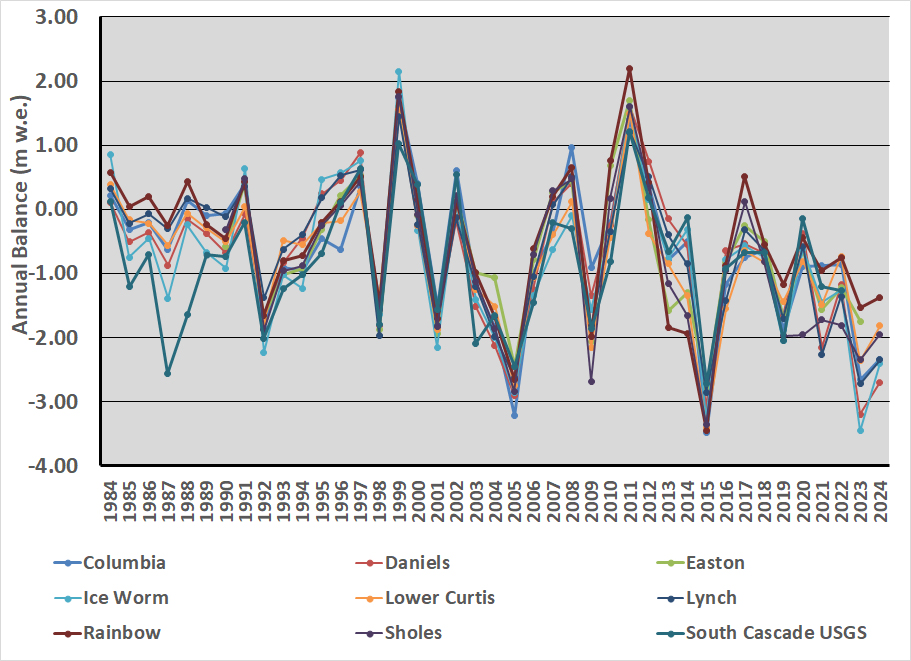
All eight glaciers had a negative balance exceeding 1.3 m w.e., with an average of -2.09 m w.e., this is equivalent to at ~2.25 m of glacier thinning. The loss during the last four years is unprecedented with 8 m of average thickness lost from 2021-2024. This is greater than the entire decade of loss for 184-1993, 1994-2003 or 2004-2013. The acceleration of loss continues even as the glaciers lose their highest melting terminus regions. This is an indication that none of the glaciers are approaching equilibrium. The cumulative mean mass balance loss has been -28.89 m w.e., ~33 m in thickness. This represents the loss of ~40% of volume of the glaciers we have observed, 1% loss per year overall but over 2% per year in the last decade.

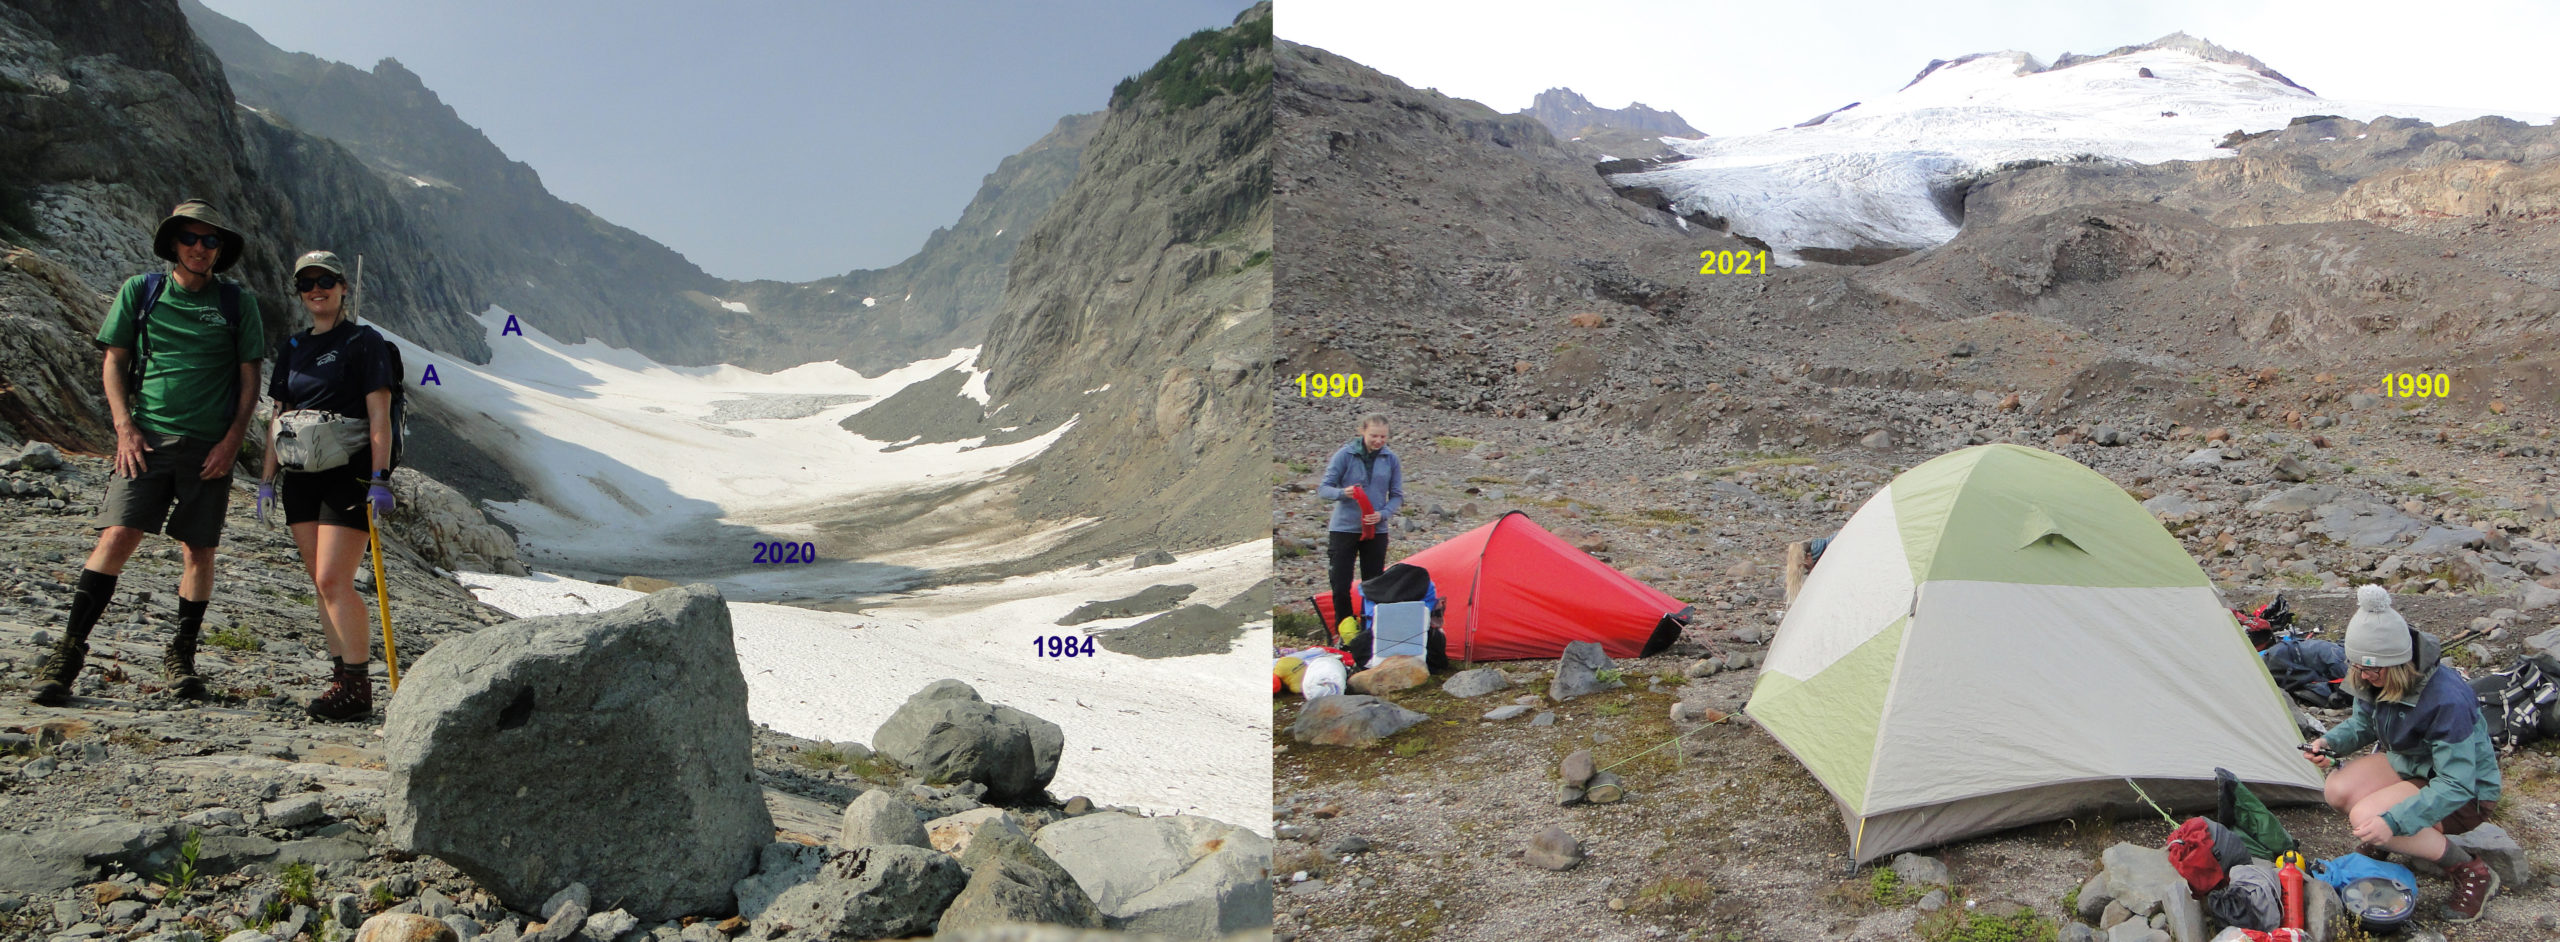
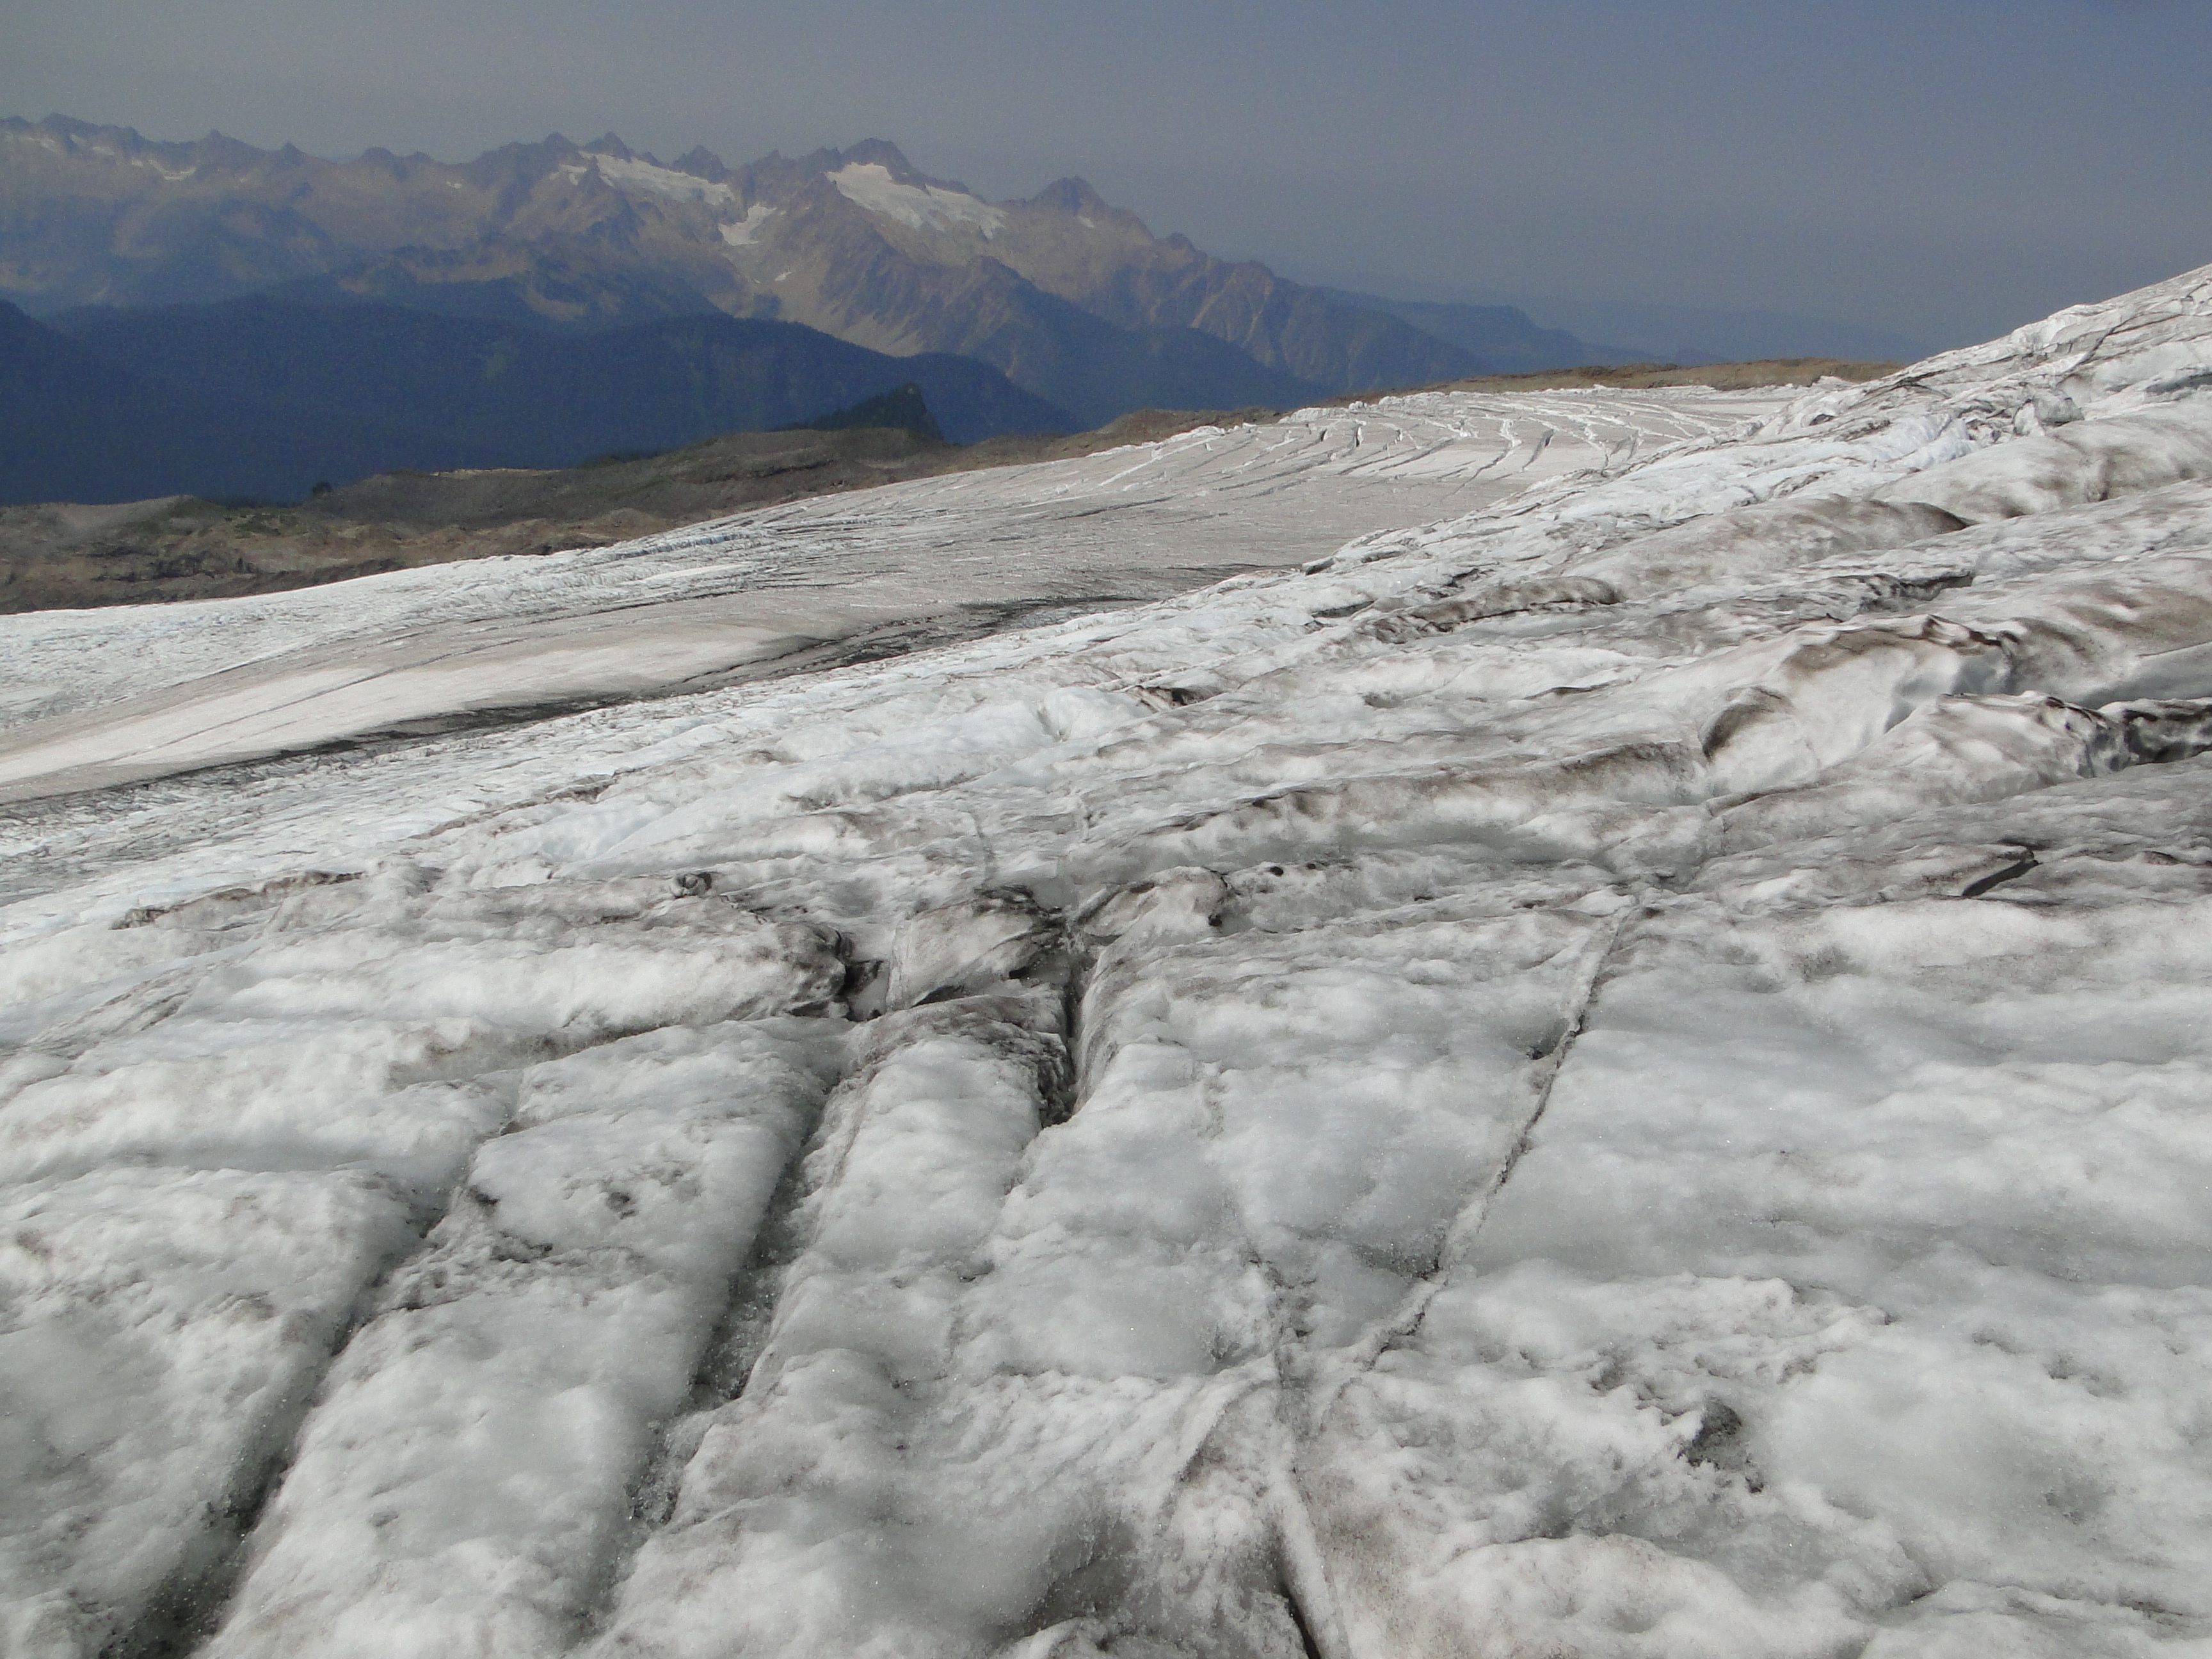
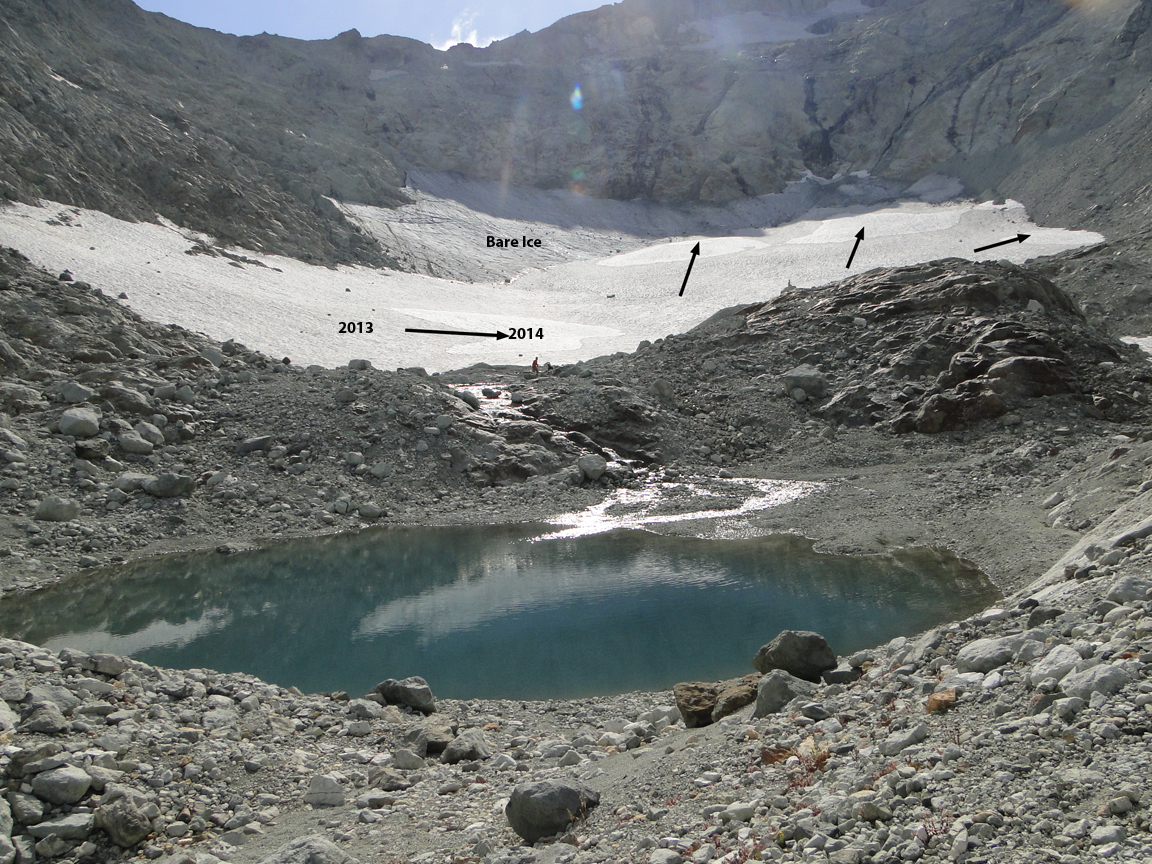
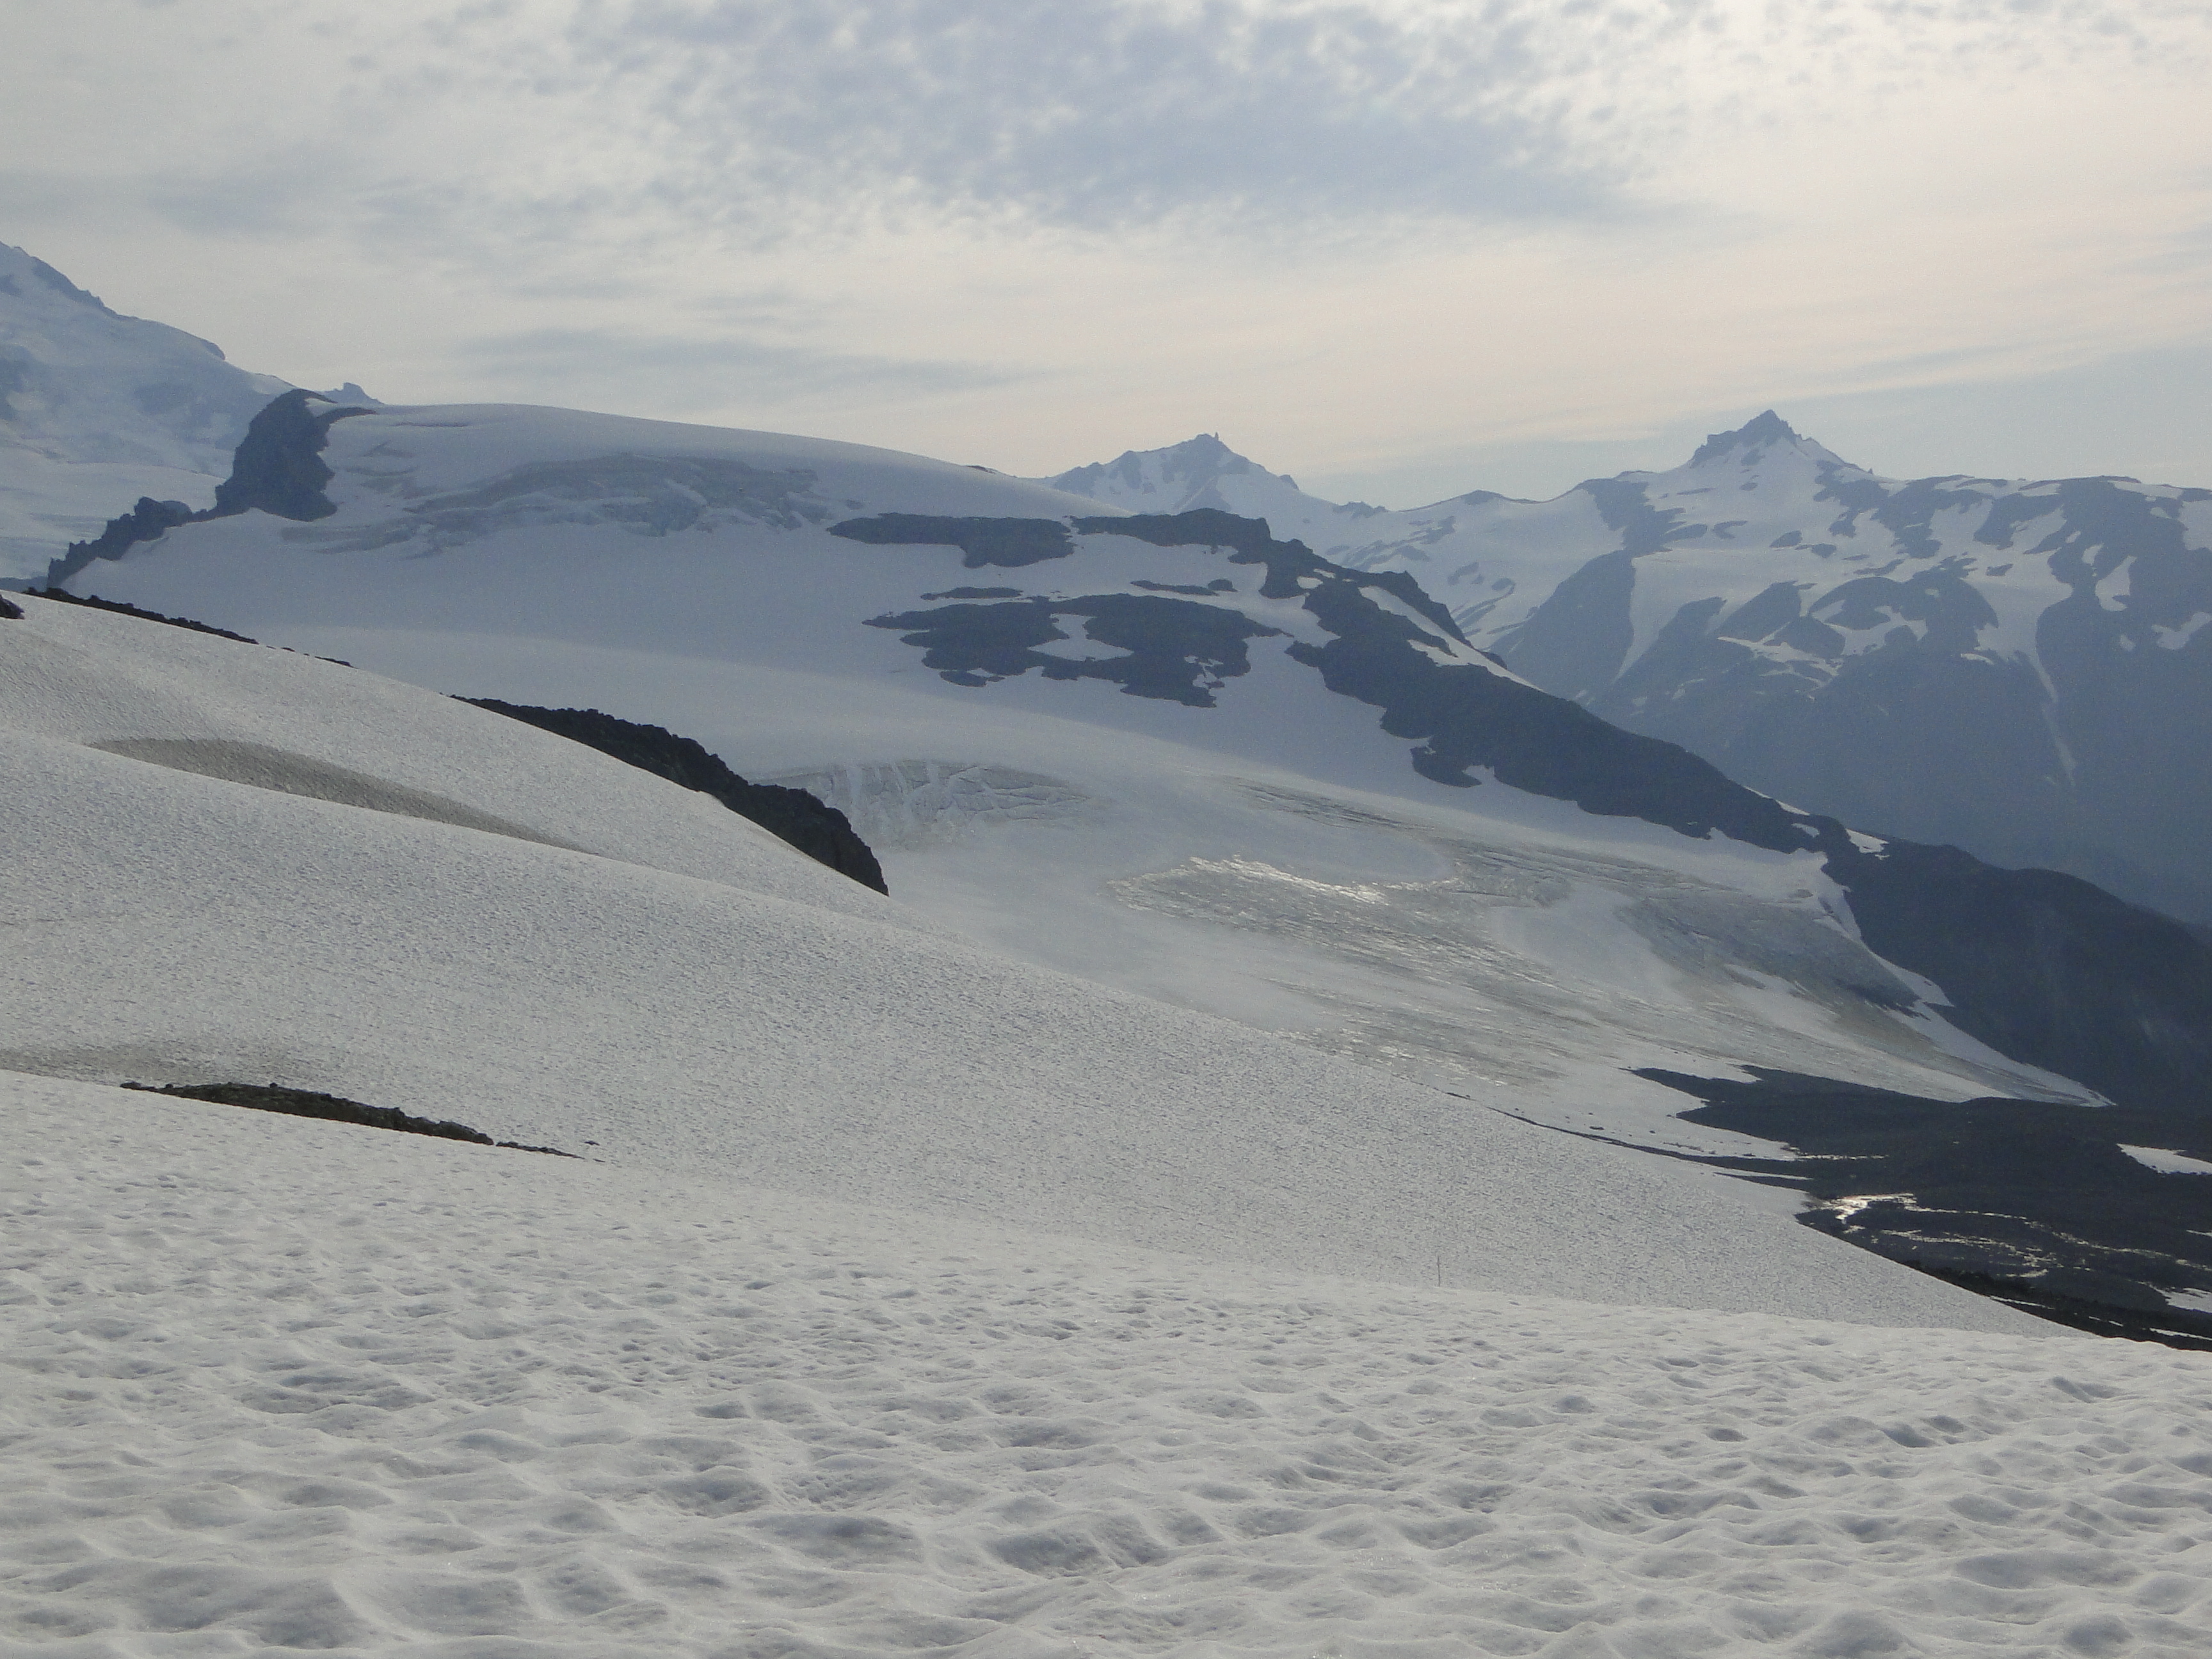
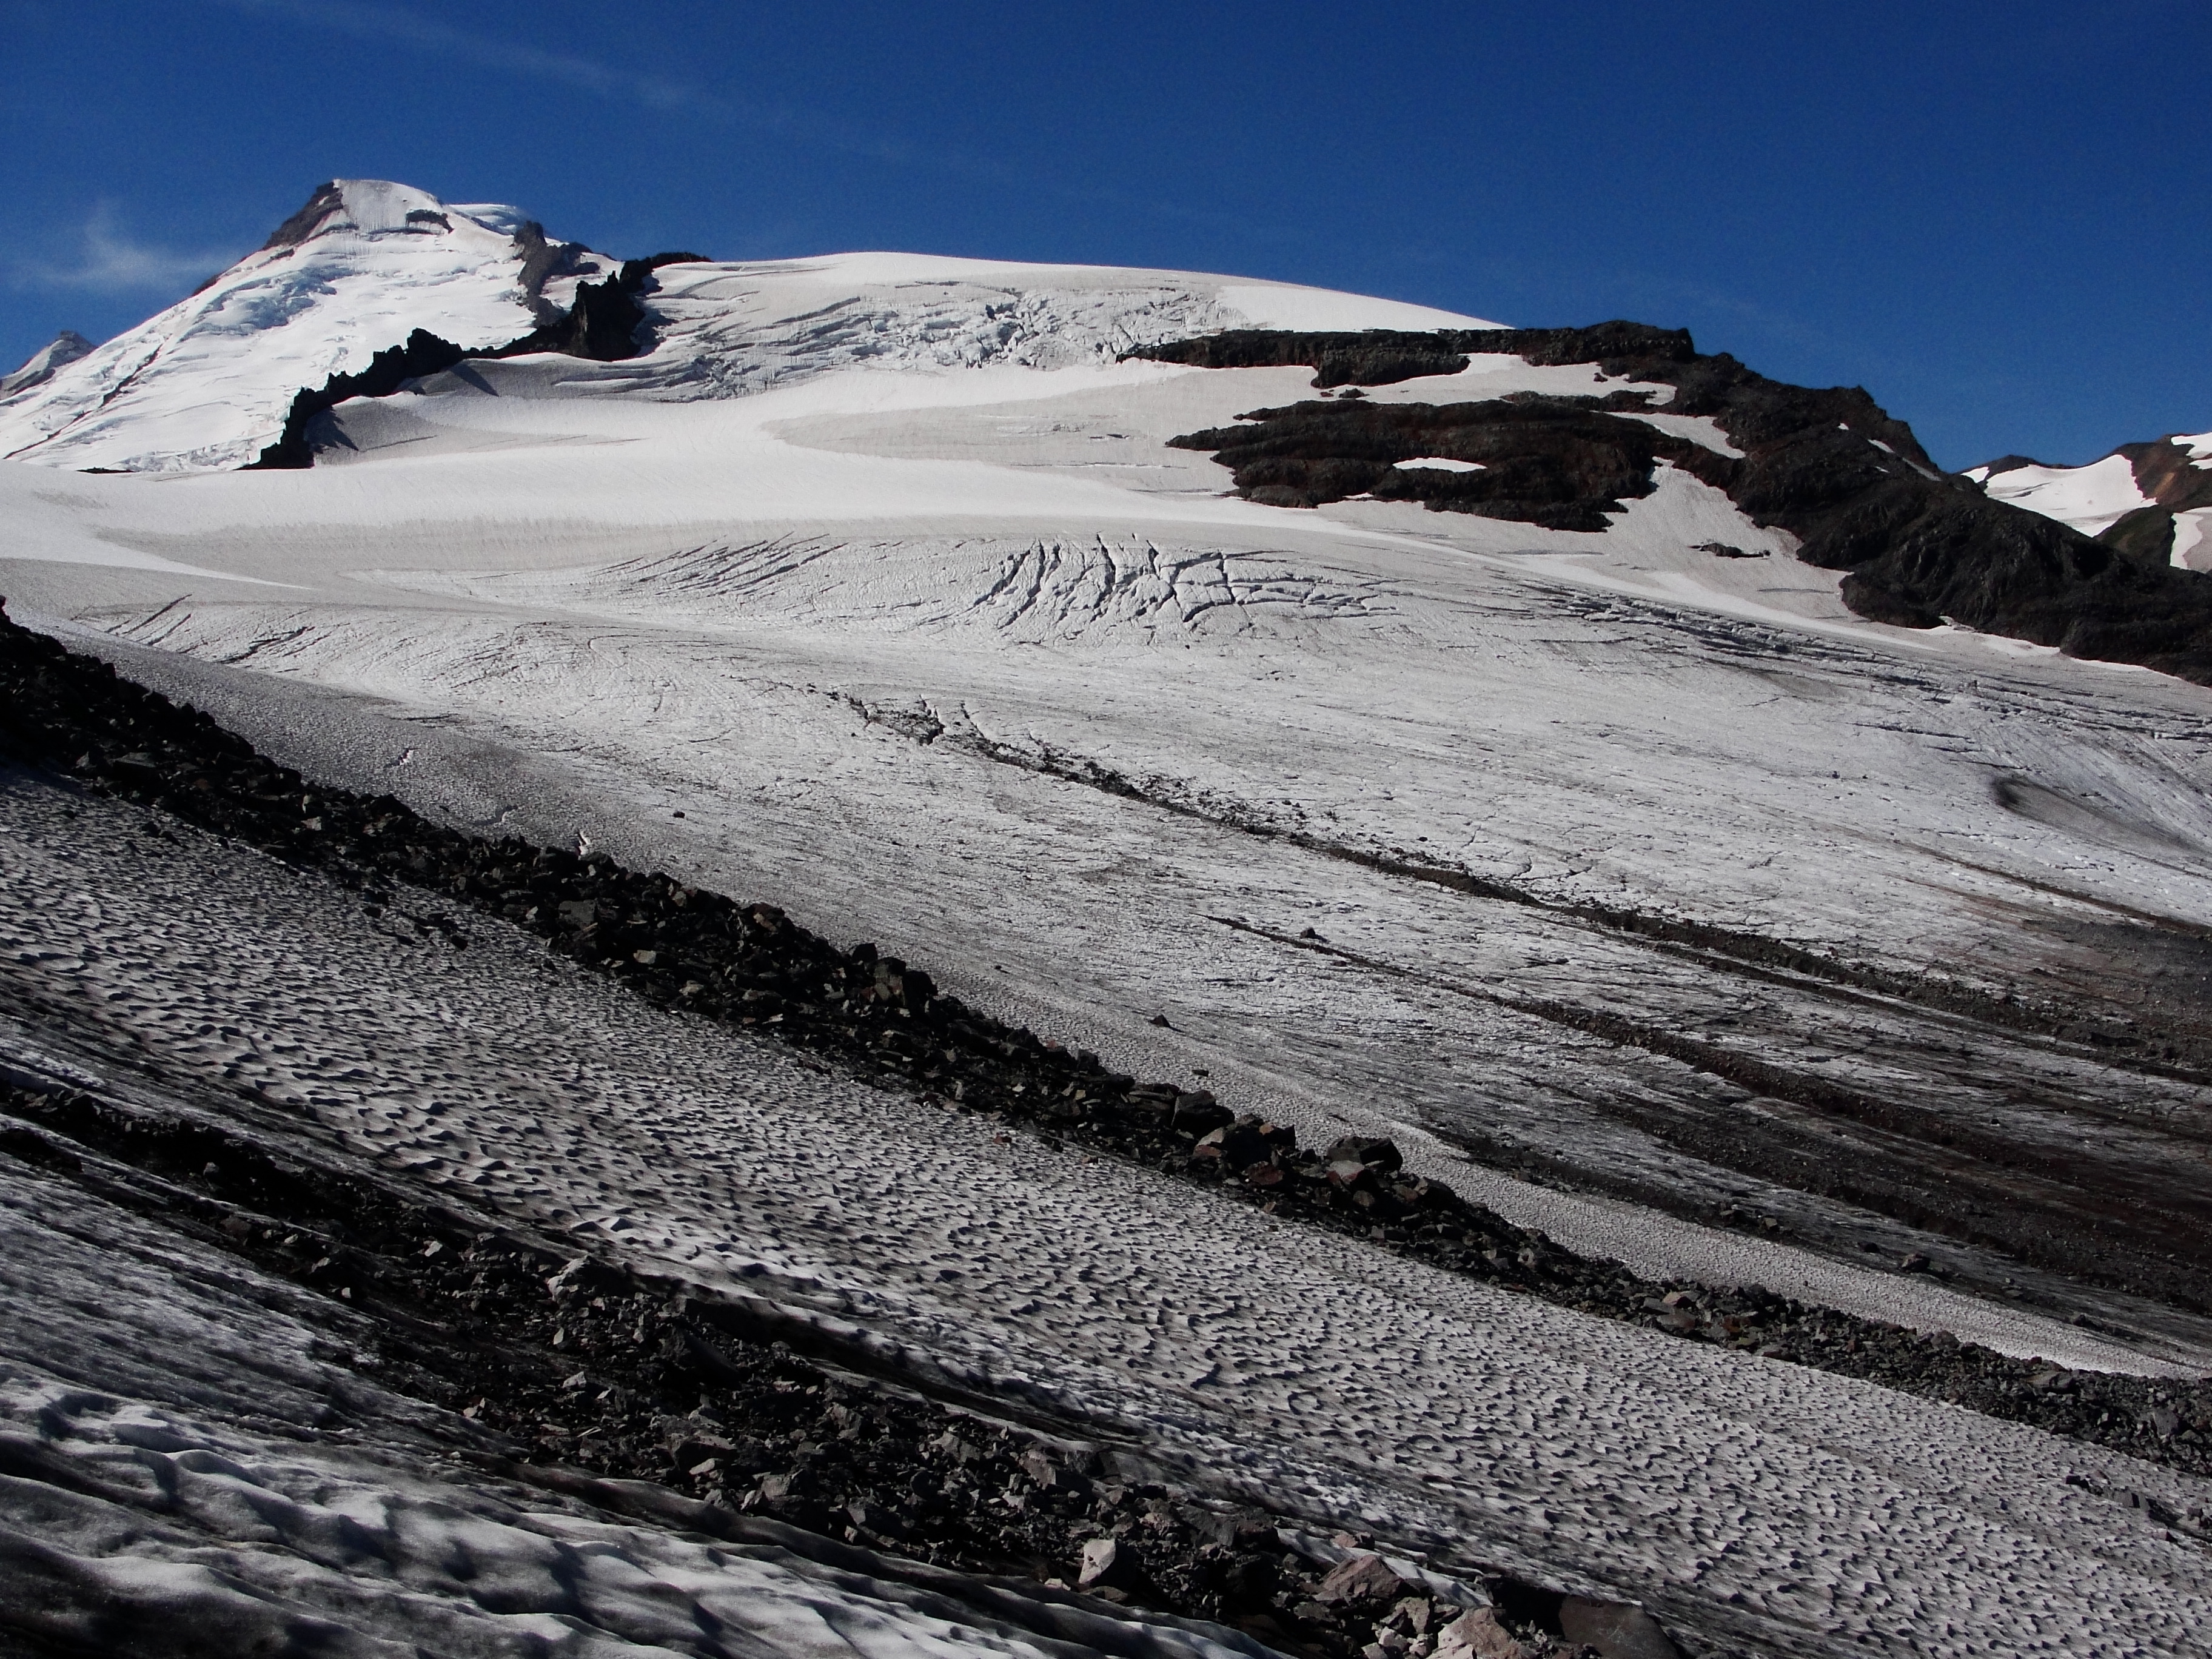
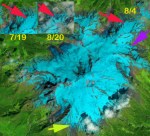
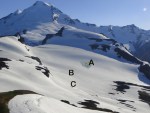
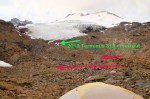
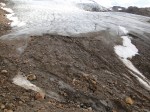
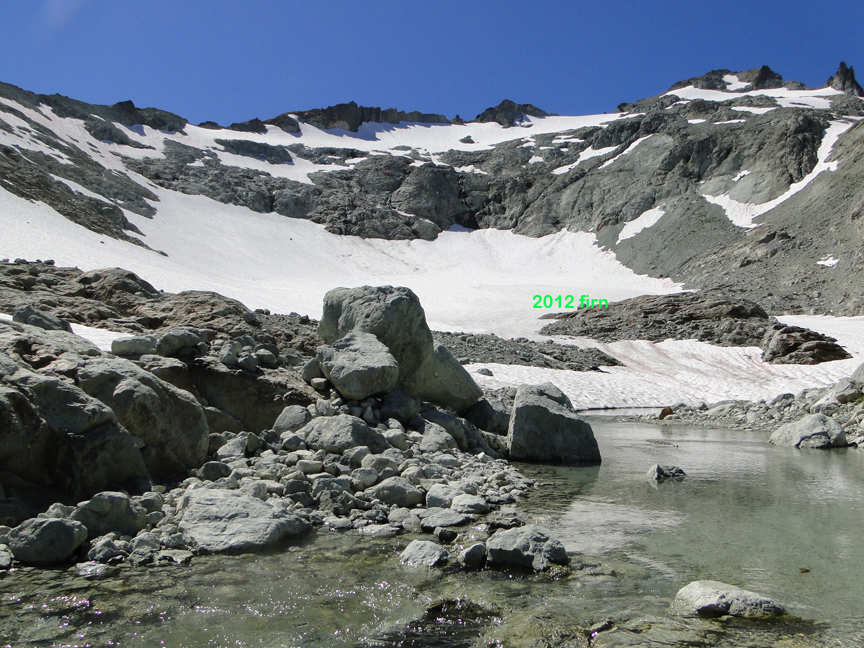
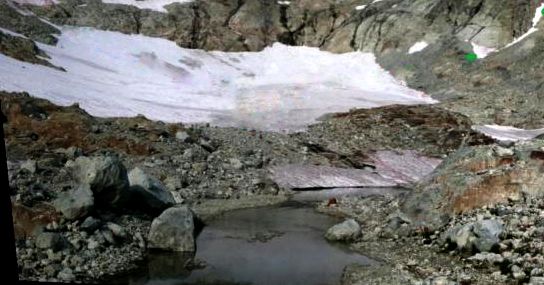
The deglaciated area exposed by the retreat over the last four decades is substantial and is most visible below Easton Glacier. The retreat of 620 m since 1990, has included a retreat of over 100 m in the last two years. The thinning of this glacier along with neighboring Squak and Deming have led to emergence of bedrock areas high on the glacier as well.


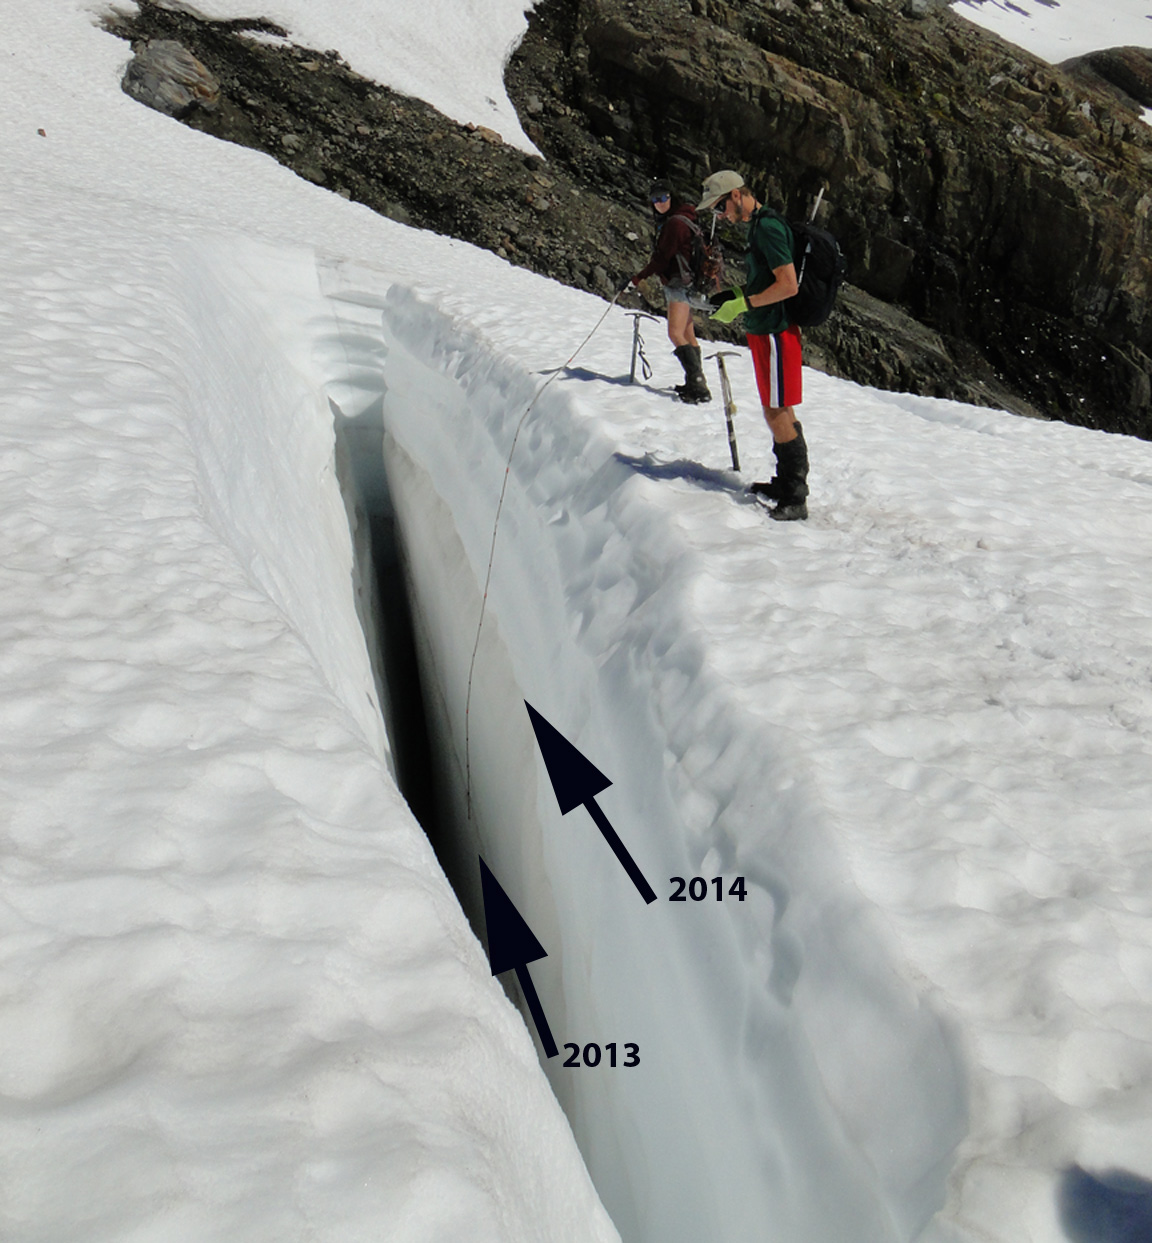
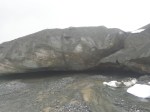
Glacier Crevasses
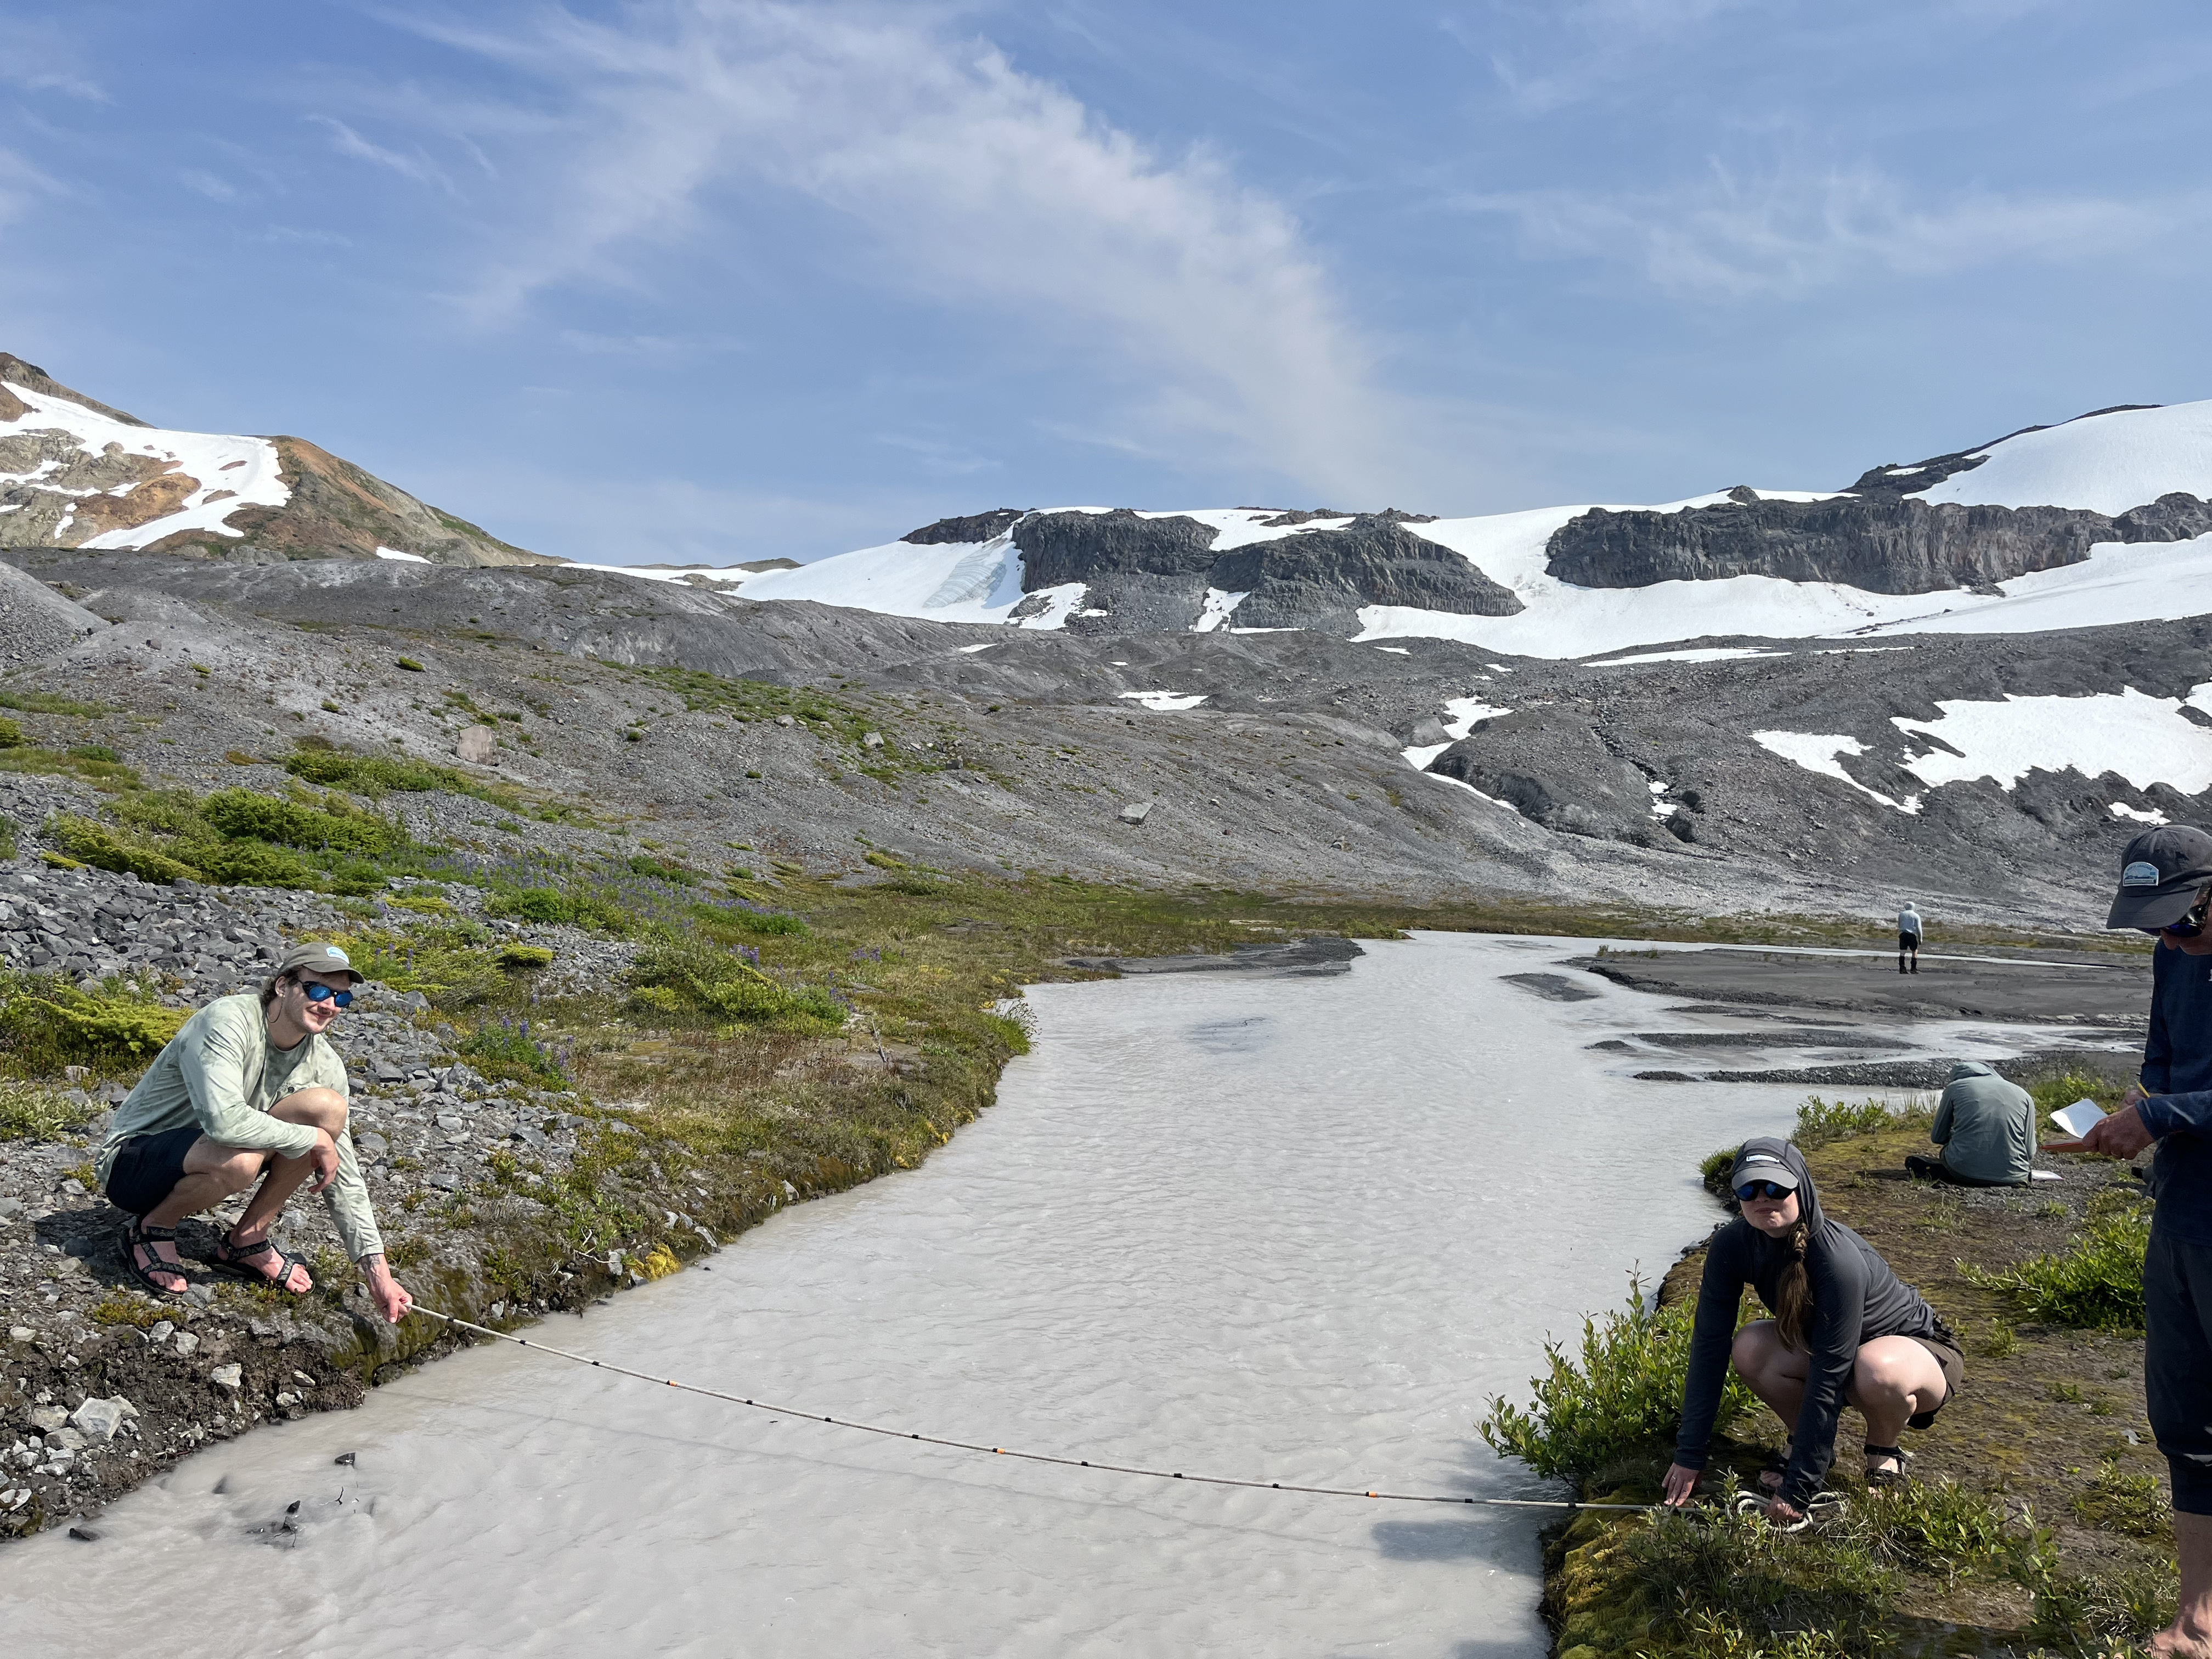
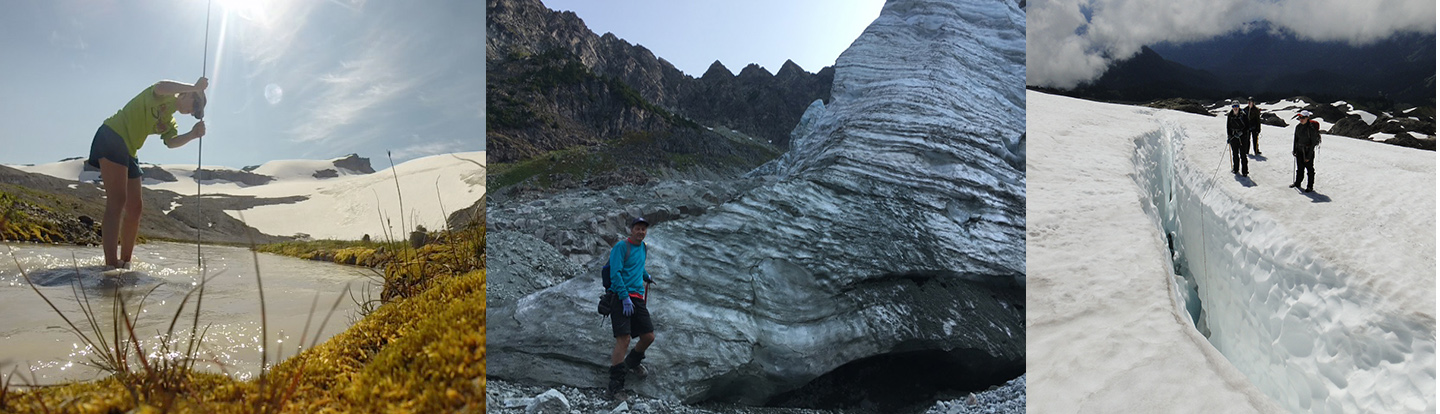
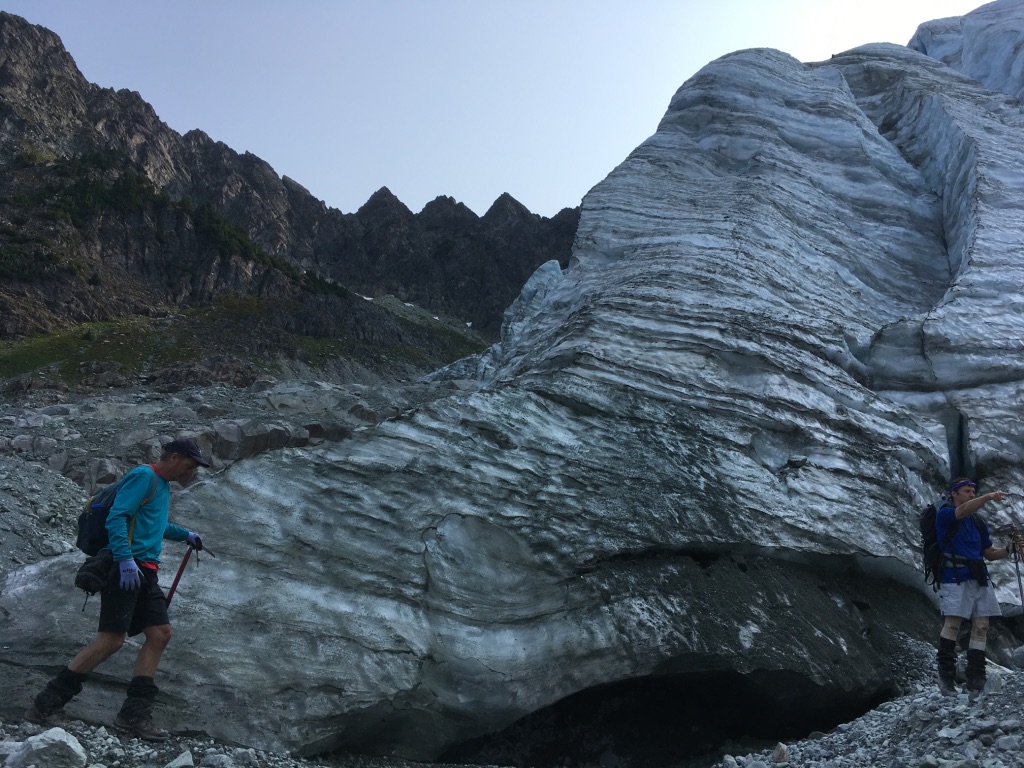
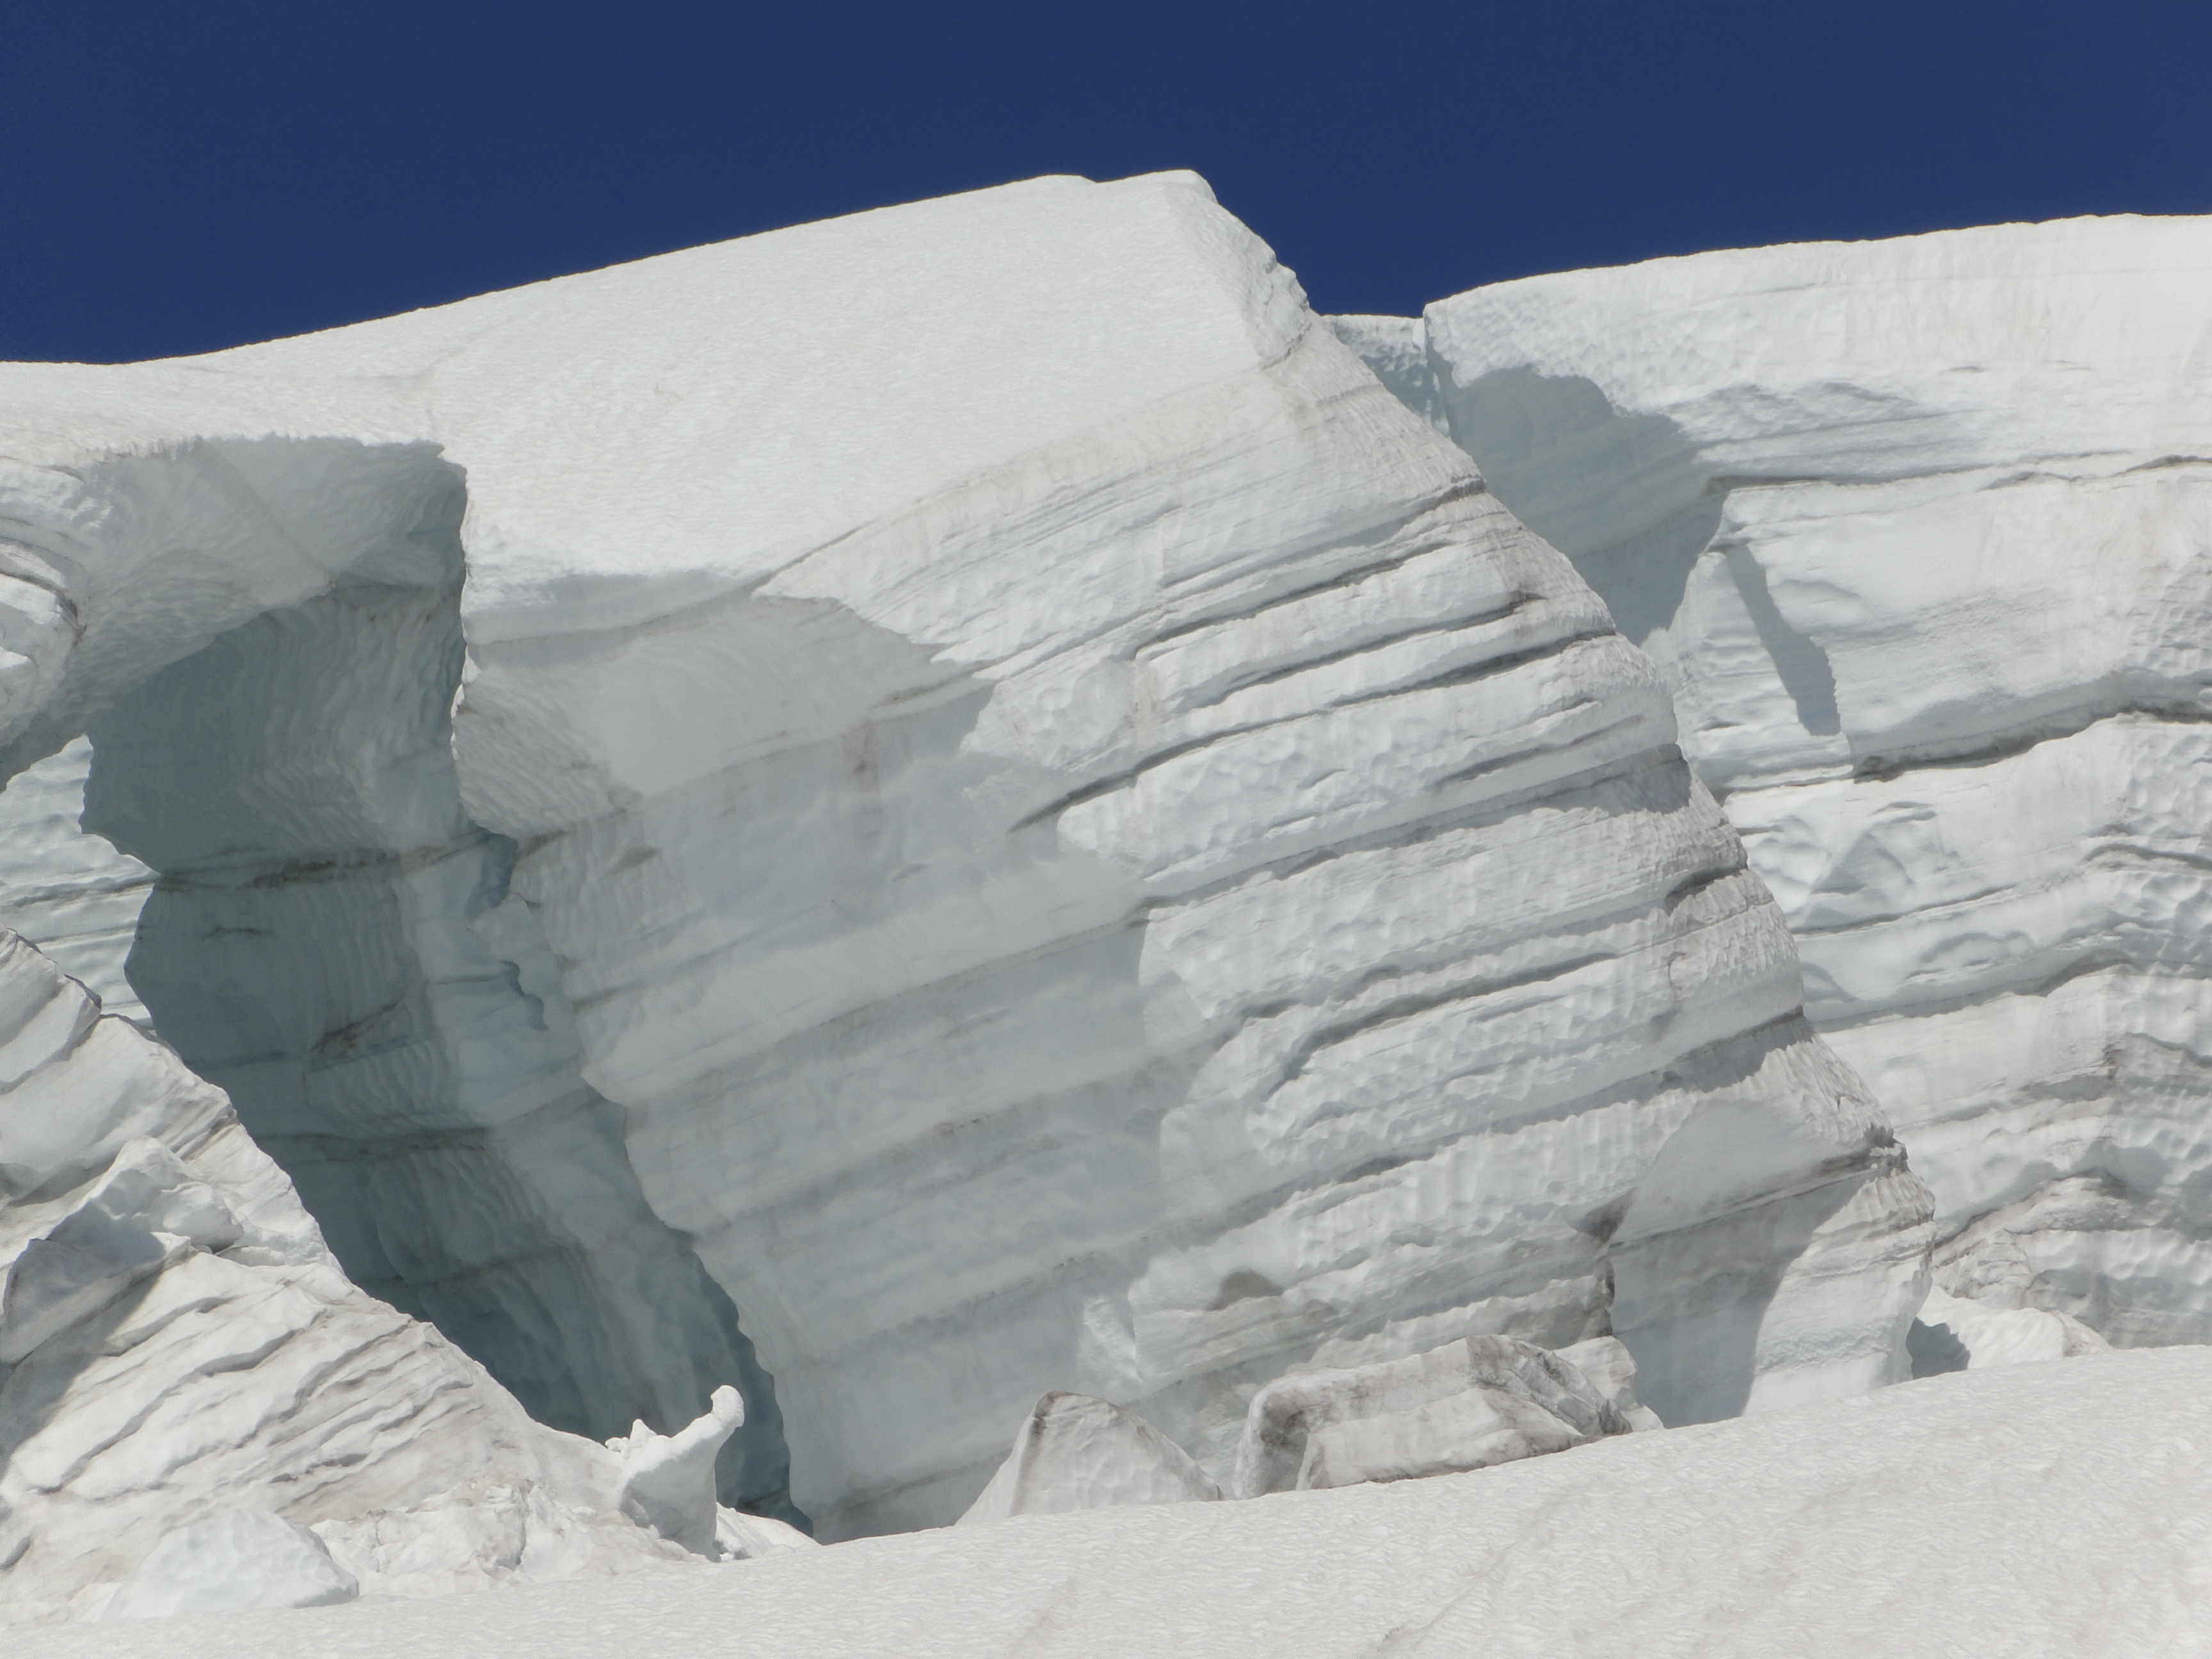
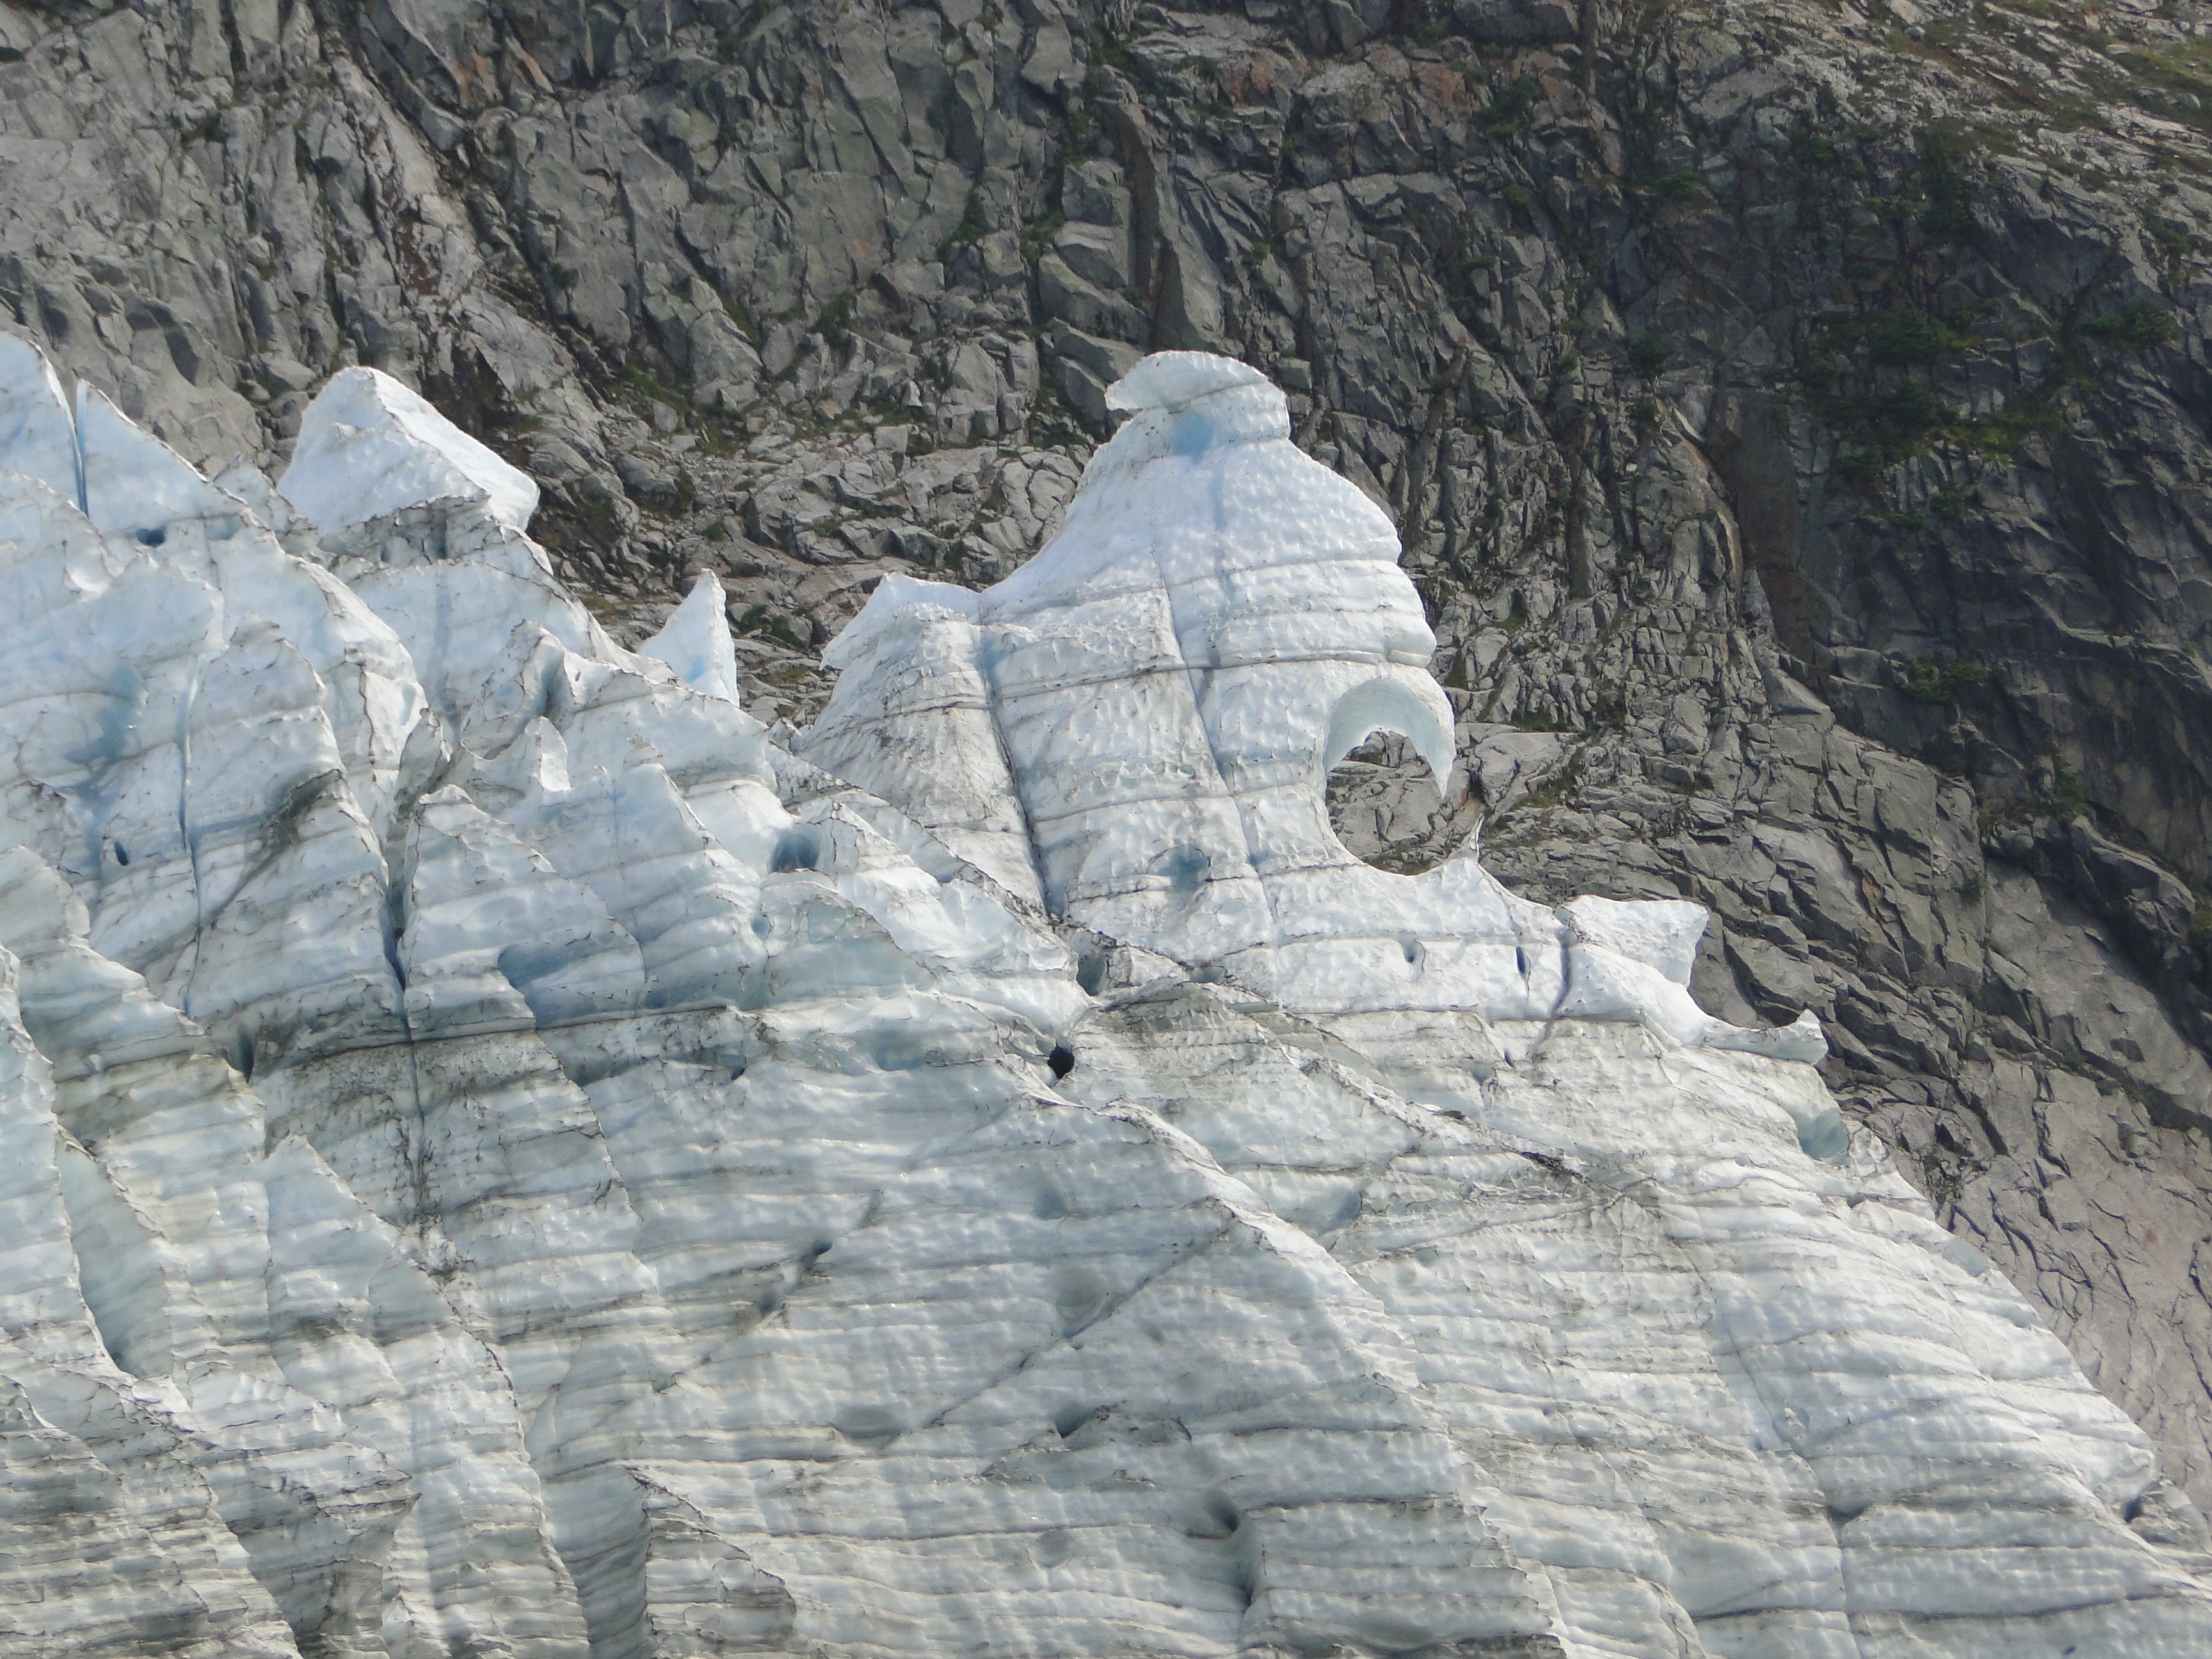
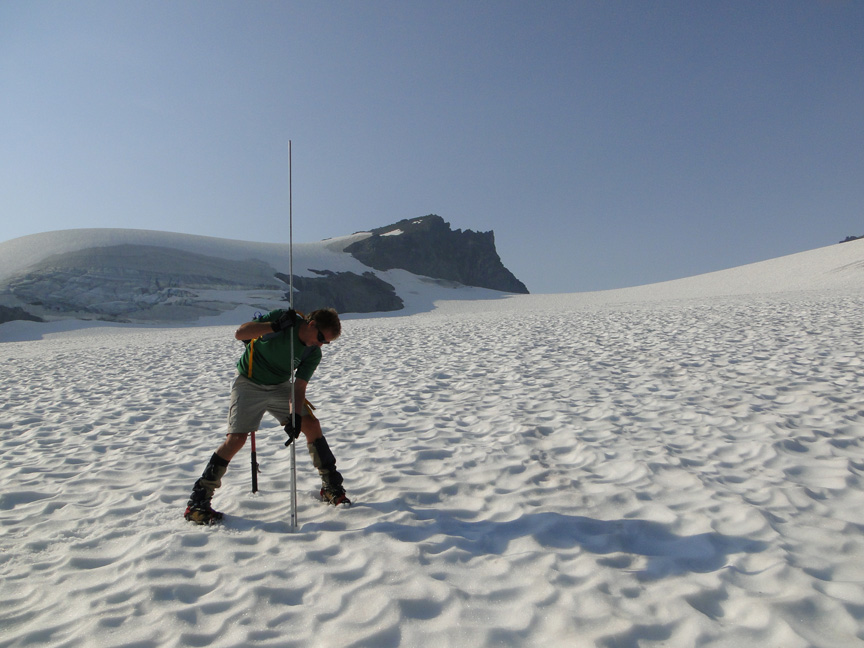
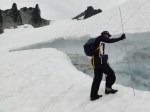
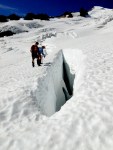
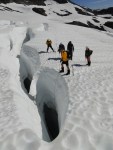
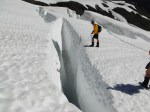
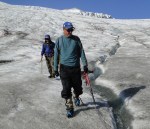
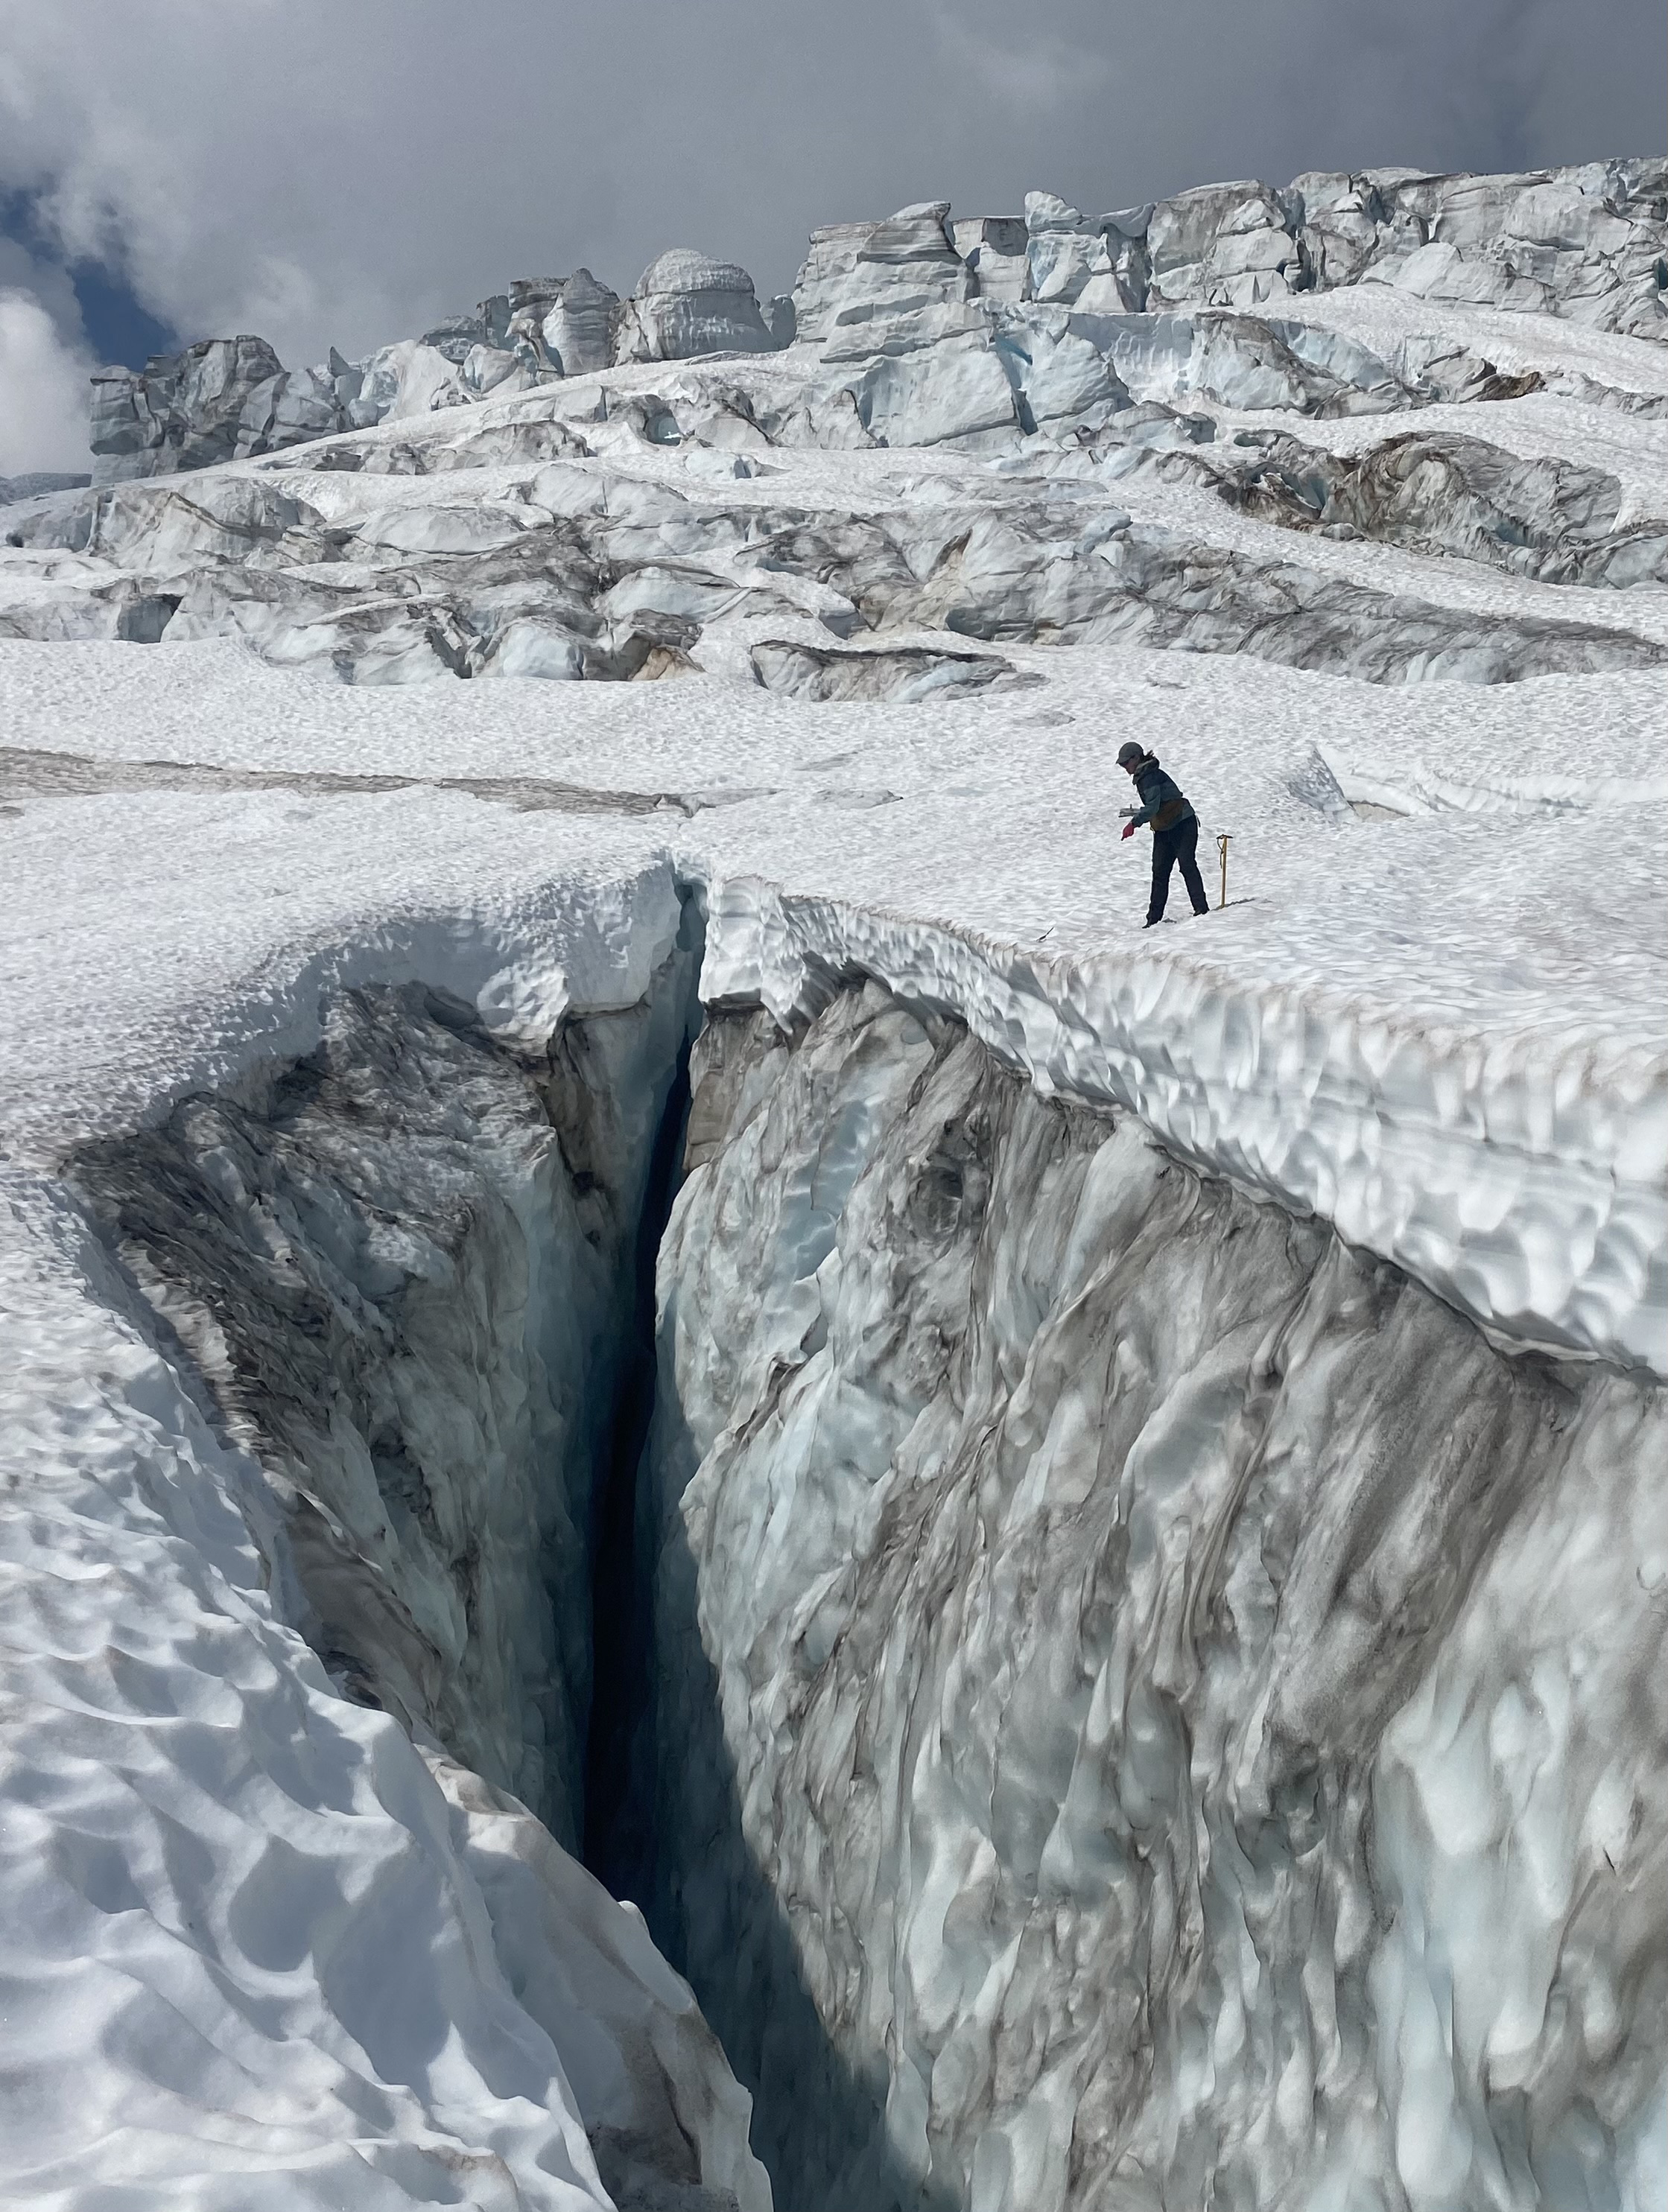
We have been assessing the depth and distribution of crevasses on several glaciers annually since 2013. We have noted a decline in the number of crevasses in specific icefall regions, such as on Lower Curtis, Rainbow and Easton Glacier. The depth also decline rapidly with glacial thinning during the last decade. In the main icefall on Easton Glacier in 2024 at 2300 m were the deepest crevasses we found at ~30 m. Below is Jill Pelto measuring crevasse depth using a camline.
Glaciers Lost
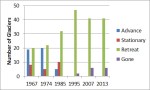
There are 31 active glaciers across the North Cascades that we observed since the 1980s that have now disappeared. The list below indicates the year they were lost, the area of the glaciers in the GLIMS inventory for initial area (1958-1984), 2015 area, and the area of the former glacier in 2022/24. This is not a complete list of glaciers lost in the North Cascade Range. The rate of loss is clearly accelerating.
When a glacier’s volume becomes too limited to generate motion, a combination of thickness below ~15-25 m, and area less than 0.02-0.05 km2, it is no longer a glacier.

North Cascade glaciers that we observed as glaciers in the 1980s that are now gone. The first two areas reported come from GLIMS.org inventories, and the last area and year of loss come from our observations.
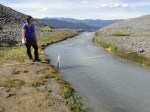
Glacier Runoff
We directly measured runoff below Sholes Glacier and in the basin of former Ice Worm Glacier. In each continued glacier recession is reduing glacier runoff. The increased rate of melt is, exceeded by the reduced area available for melting. The result is declining summer streamflow and increased late summer stream temperatures.