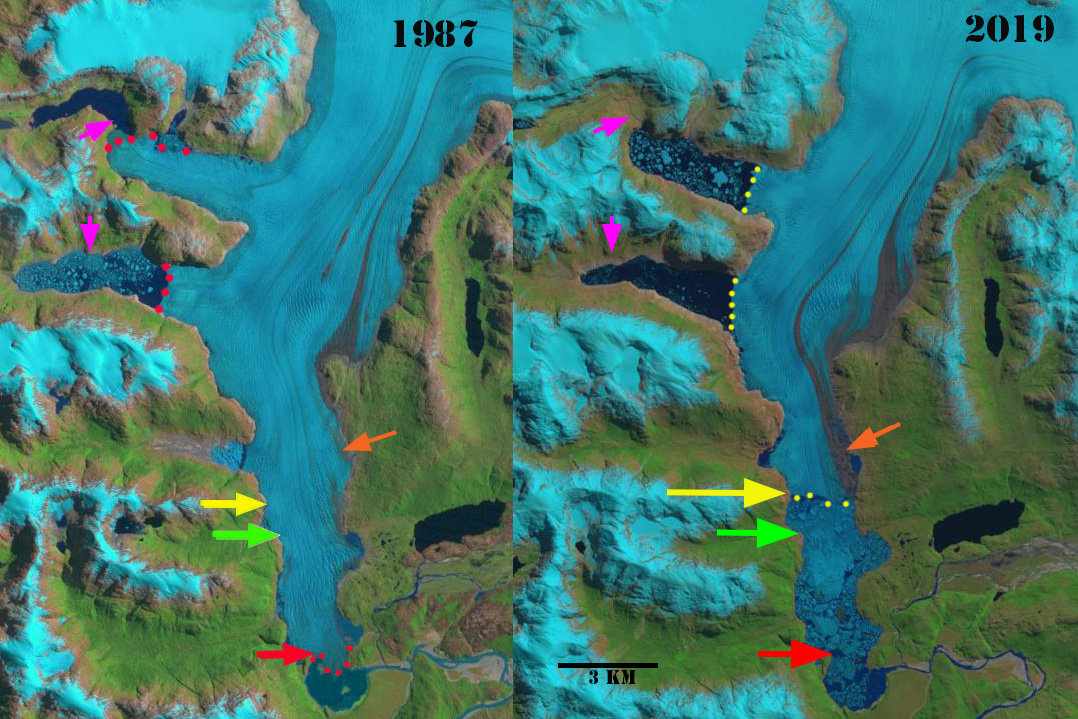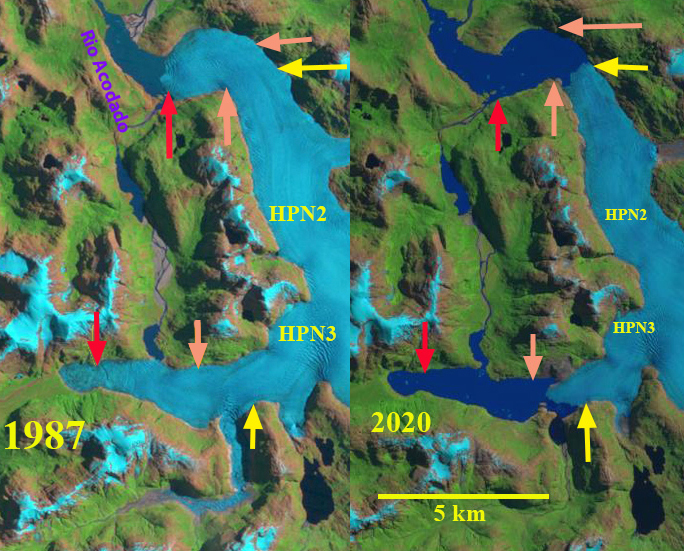
Acodado Glacier retreat and lake expansion observed in 1987 and 2020 Landsat images. Red arrow is the 1987 terminus locations, orange arrows the 2015 terminus and yellow arrows the 2020 terminus location.
Loriaux and Casassa (2013) examined the expansion of lakes of the Northern Patagonia Ice Cap (NPI). From 1945 to 2011 lake area expanded 65%, 66 km2. Rio Acodado has two large glacier termini at its headwater, HPN2 and HPN3. that are fed by the same accumulation zone and comprise the Acodado Glacier. The glacier separates from Steffen Glacier at 900 m. The lakes at the terminus of each were first observed in 1976 and had an area of 2.4 and 5.0 km2 in 2011 (Loriaux and Casassa, 2013). Willis et al (2012) noted a 3.5 m thinning per year from 2001-2011 in the ablation zone of the Acodado Glacier, they also note annual velocity is less than 300 m/year in the ablation zone. Davies and Glasser (2012) noted that the Acodado Glacier termini, HPN2 and HPN3, had retreated at a steadily increasing rate from 1870 to 2011. Here we examine the substantial changes in Acodado Glacier from 1987 to 2020 using Landsat imagery. Pelto, 2017 reported a retreat from 1987-2015 of 2100 m for HPN2 and 3200 m for HPN3.
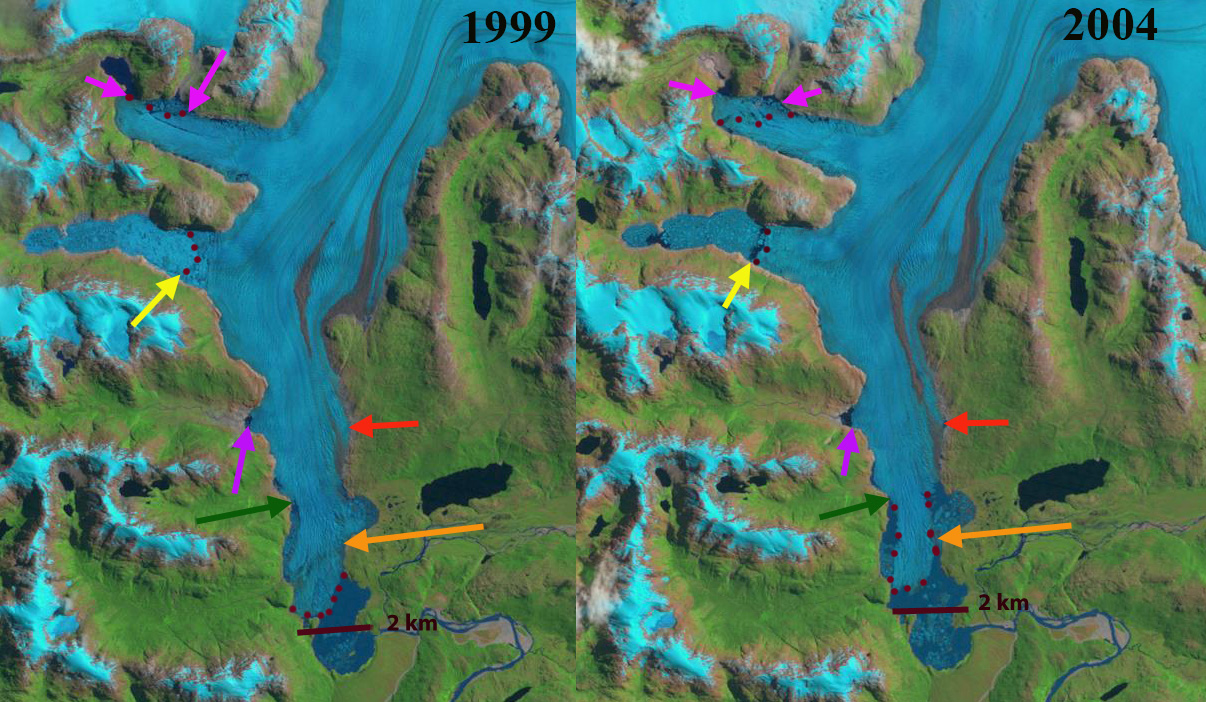
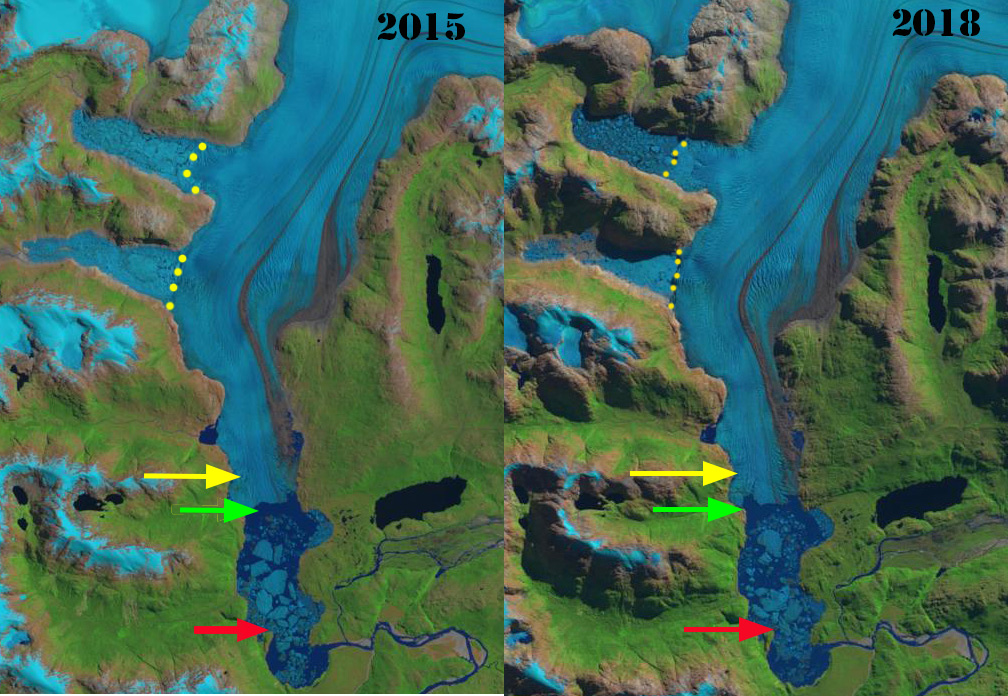
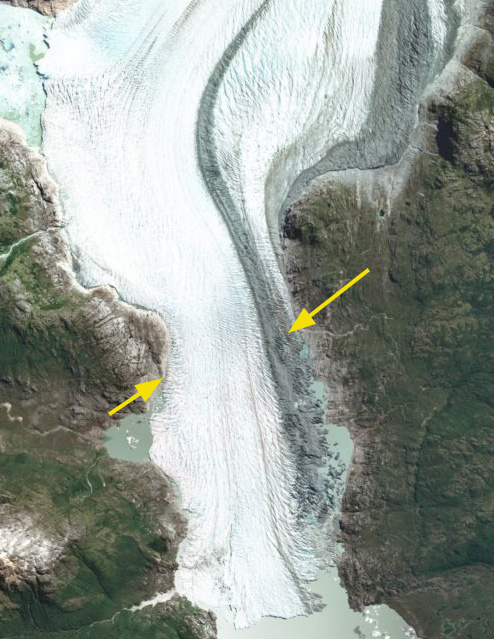
In HPN2 and HPN3 terminate at the red arrow in 1987 , the snowline is at the purple dots at 1000 m. By 2000 the glacier has retreated from the red and yellow arrow by 400 m and 900 m respectively, and the snowline is at 1100 m. In 2015 it is apparent that HPN2 has retreated 2100 m from the red arrow to the orange arrow. The snowline was again at 1100 m. In 2020 the snowline in early February was at 1100 m. From 1987-2020 Acodado Glacier terminus HPN2 has retreated 2700 m and HPN3 has retreated 4100 m. The result of this retreat is an increase in lake area at HPN2 from 2.1 km2 in 1987 to 7.1 km2 in 2020. At HPN3 lake area expanded from 1.4 km2 to 4.8 km2 . Glasser et al (2016) identified a 40% increase in lake area for the NPI from 1987-2015, much less than the increase at Acodado Glacier. They also note the recent 100 m rise in snowline elevations for the NPI. The higher snowline indicates warmer temperatures generating high ablation rates, which will leads to reduced ice flux from the accumulation zone to the terminus, which will drive more retreat. Near Point A there are three locations noted in the accumulation zone image below that indicate the reduced ice flow from the accumulation zone into an adjacent outlet glacier. HPN3 has a sharp rise in elevation ~1.5 km above the terminus, before it joins the main Acodado Glacier, it should retreat rapidly toward this point and then calving will end and retreat will slow. HPN2 has a more gradual slope indicating substantial potential for lake expansion, with a slope significant increase 3 km above the 2020 terminus ,just beyond the former tributary on the east margin.
The retreat here is synonymous with the pattern observed at other NPI outlet glaciers each with rapid calving retreats in expanding proglacial lakes (Glasser et al 2016); Fraenkel Glacier, Benito Glacier and Reichert Glacier and Steffen Glacier. All the outlet glaciers of NPI have retreated significantly in the last 30 years most leading to expanding proglacial lakes (Loriaux and Casassa, 2013; Pelto, 2017).
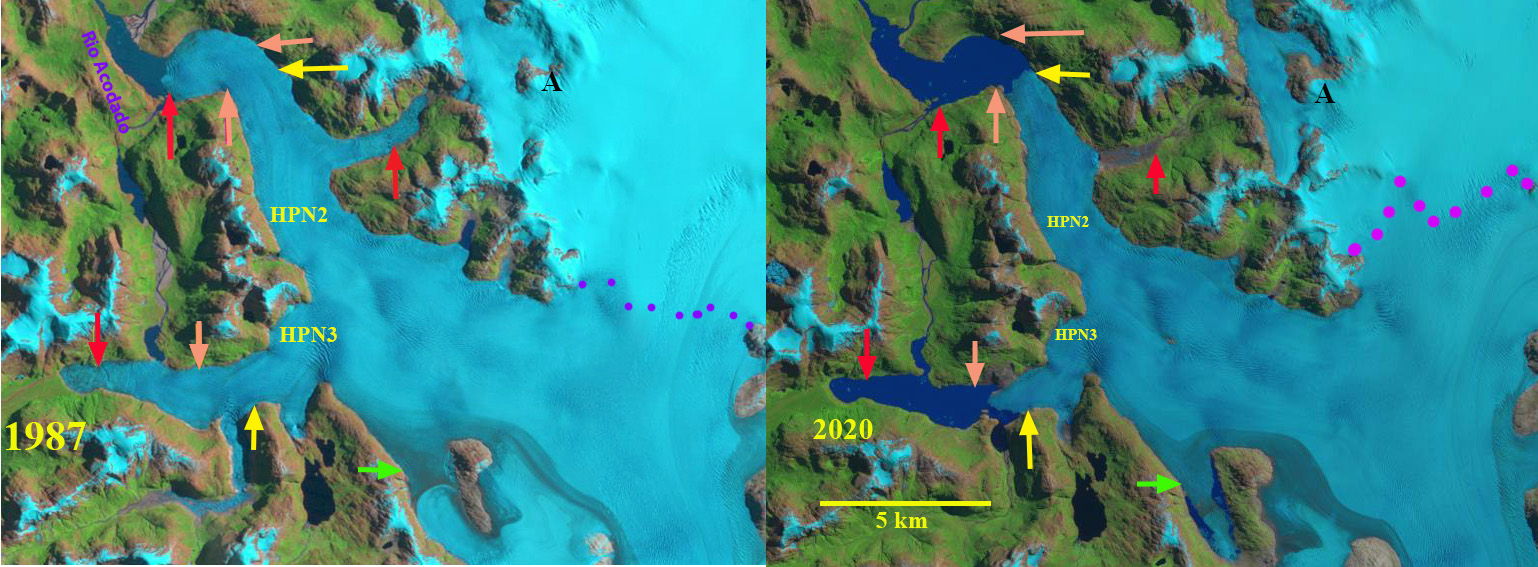
Acodado Glacier retreat and lake expansion observed in 1987 and 2020 Landsat images. Red arrow is the 1987 terminus locations, orange arrows the 2015 terminus and yellow arrows the 2020 terminus location. The transient snowline is purple dots, the green arrow marks upglacier proglacial lake and Point A is the area of focus of detailed accumulation image below.
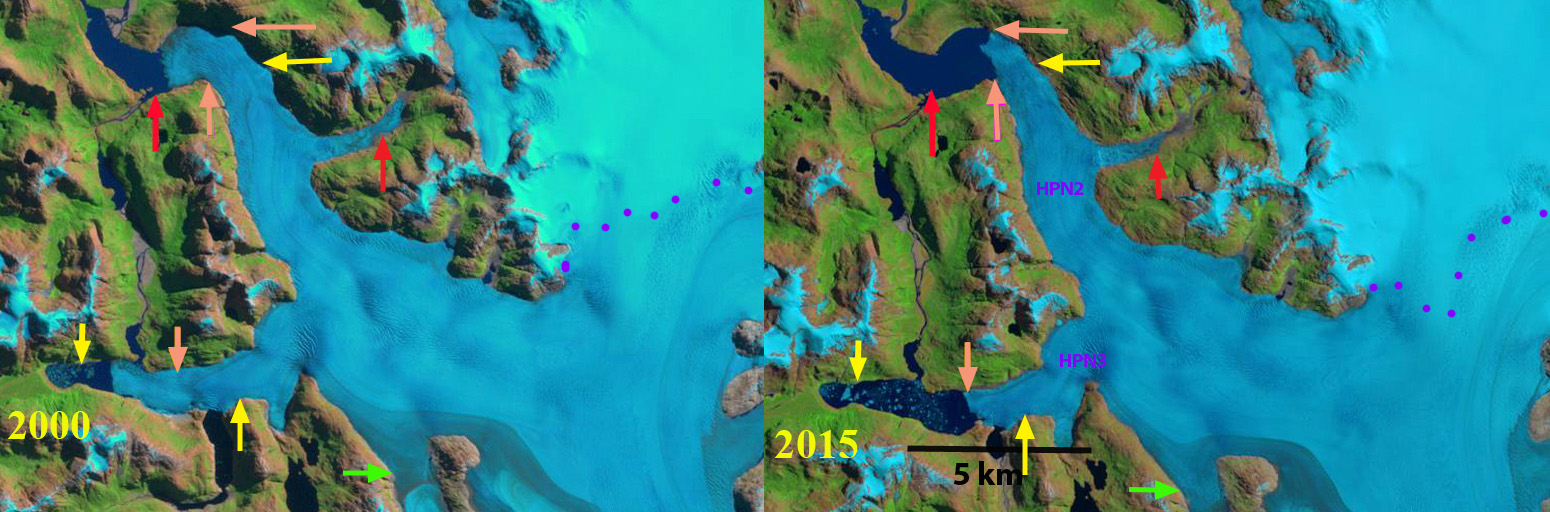
Acodado Glacier retreat and lake expansion observed in 2000 and 2015 Landsat images. Red arrow is the 1987 terminus locations, orange arrows the 2015 terminus and yellow arrows the 2020 terminus location. The transient snowline is purple dots, the green arrow marks upglacier proglacial lake and Point A is the area of focus of detailed accumulation image below.

Note the expansion of bedrock at points 1,2 and 3 indicating reduced flow from the accumulation to the ablation zone near Point A