Rio Frio Glacier, Chile Retreat-Lake Formation 1990-2020

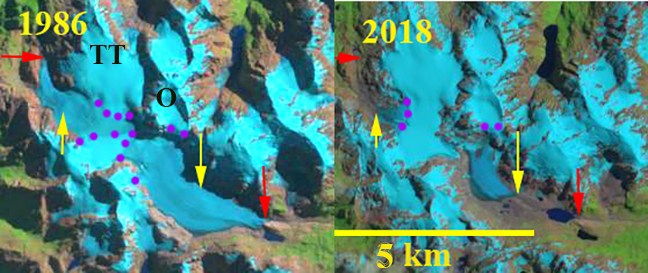
Rio Frio Glacier (RF) in 1990 and 2020 Landsat images. Red arrow 1990 terminus, yellow arrow 2020 terminus, orange arrow new lakes formed after 2000, purple dots snow line.

The “Rio Frio” Glacier is at the headwaters of the Rio Frio a tributary to Rio Palena in Parque Nacionale Corcovado of Palena Province of Chile.  Davies and Glasser (2012) noted that overall glaciers in the region lost 14% of their area from 1986 to 2011. Paul and Molg (2014)  assessed changes of glaciers in the Palena district, Chile revealing a  total area loss of 25% from 1985 to 2011.  Area loss below 1000m elevation was 50–100% and the number of proglacial lakes increased from 223 to 327. Carrivick et al (2016) reported the glaciers in the region had an average thickness of 41 m, this is relatively thin allowing for the rapid area loss. Here we examine glacier change from 1990 to 2020 using Landsat imagery.

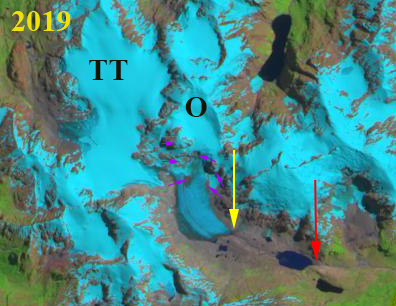
The Rio Frio Glacier terminated in a proglacial lake in 1990 at 720 m and the snowline is at 1100 m.  The next glacier to the south has two arms terminating at 900 m with no proglacial lakes at the terminus see orange arrows. In 2000 there is limited retreat and Rio Frio Glacier still terminates in the lake, and the snowline is at 1150 m. At the next glaciers south there is no proglacial lakes evident at the terminus. By 2019 Rio Frio Glacier has retreated from the lake and the snow line is at 1100 m at the start of February.  The next glacier south two new proglacial lakes have developed at orange arrows. By 2020 the glacier terminus has retreated 500 m to an elevation of ~880 m.  Rio Frio glacier has lost more than 50% of its area below 1000 m.  The glacier still has maintained an accumulation zone each year indicating that without further warming it can survive. The next glacier south has retreated exposing two new proglacial lakes that now are no longer reached by the glacier.

The large scale loss of these two glaciers is typical for the region as noted by the references above and by the examples of Tic Toc Glacier, Erasmo Glacier and Hornopiren Glacier. In this case the two new proglacial lakes are small and no longer in contact with the glacier, result they pose little glacier outburst flood risk. The lake beyond the terminus of Rio Frio Glacier has neither adjacent significant steep slopes or ice in contact and poses little risk as well.

Rio Frio Glacier in 2000 and 2019 Landsat images. Red arrow 1990 terminus, yellow arrow 2020 terminus, orange arrow new lakes formed after 2000, purple dots snow line.

Tic Toc Glacier, Chile Rapid Losses with Time 1986-2019

Tic Toc Glacier (TT) and Oeste Glacier (O) in 1986 and 2018 Landsat images.  Red arrow is the 1986 terminus, yellow arrow is the 2018 terminus location, purple dots the snowline.

Tic Toc Glacier at the headwaters of the Rio Tic Toc and the adjacent Rio Oeste headwater glacier Oeste Glacier are in the Parque Nacionale Corcovado of Palena Province of Chile.  Davies and Glasser (2012) noted that overall glaciers in this region lost 14% of their area from 1986 to 2011. Carrivick et al (2016) reported the glaciers in the region had an average thickness of 41 m, this is relatively thin. Here we examine glacier change from 1986 to 2018 using Landsat imagery, with a 2019 Sentinel image for further visual identification of features.

In 1986 Oeste Glacier extended downvalley terminating beyond the east end of a basin, near the west end of an adjacent bedrock knob to its south. The glacier has a 3 km long, 1 km wide valley tongue fed by a higher accumulation zone to the north.  Tic Toc Glacier has a terminus tongue that turns from west to north  extending 800 m downvalley. This glacier has a larger accumulation zone than Oeste Glacier, the snowline in 1986 is at 1350 m the divide between the glaciers. By 1999 Oeste Glacier has retreated from the bedrock knob and a small fringing lake is developing.  Tic Toc Glacier has lost much of the northern terminus tongue.  The snowline in 1999 is at 1500 m.  By 2016 Oeste Glacier has retreated upvalley revealing a new lake.  Tic Toc Glacier has retreated out of the north trending valley that it had terminated in. The divide between the glacier is now mostly bedrock indicating it is consistently above the snowline.  The snowline in 206 is above 1500. By 2018 Oeste Glacier has retreated 1700 m losing the majority of its valley tongue.  It is poorly connected to the upper snowfield as revealed by both Digital Globe imagery and 2019 Sentinel imagery below, indicating the lack of a substantial contributing accumulation zone. Tic Toc Glacier has retreated 1500 m since 1986, most of its valley length. There is still a significant accumulation zone for this glacier. In both cases the majority of the valley portion of these glaciers has been lost since 1986 and the substantial divide connection has been severed. The large scale loss of these two glaciers is typical for the region as noted by the references above and by the examples of Erasmo Glacier and Hornopiren Glacier.


Tic Toc Glacier (TT) and Oeste Glacier (O) in 1999 and 2016 Landsat images.  Red arrow is the 1986 terminus, yellow arrow is the 2018 terminus location, purple dots the snowline and purple arrow the divide.
Digital Glacier image indicating Tic Toc Glacier and Oeste Glacier.  Red arrows indicate 1986 terminus locations, far from the current terminus location.
A 2019 Sentinel image of Tic Toc and Oeste Glacier.  Red arrow 1986 terminus, yellow arrow 2018 terminus and purple arrows bedrock areas separating Oeste Glacier from the accumulation zone.