Upsala Glacier, Argentina Limited Snowcover Cloak as 2020 Melt Season Ended

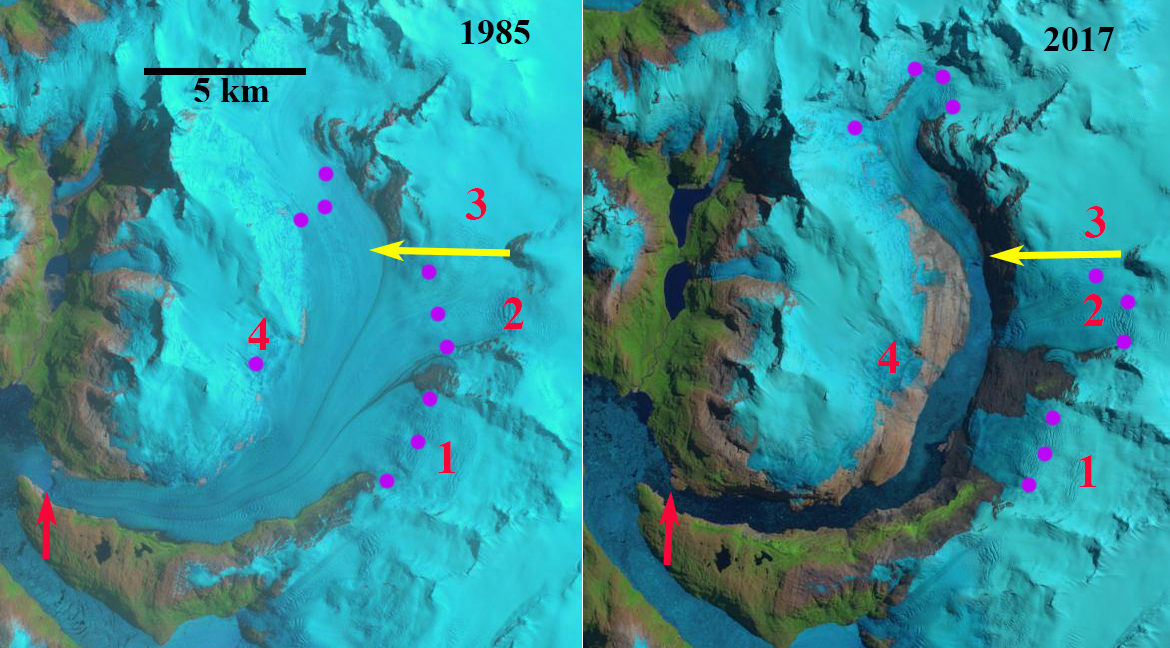
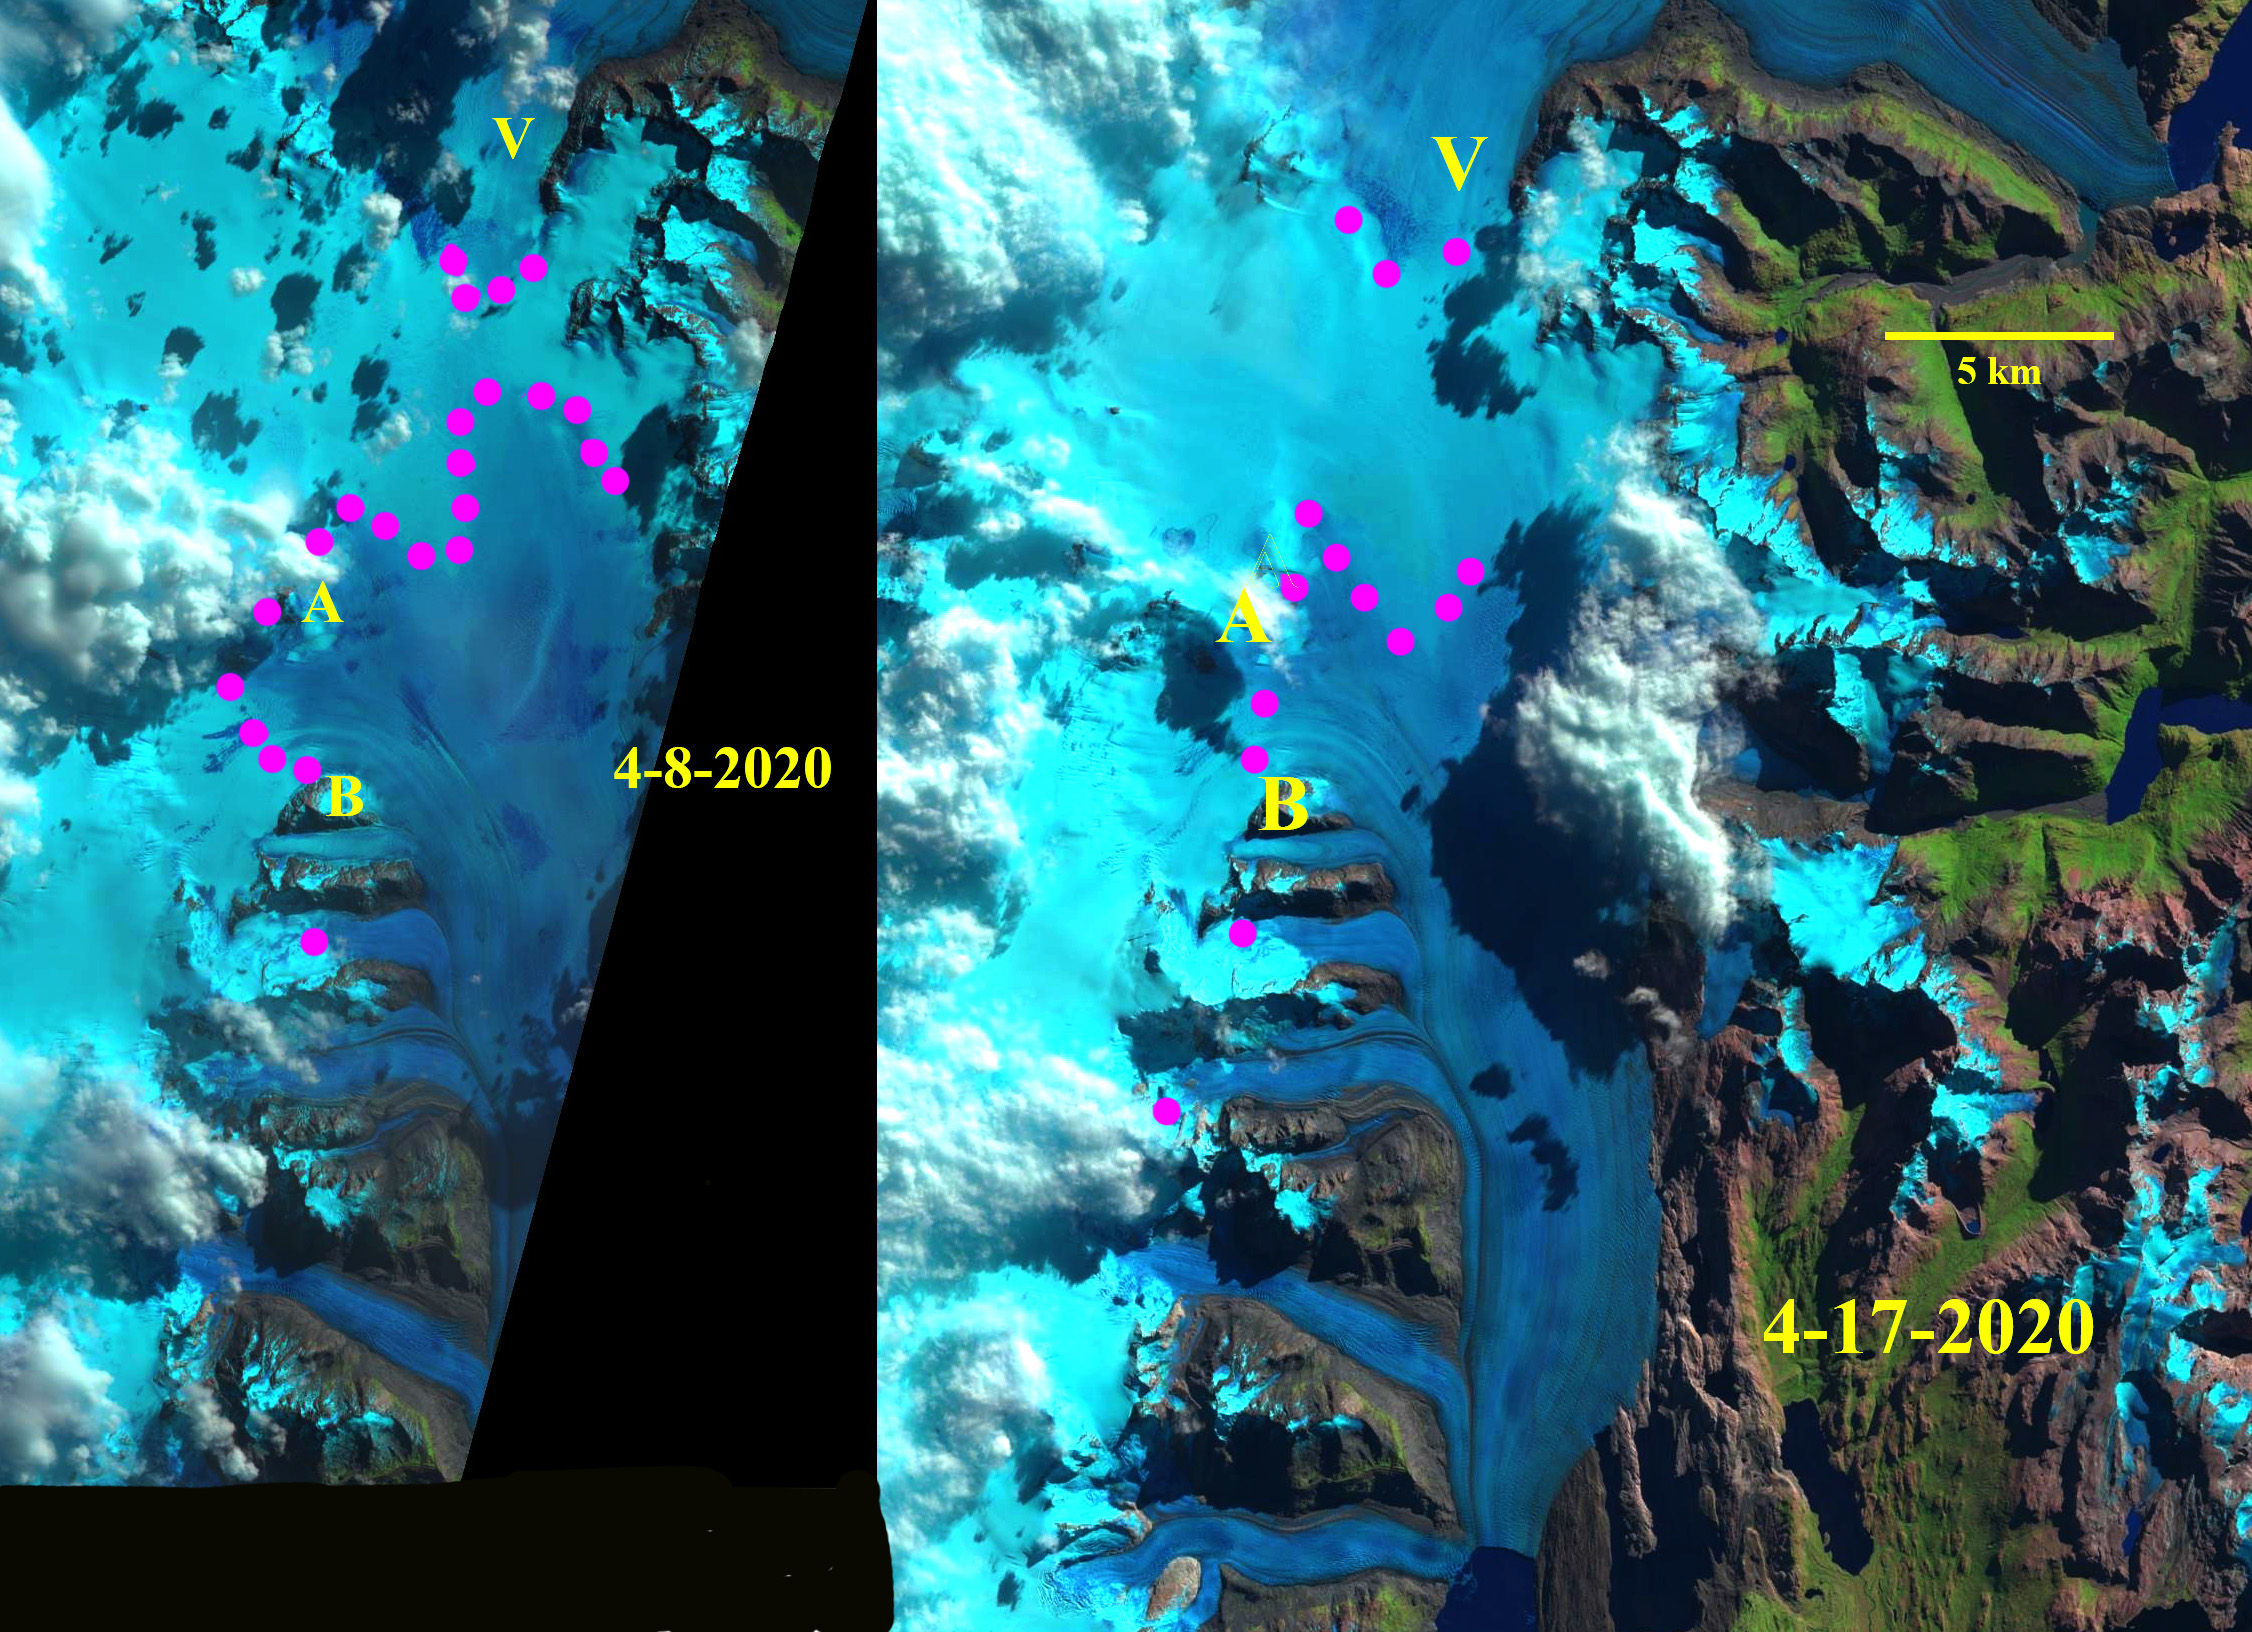
Upsala Glacier transient snowline (TSL) in Landsat images from April 8 and April 17, 2020. TSL is indicated by purple dots, Point A and B are the same nunataks in each image. On April 8 the TSL almost reaches the divide with Viedma Glacier (V). 

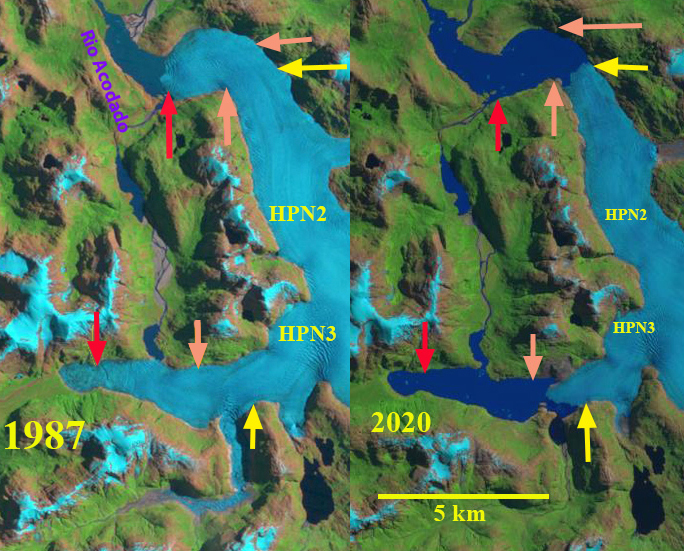
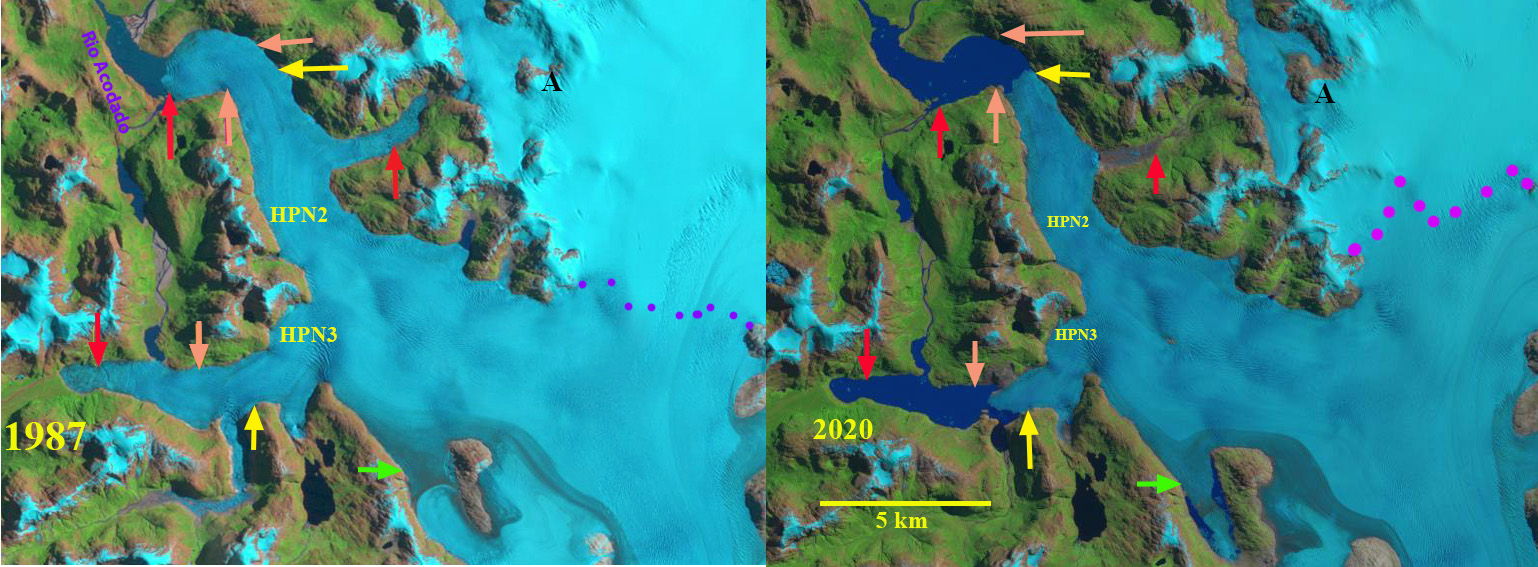
Glaciers exist and survive when the majority of the glacier is always snow covered even at the end of the summer melt season. For a calving glacier the percentage of the glacier in the accumulation zone (accumulation area ratio: AAR) required to be in equilibrium is at least 65%, depending on calving rate. At the end of the melt season the transient snow line (TSL) is the equilibrium line where melting equals accumulation, above this point accumulation is retained. In the last year we have observed a number of glaciers with exceptionally limited retained snow cover at then end of summer in 2019. The limited AAR is a driver of mass balance loss and future terminus retreat. Here we report on the TSL on Upsala Glacier, Argentina in April 2020. This glacier flows south from a divide with Viedma Glacier and is fed from the crest of the Southern Patagonia Icefield. The glacier terminates in Lago Argentina and has retreated substantially, 7.2 km from 1986-2014 (NASA, 2014).

De Angelis (2017)  noted the equilibrium line for Upsala Glacier was 1170 m based on 2002 and 2004 observations, which equates to an AAR of 65%. Landsat images from 2001 and 2014 both from March indicate a TSL at 1075 m in 2001 and 950 m in 2014. With the snowline downglacier of Point B. On Feb 14, 2018 the TSL reached its highest observable elevation at 1275-1300 m. On March 14, 2019 the TSL reached 1300 m. On April 8, 2020 the TSL is between 1325 and 1350 m upglacier of Point A and nearly to the Viedma Glacier divide. On April 17, 2020 the TSL has descended slightly to 1300 to 1325 m.  The ELA of ~1350 m is the highest annual observation for Upsala Glacier and equates to an AAR of ~48%. Malz et al (2018) indicated a 3.3 m thinning of Upsala glacier with significant thinning extending to the Viedma Glacier divide. Since 2014 retreat has largely paused, but given mass losses upglacier and consistent high snowlines ~1300 m in 2018-2020, not for long.

The unusually high snowlines in 2019 were observed at the Northern Patagonia IcefieldTaku Glaicer, Alaska and on Penny Ice Cap, Baffin Island.

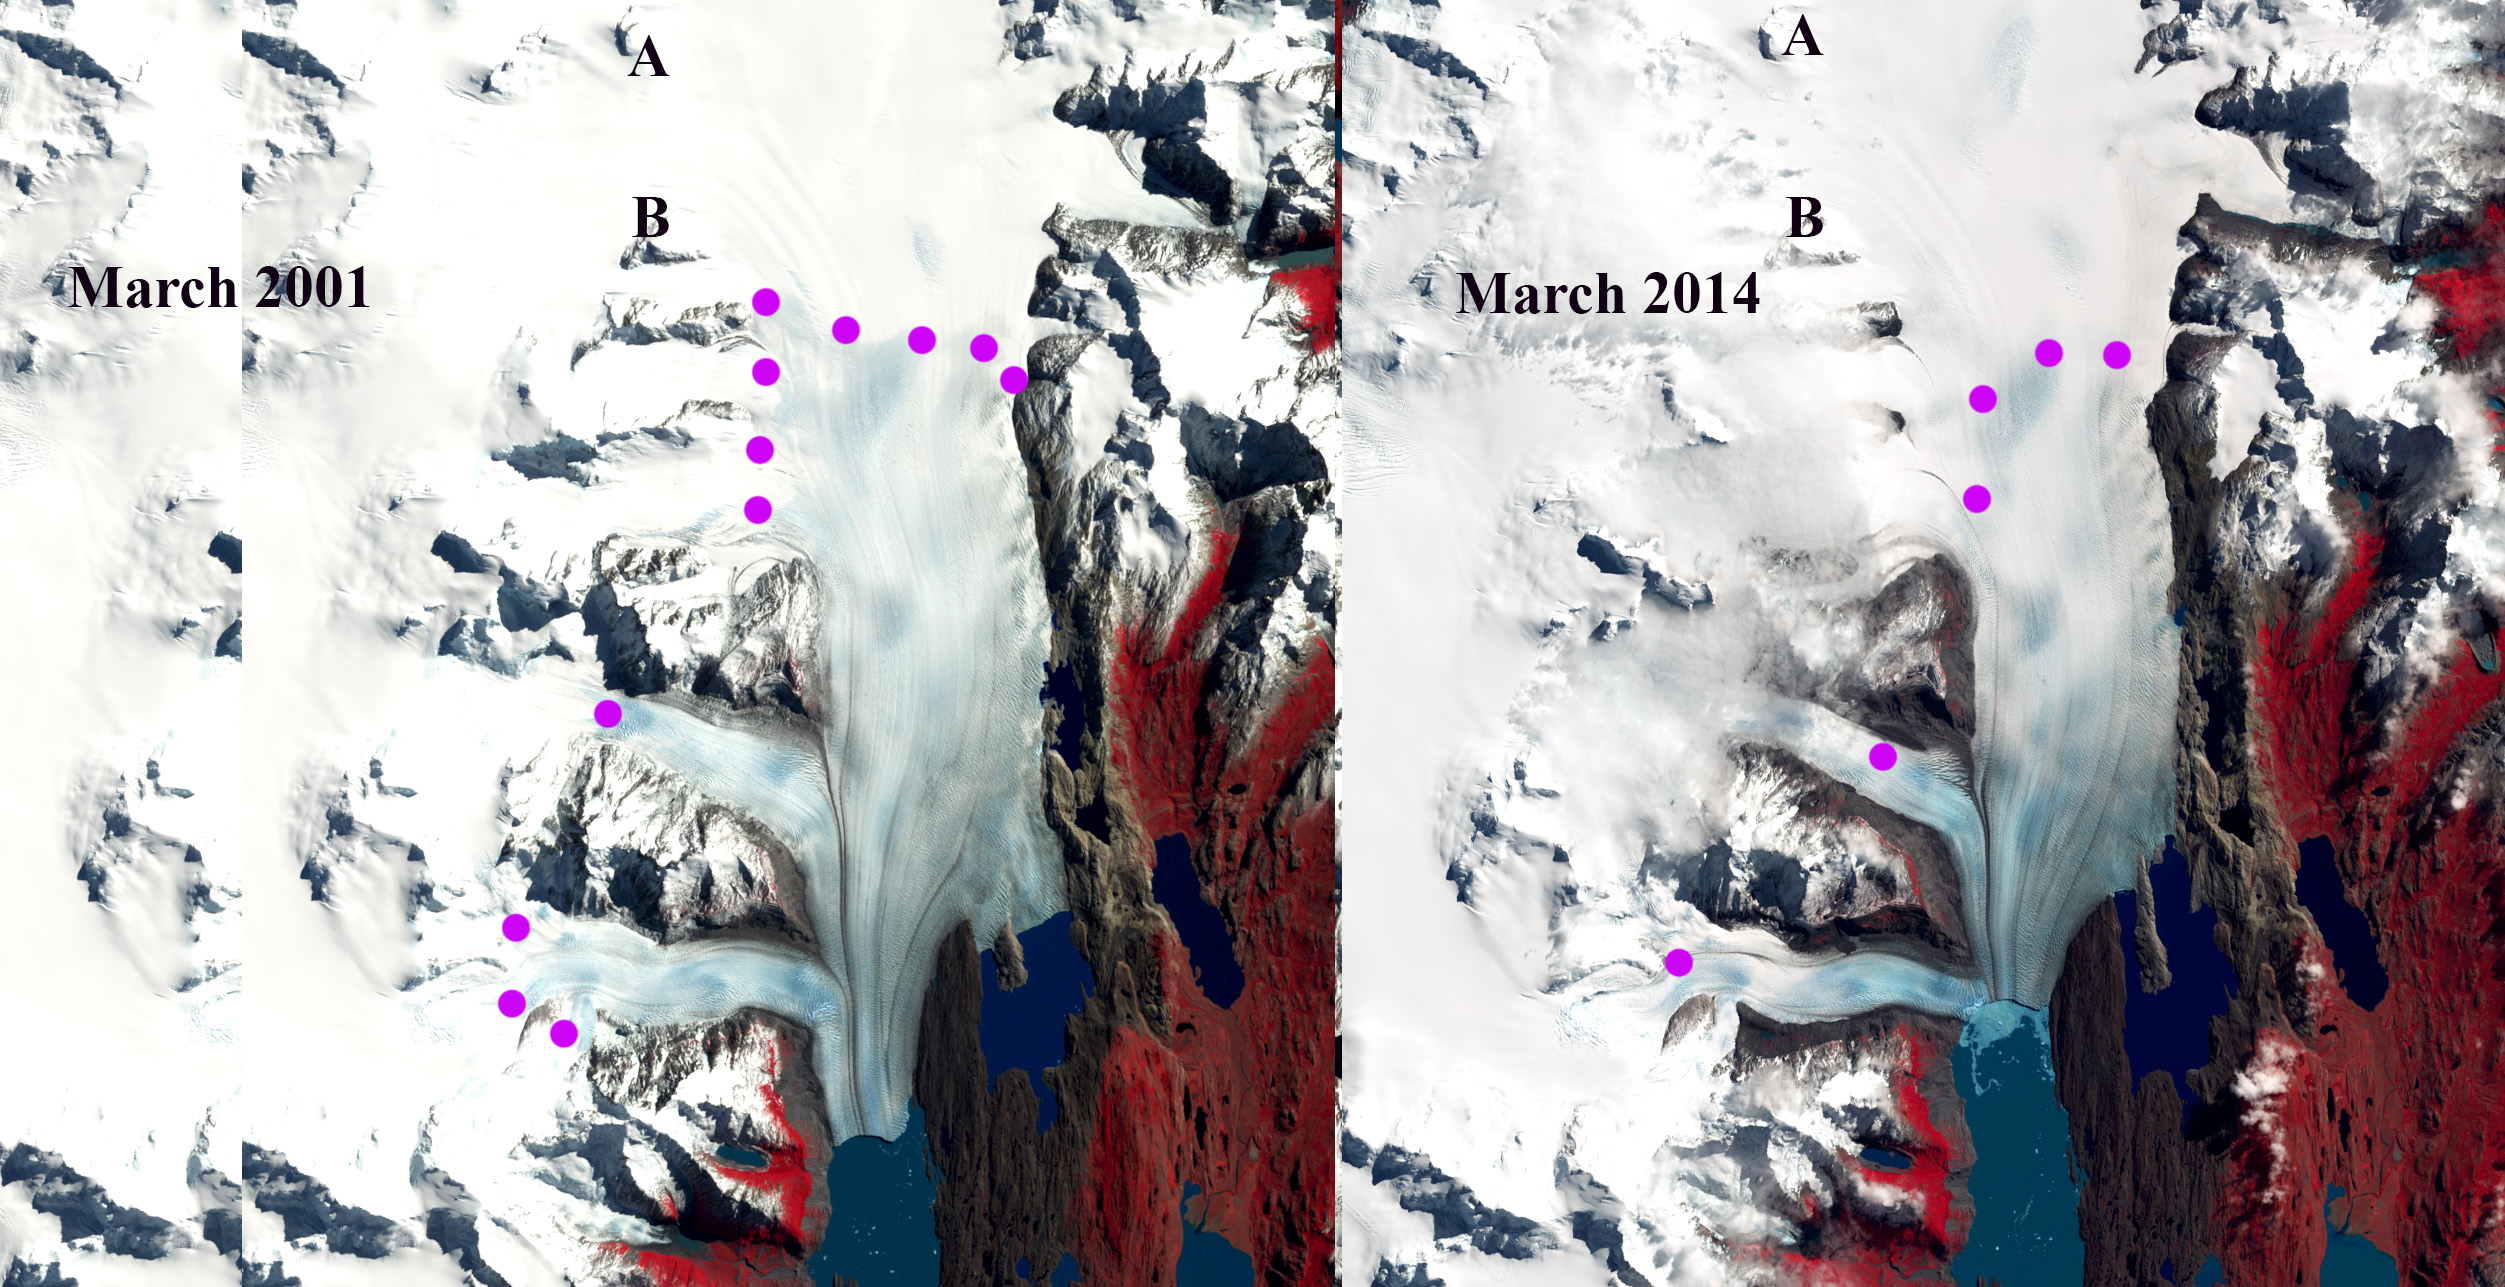
Upsala Glacier transient snowline (TSL) in Landsat images from March 2001 and March 2014. TSL is indicated by purple dots, Point A and B are same location on each map.

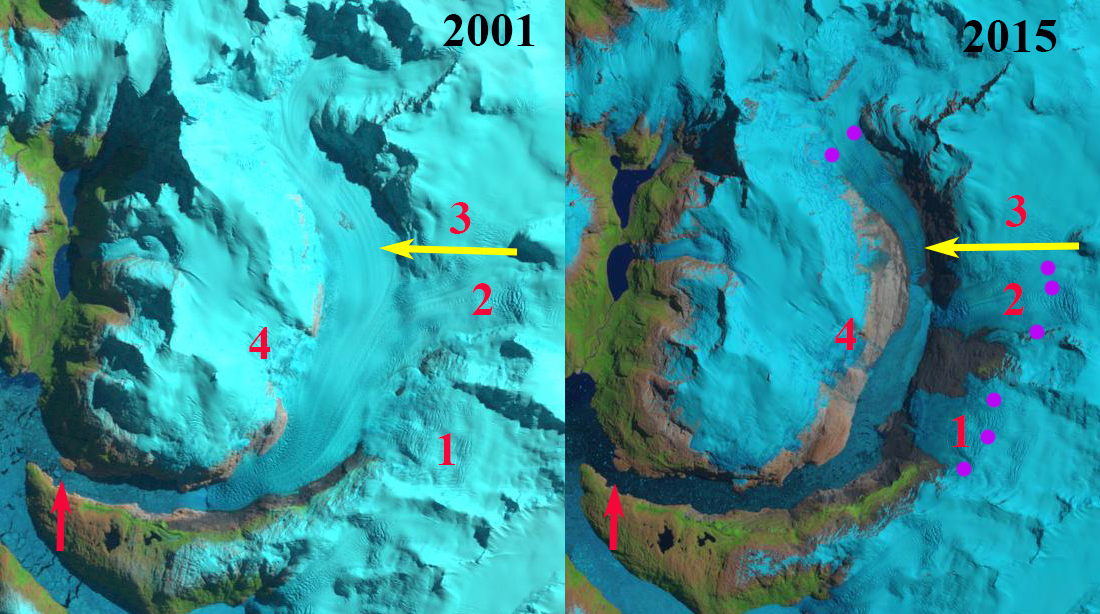
Upsala Glacier transient snowline (TSL) in Landsat images from February 14, 2018 and March 14, 2019. TSL is indicated by purple dots, Point A and B are same location on each map.

Map from GLIMS of the glacier divide of Upsala and Viedma Glacier with contours in meters noted.

Acodado Glacier, Chile Retreat Yields Tripling in Lake Area 1987-2020

Acodado Glacier retreat and lake expansion observed in 1987 and 2020 Landsat images.  Red arrow is the 1987 terminus locations, orange arrows the 2015 terminus and yellow arrows the 2020 terminus location.  

Loriaux and Casassa (2013) examined the expansion of lakes of the Northern Patagonia Ice Cap (NPI). From 1945 to 2011 lake area expanded 65%, 66 km2. Rio Acodado has two large glacier termini at its headwater, HPN2 and HPN3. that are fed by the same accumulation zone and comprise the Acodado Glacier. The glacier separates from Steffen Glacier at 900 m. The lakes at the terminus of each were first observed in 1976 and had an area of 2.4 and 5.0 km2 in 2011 (Loriaux and Casassa, 2013).  Willis et al (2012) noted a 3.5 m thinning per year from 2001-2011 in the ablation zone of the Acodado Glacier, they also note annual velocity is less than 300 m/year in the ablation zone. Davies and Glasser (2012) noted that the Acodado Glacier termini, HPN2 and HPN3, had retreated at a steadily increasing rate from 1870 to 2011. Here we examine the substantial changes in Acodado Glacier from 1987 to 2020 using Landsat imagery.  Pelto, 2017 reported a retreat from 1987-2015 of 2100 m for HPN2 and 3200 m for HPN3.

In HPN2 and HPN3 terminate at the red arrow in 1987 , the snowline is at the purple dots at 1000 m. By 2000 the glacier has retreated from the red and yellow arrow by 400 m and 900 m respectively, and the snowline is at 1100 m.  In 2015 it is apparent that HPN2 has retreated 2100 m from the red arrow to the orange arrow.   The snowline was again at 1100 m. In 2020 the snowline in early February was at 1100 m. From 1987-2020 Acodado Glacier terminus HPN2 has retreated 2700 m and HPN3 has retreated 4100 m.  The result of this retreat is an increase in lake area at HPN2 from 2.1 km2 in 1987 to 7.1 km2 in 2020.  At HPN3 lake area expanded from 1.4 km2 to 4.8 km2 . Glasser et al (2016) identified a 40% increase in lake area for the NPI from 1987-2015, much less than the increase at Acodado Glacier. They also note the recent 100 m rise in snowline elevations for the NPI.  The higher snowline indicates warmer temperatures generating high ablation rates, which will leads to reduced ice flux from the accumulation zone to the terminus, which will drive more retreat. Near Point A there are three locations noted in the accumulation zone image below that indicate the reduced ice flow from the accumulation zone into an adjacent outlet glacier. HPN3 has a sharp rise in elevation ~1.5 km above the terminus, before it joins the main Acodado Glacier, it should retreat rapidly toward this point and then calving will end and retreat will slow.  HPN2 has a more gradual slope indicating substantial potential for lake expansion, with a slope significant increase 3 km above the 2020 terminus ,just beyond the former tributary on the east margin.

The retreat here is synonymous with the pattern observed at other NPI outlet glaciers each with rapid calving retreats in expanding proglacial lakes (Glasser et al 2016); Fraenkel Glacier, Benito Glacier and Reichert Glacier and Steffen Glacier. All the outlet glaciers of NPI have retreated significantly in the last 30 years most leading to expanding proglacial lakes (Loriaux and Casassa, 2013;  Pelto, 2017).

Acodado Glacier retreat and lake expansion observed in 1987 and 2020 Landsat images.  Red arrow is the 1987 terminus locations, orange arrows the 2015 terminus and yellow arrows the 2020 terminus location.  The transient snowline is purple dots, the green arrow marks upglacier proglacial lake and Point A is the area of focus of detailed accumulation image below.

Acodado Glacier retreat and lake expansion observed in 2000 and 2015 Landsat images.  Red arrow is the 1987 terminus locations, orange arrows the 2015 terminus and yellow arrows the 2020 terminus location.  The transient snowline is purple dots, the green arrow marks upglacier proglacial lake and Point A is the area of focus of detailed accumulation image below.

Note the expansion of bedrock at points 1,2 and 3 indicating reduced flow from the accumulation to the ablation zone near Point A

HPS-12, Chile Spectacular 13 km retreat 1985-2017

HPS-12 Glacier in 1985 and 2017 Landsat images.  The red arrow indicates 1985 terminus, yellow arrows the 2017 terminus, purple dots the snowline and 1-4 are tributaries.  By 2017 all tributaries have detached and the glacier has retreated 13 km. 

HPS-12 is an unnamed glacier draining the west side of the Southern Patagonia Ice Cap (SPI).  The glacier terminates in a fjord and is adjacent to Upsala Glacier to the east and Pio IX Glacier to the north. This developing fjord is also unnamed but feeds into Estero Falcon. The glaciers of the SPI have been experiencing significant mass loss and overall retreat. Willis et al (2012) observed significant mass loss from 2000-2012 of −20.0  Gt per year.  Willis et al (2012) indicate in Fig.1 that the majority of the ice cap has thinned during this period from 2-10 m, with the greatest thinning being in the lower portion of HPS-12. Schaefer et al (2015) indicate and ELA of 980 m and a calving velocity of 2290 m per year, which is quite high for this size of glacier.  Here we examine the retreat and fjord opening using Landsat imagery from 1985-2017.  Is it the fastest retreating glacier in Chile in the last three decades? 

 In 1985 the HPS-12 terminates 1.5 km from the junction of two fjords that are occupied by HSP-12 and HSP-13.  These are separated by a peninsula.  The glacier is fed by four tributaries labelled 1-4. The snowline in 1985 is at 900 m.  In 2001 the four tributaries still join the main glacier, but the terminus has retreated 3.5 km.  In 2015 glacier retreat has led to separation of tributary 1, 2 and 4 from the main glacier, tributary 3 only feeds tributary 2 and not the main glacier.   The snowline in mid-January of 2015 is at 950 m.  The glacier retreat has continued to 2017, the current terminus is 800 m wide vesus 2800 m wide in 1985 at this location.  total retreat from 1985 to 2017 is 13 km.  The fjord is now nearly 15 km long.  HPS-12 was 26 km long in 1985 and is now less than  13 km long, it is 1/2 gone in three decades. This retreat along with Jorge Montt is the largest in Chile in the last 30 years. The retreat fits the pattern of large retreats of calving outlet glaciers of SPI such as Onelli Glacier, Bernardo Glacier and Lucia Glacier.

We also have a unique laboratory to examine a pristine fjord just created an the aquatic ecologic succession and physical oceanographic transitions that will occur. 

HPS-12 Glacier in 2001 and 2015 Landsat images.  The red arrow indicates 1985 terminus, yellow arrows the 2017 terminus, purple dots the snowline and 1-4 are tributaries.  By 2015 all tributaries have detached. 

HPS-12 in 2015 Digital Globe image. Red dots indicate 1985 terminus and yellow dots 2015 terminus location for main glacier and tributaries. 


Onelli Glacier retreat separation, Argentina

The Onelli Glacier drains eastward from the South Patagonia Icefield into Lago Onelli (LO), which then connects to Lago Argentino (LA). Lago Onelli has three main glaciers termininating in the lake Aggassiz (A), Onelli(O)and Bolados Glacier (B). The glacier is noted as 13 km long with an area of 84 square kilometers by the Labratorio de Glaciologia in Chile . Warren and Sugden (1993) note an 1800 meter retreat from 1945-1992 for Onelli Glacier and 850 meters for Agassiz Glacier. Eric Shipton was the first to visit this glacier and did so in the company of Ohio State glaciologist John Mercer in 1958. They found Lago Onelli so filled with icebergs that little water could be seen (Shipton, Land of Tempest, 1963). Agassiz and Onelli Glacier were observed to have a shared terminus much like Onelli Glacier and Belados Glacier in 2003, ion contact but one flowing into the fjord from the north with a steep calving face, and one from the northwest (Onelli) with a gentler slope. The focus for Mercer was the age of the moraines beyond the glacier terminus, for Shipton hiking up onto the icefield to explore potential avenues to the crest of the icefield. The glacier is located on the icefield base map image from the Glaciares of Argenina website. . A comparsion of Landsat satellite images indicate the separation and retreat of Bolados (B) and Onelli Glacier(O) from 2000-2010. In 2000 the joint terminus cuts directly across Lago Onelli as one reasonably straight 1.6 km long. By 2003 the glaciers are barely touching and the combined termini are now long 1.8 km long. BY 2008 the glaciers are separated by 1300 meters. The retreat from the 2000 terminus of Onelli Glacier has been 1500-1800 meters depending where on the ice front the retreat is assessed. Theretreat of the last decade of 160 meter/year is a considerable acceleration over the period from 1945-1990. Belados Glacier has retreated 800 meters. The ELA in the satellite images from recent years has been 1300 meters.

Tyndall Glacier, Chile Retreat Continues

Tyndall Glacier is a large outlet glacier of the Southern Patagonia Icefield (SPI). This glacier has an area of over 300 square kilometers. The main glacier terminus ends in Lago Geikie, which began to form around 1940, and the east terminus previously terminated in Lago Tyndall. Raymond et al (2005) report that the glacier had receded 5 km from 1945 to 2001. The retreat is illustrated in a figure from Rivera & Casassa (2004). This web page on the Tyndall Glacier is one of many provided by Andrés Rivera at the Laboratorio de Glaciología at Universidad de Chile. Assessing the ice surface elevation changes on three profiles 8-15 km above the terminus, the amount of thinning was determined by Raymond et al (2005). From 1945-2002 the average thinning rate of the glacier at meters was 2.3 meters per year. The rate has accelerated averaging over 3.3 meters per year since 1985. This has driven the retreat. Lago Geikie is a deep lake with maximum depths reaching 400 meters and was 300 meters at the calving front in 2001 Raymond et al (2005) . This allows for considerable calving of the thick Tyndall Glacier, which is grounded on the bottom of the lake at its terminus. The glacier velocity near the calving front is 700 meters per year. A comparison of the terminus position from the aforementioned papers, Google Earth from 2003 (top Image) and a Geoeye image from 2010 (bottom image) indicates the changes of Tyndall Glacier are ongoing. Lago Tyndall (LT) for example is continuing to contract as the terminus (TE) that feeds it has thinned and pulled back from the valley that feeds it. Increasingly this is becoming a watershed that will not be fed by Tyndall Glacier. Lago Geikie (LG) continues to expand now 7 km long. The retreat in the last 7 seven years has been 600-900 m on the main calving front. This has exposed a new peninsula (P). The glacier terminus is much narrower than in 1975 in an aerial image from Raymond et al (2005). The snowline on the glacier is at 900 meters and there is considerable glacier area above 1200 meters, indicating this glacier can survive additional warming, note the above image. As Raymond et al (2005) emphasized the glacier bottom remains below the Lago Geikie lake level for 14 km. Over much of this distance calving would play a role, helping continue the recent retreat. This retreat due to calving into a glacier lake resulting from ongoing glacier thinning resulting from increased surface ablation is widespread from Bear Glacier, Gilkey Glacier and Yakutat Glacier in Alaska, to Tasman Glacier in NZ to Nef Glacier and Colonia Glacier in