Foss Glacier, WA Needs Snow Queen Elsa’s Help to Survive

foss compare

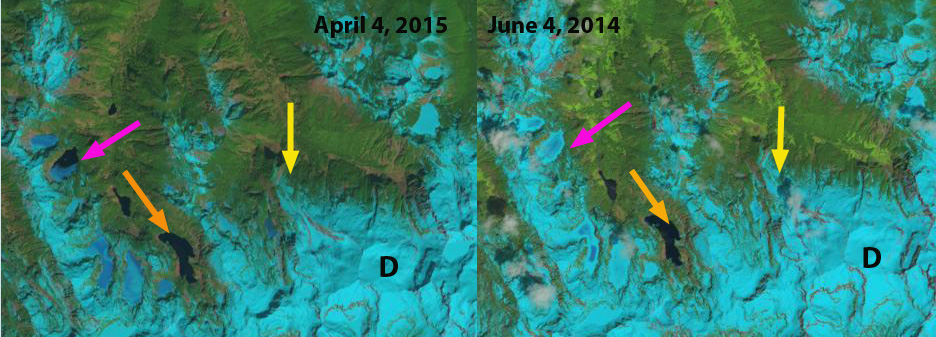
Comparison of Foss Glacier in 1988 and 2015 from the west ridge of Mount Daniel.  The glacier has lost 70% of its area in 30 years. Black arrows indicate bedrock area emerging amidst the glacier. 

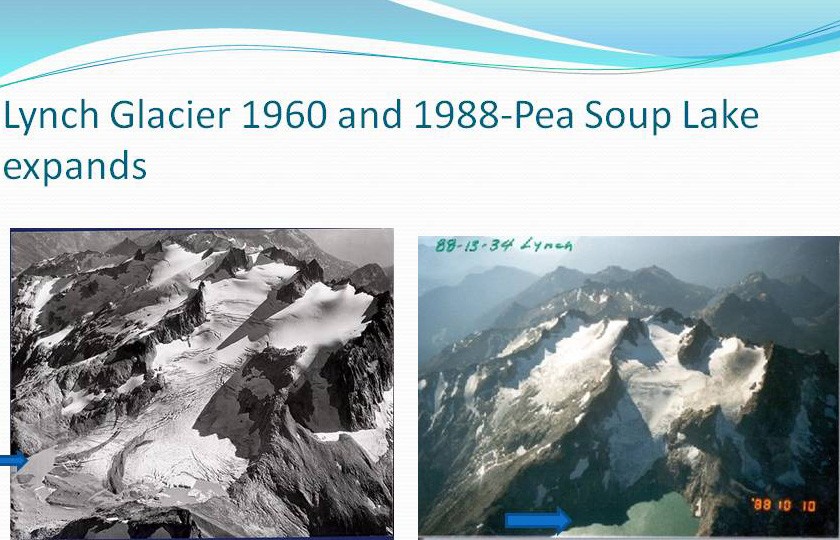
Foss Glacier is a slope glacier covering the northeast face of Mount Hinman at the head of the South Fork Skykomish River in the North Cascades of Washington. In the 1958 map of the region the glacier covered 0.8square kilometers.  By 1984 when we first mapped the glacier margin the glacier had lost little area, and was at 0.7 square kilometers. In 1988 the glacier extended from 2325  m to 1890 m in one continuous swoop.  Glacier thickness was in the 30-40 m range.  There were few crevasses, and some of the supraglacial streams were particularly long for this region, 600 m is the longest mapped which was more than 50% of the glacier length. By 1992 the glacier was developing some significant bedrock outcrops emerging amidst the glacier.  The terminus was retreating and the lower slope terminus lobe below 1950 m was clearly going to detach. Foss Glacier had by the middle of August lost all of its snowcover in 1992, 1993, 1994, 1998, 2003, 2005, 2009, 2014 and 2015.  This has led to thinning of the upper reaches of the glacier.  Thinning of the upper reaches of a glacier is an indicator of a glacier that cannot survive current climate. The lower section detached from the upper section in 2003 and melted away in 2015.  In 2015 the glacier has fragmented into four parts and will continue to melt away. Annual balance measurements indicate a loss of over 18 meters of average ice thickness, which for a glacier that averaged 30-40 m in thickness represents approximately 50% of the volume of the glacier lost.  In 2005 the glacier had lost 40% of its total area in 15 years, the terminus area had detached, Point A, and there was no snow retained (Pelto, 2015).  This was the third straight year of almost no retained snowcover. A glacier cannot survive without a consistent/persistent accumulation zone, which is where snow is retained.  A view of the changing area from the shore of Pea Soup Lake indicates how Foss Glacier  in 1996 dominated the slope of Mount Hinman to 2007 when it did not. By 2015 after 30 years of mass balance measurement, the program was discontinued as the glacier had now lost 70% of its area in the previous 30 years. Unless Snow Queen Elsa can put the freeze on during summer, this glacier will not survive long.

The importance here is for late summer streamflow in the Skykomish River.  Glacier retreat and changes in summer runoff have been pronounced in the Skykomish River Basin, North Cascades, Washington from 1950-2009 (Pelto, 2011). An analysis comparing USGS streamflow records for the 1950-1985 to the 1985-2009 period indicates that summer streamflow (July-September) has declined 26% in the watershed, spring runoff (April-June) has declined 6%, while winter runoff (November-March) has increased 10%.  From 1929-1985 streamflow was less than 14 cubic meters/second during the glacier melt season on a single day in 1951. From 1986-2015 there were, 264 days with discharge below 14 m3/s-1 with 11 periods lasting for 10 consecutive days. The minimum mean monthly August discharge from 1928-2015 occurred in 2015, 2003 and 2005 when streamflow was 11.8 m3s-1, 15.1 m3s-1 and 15.2 m3s-1 respectively.   Despite 15% higher ablation rates during the 1984-2009 period, the 45% reduction in glacier area led to a 35-38% reduction in glacier runoff between 1958 and 2009 (Pelto, 2011). The glacier runoff decline impacted river discharge only during low flow periods in August and September. In August, 2003 and 2005 glacier ablation contributed 1.5-1.6 m 3 s -1 to total discharge, or 10-11% of August discharge. While declining glacier area in the region has and will lead to reduced glacier runoff and reduced late summer streamflow, it has limited impact on the Skykomish River except during periods of critically low flow, below 14 m3 s -1 when glaciers currently contribute more than 10% of the streamflow.

foss92dg

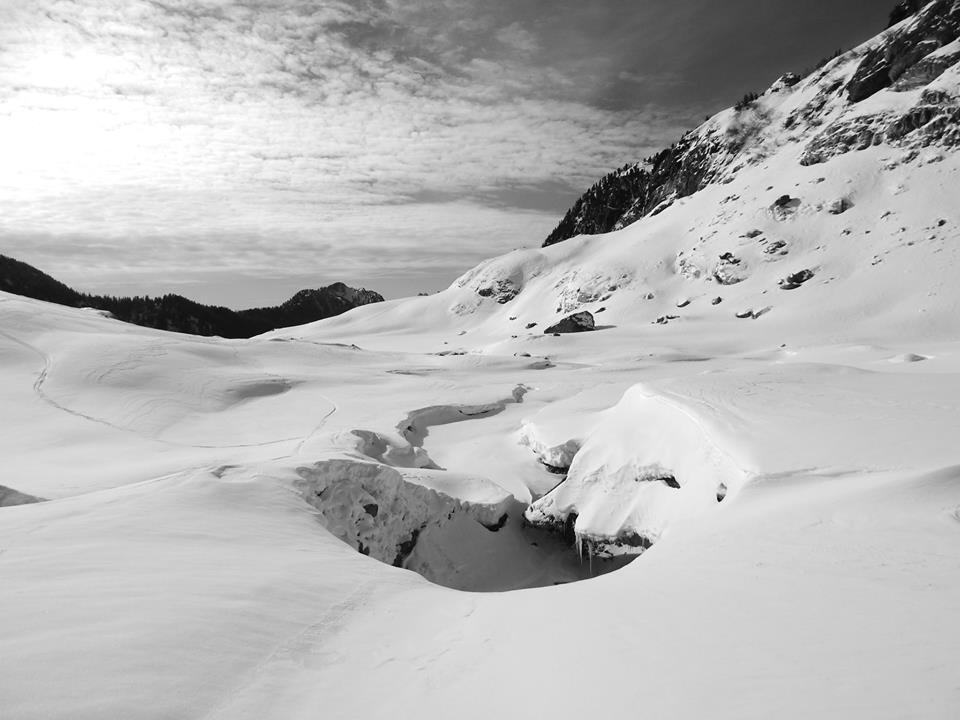
A 1992 view downglacier illustrating the limited crevassing, surface streams and thin nature of the ice.

foss stream

Along a surface stream that has endured long enough to develop into a meandering system.

foss 1992

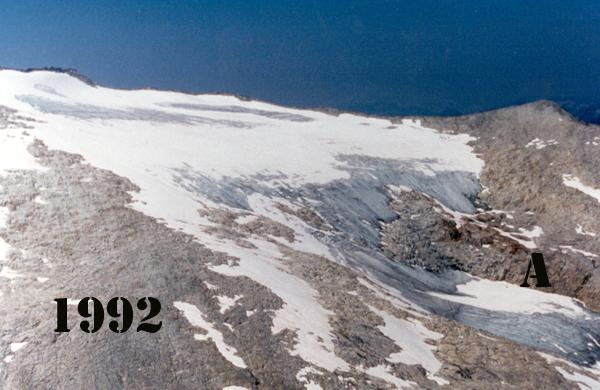
1992 view of Foss Glacier from Mount Daniel

foss 2005

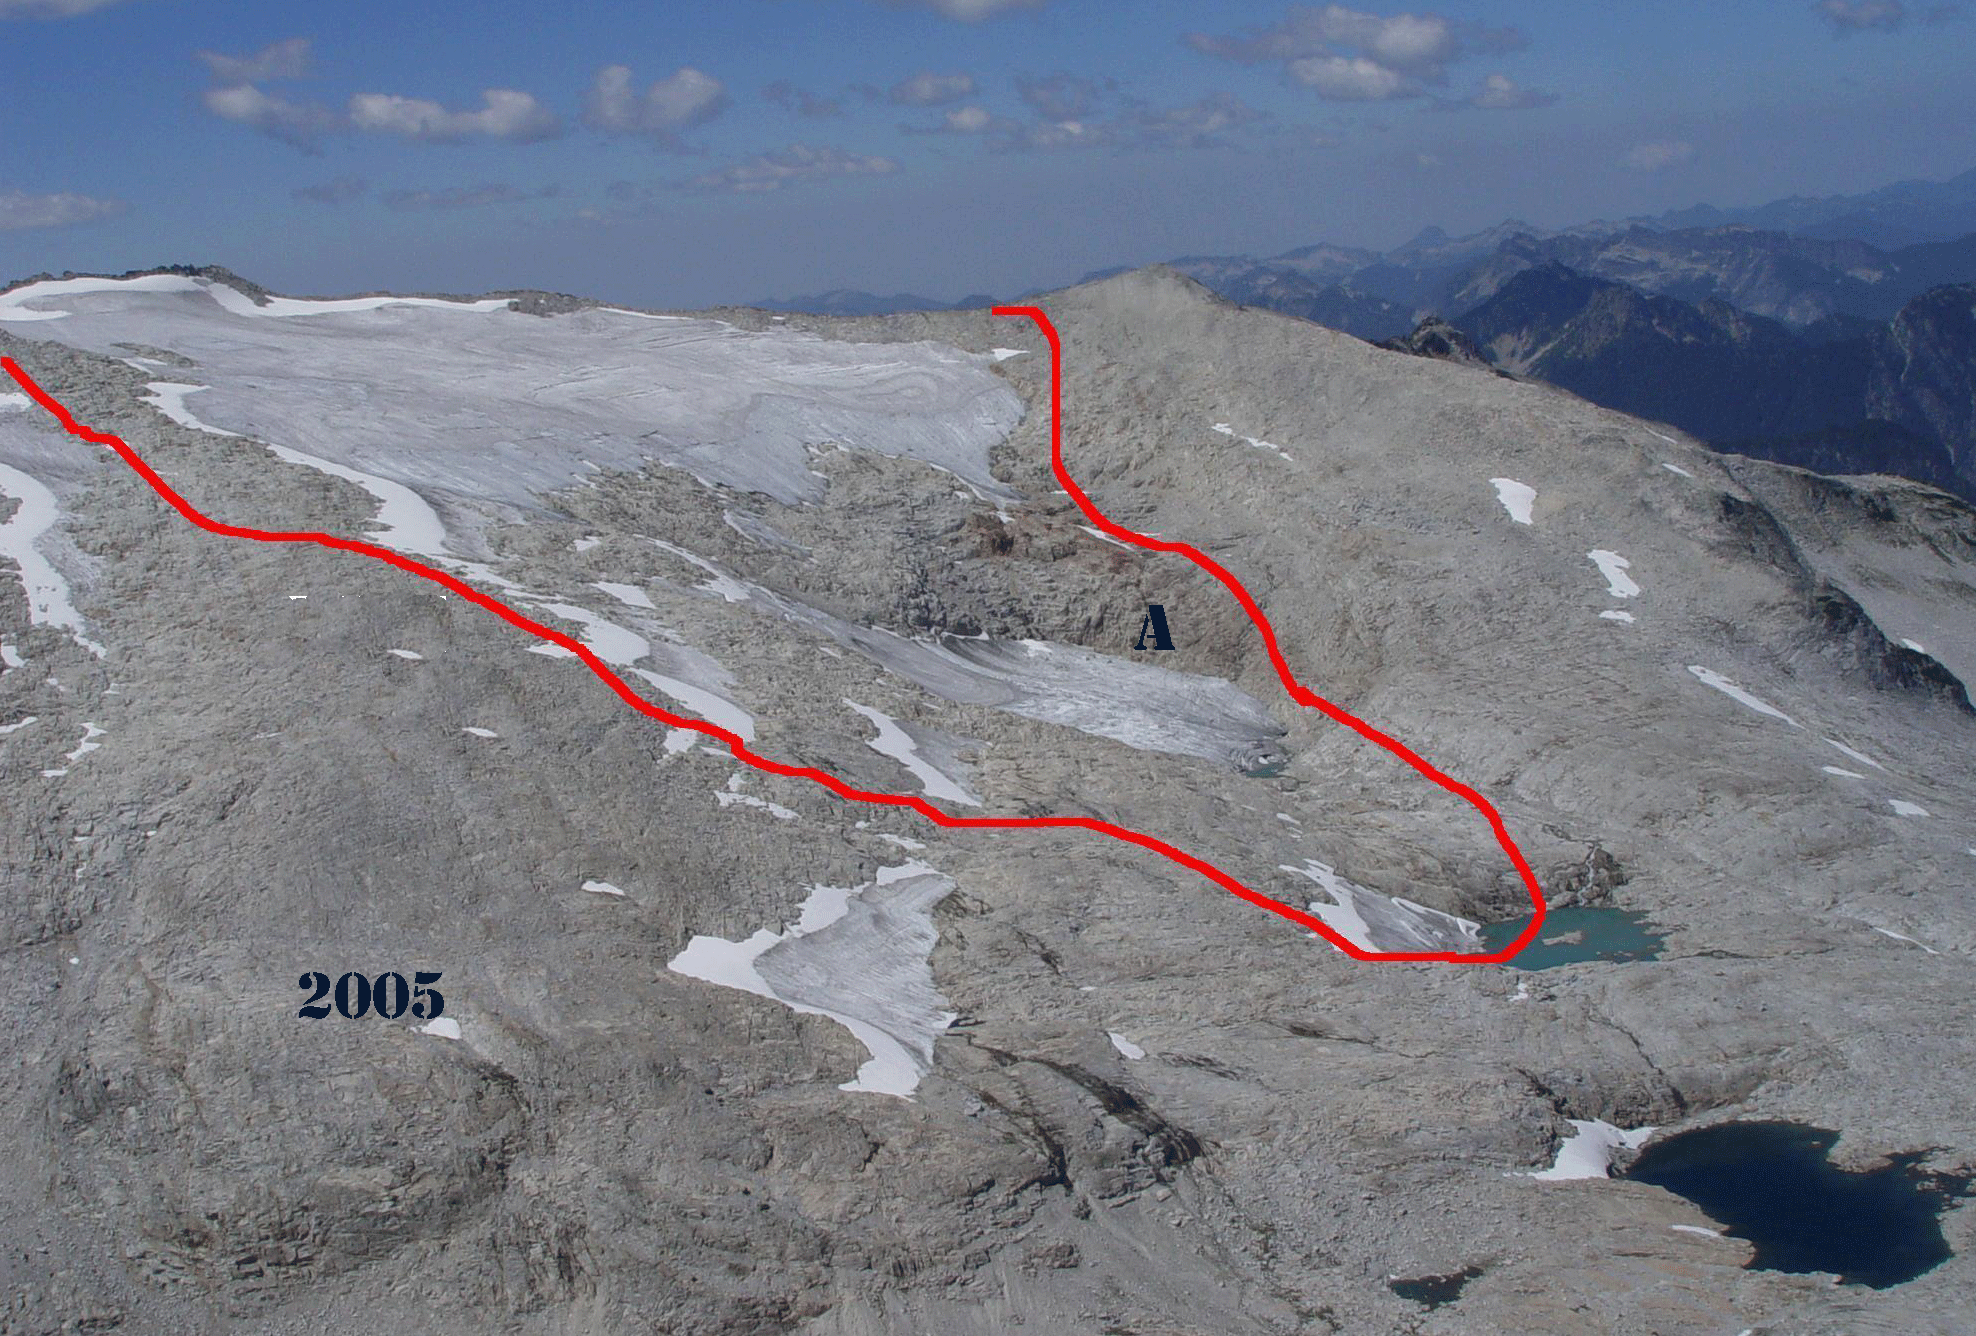
By 2005 the glacier had separated into several segments and lost 30% of its area in the last 15 years.  The terminus lobe was now detached.  There is also no snow left.

foss96

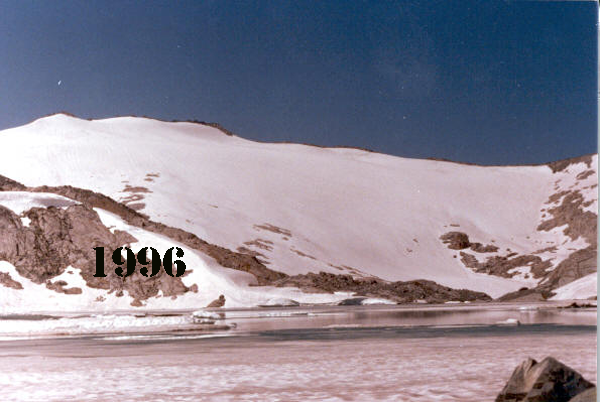
1996 View of Foss Glacier across Pea Soup Lake

foss glacier 07

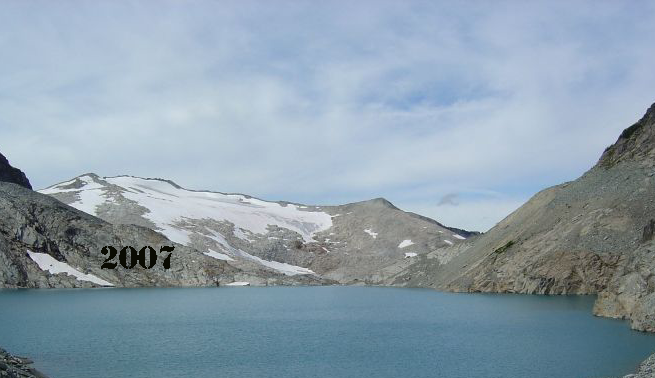
2007 View of Foss Glacier across Pea Soup Lake

foss 2015ov

2015 view of Foss Glacier from Mount Daniel. 


Skykomish River, Washington Reduced Minimum River Flow and Glacier Retreat

sky headwaters

Fording the outlet of Blanca Lake, headwater North Fork Skykomish River.

The focus this spring has been on the developing drought in Washington as a result of record low snowpack, the winter was a record warmth though not dry. The focus of this article is on another component of many alpine watersheds, glacier runoff, both the ameliorating role and their reduced ability as they shrink to augment flow during low flow periods. Glaciers act as natural reservoirs storing water in a frozen state instead of behind a dam. Glaciers modify streamflow releasing the most runoff during the warmest, driest periods of summer, when all other sources of water are at a minimum. Annual glacier runoff is highest in warm, dry summers and lowest during wet, cool summers. This is the first of two posts looking at the response of specific alpine watersheds to glacier change and glacier runoff, the second will look at the Nooksack River.

Watersheds in mountainous Pacific Northwest are comprised of pluvial, nival and glacial segments. The pluvial segments have peak flows in the winter due to the winter storm events (Dery et al., 2009). Nival streams peak in the May and June with the high snowmelt, and glacially fed streams peak in July and August during peak glacier melt (Pelto, 2008; Dery et al., 2009). The loss of glaciers from a watershed then reduces streamflow primarily during minimum flow periods The amount of glacier runoff is the product of surface area and ablation rate. The glacier retreat and loss of glacier runoff has been quite pronounced in the Skykomish River Basin, North Cascades, Washington from 1950-2014 (Pelto, 2011). This summer we will return to make observations on 4 glaciers in this watershed for the 32nd consecutive year.  We will be measuring flow with the Nooksack Indian Tribe again this year below glaciers, and we will observe the drought impact on the glaciers and downstream.

skybasemap

Skykomish Basin Map-Light blue arrows indicate the four main glaciers: 1=Columbia, 2=Hinman, 3=Foss, 4=Lynch

An analysis comparing USGS streamflow records for the Skykomish River at Gold Bar for the 1950-1985 to the 1985-2009 period indicates that during the recent period the Skykomish River summer streamflow (July-September) has declined 26% in the watershed, spring runoff (April-June) has declined 6%, while winter runoff (November-March) has increased 10% (Figure 1). The reduction of the glacial melt component augmenting summer low flows is already resulting in more low-flow days in the North Cascade region. In the Skykomish River watershed from 1958-2009 glacier area declined from 3.8 km2 to 2.1 km2, a 45% decline (Pelto, 2011). Columbia, Foss, Hinman and Lynch Glacier, the primary glaciers in the basin, declined in area by 10%, 60%, 90% and 35% respectively since 1958. Annual mass balance measurements completed from 1984-2009 on Columbia, Foss and Lynch Glacier indicate a mass loss of 13.1 m w.e. Despite 15% higher ablation rates during the 1985-2009 period, the 45% reduction in glacier area led to a 38% reduction glacier runoff between 1958 and 2009. This means less glacier runoff in late summer.

fig 3 esc

Change in seasonal discharge in the Skykomish River. Increase in winter, decrease in summer.

Slide9
Foss Glacier retreat.

Slide3

Lynch glacier Retreat

Slide8

Hinman Glacier, view from former terminus

Slide15
Columbia Glacier losing its snowcover in the accumulation zone.
Slide12
Columbia Glacier Retreat. Detailed report. 

A key threshold of in-stream flow levels considered insufficient to maintain short term survival of fish stocks is below 10% of the mean annual flow (Tennant, 1976). For the Skykomish River 10% of mean annual flow is 14 m3s-1. In the Skykomish River from 1950-2013 there have been 230 melt season days with discharge below 14 m3s-1. Of these 228, or 99% of the low flow days, have occurred since 1985. The loss of 30-40% of the glacier runoff is a key reason for the onset of critical low flow days. Of more concern for aquatic life is the occurrence of extended periods of low flow (Tennant, 1976). From 1929-2009 in the Skykomish River basin there have been eight years where streamflow dropped below 14 m3s-1 for 10 consecutive days during the melt season, 1986, 1987, 1992, 1998, 2003, 2005, 2006 and 2007.  It is likely that 2015 will join this list.

skymin

Number of days when flow fell below 10% of the long term mean annual flow. Only one day from 1950 to 1985 met this criteria. Precipitation has not declined substantially during this interval, hence earlier snowmelt, reduced glacier runoff and greater evapotranspiration must be causing the increase in late summer low flow periods. The 38% reduction in glacier runoff did not lead to a significant decline in the percentage summer runoff contributed by glaciers under average conditions; the contribution has remained in the range of 1-3% from July-September. The glacier runoff decline impacted river discharge only during low flow periods in August and September. In August, 2003 and 2005 glacier ablation contributed 1.5-1.6 m3s-1 to total discharge, or 10-11% of August discharge. While declining glacier area in the region has and will lead to reduced glacier runoff and reduced late summer streamflow, it has limited impact on the Skykomish River except during periods of critically low flow, below 14 m3s-1 when glaciers currently contribute more than 10% of the streamflow.

For 2015 the lack of snowpack in the Skykomish Basin is evident from a comparison of images from April 20th 2015 and June 4th, 2014. Snowpack during 2014, an average winter, was higher in mid-June than in mid-April in 2015. Arrows in each side by side are in same location. This indicates that the pluvial and nival segment of flow to the Skykomish River will be at a minimum late this summer. Currently flow at the USGS gage in Gold Bar is 28% of normal at 2050 CFS, which is an all time low for the record that begins in 1929, previous low in 1977 at 2755 CFS. The river has not reached 2750 CFS the entire month of May. Glacier flow has continued to decline with area extent losses. This combination makes it likely, that the Skykomish River will have an extended period of low flow this summer and into the fall. If the summer is drier than average, flows will likely reach a new minimum.
blanca lake compare
Snowpack comparison in the area of the North Fork Skykomish near Columbia Glacier (C) in April 2015 compared to a snowier June, 2014.
south fork compare
Snowpack comparison in the area of the South Fork Skykomish near Lynch Glacier (D) in April 2015 compared to a snowier June, 2014.
columbia2012
Terminus image of Columbia Glacier in March 2015 (below) with less overall snow than in the image above from August, 2013. (picture below from Rowan Stewart)
columbia terminus march