Freemanbreen, Svalbard Retreat Leads to Island Formation

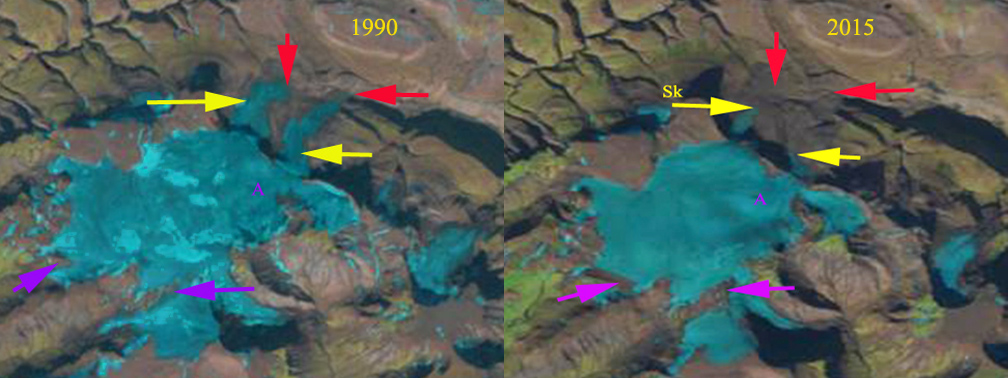
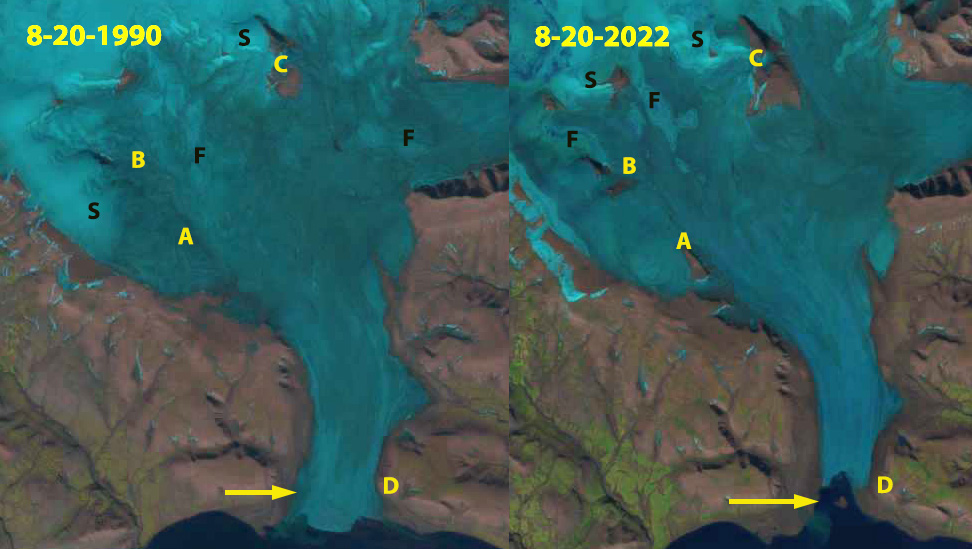
Freemanbreen in 1990 and 2022 Landsat images.  Both are years with limited retained snowcover (S) and some area of retained firn (F). The glacier has retreated from a new island that had formed at Point D. At Point A-C glacier melt and resultant thinning has exposed and expanded bedrock areas.

Freemanbreen is the primary southern outlet glacier of the icecap that dominates Barentsøya, Svlabard. Here we examine Landsat imagery from 1990-2022 to illustrate the the impact of climate change on this glacier. Dowdeswell and Bamber (1995) report that Freemanbreen last surged in 1956 and has retreated since, and that most of its bed is above sea level. Morris et al (2020) note a thinning rate of -0.6 m/year for the area from 2011-2017 that is driven by atmospheric temperature and sea surface temperature warming.

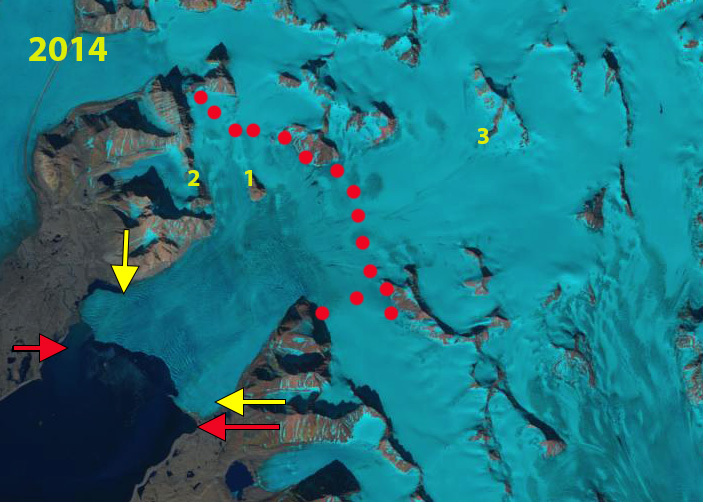
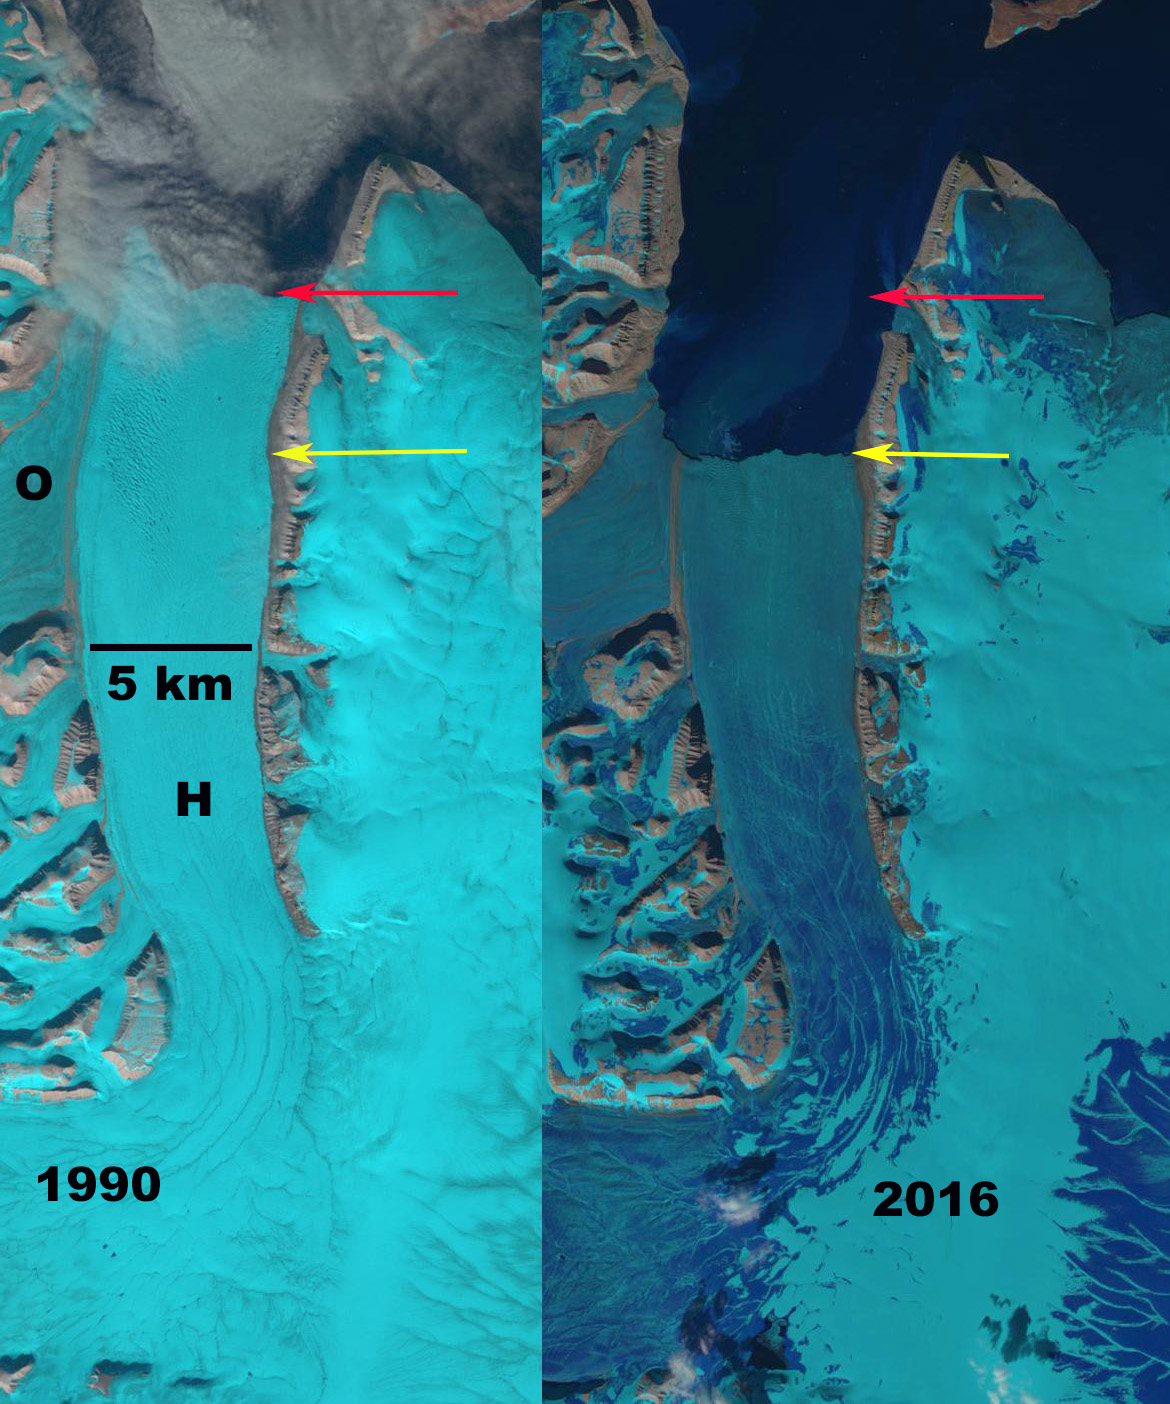
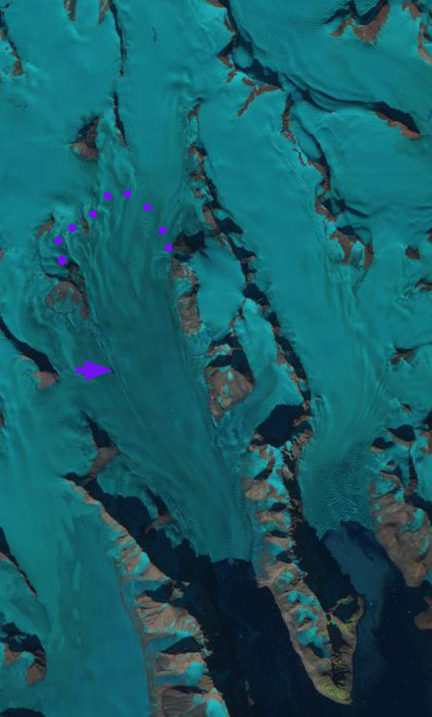
In 1990 Freemanbreen experienced a year of extensive melt with limited retained snowpack (S), there is some retained firn which does retain some percolating meltwater from the snowpack. The glacier extended beyond its fjord ending in a convex tidewater front in Freeman Sound. By 2010 the glacier had retreated into the fjord and was pinned on an island in the center of the fjord. By 2013 the glacier had pulled back from the island and the terminus has since developed a concave terminus front. In 2022 the glacier has retreated 800 m from the island  (Arrow-Point D) and 1.8 km from its 1990 position. The tidewater front has been reduced from 2.8 km to 1.3 km. The reduction in calving has not offset the increase in glacier melt resulting in continued retreat. The surface melt has led to surface thinning and the expansion or exposure of bedrock areas amidst Freemanbreen at Point A-C. In 2022 the glacier experienced another summer of extensive melt, likely the most extensive melt in the region in at least the last 50 years (Climato-Liege University).  This left the glacier largely bare of snowpack, with less than 5% snowcover in the area above 500 m near Point C and limited retained firnpack from previous years note NW of Point B. The ice cap summit is in the 600 m range. This loss is similar but not as complete as obseved on the ice caps of Edgeøya.

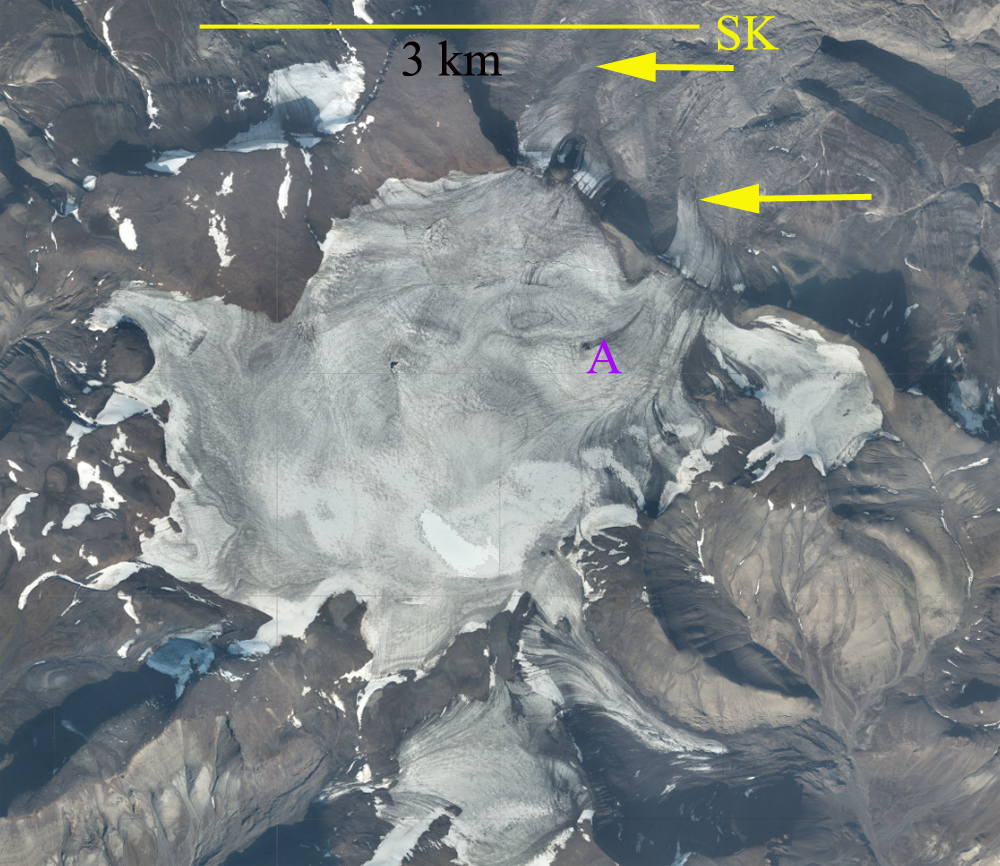
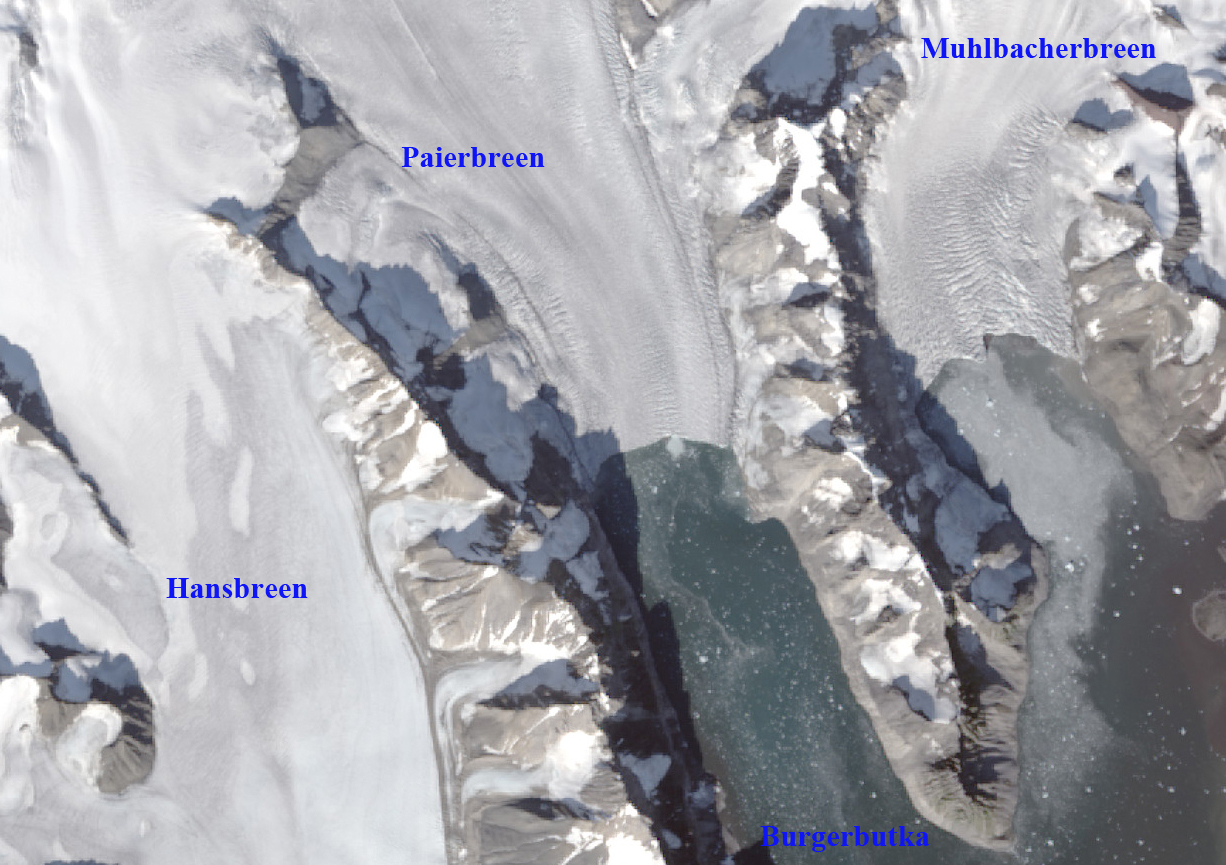
Left image aerial photograph from TopoSvalbard, at right Sentinel 2 image from 2022. Island indicated by arrow.

Freemanbreen surface conditions in Sentinel image from 8-19-2022, snow cover (S), Firn Cover (F.)

Austre Torellbreen, Svalbard Retreat and Nunatak Expansion

Austre Torellbreen in 2000 and 2019 Landsat images.  Red arrow is the 2000 terminus location, yellow arrow the 2019 terminus location. Point 1,2 and 3 are nunatak areas that are expanding.

Austre Torellbreen is an outlet glacier on the southwest coast of Svalbard.  It is just west of calving glacier that are retreating such as Paierbreen and Samarinbreen and adjacent to the land terminating Nannbreen. Blaszczyk et al (2008) report the velocity of Austre Torellbreen near the calving front of 220-265 m/year. Nuth et al (2013) determined that the glacier area over the entire archipelago has decreased by an average of 80 km per year over the past 30 years, a 7% reduction.

In 2000 the calving front is 4.7 km wide and has a low slope at the terminus with the surface reaching 150 m 2.5 km from the calving front.  The calving front is at a point where the embayment widens upglacier and has outwash plains on either side of the margin. The snowline is at 300 m in 2000.  At Point 1 is an isolated nunatak and at Point 2 and 3 are limited ridges extending from nunataks. By 2014 the glaciers western margin has retreated into the widening embayment, with more limited retreat in the center and eastern margin of the glacier.  By 2019 the Austre Torellbreen western margin has retreated 2400 m, while the eastern margin has retreated 800 m. The terminus has narrowed to 4.2 km and is retreated from an area of low slope margins to a location between two peak Brattho and Raudfjellet. There is an area of extensive crevassing at the current calving front, suggesting that further calving retreat will occur. At Point 1 the nunatak has expanded in area and vertical relief. At Point 2 the ridge that was separated in two segments has joined into a single ridge.  At Point 3 the ridge has extended by 500 m and has a greater relief in 2019.  The nunataks and mountain ridges that are amidst and adjacent to Austre Torellbreen can be seen to emerge and expand from 2000 to 2019 as the glacier thins.  This thinning leads to the retreat that is enhanced by calving.


Austre Torellbreen in TopoSvalbard map from circa 2000 and in a visual image from 2014.

Austre Torllbreen in 2014 Landsat image. Red dots indicate the snowline at 350 m.

Hinlopenbreen, Svalbard 7 km Retreat 1990-2016.

Hinlopenbreen, Svalbard in 1990 and 2016 Landsat imagery.  red arrow is 1990 terminus, yellow arrow is 2016 terminus,and Oslobreen is noted by Point O

Hinlopenbreen is a large tidewater glacier in northern Svalbard.  The glacier has a periodic history of surging, with the last surge occurring in 1970 (Nuth et al 2010). The glacier has the largest negative balance of -0.58 m/year from 1965-2005 (Nuth et al 2010).   The mass loss is ongoing including thinning on the upper glacier, which should be a build up period on a surge glacier.   Here we examine changes from 1990-2016 in Landsat images.

In 1990 Hinlopenbreen extended north terminating adjacent to a small tributary from the east, red arrow.  On the west side the terminus extended past the northern margin of Oslobreen (O) to a small tributary from the west.  The meltwater network is evident, though not as mature as in 2016. By 2016 the terminus has retreated 7 km south of the eastern tributary and several kilometers south of the northern edge of Oslobreen  merging from the west. The terminus of Hinlopenbreen is 5.6 km wide, exclusive of Oslobreen.  The width remains consistent for 10 km upglacier of the calving front. The retreat from 1990-2016 occurring two decades after the last surge is also indicative of a climate driven retreat not surge driven response. A surge driven retreat would feature accumulation zone thickening, such as noted by Murray et al (2012).  The meltwater network in 2016 indicates water flow through saturated firn, green arrows. The bare glacier ice is further down glacier.  Some of this meltwater will refreeze and not escape the glacier.  The snowline marks the region where the firn/snow is not saturated.  This is another glacier where we have to question whether a future surge is possible, as is the case at Fridtjovbreen.  The retreat of Hinlopenbreen Glacier is similar to that of most tidewater glaciers in Svalbard such as,  Paierbreen, Hornbreen and Svitjodbreen   Nuth et al (2013) determined that the glacier area over the entire archipelago has decreased by an average of 80 km2 per year over the past 30 years, a 7% reduction. 

Hinlopenbreen, Svalbard in TopoSvalbard aerial imagery.  red arrow is 1990 terminus and yellow arrow is 2016 terminus.

Hinlopenbreen, Svalbard in TopoSvalbard map, blue arrow indicate flow direction.  

August 20-16 Landsat imagery with the saturated firn in darker blue with meltwater channels evident. 

Frostisen Ice Cap Svalbard, Ongoing Defrosting 1990-2015

frostisen compare

Frostisen Ice Cap in 1990 and 2015 Landsat images.  Red arrow is the 1990 terminus location, yellow arrow the 2015 terminus location.  Purple arrows indicate thinning on the upper margin of the ice cap, and the letter A indicates an outcrop of rock emerging through the ice.

Frostisen is an ice cap in Dickson Land of Central Svalbard.  The World Glacier inventory of 1960 listed the area of the ice cap at 19 square kilometers, by 2007 the Randolph Glacier Inventory indicated the ice cap area at 13.4 square kilometers.  Malecki (2013) examined seven glaciers in this region and found an acceleration in losses from 1990-2011 compared to 1960-1990 due to an increase in summer temperature post-1990 which led to higher annual equilibrium line altitudes.  The seven glacier lost 39% of their volume from 1960-2009. Here we compare 1990 and 2015 Landsat images to indicate changes in the ice cap . Malecki (2013) also noted evidence of a rapid increase in thinning rates in the upper parts of the studied glaciers, linked to decreasing albedo in former accumulation zones.

In 1990 two outlet glaciers on the east side of the icefield, Skandalsbreen and Studentbreen, after dropping over a prominent sill at 475 m extended approximately 2 km downvalley.  At Point A there is no sign of bedrock. There are limited snowpatches 10% of the ice cap with three weeks left in the melt season. In 2015 the eastern outlet glaciers have a limited extent after descending the sill, Skandalsbreen has retreated 975 m and Studentbreen 1300 m since 1990.  At Point A bedrock has emerged, this is easier seen in the image below. This is an indication of thinning in the midst of what should be the accumulation zone.  In 2013 and 2015 and many other years the ice cap has lost all of its snowcover indicating it has no accumulation zone and cannot survive (Pelto, 2010). The purple arrows indicate thinning at the upper margin of the glacier near 650 m, this would not happen if this area was acting as an accumulation zone. Nuth et al (2013) noted a 7% loss in glacier area in the last 30 years in Svalbard. The tidewater glaciers of Svalbard get most of the attention, but Frostisen like other inland terminating glaciers such as Belopolskijbreen is losing volume rapidly. .

frostisen image

TopoSvalbard satellite view above and map view below of Frostisen Ice Cap.  The maximum elevation of 650 m has been below the regional snowline many recent years. 

frostisen map

Paierbreen Rapid Calving Retreat, Svalbard

paierbreen compare
1990 and 2014 Landsat images indicating Paierbreen (P), Muhlbacherbreen (MU) and Hansbreen (H). The red arrow and red dots indicate the 1990 terminus location and yellow arrows and yellow dots the 2014 terminus location. The purple arrow indicates the location of a supraglacial lake that was persistent in the 1990’s but is no longer evident in 2013, 2014 and 2015.

From 1990 to 2014 all four of the glaciers terminating along the north coast of Hornsund have retreated significantly: Hansbreen (H), Paierbreen (P), Muhlbacherbreen (MU), Storbreen. Svalbard is host to 163 tidewater glaciers with a collective calving front of 860 km (Błaszczyk et al, 2009). Nuth et al (2013) determined that the glacier area over the entire archipelago has decreased by an average of 80 km2 per year over the past 30 years, a 7% reduction. In the most recent period 1990-2007, terminus retreat was larger than in an earlier period from 1930-1990, while area shrinkage was smaller. Hornsund is a fjord that in 2014 almost cuts through the southern Island of Svalbard. The Institute of Geophysics Polish Academy has maintained a Polish Research Station in Hornsund since 1957.  The 1984 map, from the University of Silesia, of the glaciers and geomorphology document the extent of the glaciers in 1983. A more detailed examination by the same researchers, Blaszczyk et al. (2013) reported the total area of the glacier cover lost in Hornsund Fjord area from 1899–2010 was approximately 172 square kilometers. This groups ongoing research, Petlicki et al (2015) , identified the impact of a waterline notch that enhances calving at Hansbreen. This study identifies the importance of water temperature and reduced sea ice cover in the fjord.

Paierbreen in 1990 terminated in Burgerbutka with a 1900 meter long calving front. At the purple arrow a supraglacial lake existed that is also seen in the TopoSvalbard Map. The snowline on Paierbreen is further upglacier of the calving front than for the adjacent glaciers indicating a lower surface slope. By 2014 the glacier has retreated 2200 m with the current terminus at a narrow point in the fjord.  Beyond this point the fjord again expands, which will enhance calving and retreat.  There is no significant step in glacier slope indicating where the tidewater limit is, given the low slope, it is not likely close to the current ice front.  The calving front is 1600 m wide in 2014. The supraglacial lake is only a sliver in 2013 and 2014. The snowline in the Landsat image from 2013 is at 450 m. The story of retreat here is the same as at Samarinbreen and Hornbreen
paierbreen 2013
2013 Landsat Image

paierbreen map
Topographic Map from TopoSvalbard

paierbreen aerial
Satellite Image from TopoSvalbard

Hornbreen-Hambergbreen Retreat Svalbard

Hornsund is a fjord that in 2010 almost cuts through the southern Island of Svalbard. The Institute of Geophysics Polish Academy have maintained a Polish Research Station in Hornsund since 1957. The 1984 map, from the University of Silesia, of the glaciers and geomorphology document the extent of the glaciers in 1983. At that time the eastern end of Hornsund was fronted by a single glacier terminus comprised of the Sotrbreen (ST), Hornsbreen (HO), Svalisbreen (SV) and Mendelejevbreen (ME). By 2010 retreat has led to the separation of these four glaciers. The top image is the map superimposed on the Landsat image both below, from commenter Andylee. Pälli et al (2003)in a joint University of Oulu, Finland and University of Silesia noted that Hornbreen has retreated by 13.5 km from the central part of the front, and Hambergbreen (HA) by 16km from 1901-2000. As part of this project surveys of the basal topography beneath the glaciers was examined.
Moore et al, 2003) found that there is not a below sea level connection underneath the Hornbreen-Hamberbreen divide that would separate Sorkappland from Torrelland. The ice divide of Hornbreen-Hambergbreen is below the local snowline at 300 m and Pälli et al (2003) indicate that this connection cannot survive current climate. Kvamstø et al (2011) in a Bergen University led study noted the melt season had increased by more than two weeks in Svalbard from 192-2010. In 1983 the distance from the terminus of the Hornbreen to the terminus of Hambergbreen was 17 km. In 2010 the distance is 9 km, as seen below. . A comparison of locations in the 1983 map and the 2010 Landsat image indicate the retreat from 1983 to 2010 has been approximately 5.5 km for Storbreen, 6 km for Hornbreen, 3 km for Svalisbreen and 1.5 km for Mendelejevbreen. . The retreat of the glaciers at the head of Hornsund follow the pattern of other glacier in the region Nannbreen and Hansbreen.

Retreat of Nannbreen, Svalbard

Nannbreen is a 5 km long land terminating glacier in southwest Svalbard. The glacier is just north of Hornsund. During the course of the 20th century Nannbreen retreated from its Little Ice Age moraine complex forming a new proglacial lake. The glacier ends at an elevation of 150 meters descending from 600 meters, the snowline in several Landsat images from the last decade has been 400-450 meters. By 2000 (first image below)the glacier had retreated 750 meters from the moraine complex and the glacier ended in a lake, that was over 500 meters long. In 2010 (second image below) the glacier had retreated out of the lake, 250 meters of retreat in 10 years, 1000 meters of retreat in the last century. Certainly the 21st century retreat rate is far above the average 20th century retreat rate. Most of the large glaciers in Svalbard are tidewater calving glaciers, such as the nearby Hansbreen, which retreated 400 meters from 2000-2005. Svalbard glaciers have been losing considerable volume, indicative of negative mass balance and glacier retreat. Nuth et al (2010) concluded that over the past 40 years for Svalbard ice loss is 9.71 ± 0.55 cubic kilometers/year. This is an average thinning of 0.36 meters/year for an annual contribution to global sea level rise of 0.026 mm yr.