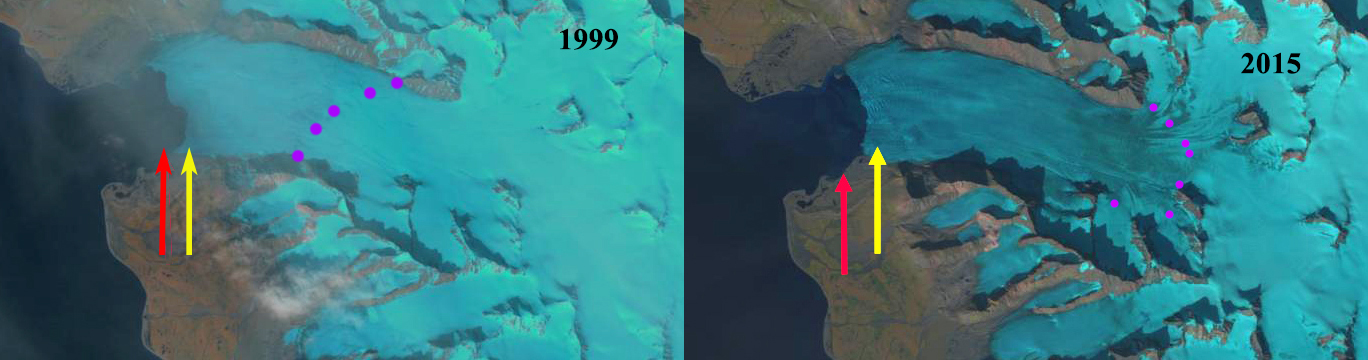
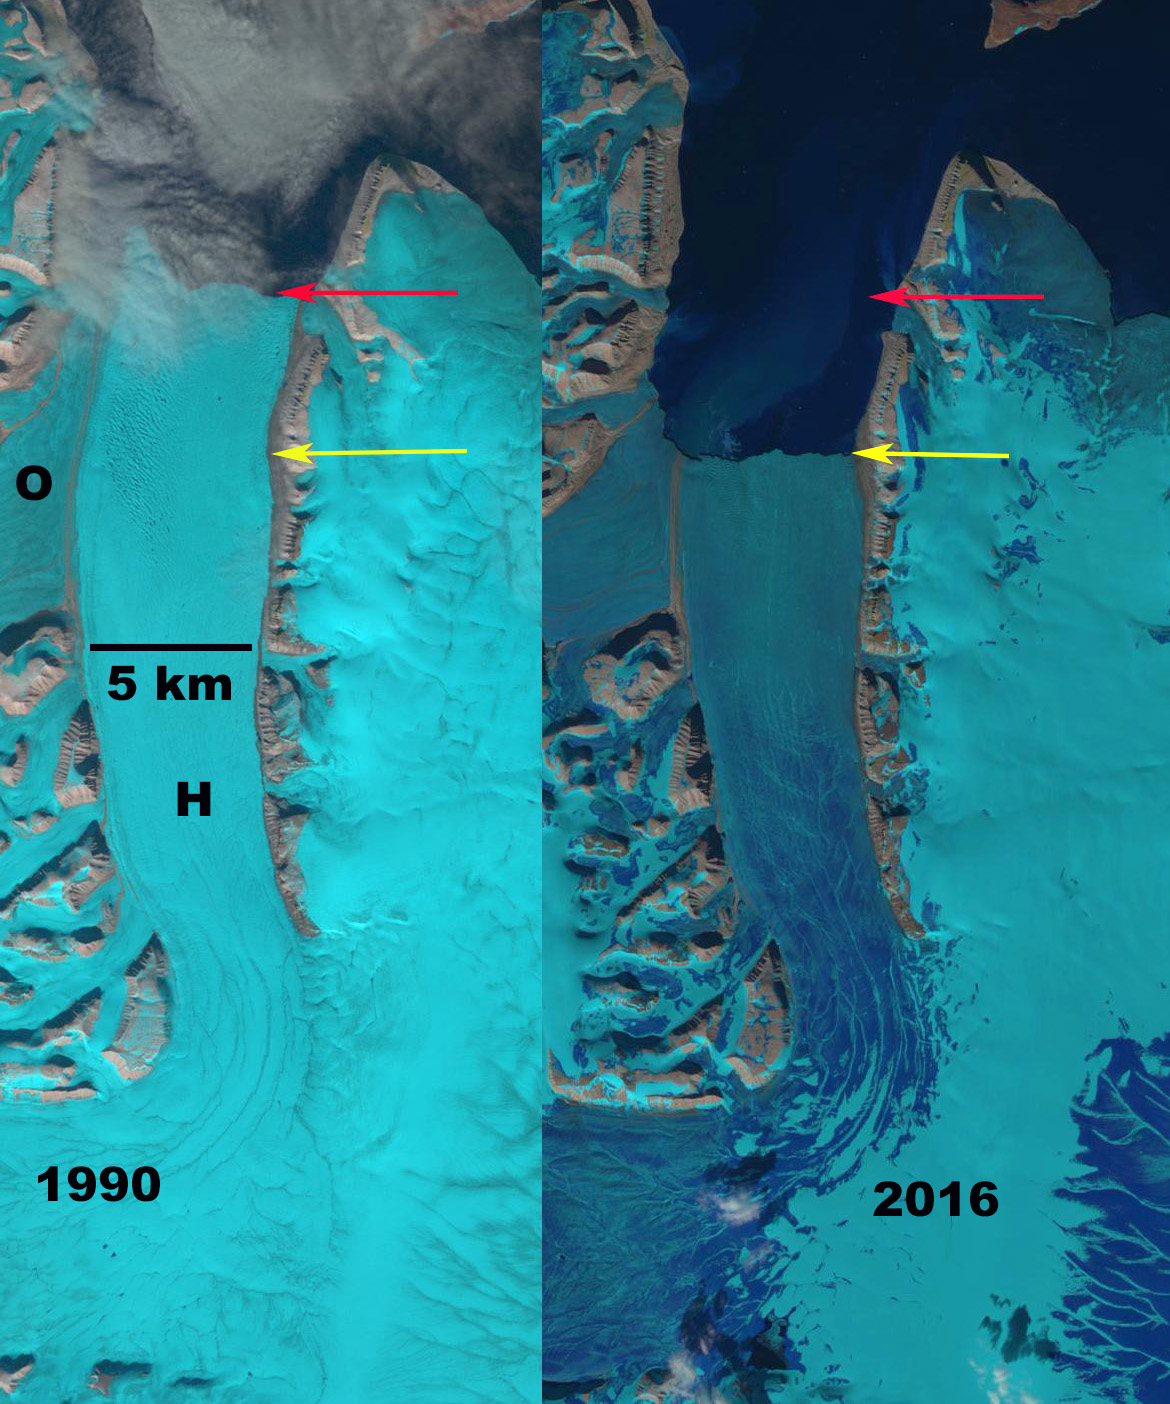
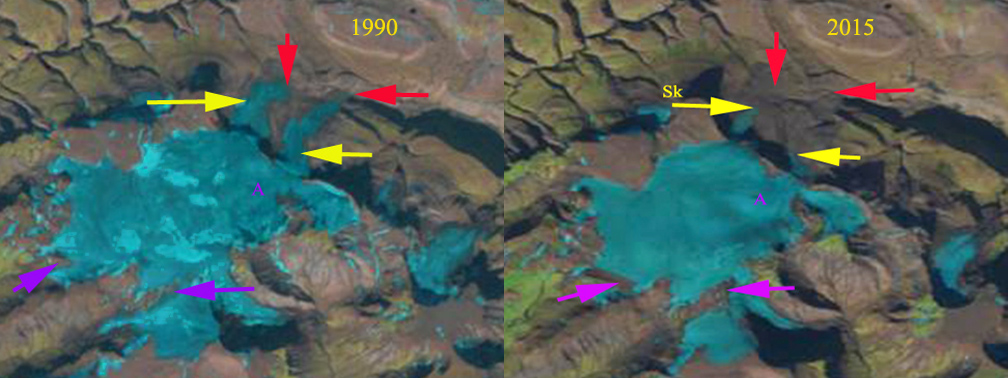
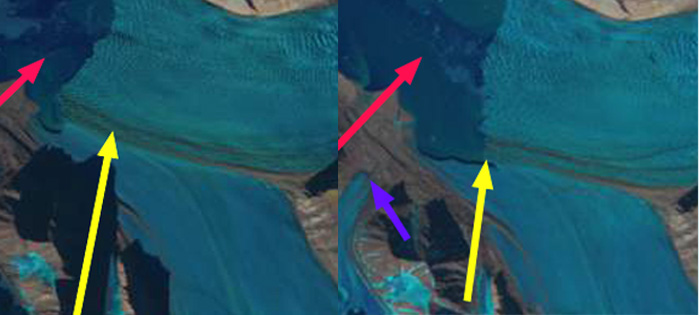
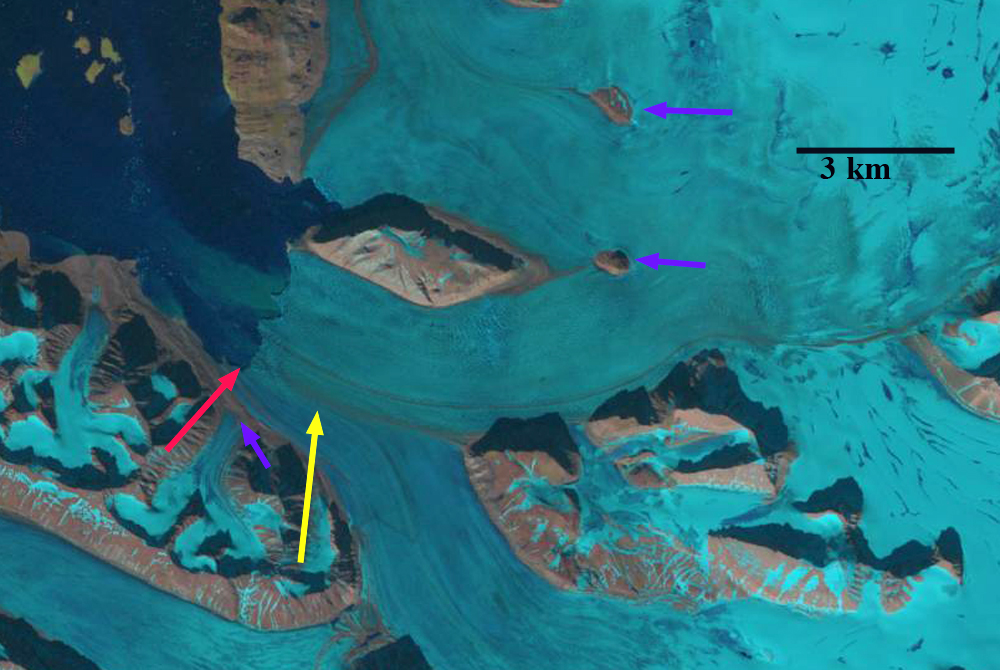
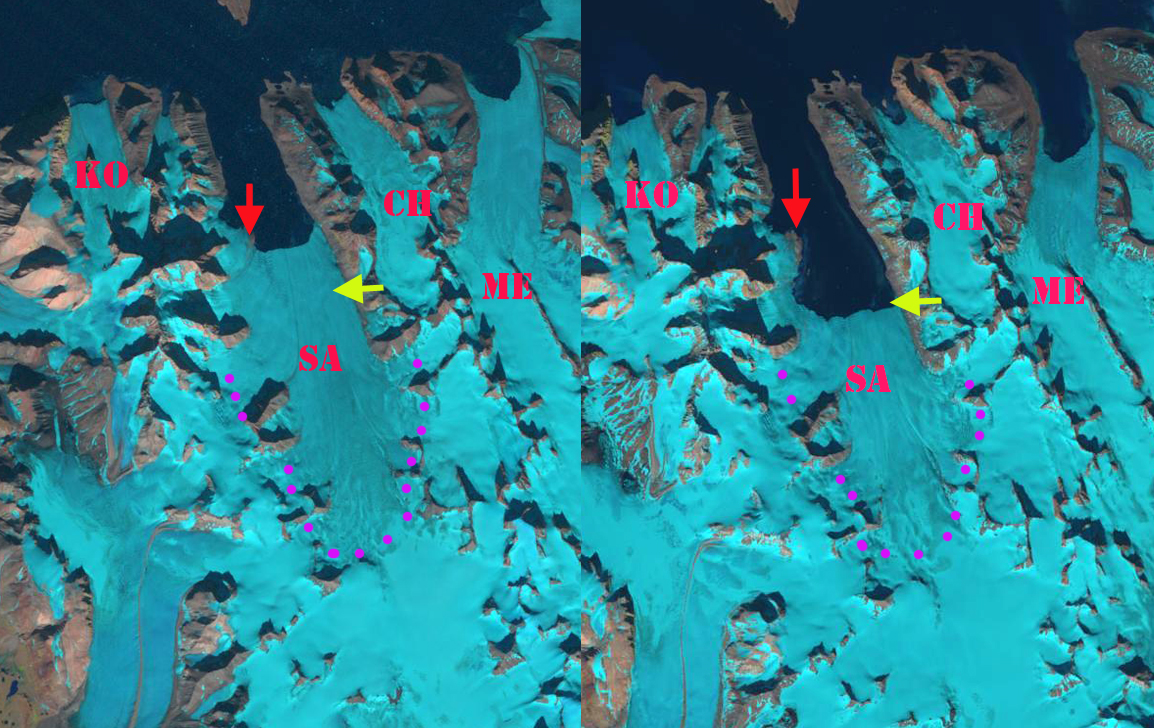
Response of Orasbreen (O), Glopeken (G) and Holmstrombreen (H) to climate change as indicated by 1995 and 2019 Landsat images. Red arrow is 1995 terminus, yellow arrow 2019 terminus, pink arrows a deepening supraglacial stream channel and purple dots the snowline.
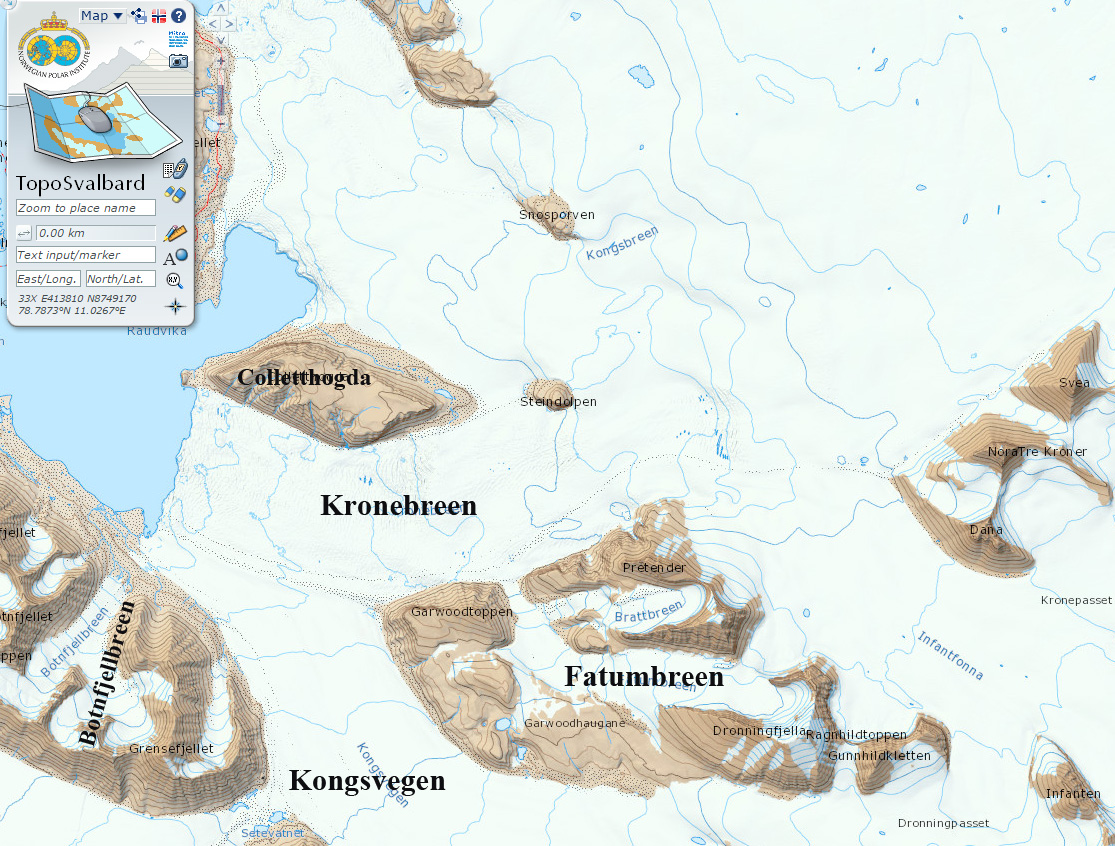
Orsabreen terminates in an expansing prolgacial lake, Trebrevatnet, that is shared with a glacier it has separated from Holmstrombreen. The glacier shares an accumulation zone with Kronebreen, a glacier that is experiencing rapid retreat, and is fast flowing (How et al 2017). The high discharge of Kronebreen indicates a high volume of accumulation above 650 m in the shared accumulation zone, the Holtedahlfonna. Nuth et al (2010) from 1965-2007 reported the mean mass balance of Svalbard glaciers, excluding Austfonna and Kvitøya, as −0.36 m yr−1 . They noted that Orsabreen had less volume loss −0.24 m yr−1 and did have an increase at higher elevation. Ruppel et al (2017) observed annual accumulation of 0.9 m w.e. at 1100 m on Holtedahlfonna from 2005-2015. Trebrevatnet expands both through glacier retreat and the melt out of ice cored moraine that comprises much of its margin, they observed 0.9 m of annual melt of the dead ice moraine areas (Schomacker and Kjaer, 2007).
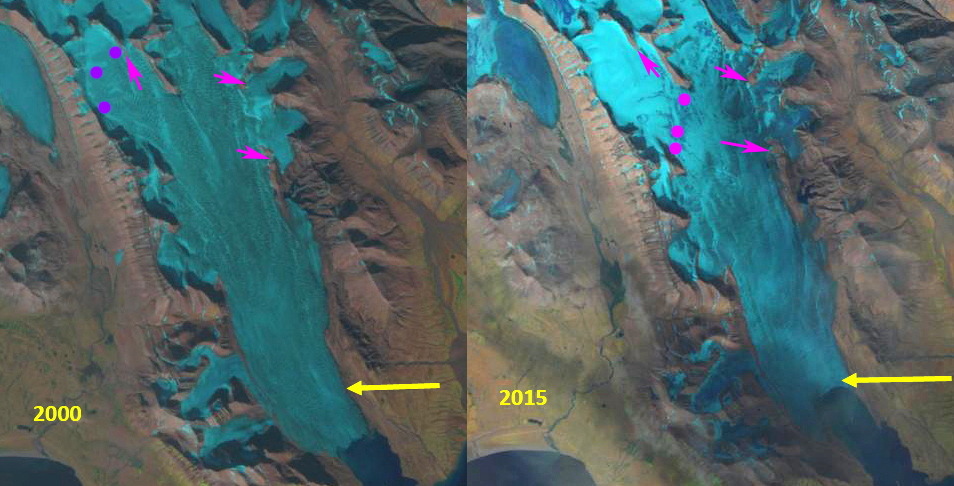
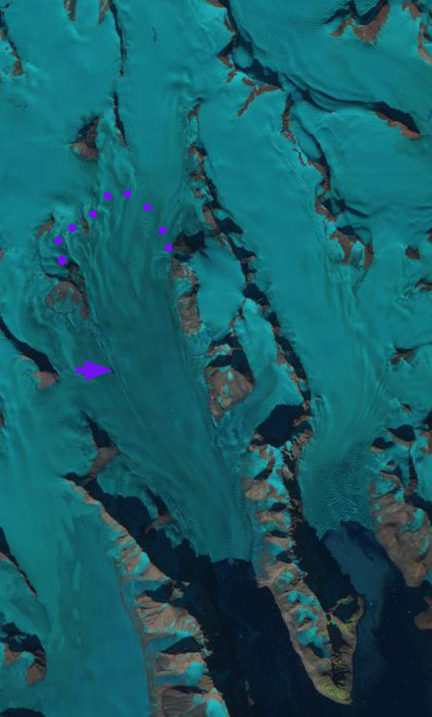
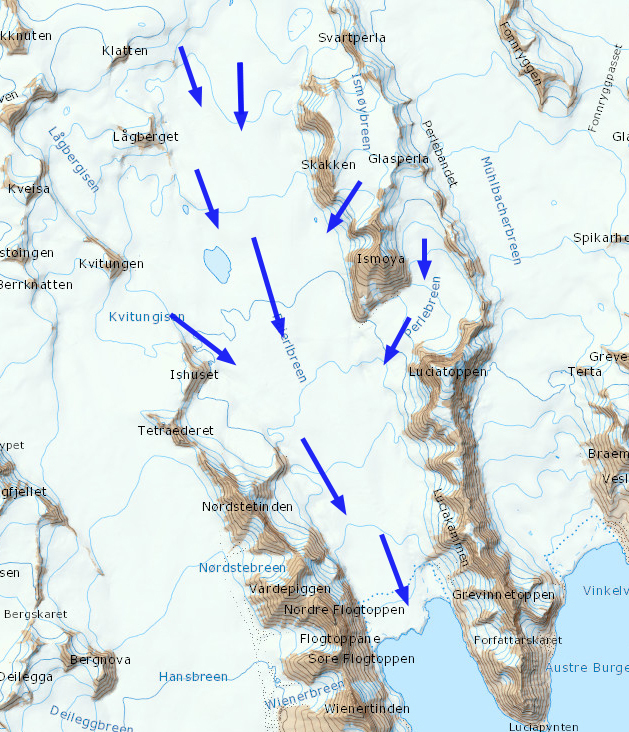
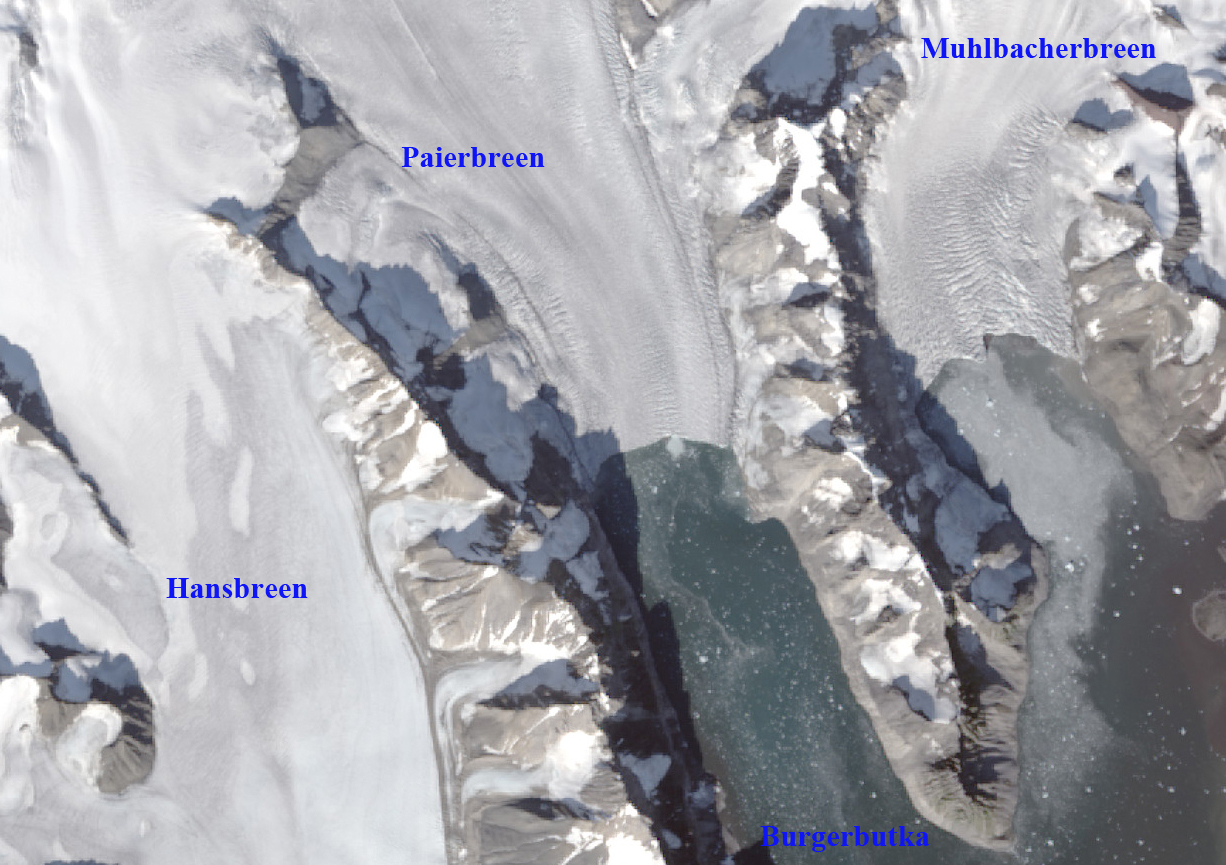
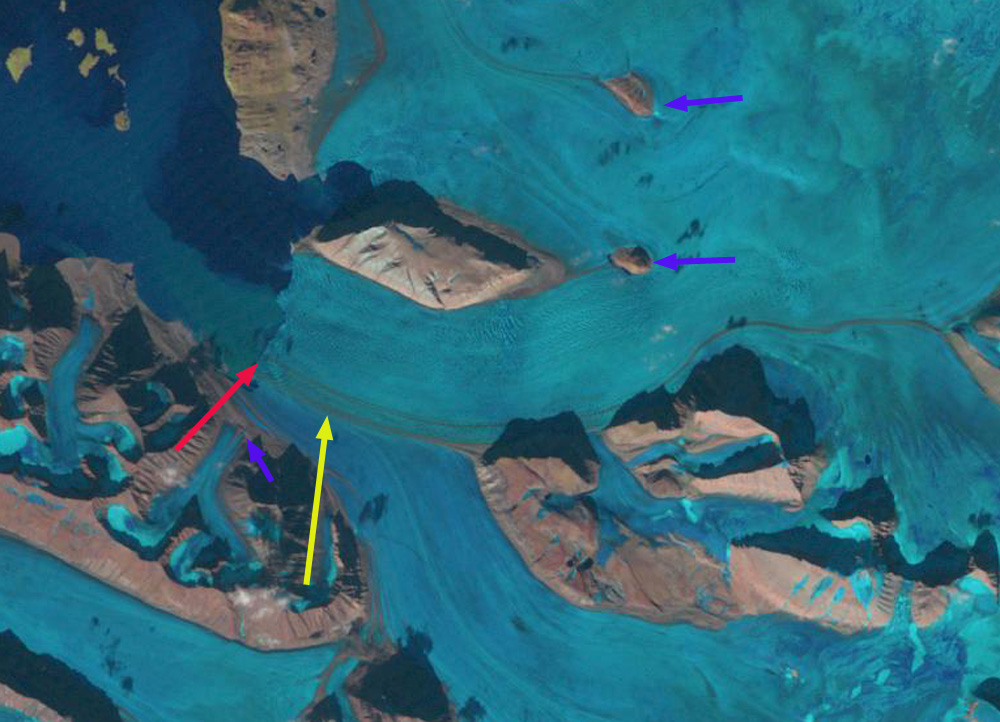
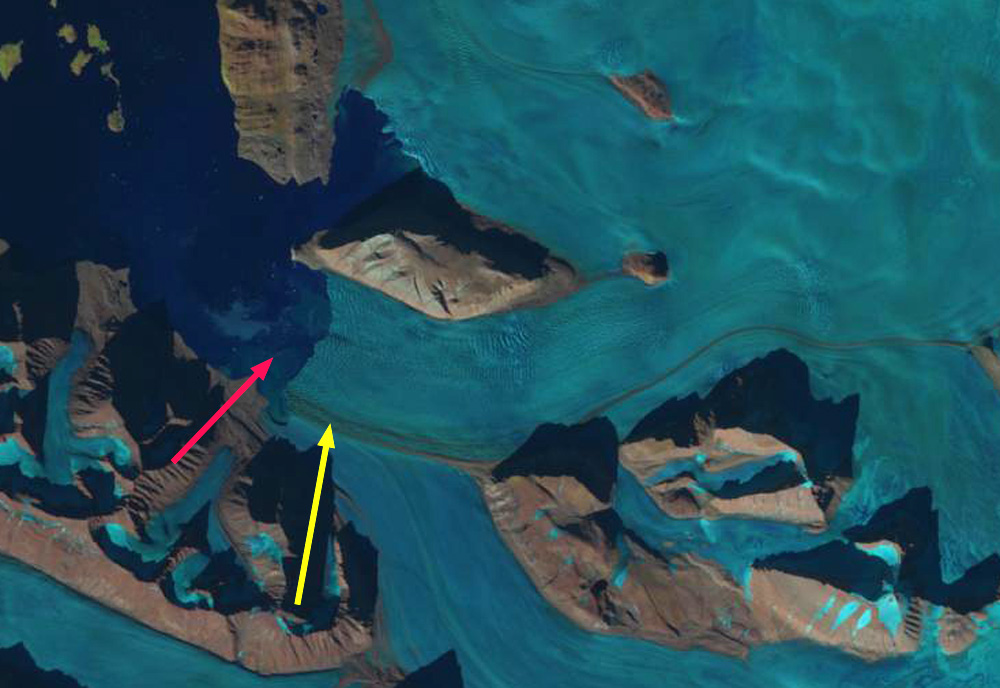
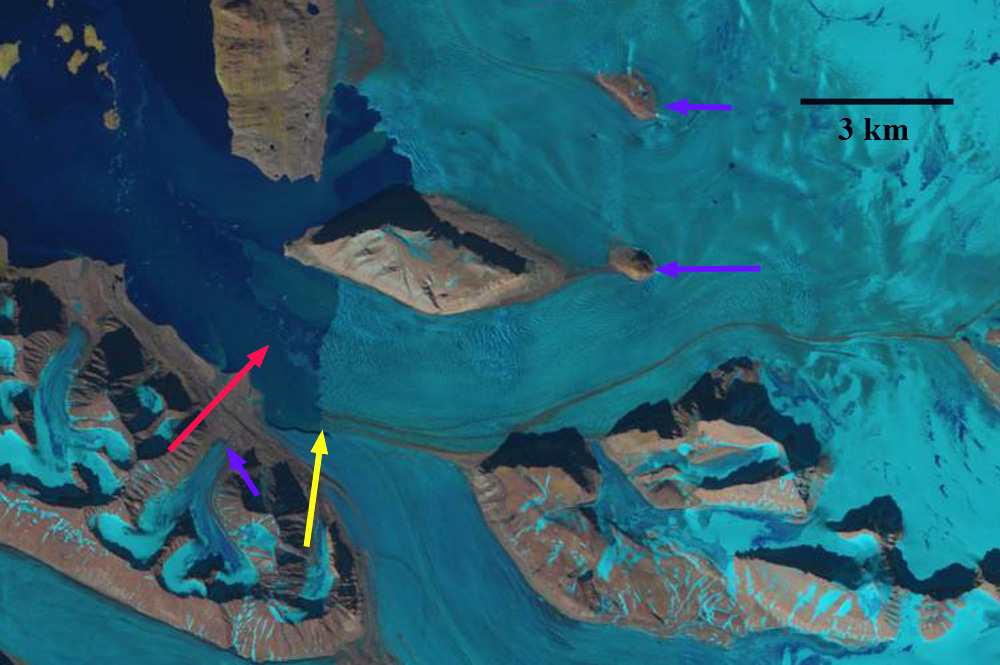
In 1995, Trebrevatnet has an area of 4.0 km2 the terminus of Holmstrombreen, Glopeken and Orsabreen merge, separated by medial moraines. In 2000 Holmstrombreen has retreated allowing Trebrevatnet to expand westward, while the medial moraine between Orsabreen and Glopeken still extends across the valley between Orsabreen and Trebrevatnet. The snowline in 2000 is at 550 m. In 2017 the snowline is at 600 m. Glopeken, Homstrombreen and Orsabreen have retreated into separate valleys. The medial moraine between Glopeken and Orsabreen has melted away. In 2019 the snowline is at 500 m, Trebrevatnet has expanded to an area of 13.5 km2, more than tripling in area. This is due primarily to the 2200 m retreat of Orsabreen. The moraine melt out has expanded the length of the lake from 2.3 km to 7.5 km. The thinning of the lower Holmstrombreen is evident by the deepening of the supraglacial stream indicated by the pink arrows in the 2000 and 2019 images. A closeup view of the terminus from TopoSvalbard from prior to 2010 indicates both a deeply incised supraglacial stream indicating relative stagnation of the terminus (purple arrows), extensive crevasses that have become rifts near the terminus (green arrows) and the ice cored moraine that is now gone, blue arrows. This portion of the glacier has now been lost. In 2019 the lowest 1 km of the glacier is relatively stagnant and poised to be lost. The tongue of the glacier below 550 m is too large to be supported by the smaller accumulation area above this feeding from the Holtedahlfonna. The retreat here is less than most of the tidewater glaciers in Svalbard such as Hinlopenbreen or Paierbreen, but similar to lake terminating glaciers like Gandbreen.
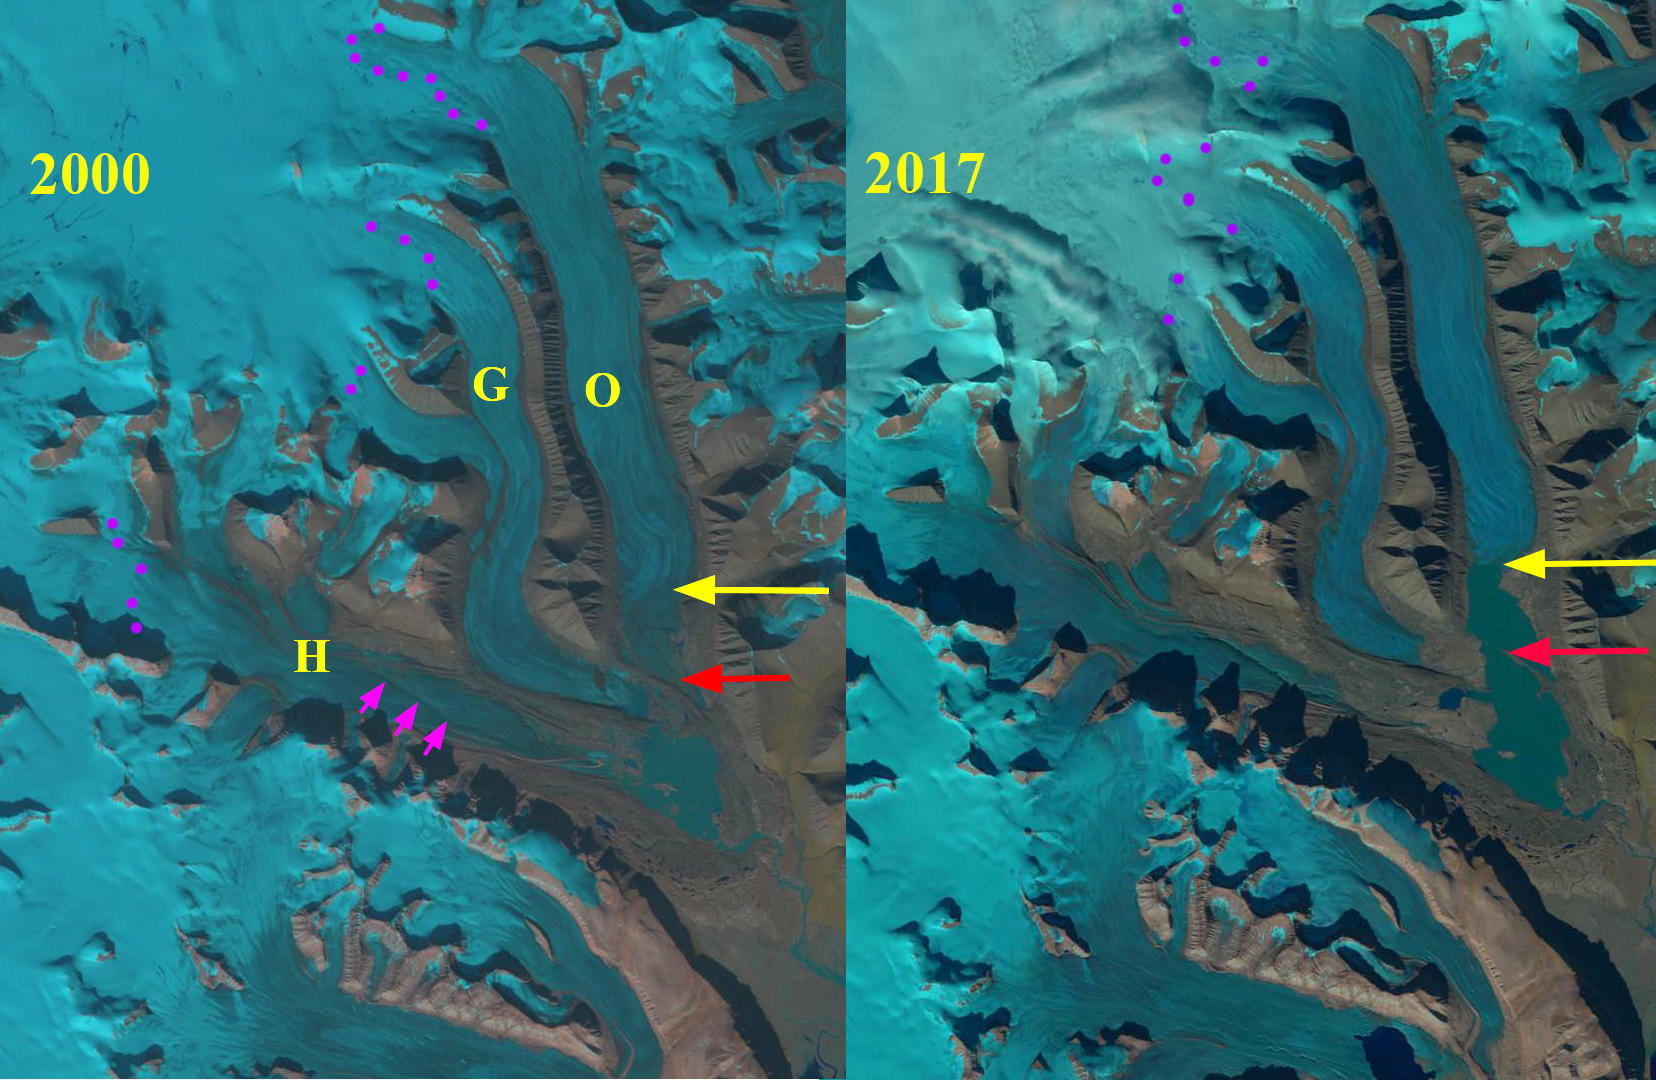
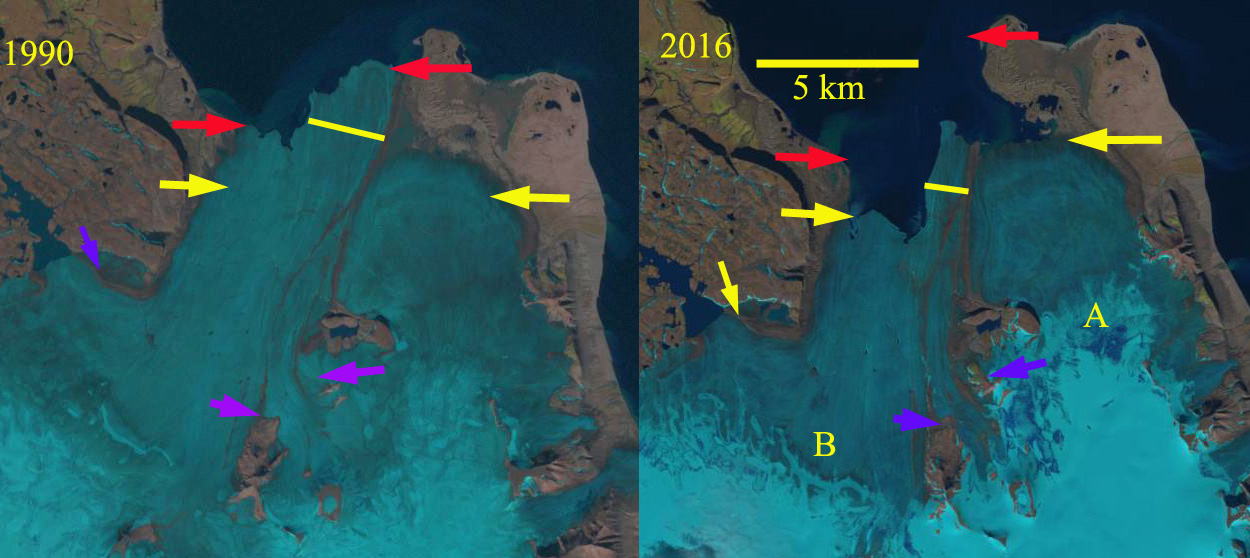
Response of Orasbreen (O), Glopeken (G) and Holmstrombreen (H) to climate change as indicated by 1995 and 2019 Landsat images. Red arrow is 2000 terminus, yellow arrow 2017 terminus, pink arrows a deepening supraglacial stream channel and purple dots the snowline.

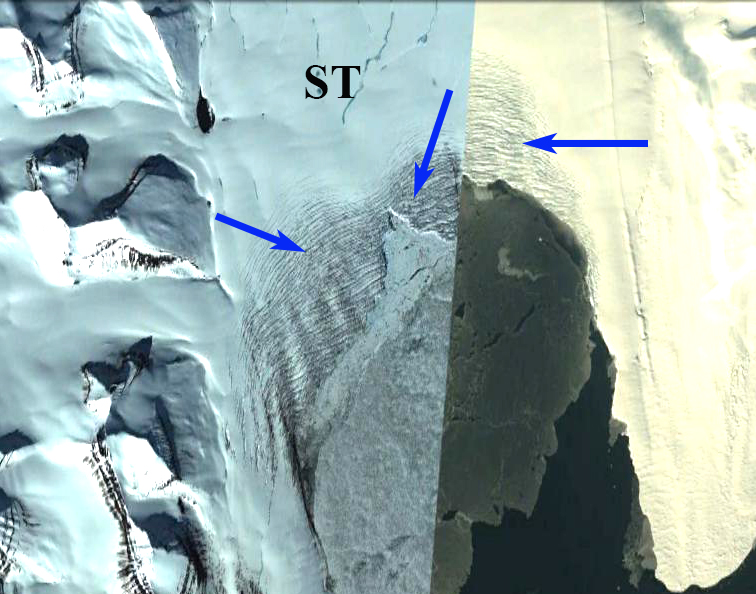
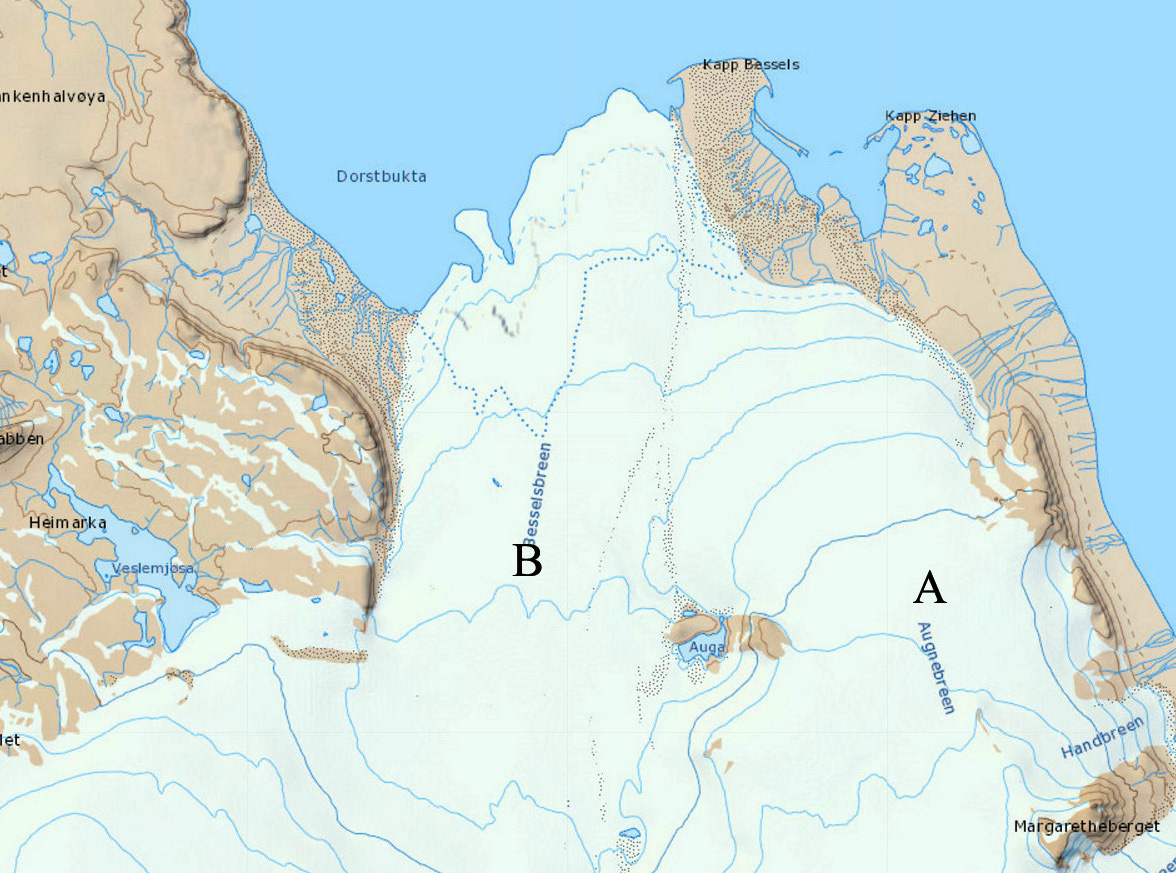
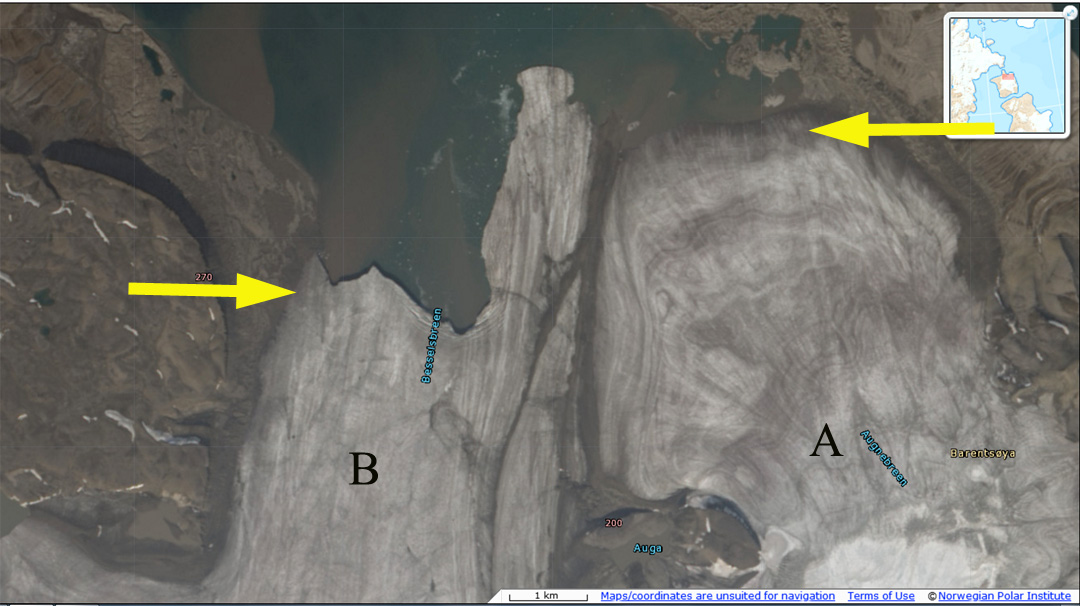
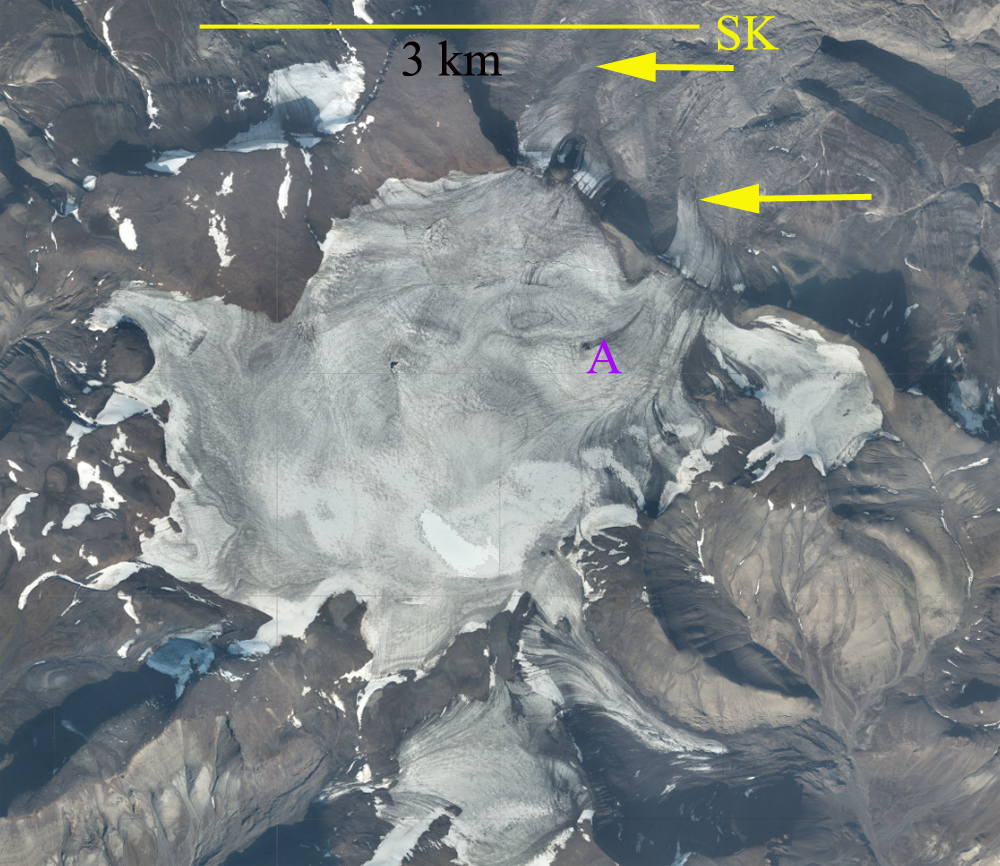
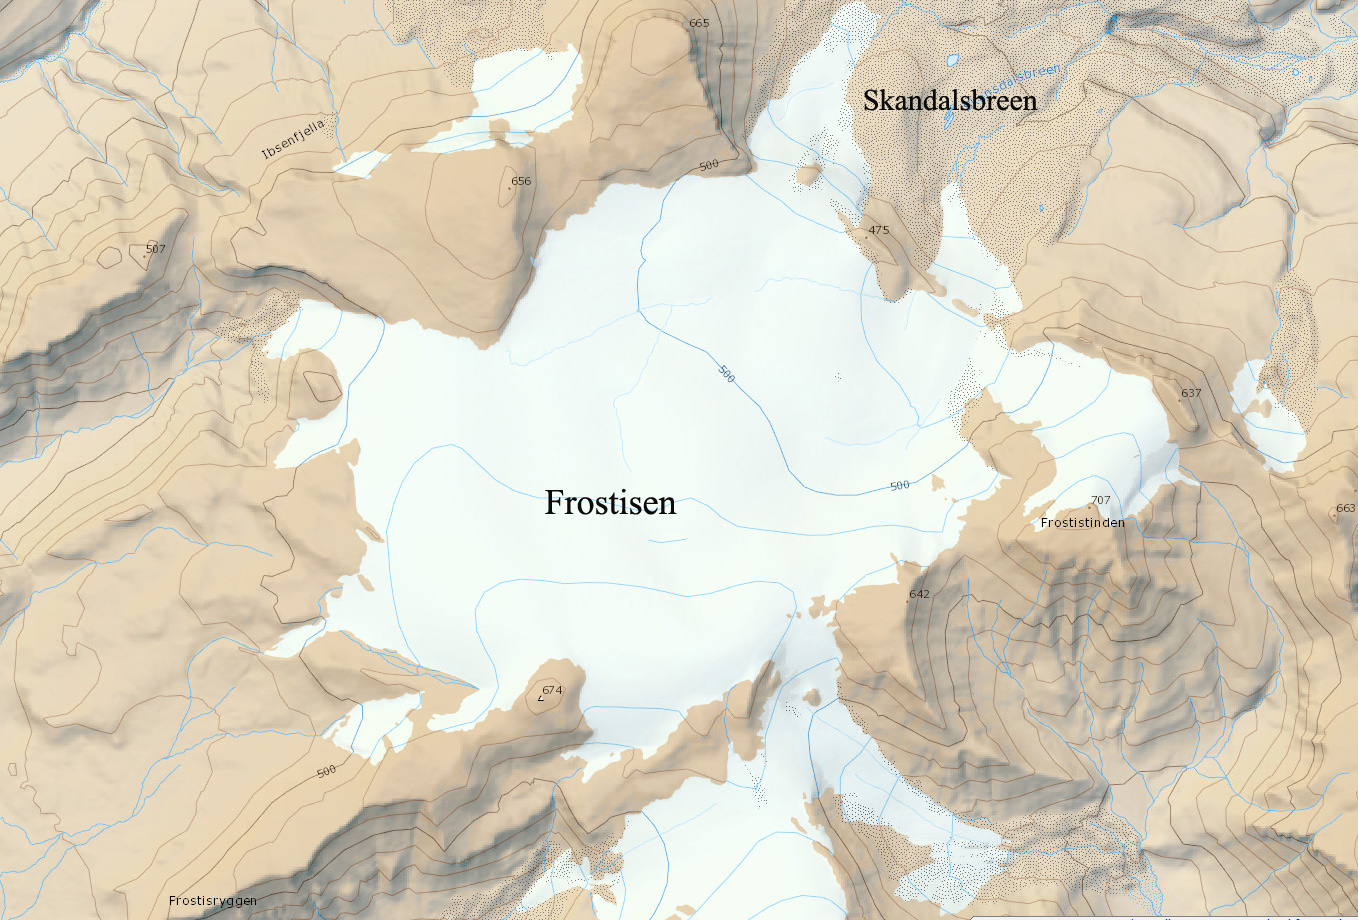
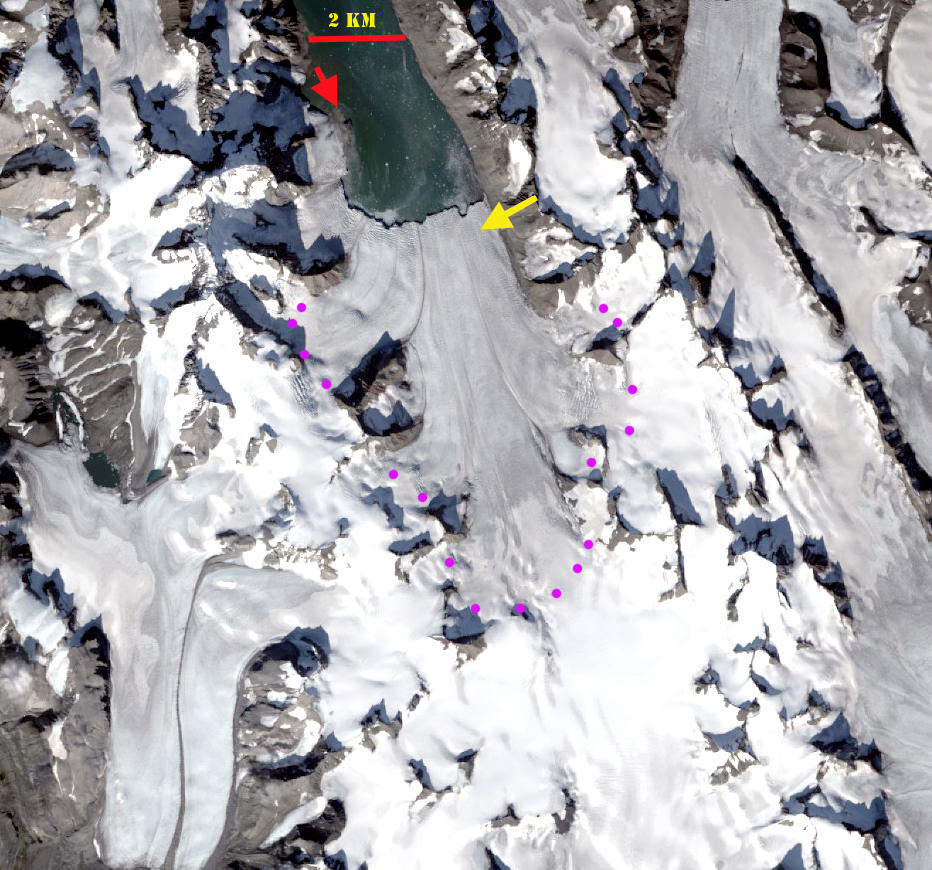
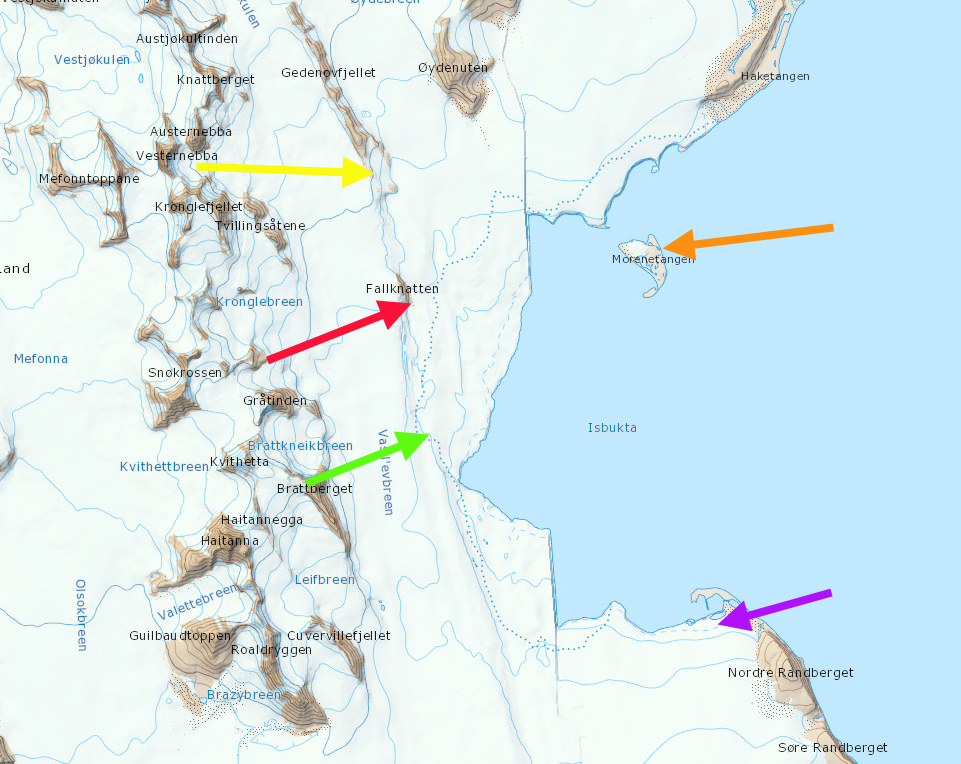
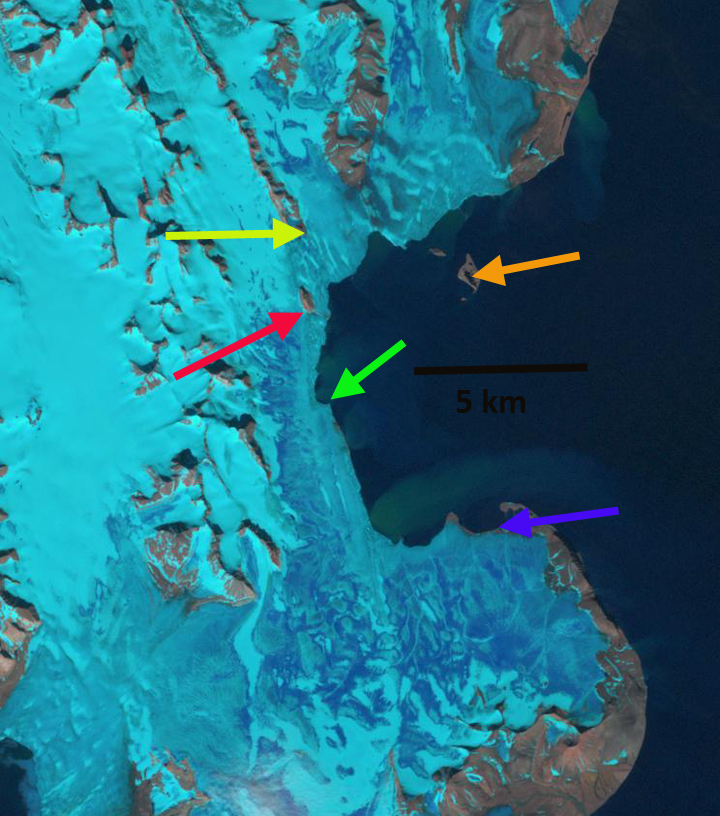
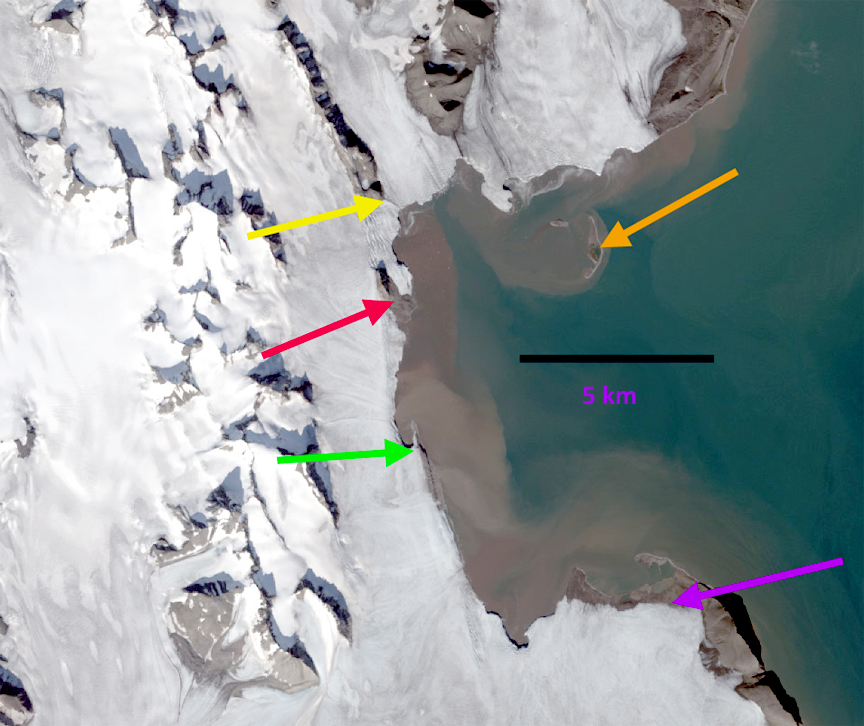
TopoSvalbard map and image of the Orsabreen terminus area and expansion of Trebrevatnet. Light blue arrows indicate ice cored medial moraine, light green arrows indicate rifts, and purple arrows a deep supraglacial channel.