Cavagnoli Glacier, Switzerland Fading Away

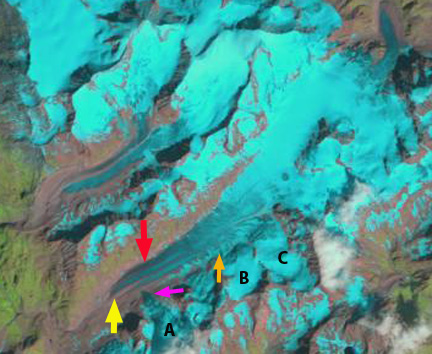
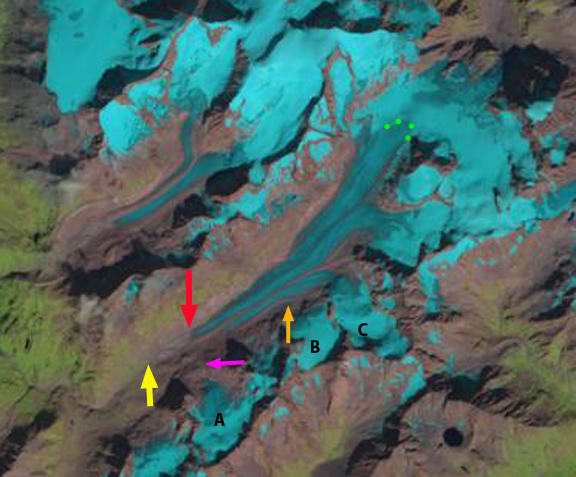
Google Earth image of Cavagnoli in 2010 and a Sentinel 2 image from Sept. 9  2016.  Ice masses are numbered.  No retained 2016 snowpack, note the lighter colored snow on the upper Basodino Glacier

Cavagnoli Glacier (Ghiacciaio dei Cavagnöö) drains south into Lago dei Cavagnoli (Lago dei Cavagnöö), which is impounded by a dam that is 111 meters high.  The glacier like its neighbor Basodino Glacier  is in the Ticino River watershed and supplies the Robiei/Cavagnoli Hydropower system. The Cavagnoli Hydropower plant can provide 28 MW of power. The Swiss Glacier Monitoring Network noted that glacier area in 1973 was 1.36 square kilometers, when the glacier was a single ice mass.. The Swiss Glacier Monitoring Network has observed the annual retreat of this glacier since 1980, total retreat up through 2013 is 378 m of the main glacier.  The top of the glacier has also been retreating this is a symptom of a glacier that will not survive (Pelto, 2010). Huss and Fischer (2016) indicate that the majority of the small alpine glaciers, less than 0.5 square kilometers will disappear in the next 25 years.

This glacier has no accumulation zone in 2003, 2005, 2007 or 2010 Landsat and Google Earth imagery. The glacier itself by 2010 had separated into five separate ice masses that are each melting quickly away.  The glacier as viewed from below and from directly above in Google Earth Imagery indicates a thin glacier with few crevasses.This has become a reoccurring pattern for this glacier, and also is a sign of a glacier that cannot survive.   In 2010 Google Earth imagery the largest ice mass was 0.4 square kilometers and none of the ice masses appear destined to survive. In 2016 the Sentinel 2 image indicates there are four remaining ice masses, with a combined area of 0.3 square kilometers, with the largest ice mas now at less than 0.2 square kilometers.  There is no retained snowpack in the 2016 Sentinel image either. On the main ice mass there is a meltwater stream from the top to the bottom of the glacier indicating that even the top of the glacier is usually snow free by summer’s end. This glacier is a small relic of its former mapped extent.   The glacier will not persist, but is also an example that even small glaciers in poor health do not disappear quickly.

[ngg_images source=”galleries” container_ids=”47″ display_type=”photocrati-nextgen_basic_imagebrowser” ajax_pagination=”1″ template=”/nas/wp/www/sites/blogsorg/wp-content/plugins/nextgen-gallery/products/photocrati_nextgen/modules/ngglegacy/view/imagebrowser-caption.php” order_by=”sortorder” order_direction=”ASC” returns=”included” maximum_entity_count=”500″]


Barnes Ice Cap, Baffin Island Evident Response to Climate Change

barnes-melt-trails-2016

Barnes Ice Cap transect and closeup of divide area in August 2016.  Black dots indicate summit divide of the ice cap. Notice the channels extending away from the divide.  These are not stream channels, as they are too wide, but they are meltwater formed valleys that are preferred pathways for the meltwater transport.

Barnes Ice Cap located in the center of Baffin Island, Canada covers an area of ~5800 km2.  The ice cap is approximately 150 km long, 60 km wide and has maximum ice thickness of ~730 m and a maximum ice elevation of 1124 m above sea level (asl) at the summit of the north dome (Andrews, 2002).  They also note a retreat of the southeast margin of 4 m/year from 1961-1993 on the southeast margin (Jacobs et al 1997).  Dupont et al (2012) identified that the melt season increased from 66 days fro the 1979-87 period to 87 days from 2002-2010. They also noted that ICESat altimeter data indicated the thinning of the BIC at a mean rate of 0.75 m/year for the 2003–2009 period. Gilbert et al (2016) Figure 5 indicates the ELA was at 950 in the 1960-80 period and is at 1100 m from 2002-2010 this leaves  a limited accumulation zone area. observe that  Barnes  Ice Cap has nearly lost its accumulation area over the last 10 years, in part due to the longer melt season.  The glacier does tend to not retain snowcover the accumulation zone consists of superimposed ice at the crest. Papasodoro et al (2016) noted that glacier wide balances were −0.52  m w.e./year from 1960 to 2013 and doubled to −1.06m w.e./year from 2005 to 2013. They also   The drainage channel development suggests meltwater transport from versus refreezing of meltwater in 2016.

bic-com%5bpare

Landsat comparison of the northwest margin of the Barnes Ice Cap in 1990 and 2016.  Red arrows indicate terminus locations in 1990. Purple arrows indicate an area of stream development parallel to the ice front.  The bright area at the margin of the ice cap is Pleistocene ice (Andrews, 2002). 

Here we examined Landsat imagery from 1990-2016 to illustrate the retreat of the northwest region of the icecap and to take a look at the 2016 melt features and lack of any retained snowcover on the ice cap. In 2016 the melt channels from the divide at the crest of the ice cap are impressive.  There is no retained snowcover at the summit of the ice cap even on August 9th with several week left in the melt season. The melt pathways visible in the imagery from 2016 extend 10 km downslope from the crest of the icecap. In 1990 the ice cap terminated at the red arrows, this included contact with a peninsula in Nivlalis Lake and an island in Conn Lake.  By 2011 and 2014 the glacier had retreated from the locations.  In 2016 the total retreat of the margin has been 600 m at Nivalis Lake, 1100 m at the island in Conn Lake and 450 m further east at the red arrow halfway to Bieler Lake.  This is a slow retreat rate compared to many glaciers, but represents a much higher rate than before 1990, with rates of 18-42 m/year.  There is a new section of river parallel to the ice cap margin between Conn and Bieler Laker.

2016-barnes-transect

barnes-2011-nw

2011 Landsat image of northern margin indicating retreat from the 1990 postiion red arrows.

barnes-nw-2014

2014 Landsat image of northern margin indicating retreat from the 1990 postiion red arrows.


Otemma Glacier Retreat & Snowline Rise, Switzerland

Otemma Glacier is in the Upper Rhone River watershed and feeds Lac de Mauvoisin. Climate change is altering this glacier, with terminus change not being the main story it is the rising snowline and separation from tributaries. The lake fed by the glacier is impounded by Mauvoisin Dam one of the 10 largest concrete arch dams in the world. The reservoir can store 200 million cubic meters of water. The dam provides hydropower and protection against natural hazard. In 1818, an advance of the Gietro Glacier, now retreated high above the reservoir, generated ice avalanches which blocked the flow of the river. When the ice barrier was breached, 20 million cubic meters of flood water was released devastating the valley (Collins, 1991).There are several other large glaciers in the basin Gietro, Mont Durand and Brenay that provide runoff to power what is today a large hydropower project. The Mauvoisin Dam can produce 363 MW of power.

Otemma Glacier is one of the glaciers where the terminus is monitored annually by the Swiss Glacier Monitoring Network (SCNAT). Here we examine changes in this glacier from 1985 to 2014 including changes in the terminus, snowline elevation and tributary connection during this period using Landsat Imagery. SCNAT reports that the glacier retreated at a rate of 27 m/year from 1985-1999, to 40 m/year from 2000-2014.
otemma glacier gearth
Google Earth view of the glacier indicating glacier flow direction.

In 1985 the glacier terminates at the yellow arrow, with tributaries A,B & C all joining the main glacier. The snowline is at 2800 m, green dots. In 1988 the snowline extends to the divide with Bas Glacier d’Arolla at 3050 m. In 1999 the snowline also extends to the divide with Glacier d’Arolla. Tributary A no longer connects to the glacier, pink arrow, and the terminus has retreated 300 m.

By 2013 Tributary B is also detached from the main glacier (orange arrow). The terminus has retreated to the red arrow a distance of 1010 m over the thirty year period. The snowline in 2013 and 2014 almost reaches the divide with Bas Glacier d’Arolla with a few weeks left in the ablation season. The area of persistent snowcover is thus restricted to the region above 3050 m. This region is not large as the Bas Glacier d’Arolla captures most of the upper basin. That the snowline is consistently reaching the highest divide for this large glacier is noteworthy. The retreat of the large valley tongue of Otemma Glacier will remain rapid given the consistent high snowlines indicative of limited retained accumulation. Even with current climate not much of the Otemma Glacier can survive. The rising snowline is observed on most glaciers including nearby Rutor Glacier, Italy.

otemma 1985
1985 Landsat Image
otemma 1988
1988 Landsat Image
otemma 1999
1999 Landsat Image
otemma 2013
2013 Landsat Image
otemma 2014
2014 Landsat Image