Global Glacier Change Bulletin 3 (WGMS) Reports Increasing Mass Balance Losses

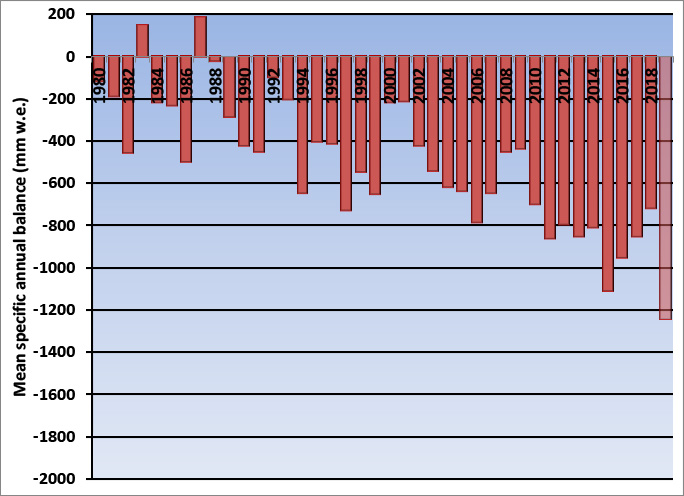
Figure 1. Regionalized mean annual mass balance of WGMS reference glaciers 1980-2018, with 2019 being a mean of reference glaciers.

Glaciers have been studied as sensitive indicators of climate for more than a century and are now experiencing a historically unprecedented decline (Zemp et al, 2015).  Glacier fluctuations in terminus position, mass balance and area are recognized as one of the most reliable indicators of climate change. This led to glacier mass balance being recognized during the International Geophysical Year (IGY) in 1957 as a key focus area for developing long term data sets and the need to establish an international data repository.

Today this data reporting system is managed by the World Glacier Monitoring Service (WGMS). WGMS annually collects standardized observations on changes in mass, volume, area and length of glaciers with time, and additionally collecting statistical information on the distribution of glaciers from inventories.  WGMS just published their third Global Glacier Change Bulletin, a comprehensive data report covering the 2015/2016 and 2016/2017 hydrologic years. I review some of that information here with updated reference glacier mass balance data from WGMS for 2018 and 2019.

The data set compiled by the World Glacier Monitoring Service has 45,840 measurements on 2540 glaciers (WGMS, 2020). Annual mass balance measurements are the most accurate indicator of short-term glacier response to climate change.  WGMS, (2020) data set has 7300 annual balance values reported from 460 glaciers, with 41 reference glaciers having 30+ year consecutive ongoing records. Annual mass balance is the change in mass of a glacier during a year resulting from the difference between net accumulation and net ablation.

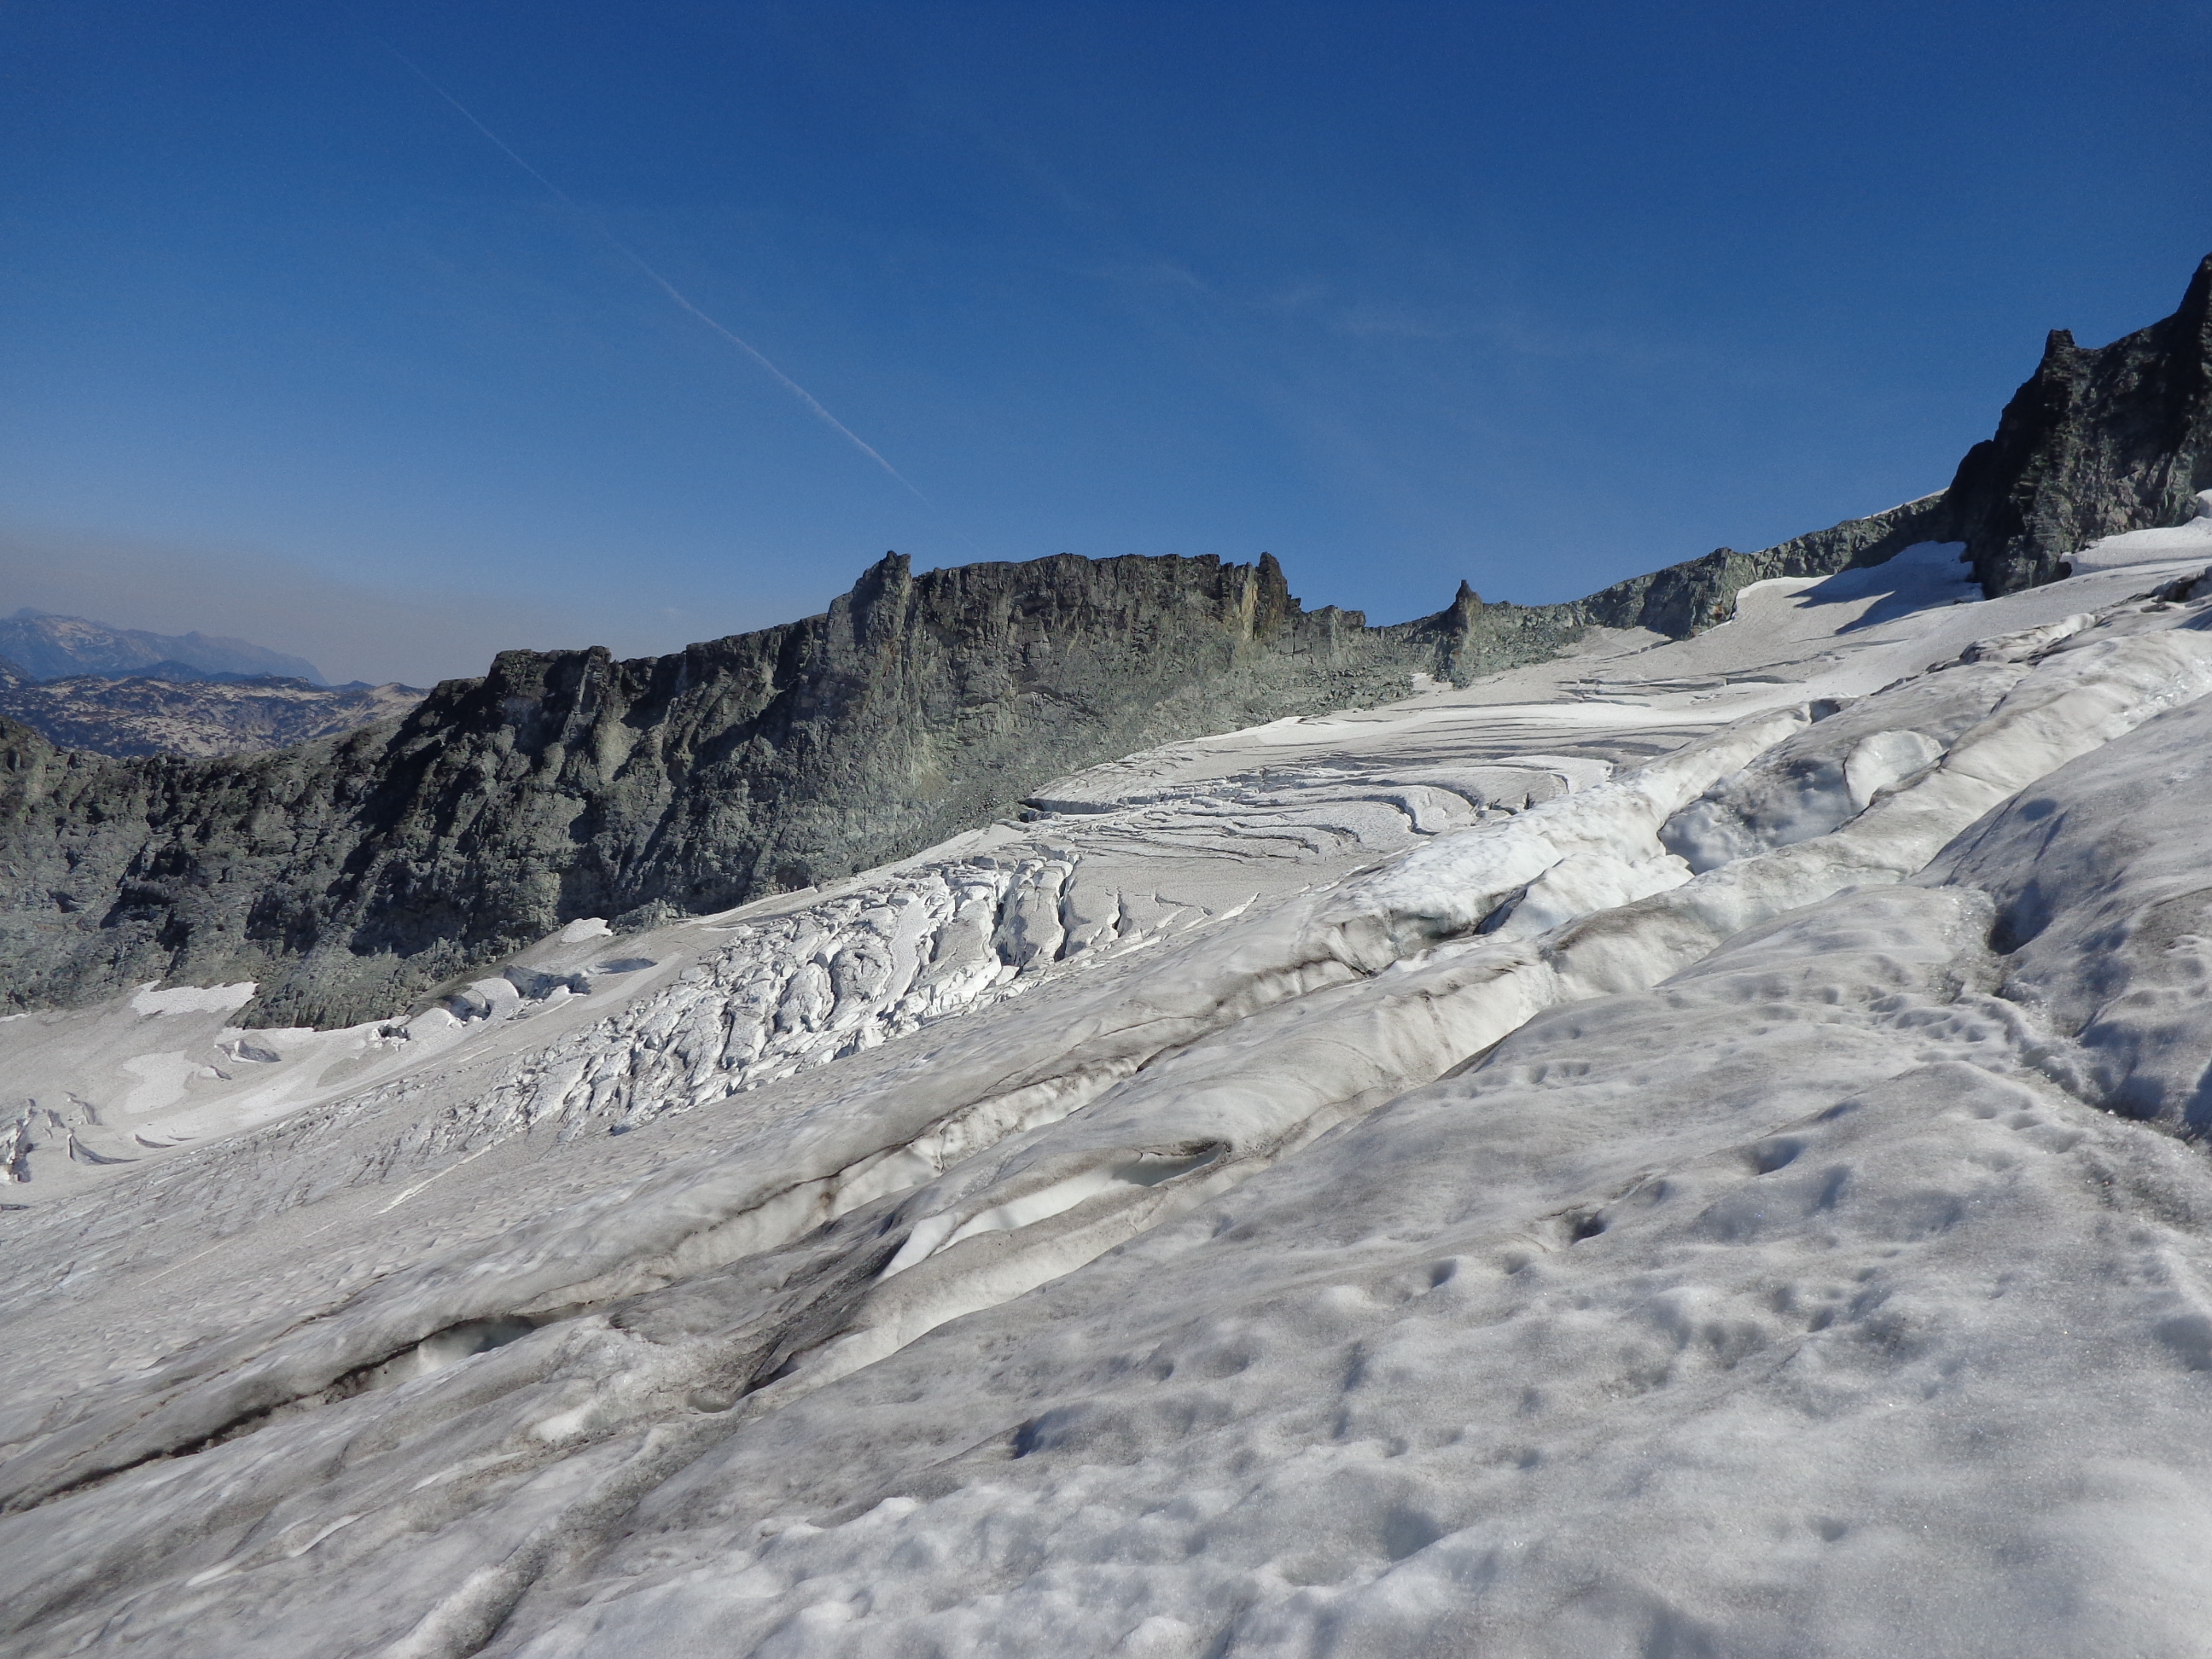
The key data set is the annual balance record from the reference glacier network, these glacier have extensive continuous field monitoring programs with at least a 30 year record.  For example on Columbia Glacier, Washington I have been in the field 36 consecutive summers, over 120 days taking 4600 measurements with 63 assistants. Figure 1 above illustrates glacier mass balance for the set of global reference glaciers for the time-period 1980-2019. Global values are calculated using a single value (averaged) for each of 19 mountain regions in order to avoid a bias to well observed regions.

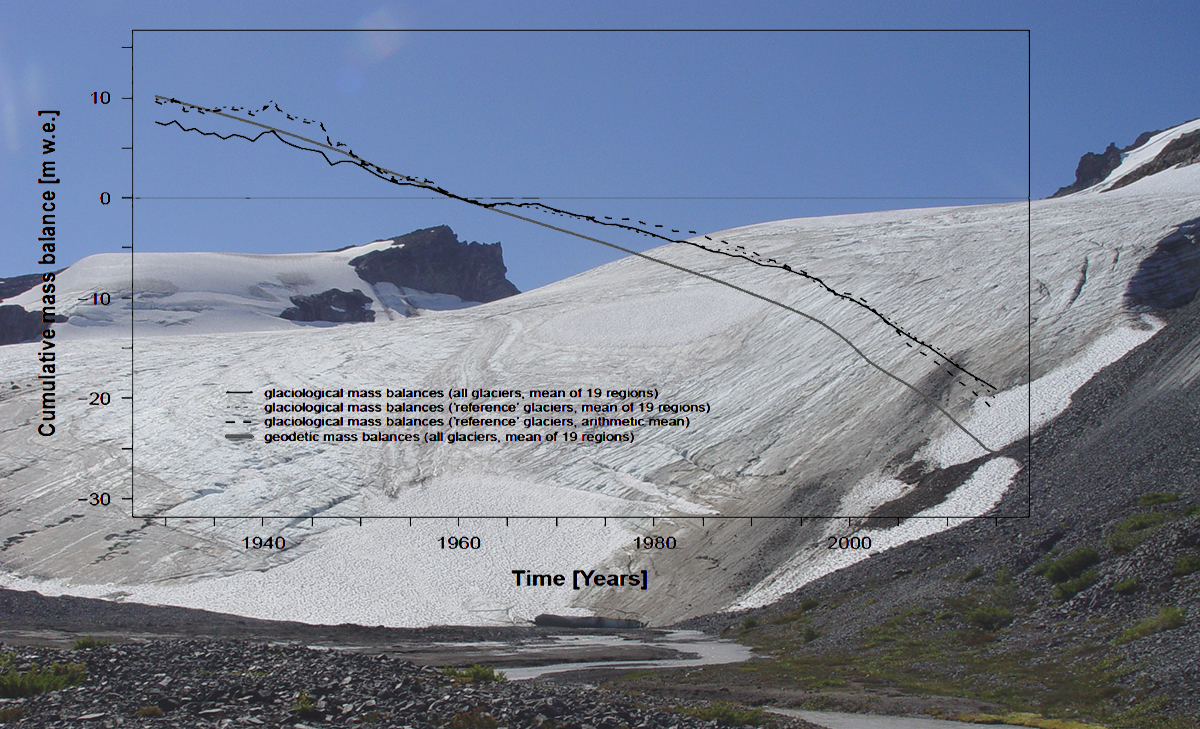
In the hydrological year 2016/17, observed glaciers experienced an ice loss of -550 mm, and 2017/18 of -720 mm. For 2018/19 hydrologic year a regionally averaged value will not be available until December 2020, the overall mean of all reference glaciers of -1241 mm, compared to -1183 mm in 2017/2018. This will make 2019 the 32nd consecutive year with a global alpine mass balance loss and the tenth consecutive year with a mean global mass balance below -700 mm. The simple mean mass balance of WGMS records has a slight negative bias compared to geodetic approaches, but this bias has been effectively eliminated with the regionalized approach now used by WGMS, see Figure 2 (WGMS, 2020).

Figure 2. Glaciological mass balance of all glacier, reference glaciers (mean), regional mean of reference glaciers and regionalized mean geodetic mass balances for the 1930-2017 period.  Pay particular note to the 1960-2017 period where the data records are better.  Observe the similarity in cumulative mass balance losses regardless of approach.

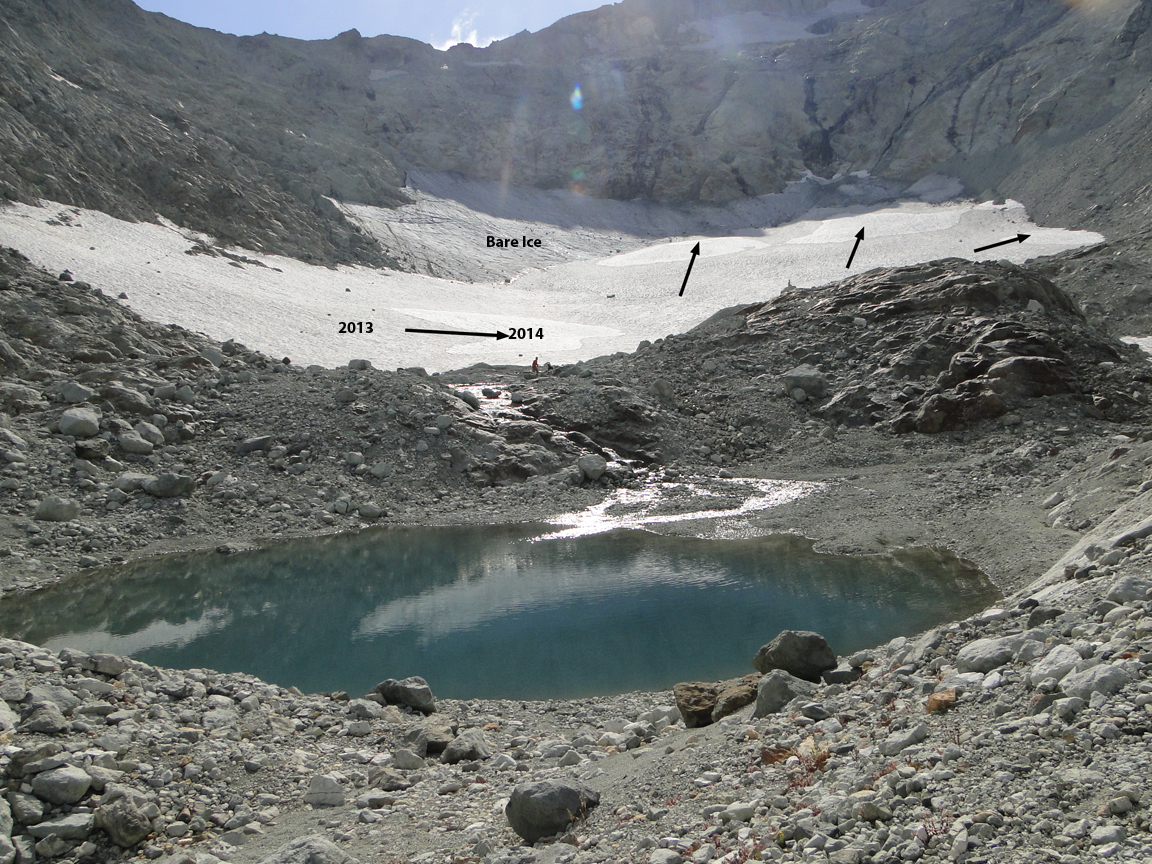
The decadal averaged annual mass balance was -172 mm in the 1980’s, -460 mm in the 1990’s, 500 mm for 2000’s and – 889 mm for 2010-2019.  The increasing rate of glacier mass loss, with eight out of the ten most negative mass balance years recorded after 2010, during a period of retreat indicates alpine glaciers are not approaching equilibrium and retreat will continue to be the dominant terminus response (Pelto, 2019; WGMS, 2020).  The accumulation area ratio is an indication of the expansion of the ablation areas globally, despite retreat accumulation areas are shrinking.  The decline in accumulation area extent, hence AAR has been rapid, the data in 2017/2018 yields a mean of 13%, whereas the average needed to be in balance is 56%. The low AAR in 2019 is illustrated at two reference glaciers Lemon Creek, Alaska and Alfotbreen, Norway below.

Years

Ba

AAR

1980-1989

-172

47

1990-1999

-460

44

2000-2009

-525

35

2010-2019

-889

28

Table 1 Glaciologic annual balance for each decade from the WGMS reference glacier mean of the 19 regions. The AAR is a simple mean of the reference glaciers.

Landsat images of Lemon Creek Glacier, Alaska and Alfotbreen, Norway in 2019. White dots indicate the glacier boundary on Alfotbreen, purple dots the snowline. Lemon Creek AAR=0%  Alfotbreen AAR=~15%

Detailed information is reported for 20 glaciers distributed around the globe that includes annual mass balance maps as illustrated from Columbia Glacier. The relationship between elevatation and annual balance is the balance gradient seen below for Mocho Glacier, Chile. This glacier is in the lake district of Chile at 39.90° S and 72.00° W and did not have significant accumulation in 2016 or 2017.  The  AAR-annual balance relationship and the ELA-annual balance relationship and annual balance record are reported, as exemplied by Silvretta Glacier, Switzerland, where negative balances occurred in 2016 and 2017.

The result of the rising snowline is mass losses, which drives glacier retreat. This also leads to decreased average albedo and surface lowering, which in turn cause pronounced positive feedbacks for radiative and sensible heat fluxes. This rapid decline in mountain glaciers chronicled by WGMS is expected to accelerate.  Huss et al (2017) describe a cascade of effects that are occuring, impacting ecosytems, communites and our economy.

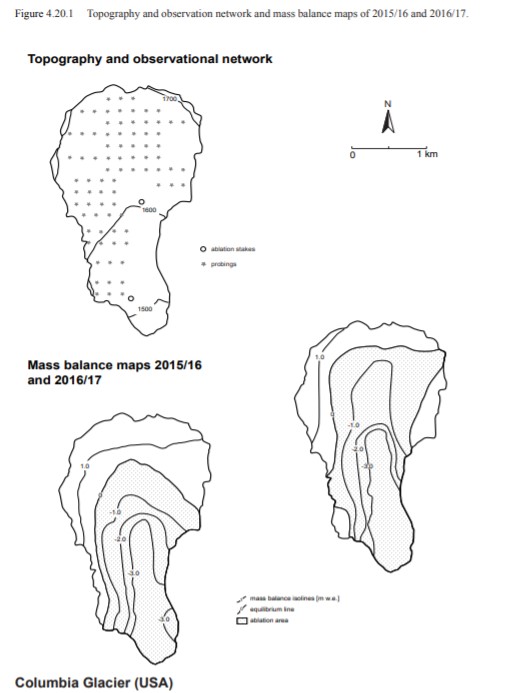
Annual mass balance maps and measurement network on Columbia Glacier.

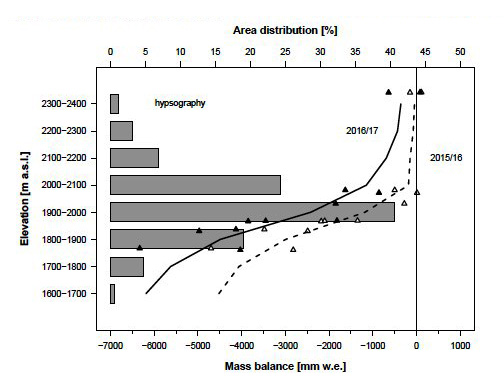
Annual balance gradient for Mocho Glacier, Chile.

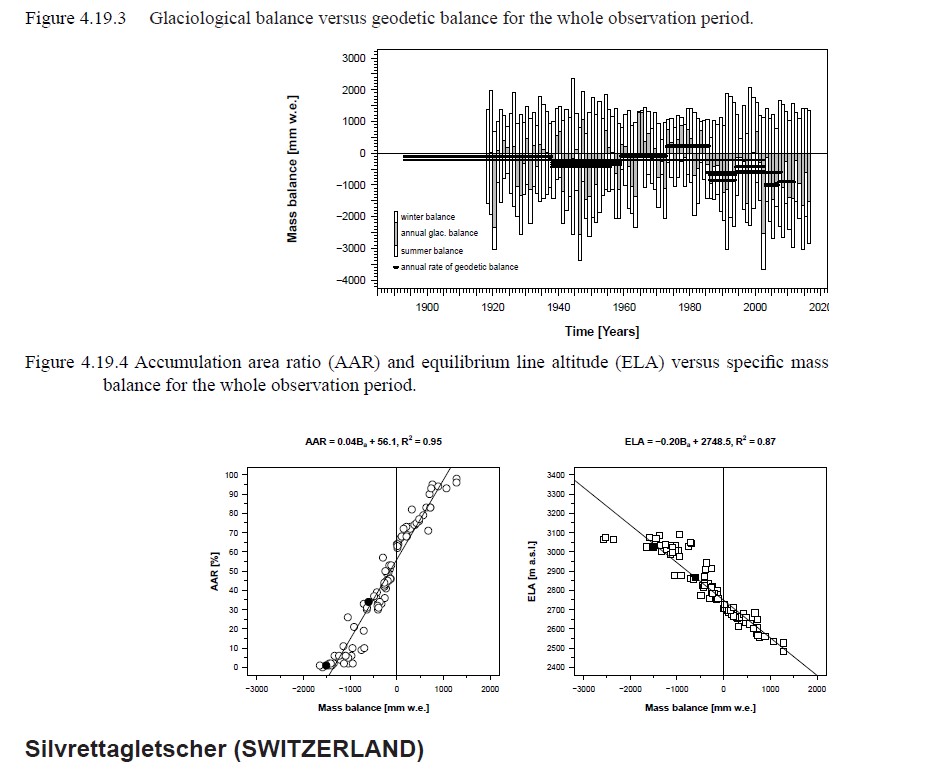
Annual balance record and annual balance relationship to both AAR and ELA on Silvertta Glacier.

Global Glacier Change Bulletin-Many Glaciers Same Story


Cumulative glacier mass balance losses reported by WGMS by region, all glacier, reference glaciers and geodetic mass balance (Sholes Glacier, WA in background).  The data set size, location and type changes but the story remains the same, mass loss resulting from global temperature increase.

The World Glacier Monitoring Service has released the second bulletin of Global Glacier Change.  The bulletin provides detailed global and regional information on alpine glaciers particularly for 2014 and 2015.  There is data reported from 621 glaciers.  The glaciers vary in type and location, yet their response is the same retreat and mass balance loss as a result of the global temperature increases.  There are currently 41 reference glaciers with at least 30 consecutive years of detailed field measurement of mass balance.  Additionally mass balance is typically reported from 60-80 other glaciers.  The graph below indicates that the reference glacier network mass balance losses parallels the losses of all glaciers and that of geodetic assessment of mass loss from remapping.  The report indicates that alpine glaciers have lost 0.9 m w.e. per year.  This continues the unprecedented trend of mass loss that is driving glacier retreat as well. In 2014 and 2015 316 mass balance observations are reported from 166 glaciers.  There are 889 terminus change observations reported from 528 glaciers. The results in graph after graph illustrate that glaciers in all regions of the globe are experiencing mass loss and retreat.  As the United States representative to the WGMS, helping pull together each strand of data, is a key task.  The result unfortunately is a very strong line of data built of all these strands of glaciers losing mass.  The report also contains preliminary data from 2016, which was the 37th consecutive year of mass loss as reported in BAMS State of the Climate 2016 (Pelto, 2017).  The deadline for posting initial results on mass balance for reference glaciers in 2017 was Dec. 1 2017.  Reporting on the US glaciers it is clear that 2017 will be another year of substantial losses in this region. 


Annual glacier mass balance reported for each region.  The coloration indicates the increase in mass balance loss in each region with global temperature increase. 

There is a section of the bulletin on each region including graphs of terminus change and mass balance on selected glaciers. Below are examples from Western North America and Central Europe.  For reference glaciers data is submitted that includes maps of the mass balance, and then charts are derived from WGMS illustrating mass balance changes and the relationships between mass balance and the equilibrium line altitude, and between mass balance and the accumulation area ratio.  


World Glacier Monitoring Service 30th Anniversary

Zemp_20160831-25

The numbers on the left y-axis depict quantities of glacial mass loss from the WGMS and sea level rise, and the suns across the horizon contain numbers that represent the global increase in temperature, coinciding with the timeline on the lower x-axis From Jill Pelto

The World Glacier Monitoring Service (WGMS) celebrated 30 years of achievement last week. I have had the privilege of being the United States representative to the WGMS and was an invited speaker for the Jubilee held in Zurich, Switzerland along with Matthias Huss, Wilfried Haeberli, Liss Marie Andreassen and Irene Kopelman. This post examines the important role that WGMS has and continues to serve under the leadership of Michael Zemp. The organization has been compiling, homogenizing and publishing data on glacier fluctuations and mass balance primarily from 1986-2013. WGMS remains the leading organization for the collection, storage and dissemination of information on the fluctuations of alpine glaciers. The resulting standardized collection of alpine glacier data that is archived by WGMS, is also leading to analysis efforts that otherwise would be hampered by limited data and lack of homogeneity to the data. Glaciers are recognized as one of the best climate indicators.  Mass balance data is the best parameter to measure on glaciers for identifying climate change, because of its annual resolution. The core of the WGMS data set has been frontal variations, which indicate longer response to climate as well as dynamic changes.  The key data set today provided by WGMS are the reference glaciers.

This set of glaciers has a 30-year continuous record of annual mass balance measured in the field, and each glacier also has geodetic verification.  This mass balance data set is featured on the Global Climate Dashboard at NOAA. I report the mass balance of two reference glaciers Lemon Creek Glacier in Alaska and Columbia Glacier in Washington.  Today the field based work is being increasingly supplemented and supplanted by remote sensing methods.  This data sets indicates a period of sustained mass balance loss, and glacier retreat that Zemp et al (2015) using WGMS data noted as historically unprecedented.  The most recent compilation publication is the Global Glacier Change Bulletin.

This data set is of particular value during this period of climate change and is already chronicling the disapperance of a number of glaciers in the data set. Glacier loss is not a process that has been well documented. The WGMS data set can be enriched by more data from expanding monitoring, reporting data from archives and simply adding the submission of data as a step in the research process for those monitoring alpine glaciers. The video of my presentation looking at 33 consecutive years of field work and sharing this data after compilation with the WGMS is below. The slides below are from the Jubilee presentations.


[ngg_images source=”galleries” container_ids=”32″ display_type=”photocrati-nextgen_basic_imagebrowser” ajax_pagination=”1″ template=”/nas/wp/www/sites/blogsorg/wp-content/plugins/nextgen-gallery/products/photocrati_nextgen/modules/ngglegacy/view/imagebrowser-caption.php” order_by=”sortorder” order_direction=”ASC” returns=”included” maximum_entity_count=”500″]

Alpine Glacier Mass Balance in 2015: Competes for Record Loss


Climate-Change-Data BA

Painting from Jill Pelto illustrating the Climate Change Data using multiple quantities: the annual decrease in global glacier mass balance, global sea level rise, and global temperature increase. The numbers on the left y-axis depict quantities of glacial melt and sea level rise, and the suns across the horizon contain numbers that represent the global increase in temperature, coinciding with the timeline on the lower x-axis.

The World Glacier Monitoring Service (WGMS) record of mass balance and terminus behavior provides a global index for alpine glacier behavior. The WGMS data set for terminus change contains 42 000 observations from 2000 glaciers extending from the mid-19th century. Annual mass balance is the annual change in volume due to snow and ice accumulation and snow and ice losses. Here, mass balance is reported in mm of water equivalent. The following analysis is something I work on annually as the United States Representative to the WGMS, putting the alpine glacier mass balance of the globe in perspective. Preliminary data for 2015 from 16 nations with more than one reporting glacier from Argentina, Austria, Canada, Chile, Italy, Kyrgyzstan, Norway, Switzerland, and United States indicate that 2015 will be the 36th consecutive year of negative annual balances with a mean loss of −-1162 mm for 27 reporting reference glaciers and −1481 mm for 62 of all reporting glaciers (WGMS 2016). The number of reporting reference glaciers is 90% of the total whereas only 50% of all glaciers that will report have reported to date. When all data are available the 2015 mass balance will likely be comparable to 2003 the most negative year at −1268 mm for reference glaciers and −1198 mm for all glaciers.

The cumulative mass balance loss from 1980–2015 is 18.8 m, the equivalent of cutting a 20.5 m thick slice off the top of the average glacier. The trend is remarkably consistent from region to region (WGMS 2015). The decadal mean annual mass balance was −261 mm in the 1980s, −386 mm in the 1990s, -−727 mm for 2000s and −818 mm from 2010–15. The declining mass balance trend during a period of retreat indicates alpine glaciers are not approaching equilibrium and retreat will continue to be the dominant terminus response (Zemp et al. 2015). The recent rapid retreat and prolonged negative balances has led to many glaciers disappearing and others fragmenting (Pelto 2010; Carturan et al. 2013).

wgms annual balance

Annual glacier mass balance record of reference glaciers reporting to the WGMS.

In South America seven glaciers in Columbia, Argentina, and Chile reported mass balance. All seven glaciers had losses greater than −1200 mm, with a mean of −2200 mm. These Andean glaciers span 58°of latitude.

In the European Alps, mass balance has been reported for 14 glaciers from Austria, France, Italy, Spain and Switzerland. All 15 had negative balances exceeding −1000 mm, with a mean of −1860 mm. This is an exceptionally negative mass balance rivaling 2003 when average losses exceeded −2000 mm.

In Norway mass balance was reported for seven glaciers in 2015, all seven were positive with a mean of 860 mm. This is the only region that had a positive balance for the year. In Svalbard six glaciers reported mass balances, with all six having a negative mass balance averaging −675 mm.

In North America Alberta, British Columbia, Washington, and Alaska mass balance data from 17 glaciers was reported with a mean loss of −2590 mm, with all 17 being negative. This is the largest negative mass balance for the region during the period of record. From Alaska south through British Columbia to Washington the accumulation season temperature was exceptional with the mean for November–April being the highest observed.

In the high mountains of central Asia seven glaciers from China, Russia, Kazakhstan, and Kyrgyzstan reported data, all were negative with a mean of –705 mm.

columbia compare 2015


Columbia Glacier, Washington in 2015 during our mass balance observations from the terminus and head of the glacier indicating the lack of snow cover retained and extensive melting,


Disastrous Year for North Cascade Glacier Mass Balance (Snow/Ice Economy)


Mass loss of North Cascade glaciers visualized.

A disastrous year is unfolding in 2015 for North Cascade glaciers, if normal melt conditions continue the range will lose 5-7% of its entire glacier volume in one year! For the 32nd consecutive year we were in the North Cascade Range, of Washington to observe the mass balance of glaciers across the entire mountain range. The melt season is not over, but already the mass loss is greater than any other year, with six weeks of melting left. An alpine glacier’s income is the snow that accumulates, and to be have an equilibrium balance sheet for a year, alpine glaciers typically need 50-65% snowcovered surfaces at the end of the melt season.  Below the accumulation zone, net assets are lost via ablation.

In 2015 of the 9 glaciers we examined in detail, 6 had less than 2% retained snowcover, which will be gone by the end of August.  Two more had no 2015 snowpack greater than 1.7 m in depth, which will also melt away before summer ends.  Average ablation during the August field season was 7 cm per day of snow, and 7.5 cm of ice. Only one glacier will have any retained snowcover at the end of the summer, we will be checking just how much in late September. This is the equivalent of a business having no net income for a year, but continuing to have to pay all of its bills. Of course that comes on top of more than 27 years of consecutive mass balance loss for the entire “industry” of global alpine glaciers.  The business model of alpine glaciers is not working and until the climate they run their “businesses” in changes, alpine glaciers have an unsustainable business model. Below this is illustrated glacier by glacier from this summer.  A following post will look at the glacier runoff aspect of this years field season.  The Seattle Times also featured our summer research.JillPeltoGMB_720_494_s_c1_c_c

Jill Pelto Painting of mass balance time series loss from 1984 to 2014. 

In a recent paper published in the Journal of Glaciology spearheaded by the WGMS group  (M. Zemp,  H. Frey, I.Gartner-Roer, S.Nussbaumer, M.Hoelzle, F.Paul, W.Haeberli and F.Denzinger), that I was co-author on, we examined the WGMS dataset on glacier front variations (~42 000 observations since 1600), along with glaciological and geodetic observations (~5200 since 1850).  The data set illustrated that “rates of early 21st-century mass loss are without precedent on a global scale, at least for the time period observed and probably also for recorded history.The rate of melting has been accelerating, and in the decade from 2001 to 2010, glaciers lost on average 75 centimetres of their thickness each year”, this is compared to the loss in the 1980’s and 1990’s 25 cm and 40 cm respectively each year (Pelto, 2015).  A comparison of the global and North Cascade Glacier mass balance records since 1980 indicate the cumulative loss, at bottom.

DSC08917

Columbia Glacier terminus August 3, 2015 with new expanding lake.

DSC00199

Upper portion of Columbia Glacier on Aug. 5, 2015 note lack of snowcover and all previous firn layers (firn is snow that survived a melt season but is not yet glacier ice).

DSC00503

Foss Glacier lacking snowcover and losing area fast this summer, this glacier will lose more than 15% of its volume in 2015.

DSC00435

Measuring firn from 2011-2014 retained in a crevasse on Easton Glacier, 2015 snowpack lacking.

DSC00429

The typical end of summer snowline elevation on Easton Glacier, bare ice and firn in 2015.

DSC09197

Rainbow Glacier amidst the normal accumulation zone, where there should be 3-4 m of snowpack, none left.

DSC09602

Lynch Glacier view across the typical end of summer snow line region on Aug. 17th 2015.

DSC00413

Terminus of Lower Curtis Glacier with many annual layers exposed to rapid melt, 31 m of retreat from spring to August 11th, 2015.

DSC00448

ice worm firn

Only firn from 2013 and 2014 and bare ice at surface of Ice Worm Glacier.

ba2014


Comparison of cumulative glacier mass balance in the North Cascades and Globally (WGMS)

DSC00348

Primary field team for the from left, Mauri Pelto (Nichols College), Jill Pelto (UMaine), Tyler Sullivan (UMaine), Ben Pelto (UNBC) and Erica Nied (U-Colorado) summer with contributions from Justin Wright, Tom Hammond, Oliver Grah and Jezra Beaulieu not pictured