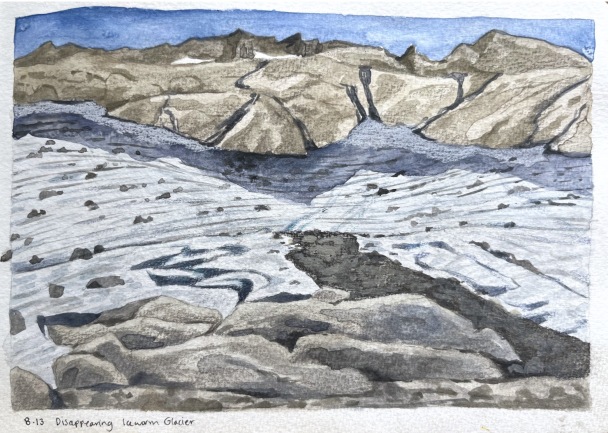
Jill Pelto Sketches the demise of Ice Worm Glacier August 13, 2023.
In 1984, as the North Cascade Glacier Climate Project began, the largest concentration of glaciers between Mount Rainier and Glacier Peak was on Mount Daniel-Hinman; Daniels, Foss, Hinman, Ice Worm and Lynch Glacier. Hence, I felt these glaciers were worth monitoring. Now in August 2023, we just finished our 40th annual survey of these glaciers and they have had their worst year yet in terms of mass loss. Each year we ascend the Cathedral Rock trail, hike passed Peggy’s Pond and set up camp to observe the glaciers. The rapid mass loss builds on the last two year leading to dramatic thinning and area loss. Ice Worm Glacier and Hinman Glacier are no longer glaciers. Pelto (2010) developed a forecast model that identified a glacier that retreats and thins not just at the terminus but even on the upper glacier, does not have a consistent accumulation zone and cannot survive. Foss Glacier may not survive the summer. Daniels Glacier is rapidly shrinking. Only Lynch Glacier remains active. This is the story of the glacier’s decline and the impact.
In 1958 these five glaciers had a combined area of 3.8 km². In 1984 the area was 3.2 km², in 2009 the area had declined to 1.5 km², and 0.8 km² in 2023. This is an 80% decline since 1958 and ~a 50% decline since 2009. This area loss is driven by mass balance losses. We measure the mass balance annually on Daniels, Ice Worm and Lynch Glacier from 1984-2023, and on Foss Glacier 1984-2005. From 1984-2022 mean annual balance averaged -0.6 m w.e., a cumulative loss of 21.3 m w.e.. The mass balance losses have driven the reduction in glacier area. In recent years, the mass losses have been consistent and greater than the long term mean at –1.20 m w.e. annually. This summer is not complete but will finish close to -3 m in a single year.
On Ice Worm Glacier the retreat of the top of the glacier has been faster than the terminus of the glacier. This summer we observed a dozen holes that reached the bottom of the glacier 4-6 m below, indicating how thin the ice is. There is no movement, the size and thickness are too low to generate future movement, hence this is no longer a glacier. A glacier is a body of snow and ice that is moving, this requires a persistent thickness of 20-30 m, which is typically associated with snow/ice areas of ~50,000 m² or larger. As a glacier becomes thinner or smaller than this movement will not be sustained.
Hinman Glacier crossed that threshold either in summer 2021 or 2022 with no patch of ice exceeding 30,000 m². This had been the largest glacier in the region, but had no avalanche accumulation to supplement.
Daniels Glacier has a long terminus section that leads to rapid area loss with even a retreat of 20 m. This year the lowest 20% of the glacier is quite thin and much of this likely will melt out in the coming month. For the first time ever in our 40 years of observation there is no significant retained snow in early August. Glacier length has been reduced by 60% since our monitoring began.
Lynch Glacier had filled Pea Soup Lake basin until the late 1970’s. After its rapid retreat exposed this beautiful new lake, the glacier retreated slowly at its terminus. However, the entire western third of the glacier is nearly gone, even up to the ridge top. This illustrates again that retreat does not always of the terminus.
Foss Glacier was a large slope glacier filling the northeast face of Mount Hinman in the 1980s. By 2005, the glacier had retreated exposing two new alpine lakes and was clearly on the path of Hinman Glacier. Fragmentation began in 2015 and has accelerated during the 2021-2023 period. This will no longer be a glacier either later this year or next year.
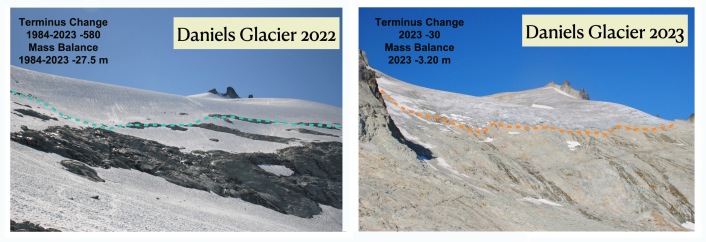
Daniels Glacier in 2023, less than 50% remaining from 1984. The glacier terminus has retreated 700 m, with the longest glacier section now at 450 m. Daniels Glacier on Aug. 14 2022 and Aug. 14 2023. In 2022 a late start to summer preserved snowpack, but summer conditions did not end until Octs. 21. (Jill Pelto, photographs).
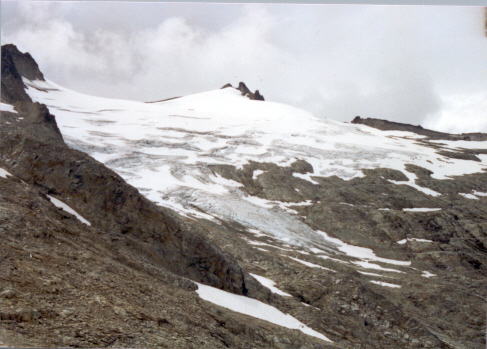
Daniels Glacier in 1990. This blue ice tongue is now completely gone.
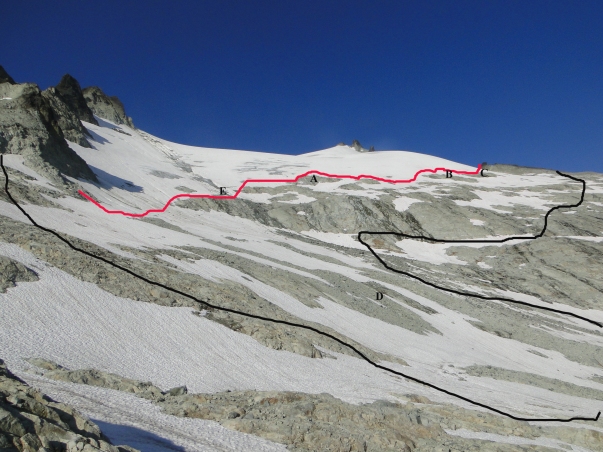
Daniels Glacier indicating change from 1984 to 2010.
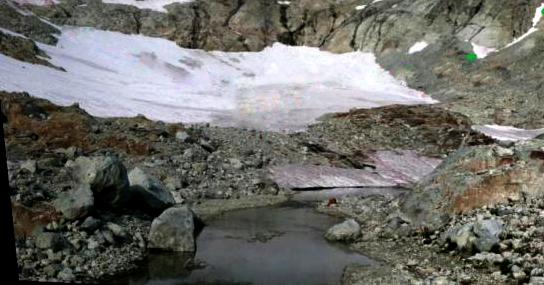
Ice Worm Glacier in 2013 area 0.08 km², 33% less than in 1984.

Ice Worm Glacier in 2023 area 0.04 km², 67% decline since 1984 and 50% since 2013.

Ice Worm Glacier comparison Aug. 13 2022 and Aug. 13, 2023. Jill Pelto photographs.

Lynch Glacier in 2023 with west side melted out.

Foss Glacier covered the northeast slope of Mount Hinman in 1988 and by 2015 was only 50% of the 1984 size.

Foss Glacier in 2023, it is not some thin rapidly fragmenting sections of ice covering 0.14 km².
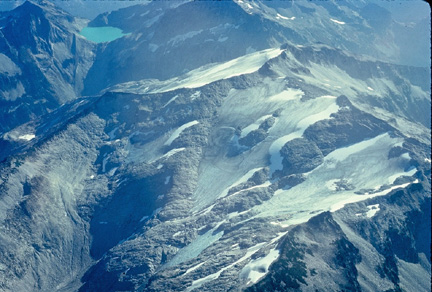
Hinman Glacier in 1988 four separate ice masses.

Hinman Glacier from 1.3 km² in 1958 to 0.04 km² in 2022.
The three largest glaciers on these mountains in 1958 fed the SkykomishRiver supplying 1.5 to 2 m³/sec durng the summer melt season (Pelto, 2011). This summer we measured melt on these glaciers yielding 25-30% of this level. The result has been declining flow during late summer low flow periods in the Skykomish River resulting in higher water temperatures. Daniels and Ice Worm Glacier feed the Cle Elum River, whose reservoir is an important resource for irrigation in the Yakima Basin. A key threshold of in-stream flow levels considered insufficient to maintain short term survival of fish stocks is below 10% of the mean annual flow. For the Skykomish River at the USGS Gold Bar site 10% of mean annual flow is 14 m3s-1. In the Skykomish River from 1958-2021 there were 344 melt season days with discharge below 14 m3s-1. Of these only 3 occurred before 1985, and 70% have occurred since 2000. Of more concern for aquatic life is the occurrence of extended periods of low flow. From 1929-2023 in the Skykomish River basin there have been 14 years where streamflow dropped below 14 m3s-1 for 10 consecutive days during the melt season, 1986, 1987, 1992, 1998, 2003, 2005, 2006, 2007, 2015, 2017, 2019, 2021, 2022 and 2023. All years occurring during our annual monitoring project, 6 in the last decade. In 2022 this occurred beginning on Sept. 9 after stream temperatures had declined from elevated levels. In 2023 flow dropped below this threshold on Aug. 13 and remains below this threshold coinciding with high water temperatures.
The Skykomish River was listed as impaired for temperature in a 2008 303(d) listing. Several segments of the Skykomish River as well as its tributaries consistently exceed water quality temperature standards (King et al 2013). During select summer periods from 2001-2006, temperature monitoring in the Skykomish River at Monroe indicated that the average 7-Day maximum frequently exceeded the 16°C criteria between July and September in 2001-2006 (King et al 2013).
A water temperature sensor became operational in early July 2022 at the USGS Gold Bar site. The temperature exceeded 18oC for the first time on July 27. It surpassed 18oC diurnally on most days from July 27-September 7, 37 of 42 days. The TMDL for the Skykomish River indicates the maximum temperature should not exceed 16oC for 7 consecutive days. In 2022 16oC was exceeded continuously from July 26th-August 4th, August 14th-August 28th, and August 29th-September 4th. In 2023 the 16°C threshold was exceeded from July 28-Aug. 21. The reduced late summer glacier flow has reduced the ability of these ice masses to buffer both temperature and discharge during droughts. This same process has been observed in the Nooksack River (Pelto et al 2022).
The impact of glacier loss is not the only reason for declining streamflow, but it is a significant reason. The loss of glacier ice is thus causing issues that extend all the way to Puget Sound or the Columbia River system.

Skykomish River Basin, GB=Gold Bar, blue arrows indicate glaciers 1=Columbia, 2=Hinman, 3=Foss and 4=Lynch.
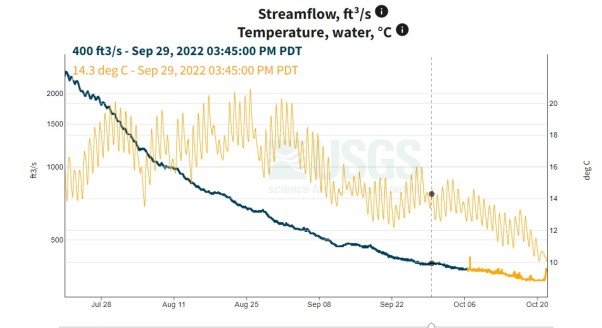
Temperature and discharge observations at the USGS Gold Bar site in late summer 2022.

Temperature and discharge observations at the USGS Gold Bar site in late summer 2023.