Grand Plateau Glacier, Retreat, Lake Expansion and Island Formation

Grand Plateau Glacier on June 15, 2024 Sentinel image, illustrating 5.5 km retreat from Island (I) where terminus was located in 1984. N illustrates nunatak the glacier terminated 11 km from 1948 terminus. Point A is new island emerging at terminus. The Lake that barely existed in 1948, has more than doubled in size since 1984 to 49 km2.

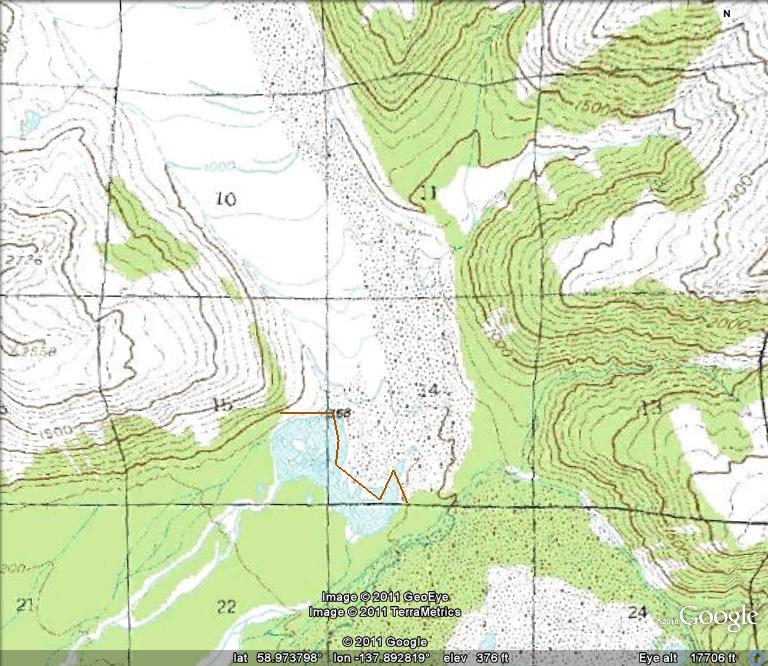
Grand Plateau Glacier drains southwest from Mount Fairweather in southeast Alaska. The glacier advanced during the Little Ice age to the Alaskan coastline. Early maps from 1908 show no lake at the terminus of the glacier. The 1948 map (below) shows three small distinct lakes at the terminus of the main glacier and a just developing lake at the terminus of the southern distributary terminus (D). The distance from the Nunatak N to the terminus was 11 km in 1948. The lake at D is 400 m wide.

gp-terminus
USGS 1948 topographic map of area Illustrating three small disconnected proglacial lakes at the terminus (I).
USGS 1948 topographic map of area Illustrating distribuatry tongue
Grand Plateau Glacier in 1984 Landsat image indicating 1984 terminus at orange arrows, 2013

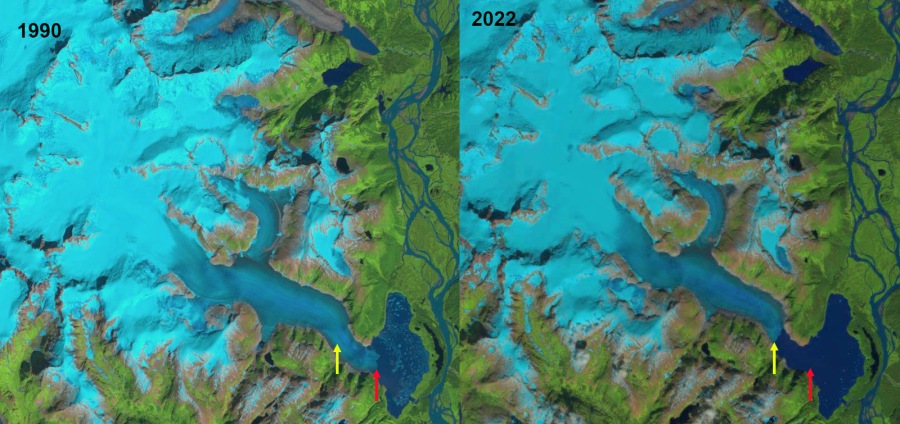
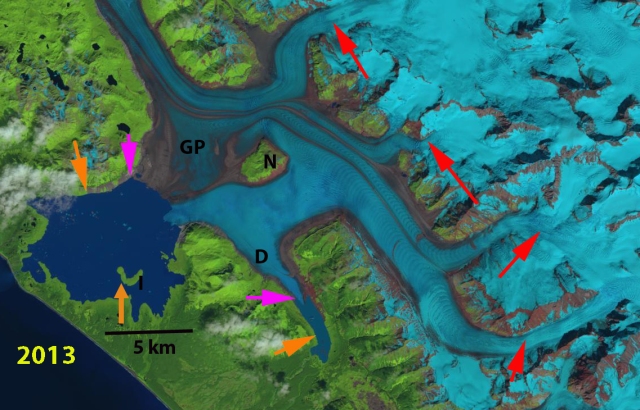
Landsat images from 1984 indicates the fromation of a single connected proglacial lake with an area of 24 km2. Key reference points in each image are the Nunatak, N, and and Island, I. The retreat from 1984-2013 is evident with the orange arrows indicating the 1984 terminus and pink arrows showing the 2013 terminus location. The distance from the Nunatak to the terminus is 8.5 km in 1984 and 4 km in 2013. On the north shore of the lake the retreat between arrows is 2.7 km from 1984-2013. From the island the glacier retreated 3.3 km from 1984-2013, with the lake expanding to 43 km2. The distributary tongue (D) retreated 2.2 km from 1984-2013. The retreat was driven by higher snowlines in recent years, the snowline had been reported at 1000 m in the 1950’s. Satellite imagery of the last decade indicates snowlines averaging 1500 m, red arrows. The glacier snowline is evident in Landsat imagery in 1984 and 2013 red arrows.

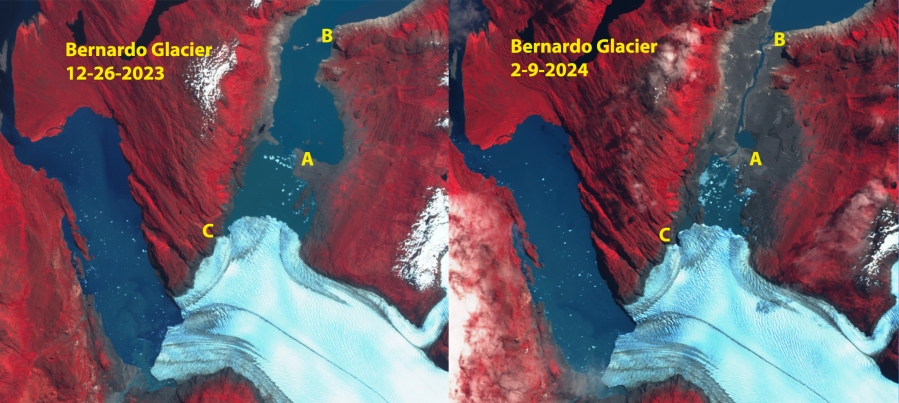
In 2024 the lake area has grown further to 49 km2, as a result of a retreat of 8 km since 1948 and 5.5 km since 1984. Today a second island is emerging at the terminus, Point A. The distributary tongue to the southeast now terminates in a lake that is now 5.2 km long, a 4.8 km retreat since 1948 and 2.6 km since 1984. The combination of higher snowlines and increased calving into the terminus lake will continue to lead to retreat of this still mighty river of ice. This retreat parallels that of nearby Alsek Glacier and Yakutat Glacier.

La Perouse Glacier, Alaska Lake Formation Retreat Acceleration

La Perouse Glacier in 2018 and 2023 Landsat images indicating the six developing proglacial lakes (1-6). The lakes in 2023 have a combined area of 1.3 km2. Debris cover has expanded notably at Points D.

La Perouse Glacier flows from the Fairweather Range to the Pacific Coast. The glacier advanced to the coast in the mid-late 19th century and has remained tidewater on the coast since (Gaglioti et al 2019). I first saw this glacier in 1982 and its terminus stretched 3.5 km along the coast, a second terminus ended inland and was 3.2 km wide. Both of the terminus are piedmont fed by a significant accumulation area above 2300 m, that flows through a spectacular icefall from 1100 to 1800 m. This high accumulation zone helps make the glacier more resilent to warming temperature (Pelto, 1987). Berthier et al (2010) noted a ~0.5 m/loss average loss for glaciers in this region from 1962-2006, which has generated this retreat. The glacier because of its size and large piedmont lobe is slow to respond to climate change, 20 km2 coastal lobe and 10 km2 inland lobe.

La Perouse Glacier coastal terminus area indicating the three developing proglacial lakes, yellow arrows. False color Sentinal images.

Up to 2018 the coastal terminus was thinning, but had not experienced significant recession or proglacial lake development. There was significant marginal recession by 2018 exposing a forest overrun by the glacier in the 1860’s (Gaglioti et al 2019). In 2018 the inland terminus had developed 3 proglacial lakes wiyth a combined area of 0.4 km2. By 2023 the inland terminus lakes spread across 90% of the width of the terminus, with a combined area of 0.7 km2. In 2023 the main terminus had developed three proglacial lakes each, #1 at 0.12 km2, #2 at 0.16km2 and #3 at 0.36 km2. Lake #3 has numerous bergs indicating the ability to rapidly expand by calving, due to having a greater water depth. In just five years the debris covered area has expanded notably. This combination of expanding glacial lakes and debris cover is an indication of ongoing rapid decline. The changes here are simialr to that at nearby Brady Glacier and progressing on the same trend as Fingers Glacier. Look for further lake development in 2024 particularly in the coastal lobe.

Mount Everest Glaciers Limited Snow Cover Persists From November 2023 into May 2024

The snow line on Mount Everest Region glaciers on May 1,, 2024 indicated by yellow dots on the Landsat image. Note that Nangpa La and Nup La-two high passes (5800-5900 m) are both snow free. The average snow line is 6050 m.

This is a update to a previous post examining high snow lines through the winter on Mount Everest Region glaciers. Here we examine imagery from October 2023 through early May 2024 illustrating the rise in snow line into January and the continue high elevation into the pre-monsoon season. The persistent high snow line over the last six months, indicates a lack of snow accumulation during the winter season. This is a dry season, yet typically leads to extensive, though not particularly deep snow cover. There were a few smaller snow events, but the snow cover did not persist indicating that ablation has continued even above 6000 m on Mount Everest. The lack of snow leads to less infilling of crevasses on Khumbu Glacier, which are further opened by persistent ablation. On May 1 there is evident blue ice and firn areas in the Western Cwm, above the Khumbu Icefall and on the Lhotse Face above the Western Cwm at the head of the Khumbu Glacier. The relatively bare slopes above the Western Cwm also cannot generate as much avalanches that would then accumulate snow in that basin. These same slopes will yield more rock fall, with more exposed unburied rock.

In the Khumbu Icefall velocities indicates by NASA ITS LIVE are ~1m/day which leads to considerable crevasse development in the six months from November into May with very limited snow accumulation and evident ablation, image below. This season is different than the high snow lines i 2020/21 that resulted from extraordinary January heat wave. Snow cover did develop at the end of the winter/early spring (Pelto et al 2021).

The snow line on Khumbu Glacier on May 1,, 2024 indicated by yellow dots on the Landsat image. Note that there are bare ice areas in the Western Cwm (WC) and on the Lhotse Face (LF).
The snow line on Mount Everest Region glaciers on March 14, 2024 indicated by yellow dots on the Landsat image. Note that Nangpa La and Nup La-two high passes (5800-5900 m) are both snow free. The average snow line is 5950 m.

The snow line on Mount Everest Region glaciers on Feb. 11, 2024 indicated by yellow dots on the Landsat image. Note that Nangpa La and Nup La-two high passes (5800-5900 m) are both snow free. The average snow line is 6000 m.

The snow line on Mount Everest Region glaciers on Jan. 10, 2024 indicated by yellow dots on the Landsat image. Note that Nangpa La and Nup La-two high passes are both snow free. The average snow line is 5950 m
Khumbu Glacier on Feb. 11, 2024 in Landsat image illustrating snow line near top of icefall at 6000 m, yellow dots. There is some blue ice showing on north side of Western Cwm (WC), Lhotse face too shadowed to see well, but some blue ice evident.
The snow line on Mount Everest Region glaciers on Nov. 15, 2023 indicated by yellow dots on the Landsat image. Note that Nangpa La and Nup La-two high passes are both snow covered. The average snow line is 5800 m.
The snow line on Mount Everest Region glaciers on Oct. 30, 2023 indicated by yellow dots on the Landsat image. Note that Nangpa La and Nup La-two high passes are both snow covered. The average snow line is 5700 m.
Khumbu Glacier Icefall velocity from NASA ITS LIVE. Green arrows indicate primary range
Everest Base Camp Precipitation from the National Geographic Perpetual Planet station.

Baird Glacier, Alaska Terminus Tongue Breaks Off April 2024

Baird Glacier terminus tongue gone in April 26, 2024 Landsat image. Red arrow indicates now joined 5 km2 proglacial lake. Yellow dots terminus of Baird and North Baird Glacier

Baird Glacier drains the west side of the Stikine Icefield in southeast Alaska. It is the only glacier of the Stikine Iceifield that did not retreat significantly from 1960-2010. Pelto et al (2013) predicted the onset of significant retreat of this glacier, which like Brady Glacier had been slow to begin retreat despite thinning that was evident when I visited the glacier in 1984. The proglacial lake that has emerged with retreat has an area of 3.25 km2 and the glacier retreat is 2800 m from 1990-2024. The North Baird Glacier separated from Baird Glacier in 2019, with a proglacial lake extending downvalley to the tongue of Baird Glacier that separated this lake from the Baird Glacier proglacial lake until April 2024.

Baird Glacier in Landsat images from 1990 and 2023 illustrating retreat and proglacial lake expansion.
Baird Glacier in false color Sentinel images from September 10 2023 and May 2 2024. Proglacial lake (PGL) expanded from 3.2 to 5.1 km². Tongue extending upvalley toward North Baird Glacier (NB) broke up in late April, yellow arrow.

Baird Glacier in false color Sentinel images from July 2022 and July 2023. Proglacial lake (PGL) expanded from 3.00 to 3.25 km² width of tongue extending upvalley toward North Baird Glacier (NB) has declined from 700 m to 400 m.

In 1990 the Baird Glacier was sitting on an outwash plain, with no lake at the terminus. The North Baird Glacier was 1 km wide where it joined the Baird Glacier. By 2015 the glacier has retreated 750 m and the lake (PGL) has an area of ~1 km².  In 2022 the glacier has retreated leading to a lake expansion to 3.00 km². In July 2023 the tongue of ice extending across the front of the North Baird Glacier valley has thinned 40% since July 2022. The tongue remained throughout 2023 into April of 2024 before breaking up. This leaves the main terminus of the glacier more vulnerable to further rapid calving retreat. Baird Glacier is catching up to the rest of the Stikine Icefield that has experienced significant retreat, Dawes GlacierPatterson Glacier and Great Glacier. With Sawyer Glacier retreating from tidewater in 2023.

Steffen Glacier, Chile Active Calving Season Concludes with Largest Event in 2024

Steffen Glacier in 2024 False Color Sentinel images illustrating calving events yielding bergs A,B,X and Y that have a combined area of 1.5 km2. Green arrow is Dec. 2023 terminus and yellow arrow April 2024 terminus. Each berg has consistent notation.

Steffen Glacier is the largest south flowing outlet of the 4000 km2 Northern Patagonia Icefield (NPI). Several key research papers have reported on the spectacular retreat of this glacier in recent years.  Glasser et al (2016) reported that Steffen Glacier proglacial lake area expanded from  12.1 km2 to 20.6 km2 from 1987 to 2015, due in part to a 100 m snowline rise. Dussaillant et al (2018) determined annual mass loss of NPI at ~-1 m/year for the 2000-2012 period, with Steffen Glacier at -1.2-1.6 m/year. The result Steffen Glacier retreat from 1987-2019 was 4.4 km, ~137 m/year (Pelto, 2019).

On December Dec. 6, 2023 the terminus tongue has a narrow unsupported section that appears poised to calve (C). By Dec. 26, 2023 the glacier has calved berg C (0.4km2 ), joining other large bergs remaining from previous years D, E and F. Two more pieces A and B appear poised to calve. By Feb. 9 2024 berg B has calved, and by Feb. 24 berg A has calved, together they are 0.3 km2.

On April 14 two more large bergs X and Y have calved from the terminus. Berg X is the largest of the year at 0.6 km2, berg Y is 0.2 km2 . Terminus retreat from Dec. 2023-April 2024 is 1.5 km. The terminus tongue is again narrow and unsupported as the winter season begins, indicating that more large icebergs should be expected in the 2025 summer season.  Millan et al (2019) indicate the area of tributary glacier convergence near the northwest terminus and above the glacier is 700 m thick, and that the glacier has been retreating along an area where the glacier bed is below sea level, though the terminus now is close to sea level.

Steffen Glacier in Dec. 2023 False Color Sentinel images illustrating calving event yielding berg C. Green arrow is Dec. 2023 terminus and yellow arrow April 2024 terminus.

Grace, Lucas and Price Glacier Retreat from Tidewater, South Georgia Island 1987-2024

Grace (G), Lucas (L) and Price (P) Glacier’s in 4-6-2024 Sentinel image top, yellow dots mark the 1987 terminus position when all reached tidewater, blue dots indicate 2024 terminus. Below is the South Georgia GIS with terminus observations from the BAS shown.

In 1987 Grace, Lucas and Price Glacier on the northern end of South Georgia Island each reached tidewater. Each had retreated less than 100 m since 1976. This is a very cloudy region and clear satellite image views limited. Here we examine Landsat images from 2000 and 2016, and a Sentinel image from 2024 to identify changes.  Gordon et al., (2008) observed that larger tidewater and sea-calving valley and outlet glaciers generally remained in relatively advanced positions until the 1980’s.  After 1980 most glaciers receded; many of these retreats have been dramatic including Twitcher, Herz, Ross, Hindle, Konig and Neumayer Glacier (Pelto, 2017).  

By 2002 a Landsat image reveals that Grace and Lucas Glacier have retreated from the coast with new proglacial lakes forming between the terminus and the coast. Price Glacier main terminus is still filling most of a narrow bay, and the east side of the terminus is still reachig the coast. By 2016 Grace Glacier retreat has led to the formation of several small proglacial alkes, while Lucas Glacier retreat has generated one larger proglacial lake. Price Glacier has begun to retreat up a narrow embayment and the east side has almost lost connection with tidewater.

In 2024 Grace Glacier has retreated 1200 m, ~20% of its length in 1987. Lucas Glacier has retreated 1400 m, ~20% of its length. Price Glacier now only terminates in a narrow embayment ,has retreated 1700 m, ~23% of its length. Each glacier has limited area above 500 m, indicating that below this elevation glacier mass balance has been significantly negative over the last 35 years. The retreat here is similar to that of Konig and Turnback that have retreated from tidewater exposing new coastal regions that are being occupied by flora and fauna.

Grace (G), Lucas (L) and Price (P) Glaciers in 2002 and 2016 Landsat images as they retreat from tidewater.

Volcan Overo Glaciers, Argentina Lack Accumulation Zone Cannot Survive

Volcan Overo Glaciers at the end of the 2024 melt season in a false color Sentinel image from 3-30-2024. There is no sigificant area of snowcover remaining for the 3rd consecutive summer. The lake that had formed at Point A since 2018 has now drained. Fragmentation at point B, C, and D continue, while thinning at top of glacier is apparent with expanding bedrock knob at Point E.

Volcan Overo is a 4619 m high Andean mountain in Argentina with a relatively low sloped broad volcanic summit region above 4000 m that hosts a glacier complex that is shrinking and fragmenting.  La Quesne et al (2009) observed significant annual thinning in the latter half of the 20th century on nearby glaciers in Argentina and Chile. A sharp increase in mass loss on Central Andean glaciers after 2009, including the Volcan Overo region, was reported by Ferri et al (2020). Here we examine Landsat images from 1986-2022 to identify longer term changes of the glacier and Sentinel images from 2018-2024 illustrating the persistent lack of an accumulation zone leading to recent changes, including the impact of the January 2023 heat wave (Washington Post, 2022). The persistent lack of an accumulation zone during the 2018-2024 period, highlighted in images below, in which no snow was retained as firn, indicates the glacier cannot survive (Pelto, 2010).

Volcan Overo in Landsat images from 1986-2022 illustrating area loss and fragmentation.

In 1986 there are four discrete glaciers around the caldera, covering ~12 km2 the largest E around the summit ranges in elevation from 4200-4500 m.  D is an isolated area at 4000-4100 m. A,B and C is a single glacier extending from 3900-4300 m. F is an area of rapidly diminishing glacier ice.

In the early February image snowcover is good across all ice areas except F. In 2003 there is limited evident change with good snowcover across all except D. By 2013 A, B and C have fragmented into three separate glaciers and F is nearly gone. Only E has significant snowcover.

In 2022 C and D in the Landsat images have declined to less than 50% of their 1986 area, the overall Volcan Overo glaciated area has declined to ~8.1 km2.  It is not quite mid-summer on January 8, 2022 yet all snowcover has been lost from the glaciers of Volcan Overo. The glacier remnants at F are now gone.

Volcan Overo Glaciers at the end of the 2018 melt season in a false color Sentinel image from 3-17-2018. There is no sigificant area of snowcover remaining. A lake is forming at Point A . At Point B this is a single glacier. At Point C an expanding ridge is still narrow and segmented. At Point D three glaciers areas are just losing contact and at Point E a small knob has emerged from ice cap.
Volcan Overo Glaciers at the end of the 2020melt season in a false color Sentinel image from 3-11-2020. There is no sigificant area of snowcover remaining. A lake has formed at Point A . At Point D three glaciers areas are clearly separated.
Volcan Overo Glaciers at the end of the 2022 melt season in a false color Sentinel image from 3-09-2022. There is no sigificant area of snowcover remaining. The lake at Point A is expanding . At Point B the glacier is separating into two parts.. At Point C an expanding ridge is now continuous segmented.
Volcan Overo Glaciers at the end of the 2023 melt season in a false color Sentinel image from 3-09-2023. There is no sigificant area of snowcover remaining for the 2nd consecutive summer. The lake that had formed at Point A has expanded further. Fragmentation at point B, C, and D continue.

The impact of heat waves in 2022 and 2023 has taken its toll on the glacier.

Great Glacier Retreat 1965-2023 Leads to formation of “Great Lake”

Great Glacier terminus change from 1986-2022 illustrating lake expansion. Red arrow=1986 terminus location, Yellow arrow=2022 terminus location. Terminus has retreated 2.1 km during this time with the lake growing 15 km2.

Great Glacier is the largest outlet glacier of the Stikine Icefield feeding the Stikine River. The name came from the large expanse of the glacier in the lowlands of the Stikine River during the late 19th and early 20th century, that has now become a large lake. In 2023 I worked on a signage project for the Great Glacier Provincial Park with Hailey Smith, BC Park Ranger, documenting the changes in this glacier particularly since 1914.

The glacier filled what is now a large lake at the terminus of the glacier pushing the Stikine River to the east side of the valley. The Tahltan nation oral history relates when the glacier bridged the Stikine River and meet Choquette Glacier. In 1914 the glacier was easy to ascend from the banks of the Stikine River, the picture above is from the National Railroad Archive. By 1965 the new lake had formed, but the glacier still reached the far side of the lake in several places as indicated by the 1965 Canadian Topographic Map below. R. Patterson (Writer and Canadian Explorer 1898-1984) noted that Great Glacier came down onto the river flats, and displayed a 7 km front visible from the Stikine River.

Map of Great Glacier in 1965 illustrating the fringing lake.
Landsat images from 1990 and 2022, illustrating changes in the glacier and lake. The transient snowline is at ~900 m in both images.

A comparison of 1986, 1990, 2011 and 2022 illustrates the retreat. By 1986 the new lake had largely developed, and the glacier was beginning to retreat into the mountain valley above the lake. Retreat from the moraines of the late 19th century was 3200 m. By 2011 the glacier had retreated further into valley, 900 m retreat from 1986-2011. From 2011 to 2022 the glacier retreated another 1200 m. The lake has expanded to an area of 15 km2

A view of the glacier from across the lake today indicates the distance to the now valley confined glacier, and the trimlines of the former ice surface, yellow arrows in middle image The Great Glacier has one major tributary on the northeast tributary that is very low in elevation with a top elevation of 800 m. Given the regional snowline of 1100-1200 meters in the 1980s (Pelto, 1987) this is too low to retain snowcover through the summer and will lead to rapid progressive thinning. In 2018 and 2019 the highest observed snowlines in the region occurred, the snowline averaged 1500 m, leaving just 10% of the Great Glacier snowcovered. This is instead of the 60% needed to maintain equilibrium. Stikine Icefield outlet glaciers are all undergoing substantial retreats including Sawyer Glacier, Baird Glacier and Dawes Glacier.

Great Glacier snowline end of summer in 2018 and 2019 reached the highest levels observed at 1500-1600 m.

Eagle Island Ice Cap, Antarctica Loses its Snow Cover Feb 27-March 8, 2024

Eagle Island Ice Cap has 65% snowcover on Feb. 27, 2024 in Sentinel images. After 5 of the next 10 days reached at least 9 C at Esperanza Base the snowcover is just 8% on March 8, 2024.

On February 27, 2024 Eagle Island had ~65% snowcover, by March 8, 2024 this had diminished to just 8% snowcover. This matches last year for the lowest observed snowcover of this ice cap. On February 19, 2023 Eagle Island Ice Cap, Antarctica has less than 10% snowcover. This is less snowcover than observed even after the period of record warm weather over the Antarctic Peninsula in February 2020.  The repeat loss of snowcover has stripped the ice cap of firn exposing bare glacier ice that is darker and melt faster, enhancing melt losses. Temperature when the all time Antartica temperature record was set at Esperenza Base.  Eagle Island Ice Cap (63.65 S 55.50W) is 40 km from Esperanza, with the summit of the ice cap is at 250-300 m and it has an area of 21 km².

In 2024 at Esparanze Base:

  • The average temperature in February was 2.5 C.
  • The high reached 12 C on Feb. 27.
  • In March the temperature reached 9 C on March 4, 6, 7 and 8.

In 2020 we observed blue ice areas (BI) and saturated snow areas (SS) rapidly developed from a snow covered ice cap during the heat wave (NASA EO, 2020). The impact of short term melt events like this on an ice cap like this, is visible and significant for annual mass balance, but not large in terms of long term glacier mass balance (volume change) and area. That year also led to record melt and ponding on the George VI Ice Shelf  (Banwell et al, 2021). In 2022 a similar patter of blue ice developed, but no saturated snow. In 2023 the loss of snowcover was nearly complete exposing a more extensive bare ice and firn surface area that melts more rapidly. This was the result not of a heat wave but of a consistenly warm summer.

Eagle Island Ice Cap rapid snow melt and resultant melt ponds during record warmth in Feb. 2020 seen in Landsat images.
Eagle Island Ice Cap in Sentinel image illustrating 8-10% snowcover on 2-19-2023.

In 2023 at Esparanze Base:

  • November mean temperature 2.5 C above average
  • December mean temperature 0.5 C above average
  • January mean temperature 1.5 C above average
  • February mean temperature 1 C above average

The rapid melt is also apparent on the ice cap on the west end of Vega Island, Antarctica.

Vega Island ice cap on its western has 50% snowcover on Feb 27, 2024 reduced to 20% snowcover on March 8, 2024.

Bernardo Glacier, Chile Lake Drainage 2024-Retreat Continues

Bernardo Glacier in Sentinel images from Dec. 26, 2023 and Feb. 9, 2024 illustrating the drainage of the southern end of the proglacial lake by the northern terminus. The lake was full in 2021, partially drained by Oct. 2022, further drained by March 2023 and did not refill through Sept. 2023. The lake refilled between September and December 2023 . And drained again by Feb. 9,2024. Channel location appears to be at Point C. There is 9 km2 of exposed lake bed.

Bernardo Glacier in Sentinel images from Oct. 16, 2022 and Sept. 17, 2023 illustrating the drainage of the southern end of the proglacial lake by the northern terminus (N). The lake was full in 2021, partially drained by Oct. 2022, further drained by March 2023 and has not significantly refilled by Sept. 2023, still 8 km² of exposed lake bed. 

Bernardo Glacier in Landsat images from 1986 and 2021 illustrating retreat at the southern (S), middle (M) and northern (N) terminus respectively. Red arrows are 1986 terminus locations, yellow arrows are 2021 terminus locations. Separation from Tempano (T) occurs at southern terminus, while lake expansion occurs at M and N.

Retreat of Bernardo Glacier in Landsat images from 2003 and 2015.

In 1986 Bernardo the southern terminus of the glacier was in tenuous contact with Tempano Glacier. The middle terminus primarily ended on an outwash plain with a fringing proglacial lake developing. The northern terminus had retreated a short distance south from a peninsula that had acted as a pinning point. A small lake developed completely separating Bernardo Glacier and Tempano Glacier. By 1998 the northern terminus had retreated into the wider, deeper portion of the lake basin that was now filled with icebergs. In 2015 the northern terminus had retreated 3.5 km since 1986. By 2021 the northern terminus had retreated 4.1 km.  This led to a 7.8 km² lake expansion at the northern terminus, with a total lake area of 17.5 km².

On October 2, 2022 the water level had dropped some, with lake area falling slightly. The lake continued to fall through the summer season of 2023. The lake did not refill through the winter and into the spring, September 2023, with the lake having an area of 9.5 km², and 8 km² of lake bed still exposed. The lake did refill by December 2023, and then drained to an even greater extent then in 2023 as of Feb. 2024. Continue glacier thinning and retreat will reduce the ability of the glacier to continue to dam this lake. Gourlet et al (2016) identify Bernardo Glacier as having thinner ice than other large outlet glaciers such Jorge Montt or O’Higgins, which helps lead to rapid terminus change.

Southern Andean huemel an endemic deer on the foreland beyond Bernardo Glacier (Photograph from Eñaut Izagirre

Mount Everest Region Snow Line Winter 2024: Rises Above and Remains Above 6000 m

The snow line on Mount Everest Region glaciers on Feb. 11, 2024 indicated by yellow dots on the Landsat image. Note that Nangpa La and Nup La-two high passes (5800-5900 m) are both snow free. The average snow line is 6000 m.

The snow line on Mount Everest Region glaciers on Oct. 30, 2023 indicated by yellow dots on the Landsat image. Note that Nangpa La and Nup La-two high passes are both snow covered. The average snow line is 5700 m.
The snow line on Mount Everest Region glaciers on Nov. 15, 2023 indicated by yellow dots on the Landsat image. Note that Nangpa La and Nup La-two high passes are both snow covered. The average snow line is 5800 m.
The snow line on Mount Everest Region glaciers on Jan. 10, 2024 indicated by yellow dots on the Landsat image. Note that Nangpa La and Nup La-two high passes are both snow free. The average snow line is 5950 m.
Cumulative precipitation through the year at Everest Base Camp. The typical dry period begins in October and extends into Februrary, but this year is the lowest since the National Geographic Rolex Perpetual Planet weather station was installed.

In several recent years including Winter 2017/18, 2020/21 and 2023/24 the snow line has risen substantially on Mount Everest glaciers from October into the mid-winter period (Pelto et al 2022).. This indicates not just dry conditions, but conditions that allow significant ablation at the snow line, which has risen 150-300 m during each of these periods on the glaciers. The ablation can be from melting or as the case this winter sublimation, which can lead to losses up to 2.5mm/day (Tenzing Chogyal Sherpa et al 2023). When will snow finely cover the glaciers in the Everest region?