Mount Everest Glacier Snow Line Remains Above 6000 m during February 2024

The snow line (yellow dots) on Mount Everest region glaciers on Feb. 11, 2024 in this Landsat image average 6040 m. This is a 200 m rise from October 22, 2023 and a 20 m rise since Jan. 10, 2024. The passes at Nangpa La and Nup La are both snow free. 

The snow line (yellow dots) on Mount Everest region glaciers on Jan. 10, 2024 in this Landsat image average 6020 m. This is a 200 m rise from October 22, 2023. The passes at Nangpa La and Nup La are both snow free. The rise has occurred during a prolonged dry period, temperatures have been cold as is typical.

Mount Everest glaciers are summer accumulation-type glaciers with ~75% of annual precipitation occurring during the summer monsoon (JJAS). The summer monsoon period also has the highest melt rates at lower elevations on the glaciers. October has been considered the end of the melt season in the region, with limited precipitation in the post-monsoon and early winter season (October–December). Winters (DJF) are cold and dry, though they do have the most variable precipitation.

A rising snow line elevation on glaciers in the region from October to February indicates significant ablation occurring during the first half of the winter season on glaciers in the Mount Everest region. The series of weather stations on Mount Everest installed by the National Geographic Expedition-Perpetual Planet in 2019 and with repeated updates and maintenance since provides the ability to put the snow line change in context of the local conditions for the first time. higher snow line at the end of summer monsoon season in 2020 and 2023, combined with warmer post-monsoon, and dry winter conditions, can drive a snow line to rise from October into the winter on Himalayan glaciers, thus extending the melt season (Pelto et al 2022). An examination of winter weather conditions from stations on Mount Everest documented that substantial sublimation rates with losses up to 2.5mm/day occur (Tenzing Chogyal Sherpa et al 2023).

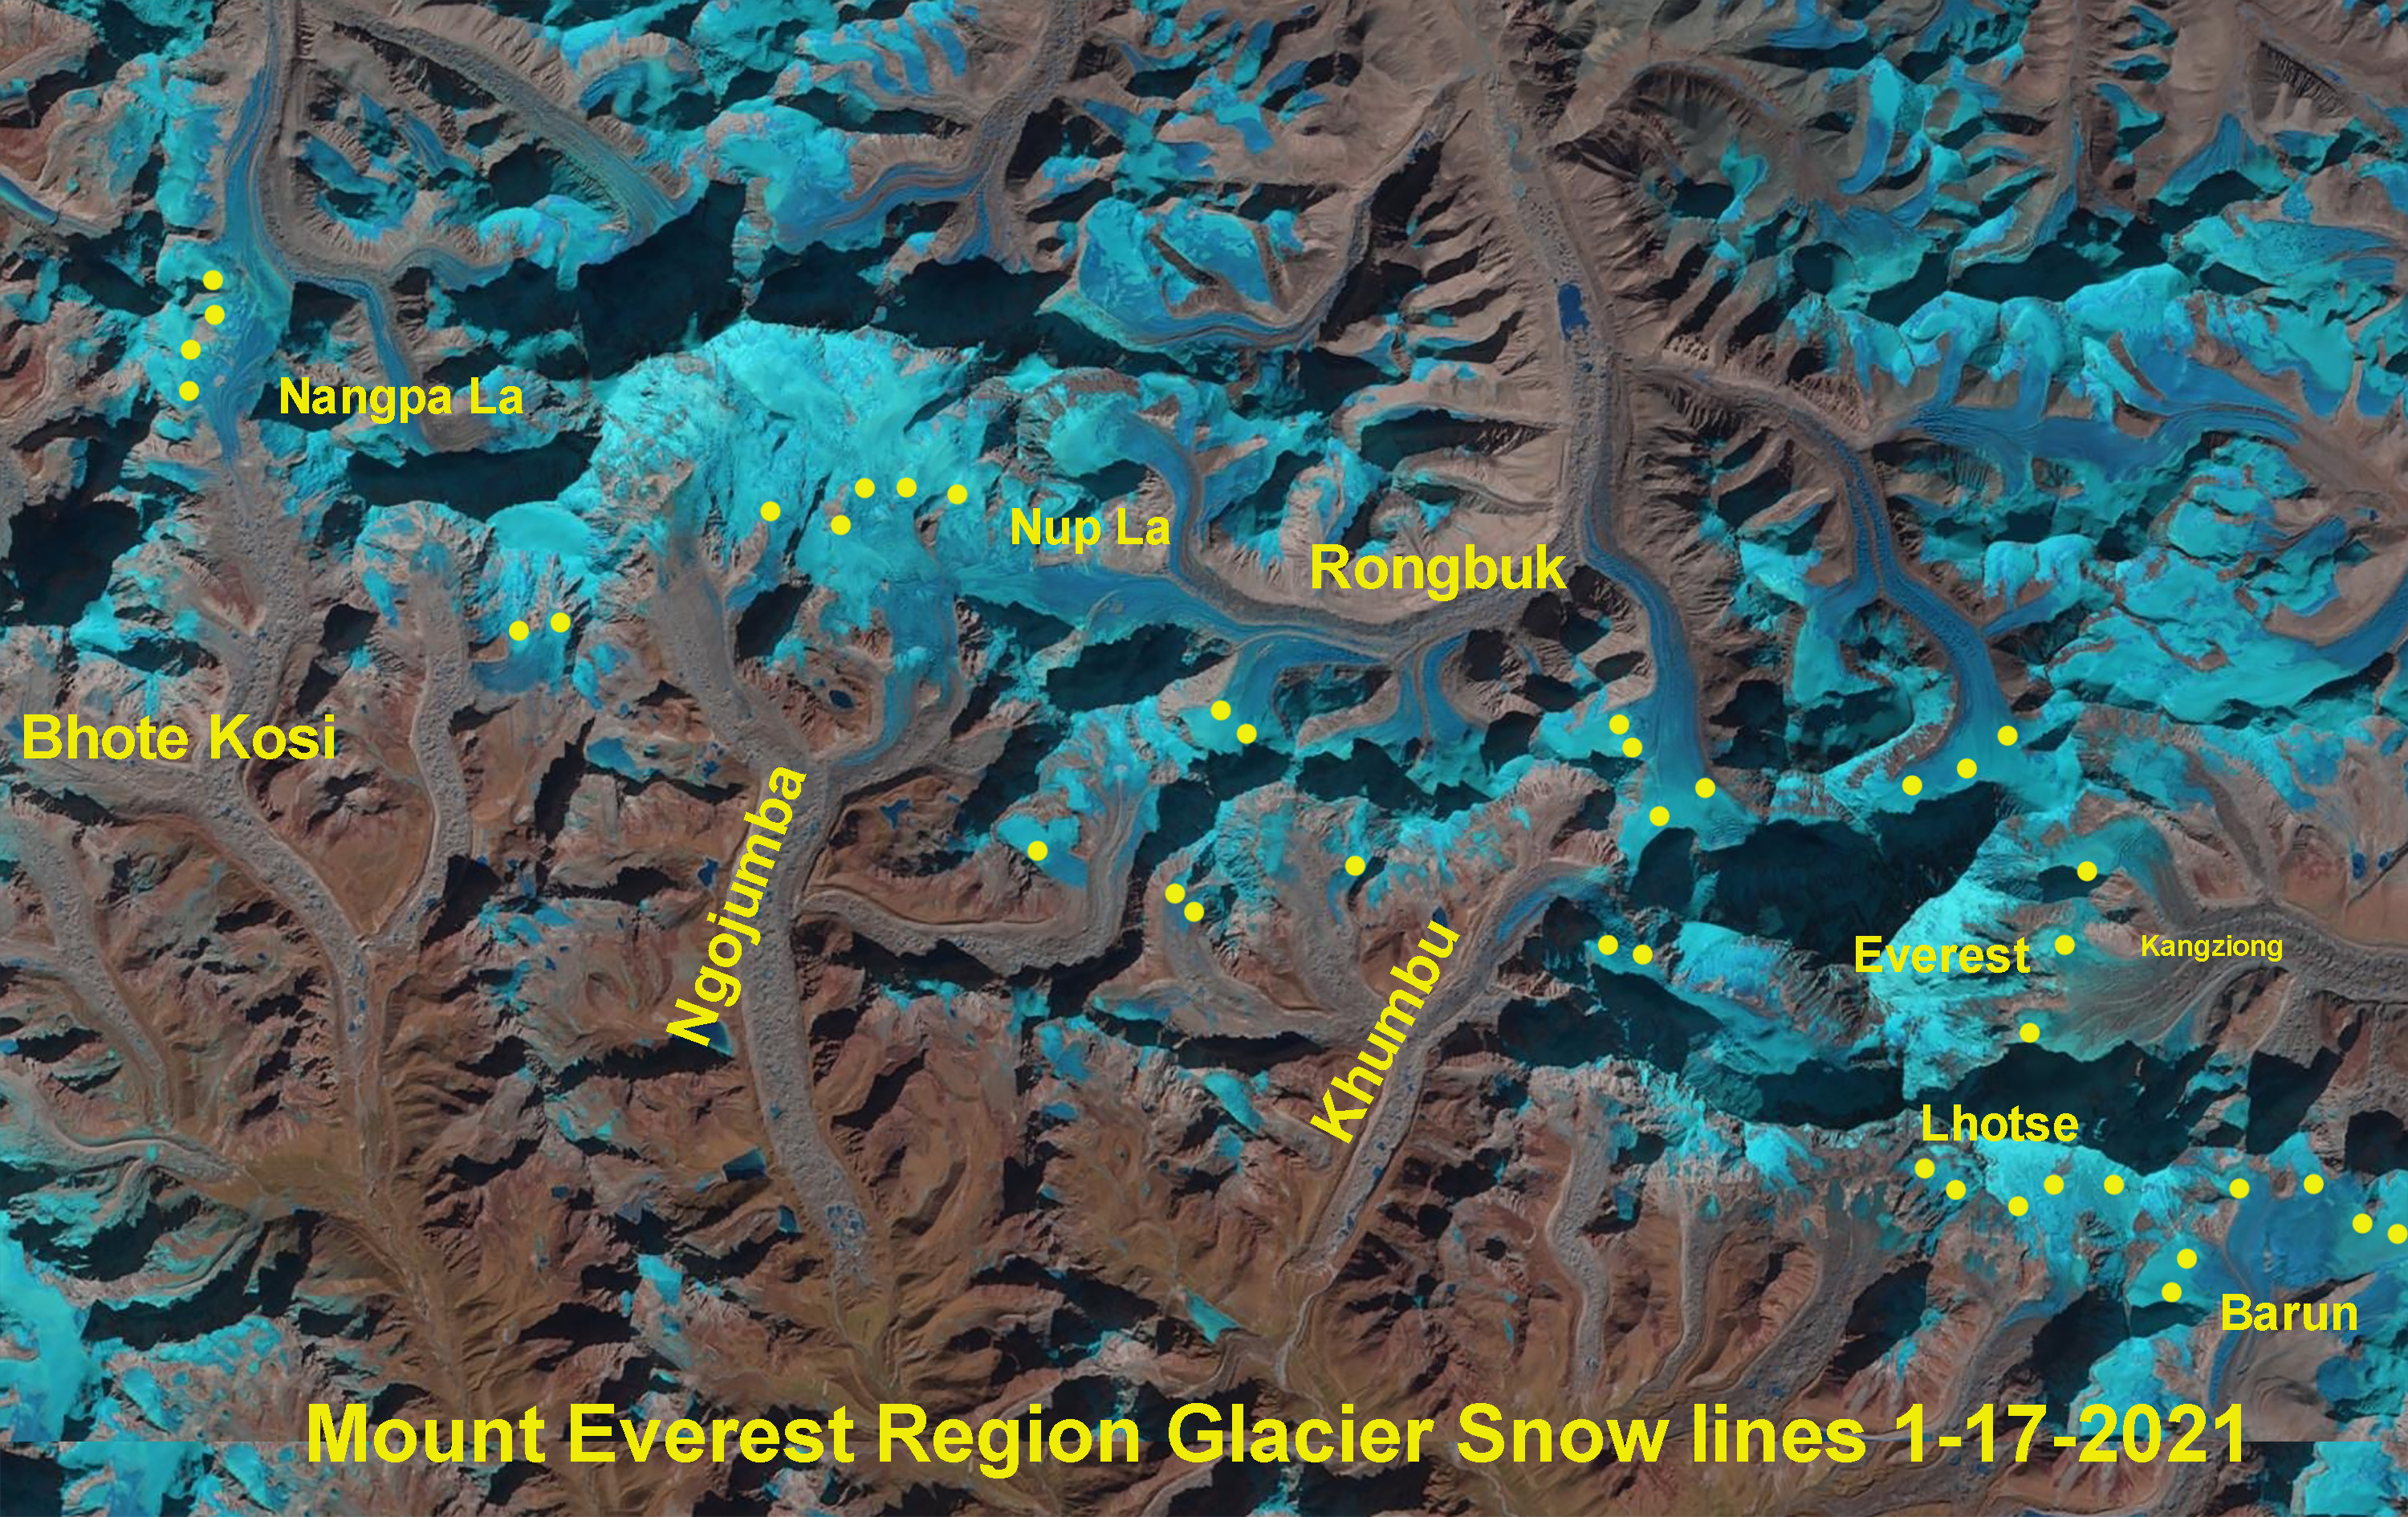
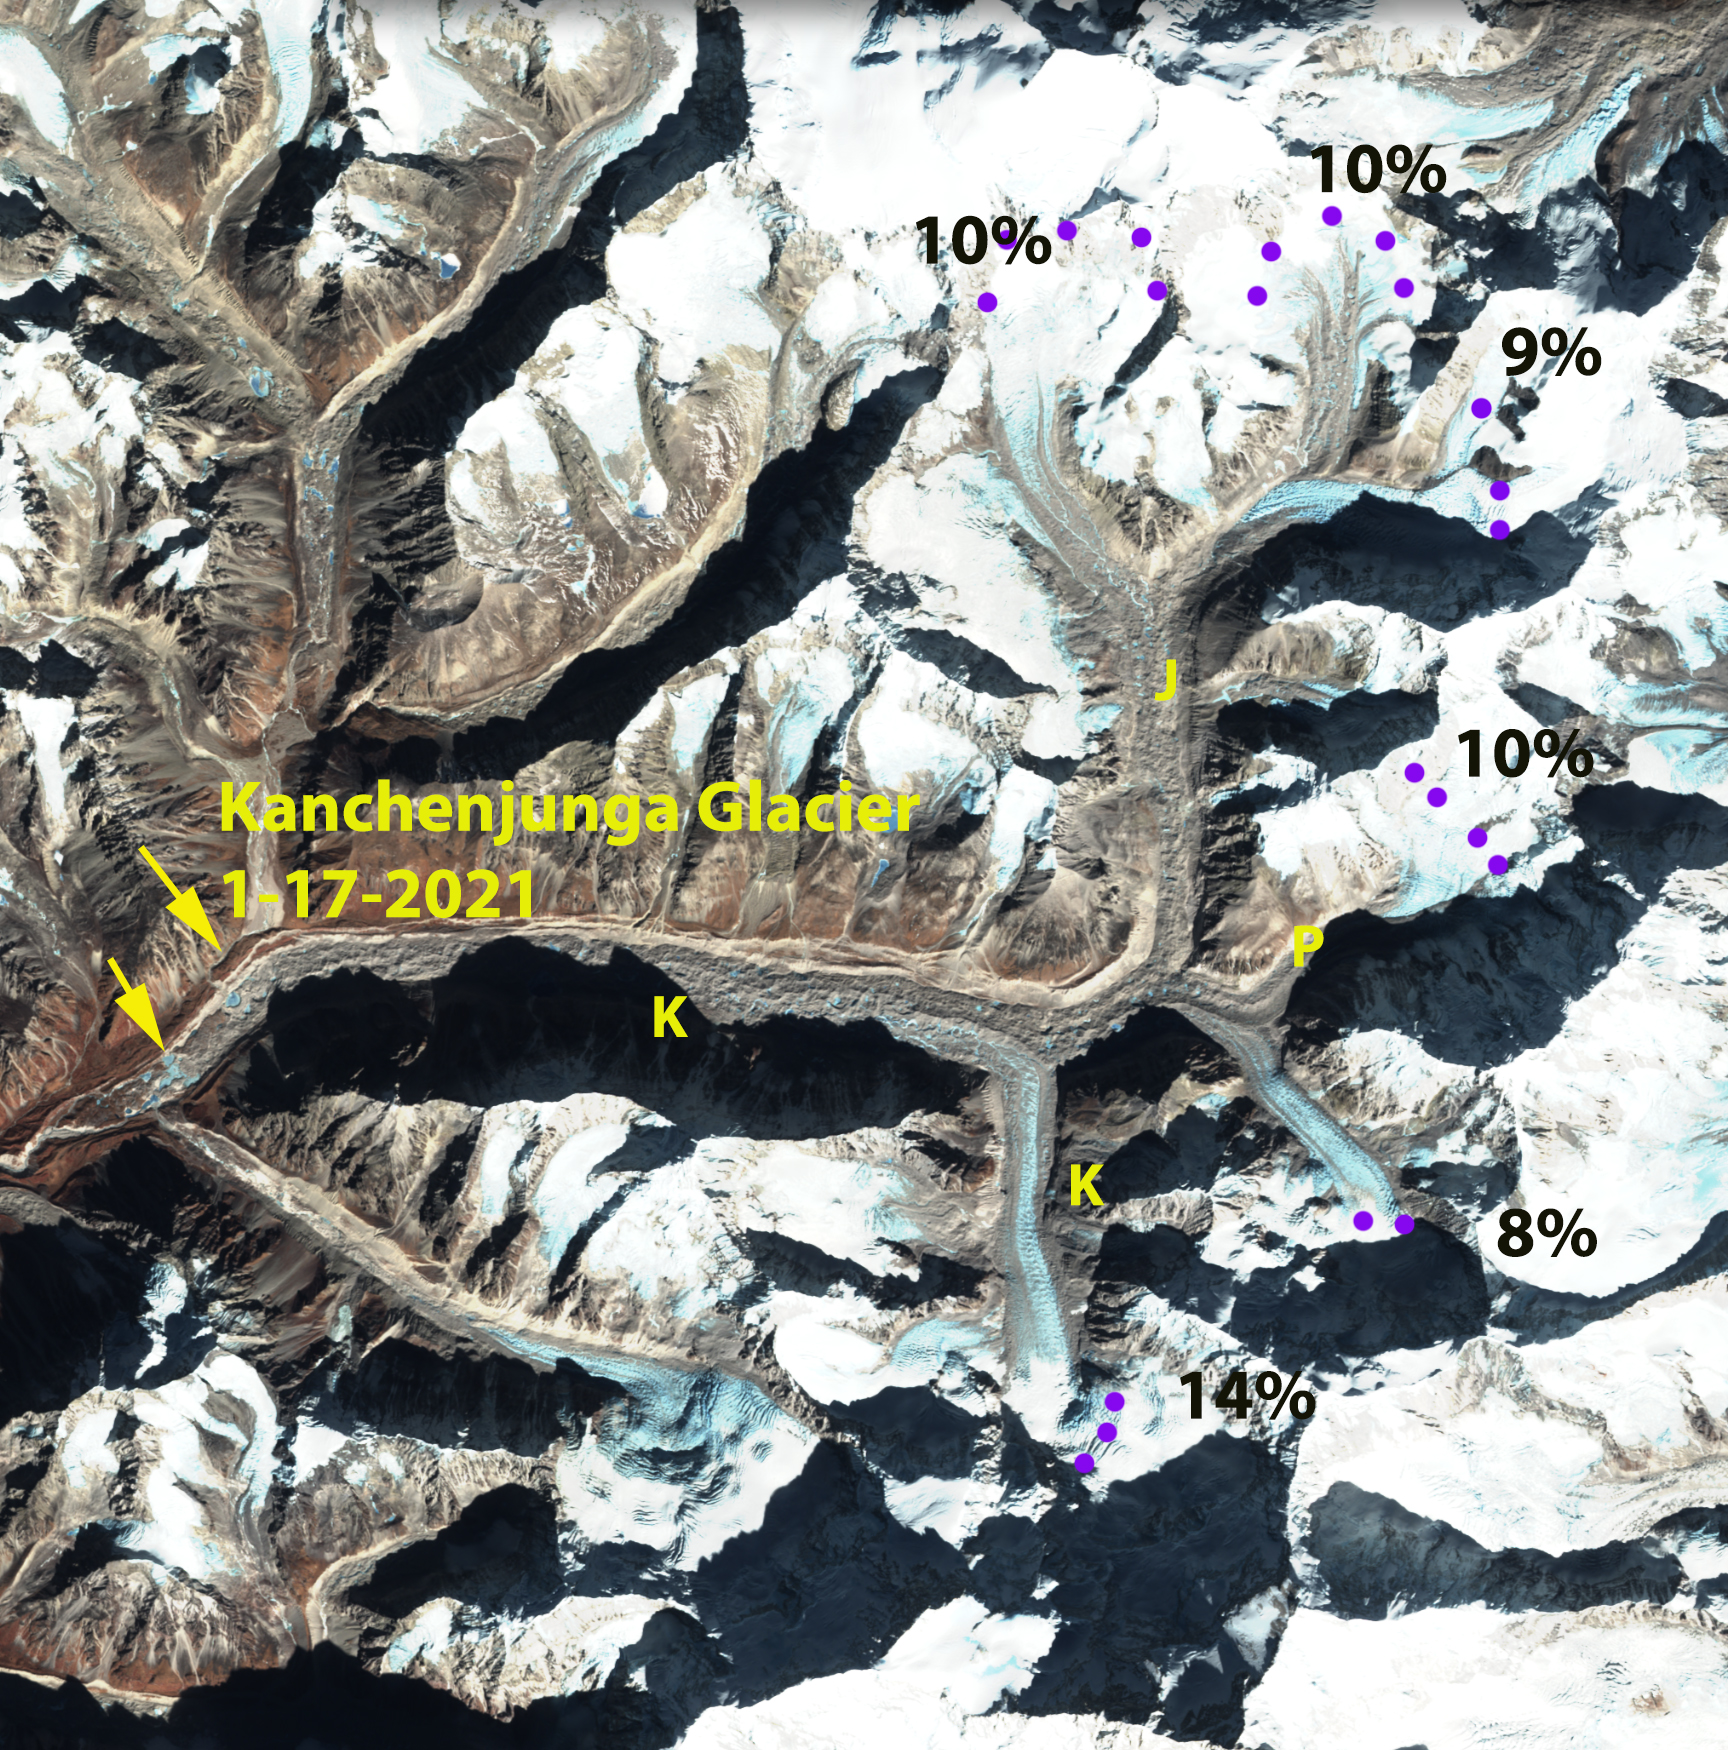
The snow line (yellow dots) on Mount Everest region glaciers on Jan. 17, 2021 in this Landsat image average 6150 m. This was a 250 m rise from Oct. 13, 2020. The passes at Nangpa La and Nup La are both snow free. The rise has occurred largely during a period of record winter warmth extending from Dec. to Jan.  

On Oct. 22, 2023 a Landsat image allowed identification of the snow line on Everest region glaciers, which averaged 5800 m. From Nov. 1-2023 to Jan 20, 2024 there has been less than 25 mm of precipitation at Everest Base Camp (5315 m), this persistent dry period had one period of warm weather from Dec 14-Dec. 22, with six days exceeding 0 °C. From Dec 23-Jan 20 winter, temperatures have remained below 0 °C. Daily images from. The EBC weather station have yielded a nearly continuous series of clear sky days. The result has been sustained sublimation that is important for snow loss, despite the low temperatures solar radiation does generate ablation even when temperatures do not exceed 0 °C for ice, and snow in regions with significant debris material (Matthews et al 2020). The result the average glacier snow line has risen above 6000 m by January 10, 2024 and has remained above this level into Februrary 2024.

During the 2020/2021 winter the snow line rose an average of over 200 m from 13 October 2020 to 17 January 2021, with freezing levels indicating ablation to ~6000 m (Pelto et al 2022). This snow line rise was driven by a combination of dryness and warm temperatures, with ERA5 reanalysis temperature reconstructions for Everest Base Camp (5315 m) for the 1950–February 2021 period indicating that six days in the January 10–15 period in 2021 fell in the top 1% of all winter days since 1950, with January 13, January 14, and January 12, being the first, second, and third warmest winter days. Note in the graph below that temperatures rose above 0 °C on 11 consecutive days. The temperature also exceeded 0 °C on seven days in December.

In 2020/21 the conditions remained warm and dry into mid-January (Pelto et al 2022), while in 2023/24 the conditions have been cooler and dry. In both cases the rising snowline is the result of sublimation. Relative humidity measured at the has averaged less than 20% at the EBC in January 2024 (National Geographic-Perpetual Planet), this increases the potential for sublimation and reduces potential for melting..

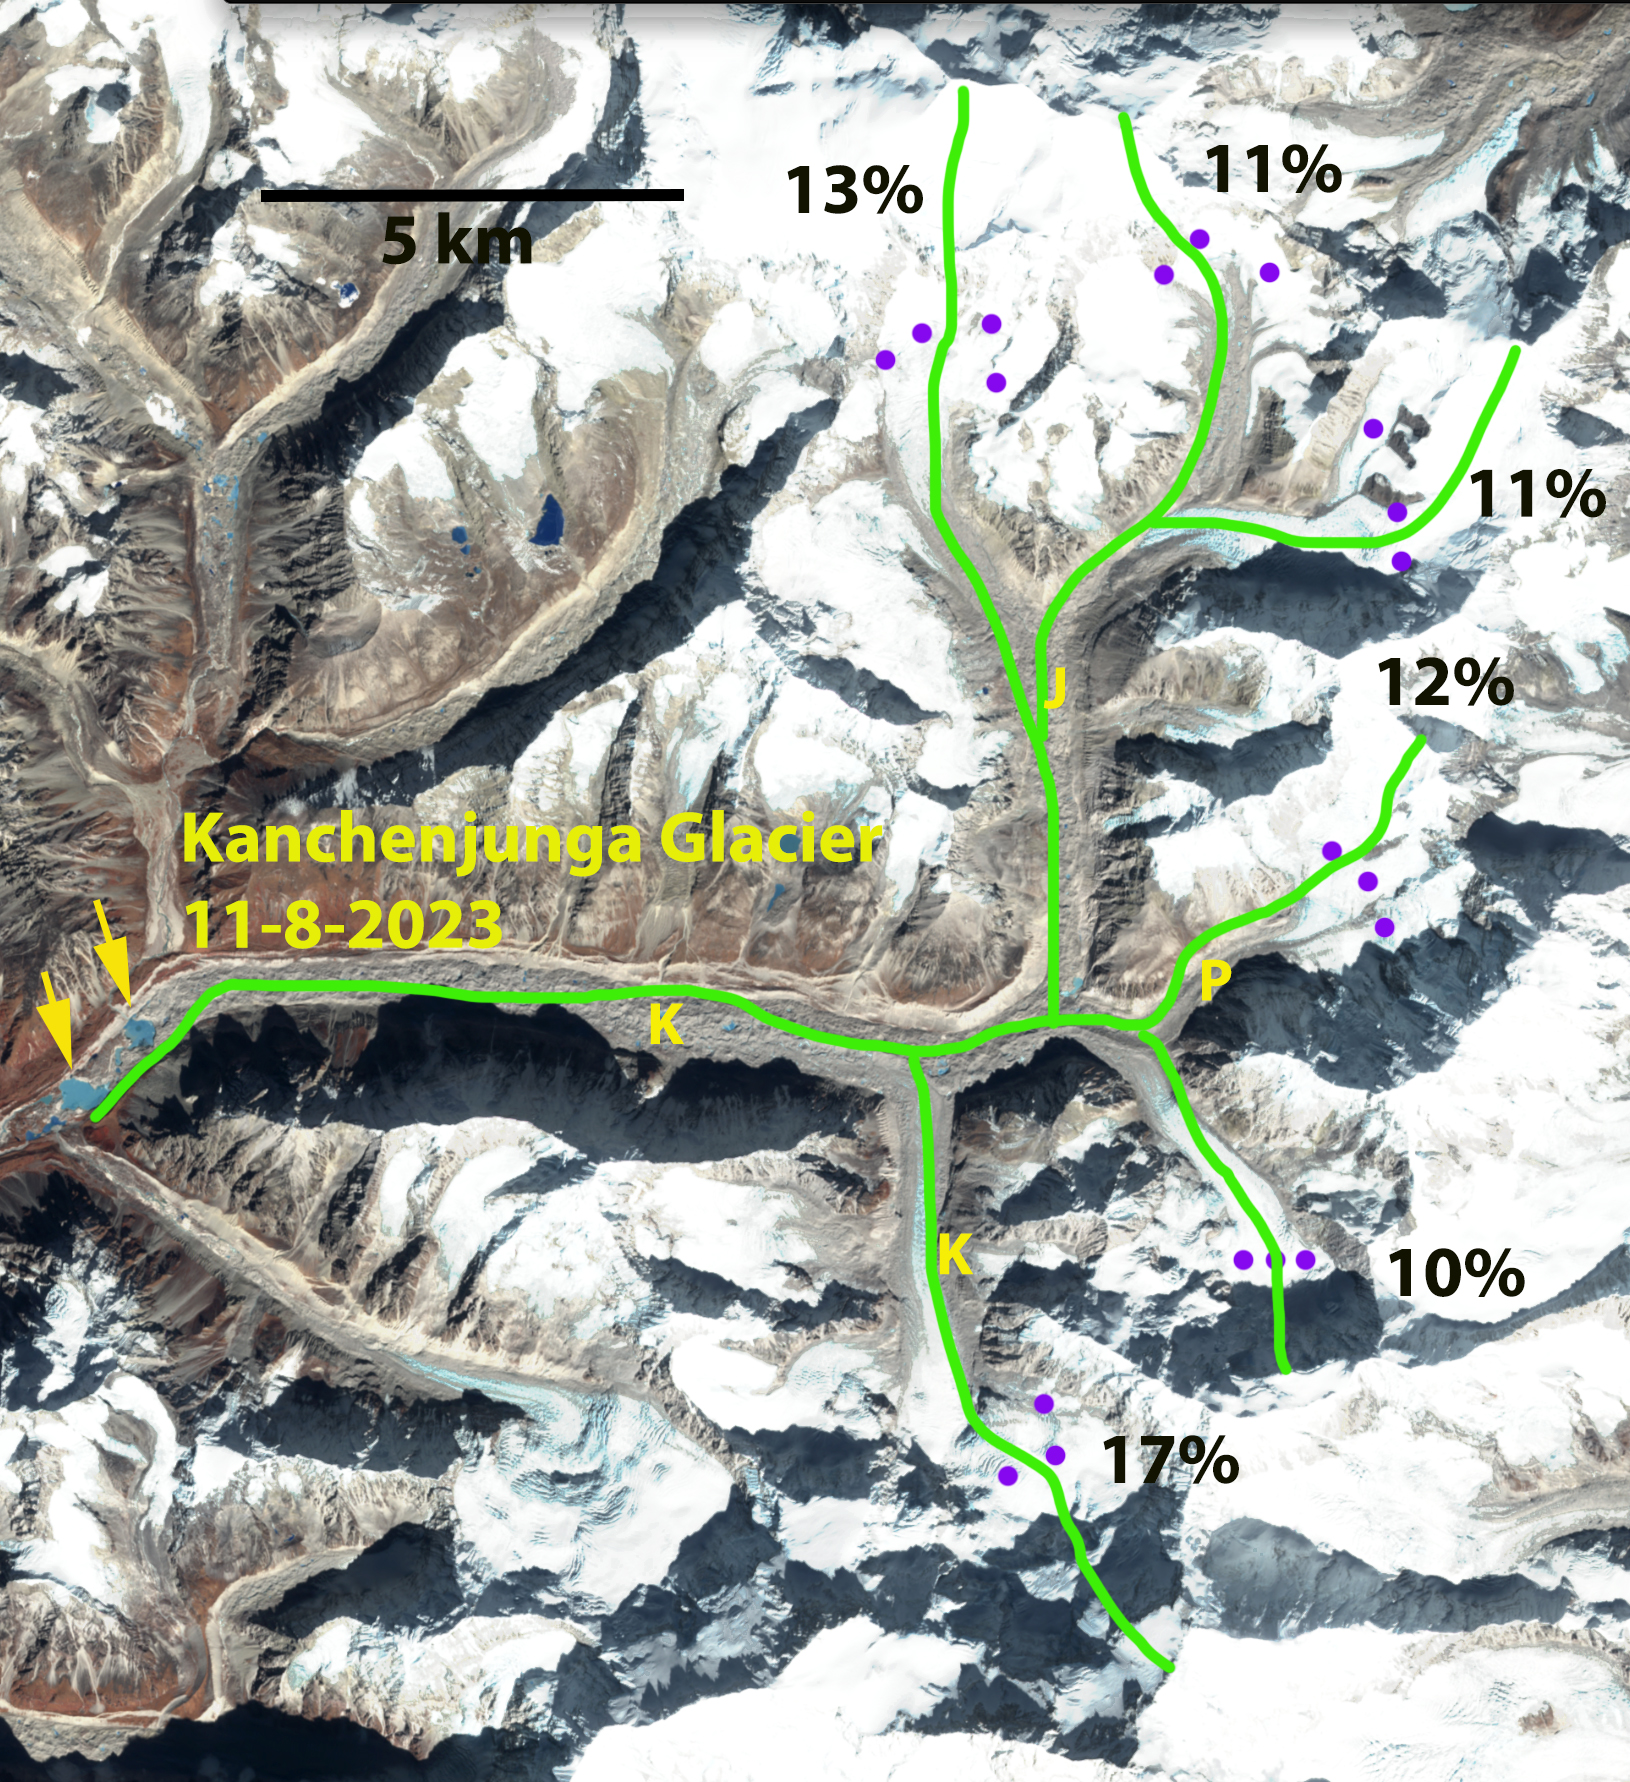
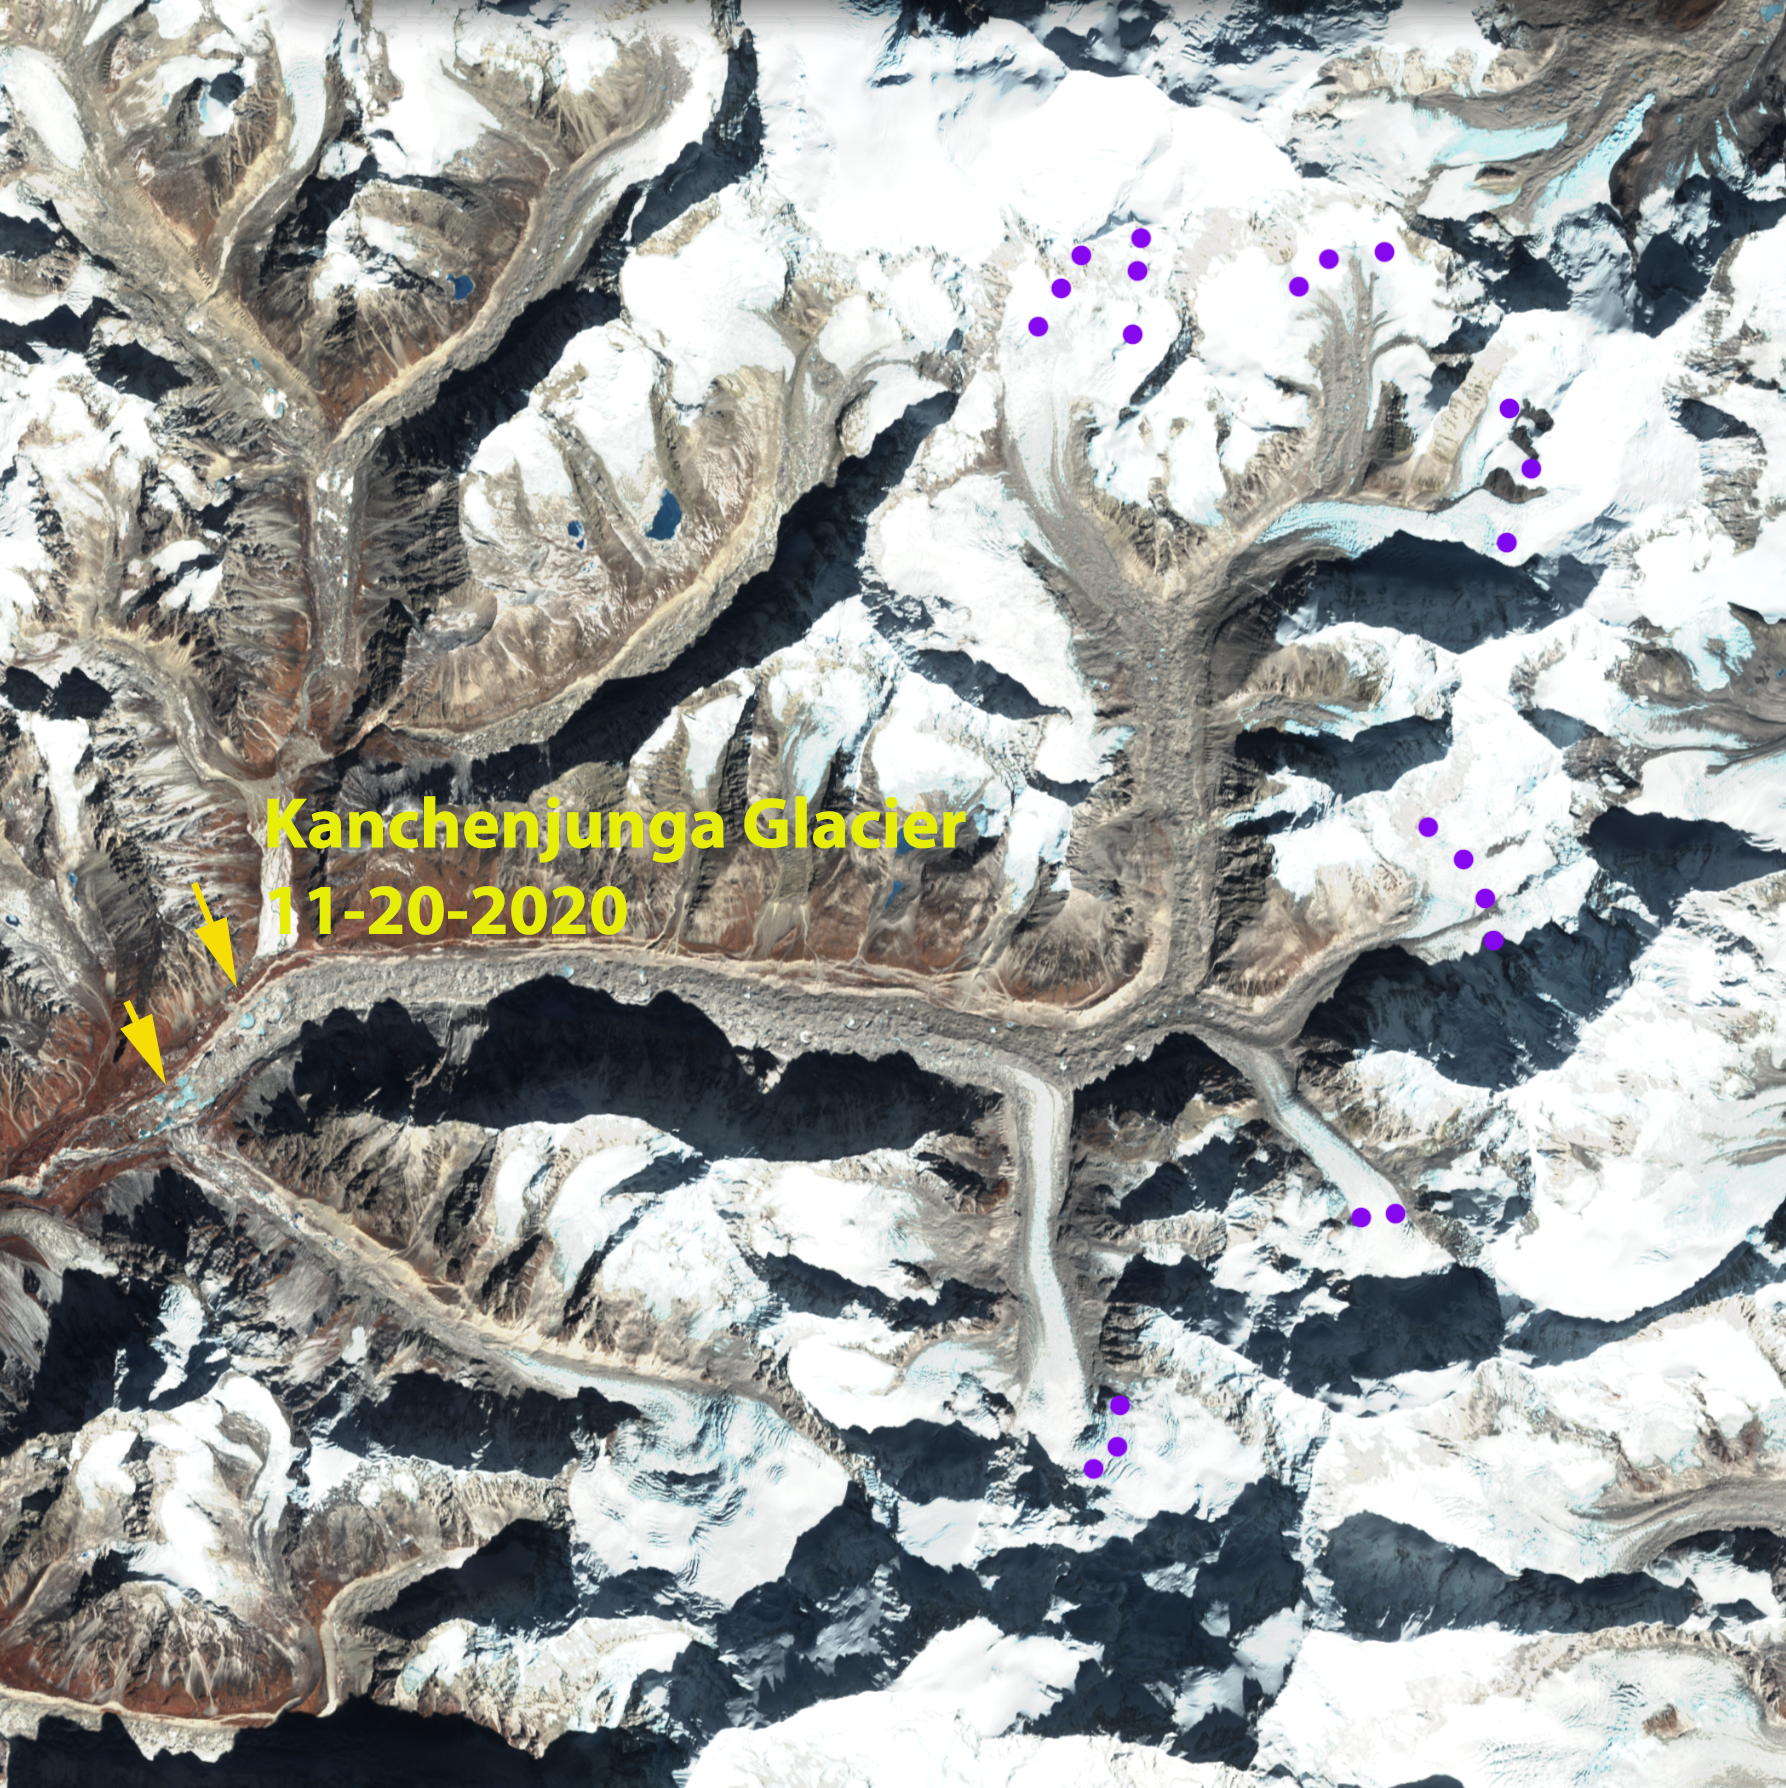
Elevation of the snow line on Everest region glaciers determined from Landsat images of 10/13/2020, 1/17/2021, 10/22/2023 and 1/10/2024.

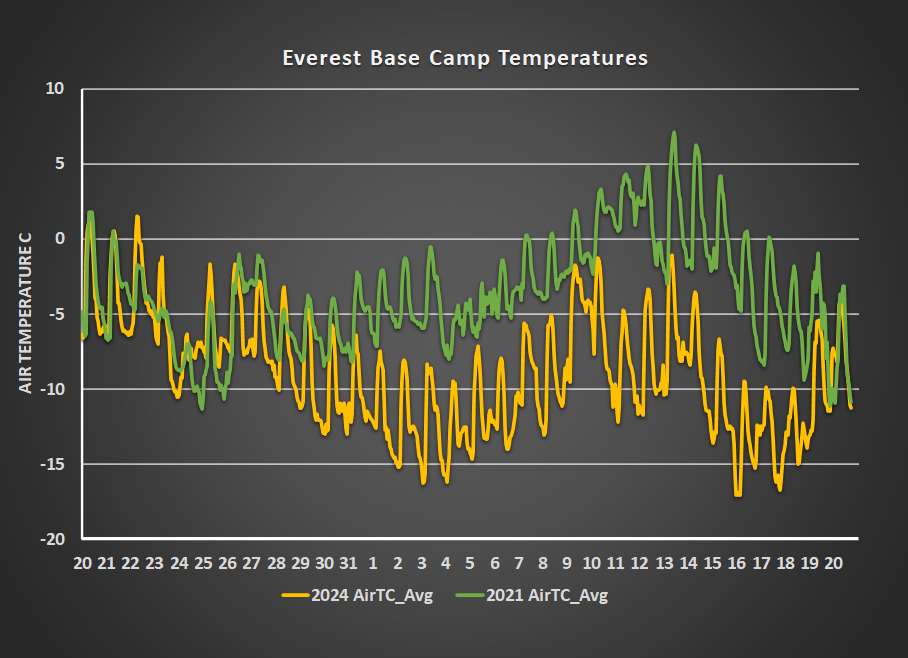
Everest Base Camp weather data from the Everest Weather Station Network, National Geographic 

This data is supplied by Tom Matthews (Kings College, London), and Baker Perry (Appalachian State University).

Upsala Glacier, Argentina Drainage of Lago Guillermo 2024

View of Lago Guillermo in true color Sentinel 2 images from Dec. 31 2023 and Jan 12 2024. Illustrating drainage of Lagor Guillermo (LG). Revealing more of the Peninsula (P). Upsala Glacier (U) had impounded this lake since formation by 1957.

Lago Guillermo draining during early January 2024 as revealed by Landsat images. Notice inlet left dry at Arrow 1, Arrow 3 ad Arrow 4. New islands at Arrow 2.

Lago Guillermo developed by 1957 as Upsala Glacier, Southern Patagonia Icefield retreated (Warren et al 1995). By 1999 a peninsula was evident extending south into the lake from the glacier terminus, see Landsat images below. By 2016 this peninsula was km long. Due to retreat and thinning of Upsala Glacier leading to detachment of Bertacchi Glacier in 2021/22 (Pelto, 2022), the ice dam impounding this lake has bee reduced. .  Malz et al (2018) indicated a 3.3 m thinning of Upsala glacier with significant thinning extending to the Viedma Glacier divide. On Dec. 31-2023 the lake looks essentially as it has since 2016. By Jan 12. 2024 the lake had drained significantly leaving the ice margin for the first time in over seventy five year not terminating in the lake (arrow 4). The eastern terminus is now on land. The lake drainage exposed several islands within the lake (Arrow 2-Arrow 3). Led to drainage of the southern inlet at Arrow 1. Between 12-31-2023 and 1-15-2024 Lago Guillermo declined from 16 km2 to 10 km2 in area.

Recent retreat has exposed some interesting fossils around Lago Guillermo!

Upsala Glacier (U) in Landsat images from 1999, 2016 and 2023 illustrating both retreat and the separation from Bertacchi Glacier (B). Cono Glacier (C) is the next tributary to the north, to the east the Peninsula (P) in Lago Guillermo has grown as the lake has expanded.

Observations of 40th Field Season North Cascade Glacier Climate Project

The summer of 2023 was our 40th field season observing the response of North Cascade glaciers to climate change. Each year we visit a series of glaciers on the same date to complete our annual examination. We carry all of the equipment to each field site in backpacks and camp in tents near the glacier. All the glaciers we observe, except Easton Glacier, are in Wilderness Areas. This precludes the use of mechanized equipment or leaving instruments behind. We work each day in almost any weather conditions, and in the last decade that means dealing with forest fire smoke, only a few days have forced us to remain in our tents. We have covered over 5,000 miles, completed over 40,000 measurements and spent 800 nights in tents during the course of this research project.  Three of the glaciers we observe are World Glacier Monitoring Service reference glaciers (42 in the world).

The field team consisted of Jill Pelto (Art Director), Mauri Pelto (Science Director), Julia Ditto (Field Artist), Mariama Dryak (Field Scientist-Team Logistics), Kai Yuan Wang (Field Scientist) Muruganandham Shivaprakesh (Field Scientist). For the third straight year conditions were poor for the glaciers. The 2021-2023 period was the worst three year stretch during the last 40 years with glaciers losing ~5-6 m of thickness, which is 10-20% of glacier volume depending on the glacier.

“40 Years in the North Cascades” by Jill Pelto. This painting is an emotional piece for me. It is an updated version of the very first data-art painting I created when I came up with the idea in 2015. The top surface of the mountain glacier is a line graph that depicts the mass balance of North Cascade glaciers in Washington state from 1984-2022.

We have observed the loss of three of our key glaciers we monitor, every glacier in the range has experienced significant retreat, and volume loss. Our mass balance observations indicate an average loss of 27 m water equivalent, ~30 m in thickness and ~35-40% of the entire volume of the glaciers in the mountain range lost. The summer of 2023 had the largest loss of glacier area of any of our 40 years, average terminus retreat exceeded 25 m. Ice Worm Glacier ceased to be an active glacier, joining a rapidly growing list of glaciers that are no more. The glaciers on Mount Daniel/Hinman in particular collapsed. The main variable we measure to determine glacier health is mass balance, the difference in snowfall gain vs. melt each year. The result of three bad years in a row 2021-2023, with losses exceeding -1.5 m led to this rapid retreat. The extent of blue ice was the highest we have observed on both Mount Daniel (95%) and Mount Baker (70%). This made traversing the glaciers more challenging. The added newly deglaciated unstable terrain also added challenge in accessing the glaciers.

Sholes Glacier is on a ridge extending northeast from Mount Baker and is at the headwaters of the North Fork Nooksack River. With the Nooksack Tribe we measured glacier runoff below this glacier from 2012-2021. The glacier mass balance is 24.5 m, with 2023 comprising 10% of that. The glacier has lost 10 m of thickness in the last 5 years, driving a rapid increase in retreat rate and opening a large ice cave near terminus.

Columbia Glacier is a cirque glacier at the headwaters of the North Fork Skykomish River. It is fed by avalanches mainly from the west side (left in images). The glacier retreat has accelerated in the last decade exposing a growing new lake. By 2023 the glacier has lost 40% of its volume since 1984. This is a World Glacier Monitoring Service reference glacier, one of 42 in the world.  The slopes above the glacier have lost considerable perennial snowpack leaving much deeper depressions/basins that must be filled in the winter before avalanching commences. This has reduced the input of avalanches for the glacier.

Rainbow Glacier is on the northeast side of Mount Baker and is a valley glacier that feeds Baker Lake. The glaciers starts at 2100 m at a junction with the Park and Mazama Glacier. This is a WGMS reference glacier. The glacier mass balance loss has been 19.8 m, the slowest rate of any of the glaciers. The terminus has retreated 850 m. 

Lower Curtis Glacier is a cirque glacier on Mount Shuksan. The glacier is avalanche fed and feeds Creek and then Baker Lake. The glacier has a steep seraced thick terminus front that reduces retreat rate, though this icefall has thinned rapidly in the last 5 years. Retreat has been 180 m since 1984, but will continue to increase due to the rapid thinning. Mass balance loss of 29.9 m is leading to significant marginal recession too.

Easton Glacier is a slope glacier on the south side of Mount Baker. The glacier feeds into Sulphur and Rock Creek and then the Baker River system. Sulphur Creek is diverted into Baker Lake. This is a WGMS reference glacier and has a mass balance loss of 24 m since 1990. The retreat of this glacier from the 1955-1980 period of advance was minor until 1992. Since then the retreat has been 570 m, including 100 m in the last two years.

Field team standing at the 2022 terminus location of Easton Glacier looking at one year of retreat on August 11, 2023.

Ice Worm Glacier is a small cirque glacier on the east side Mount Daniel feeding the Cle Elum River. The glacier has been retreating rapidly both at the terminus and at its head. The rapid area thinning and retreat from 2021-2023 resulted in many stream channels in the glacier reaching bedrock. The glacier mass balance has been -31.3 m since 1984, which is about 80% of its initial volume. Depth to bedrock is typically 4-6 m. The area of this glacier has dropped to 40,000 m² and it is no longer moving. Hence, this is now just relict ice, not an active glacier.

Daniels Glacier is a small slope glacier on the east side Mount Daniel feeding the Cle Elum River. The glacier dominated the east side of Mount Daniel in 1984, but now only 30% remains. Rapid mass loss of 27.5 since 1984 is leading to continued rapid disintegration of this now thin glacier. We observed many crevasses reaching bedrock even well above the terminus in 2023.

Lynch Glacier is on the northwest side of Mount Daniel at the headwaters of the South Fork Skykomish River. In 1984 the lake below was pea soup colored and filled with icebergs. Now it is a deep azure blue. The glacier has lost 25.4 m leading to rapid disintegration of the western side of the glacier. The steep thick terminus ending in the lake has retreated more slowly than other glaciers, but the volume loss has been similar.

In our camp on the North side of Mount Baker after a day on Rainbow Glacier, looking for mountain goats.

Cascade Pass Area Loses Two Glaciers

Screenshot
Screenshot

The Triplets and Cascade Peak glacier in GLIMS glacier viewer with the red outlines of the 1958 and 2015 margins and the black dot indicating they are now extinct.

In a 1993 Washington Geology article I noted that “In the Cascade Pass area two small glaciers in Torment Basin and two beneath the Triplets Peak and Cascade Peak have altitude ranges of less than 150 m. These glaciers in 1985, 1987 and 1992 were entirely in the ablation zone if present conditions persists they will disappear.” This is an update on the glaciers below The Triplets and Cascade Peak. The threshold for a glacier to exist in terms of area is typically 50,000 m² or 10,000 m², there must also be motion which is increasingly rare as area drops below 50,000 m² (Leigh et al 2019). Motion is typically determined by active crevassing, which does not include relict crevasses reaching bedrock (Fountain et al 2023). To survive a glacier must have a persistent accumulation zone, the lack of this leads to thinning of the glacier even in its upper accumulation area (Pelto, 2010).

triplets 1986

The Triplets and Cascade Peak glacier with plentiful active crevassing in 1986 image I took from near Cascade Pass.

triplets 1990
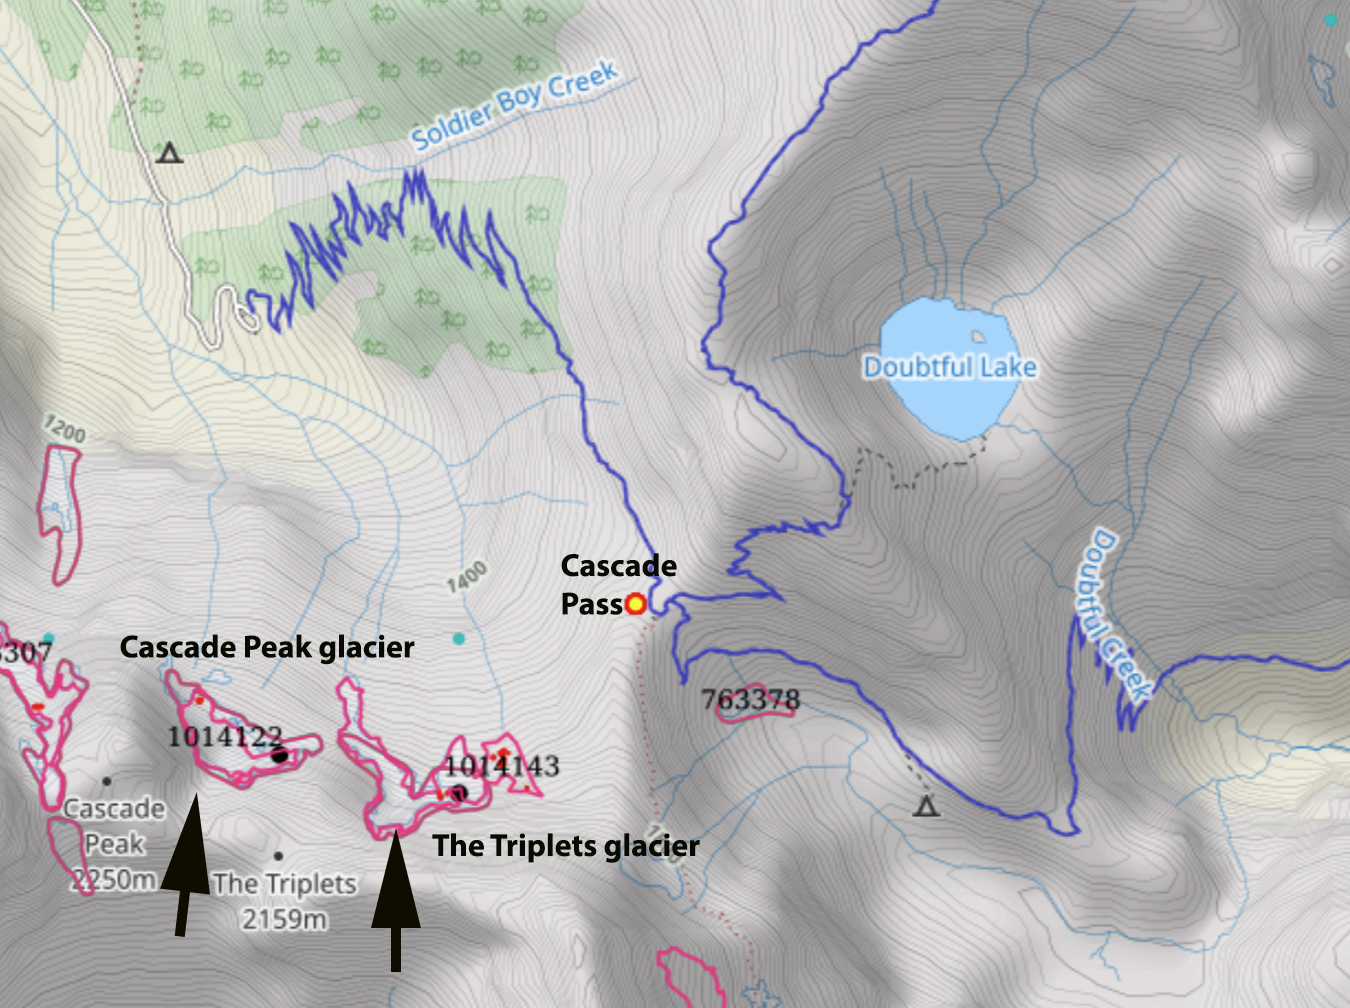
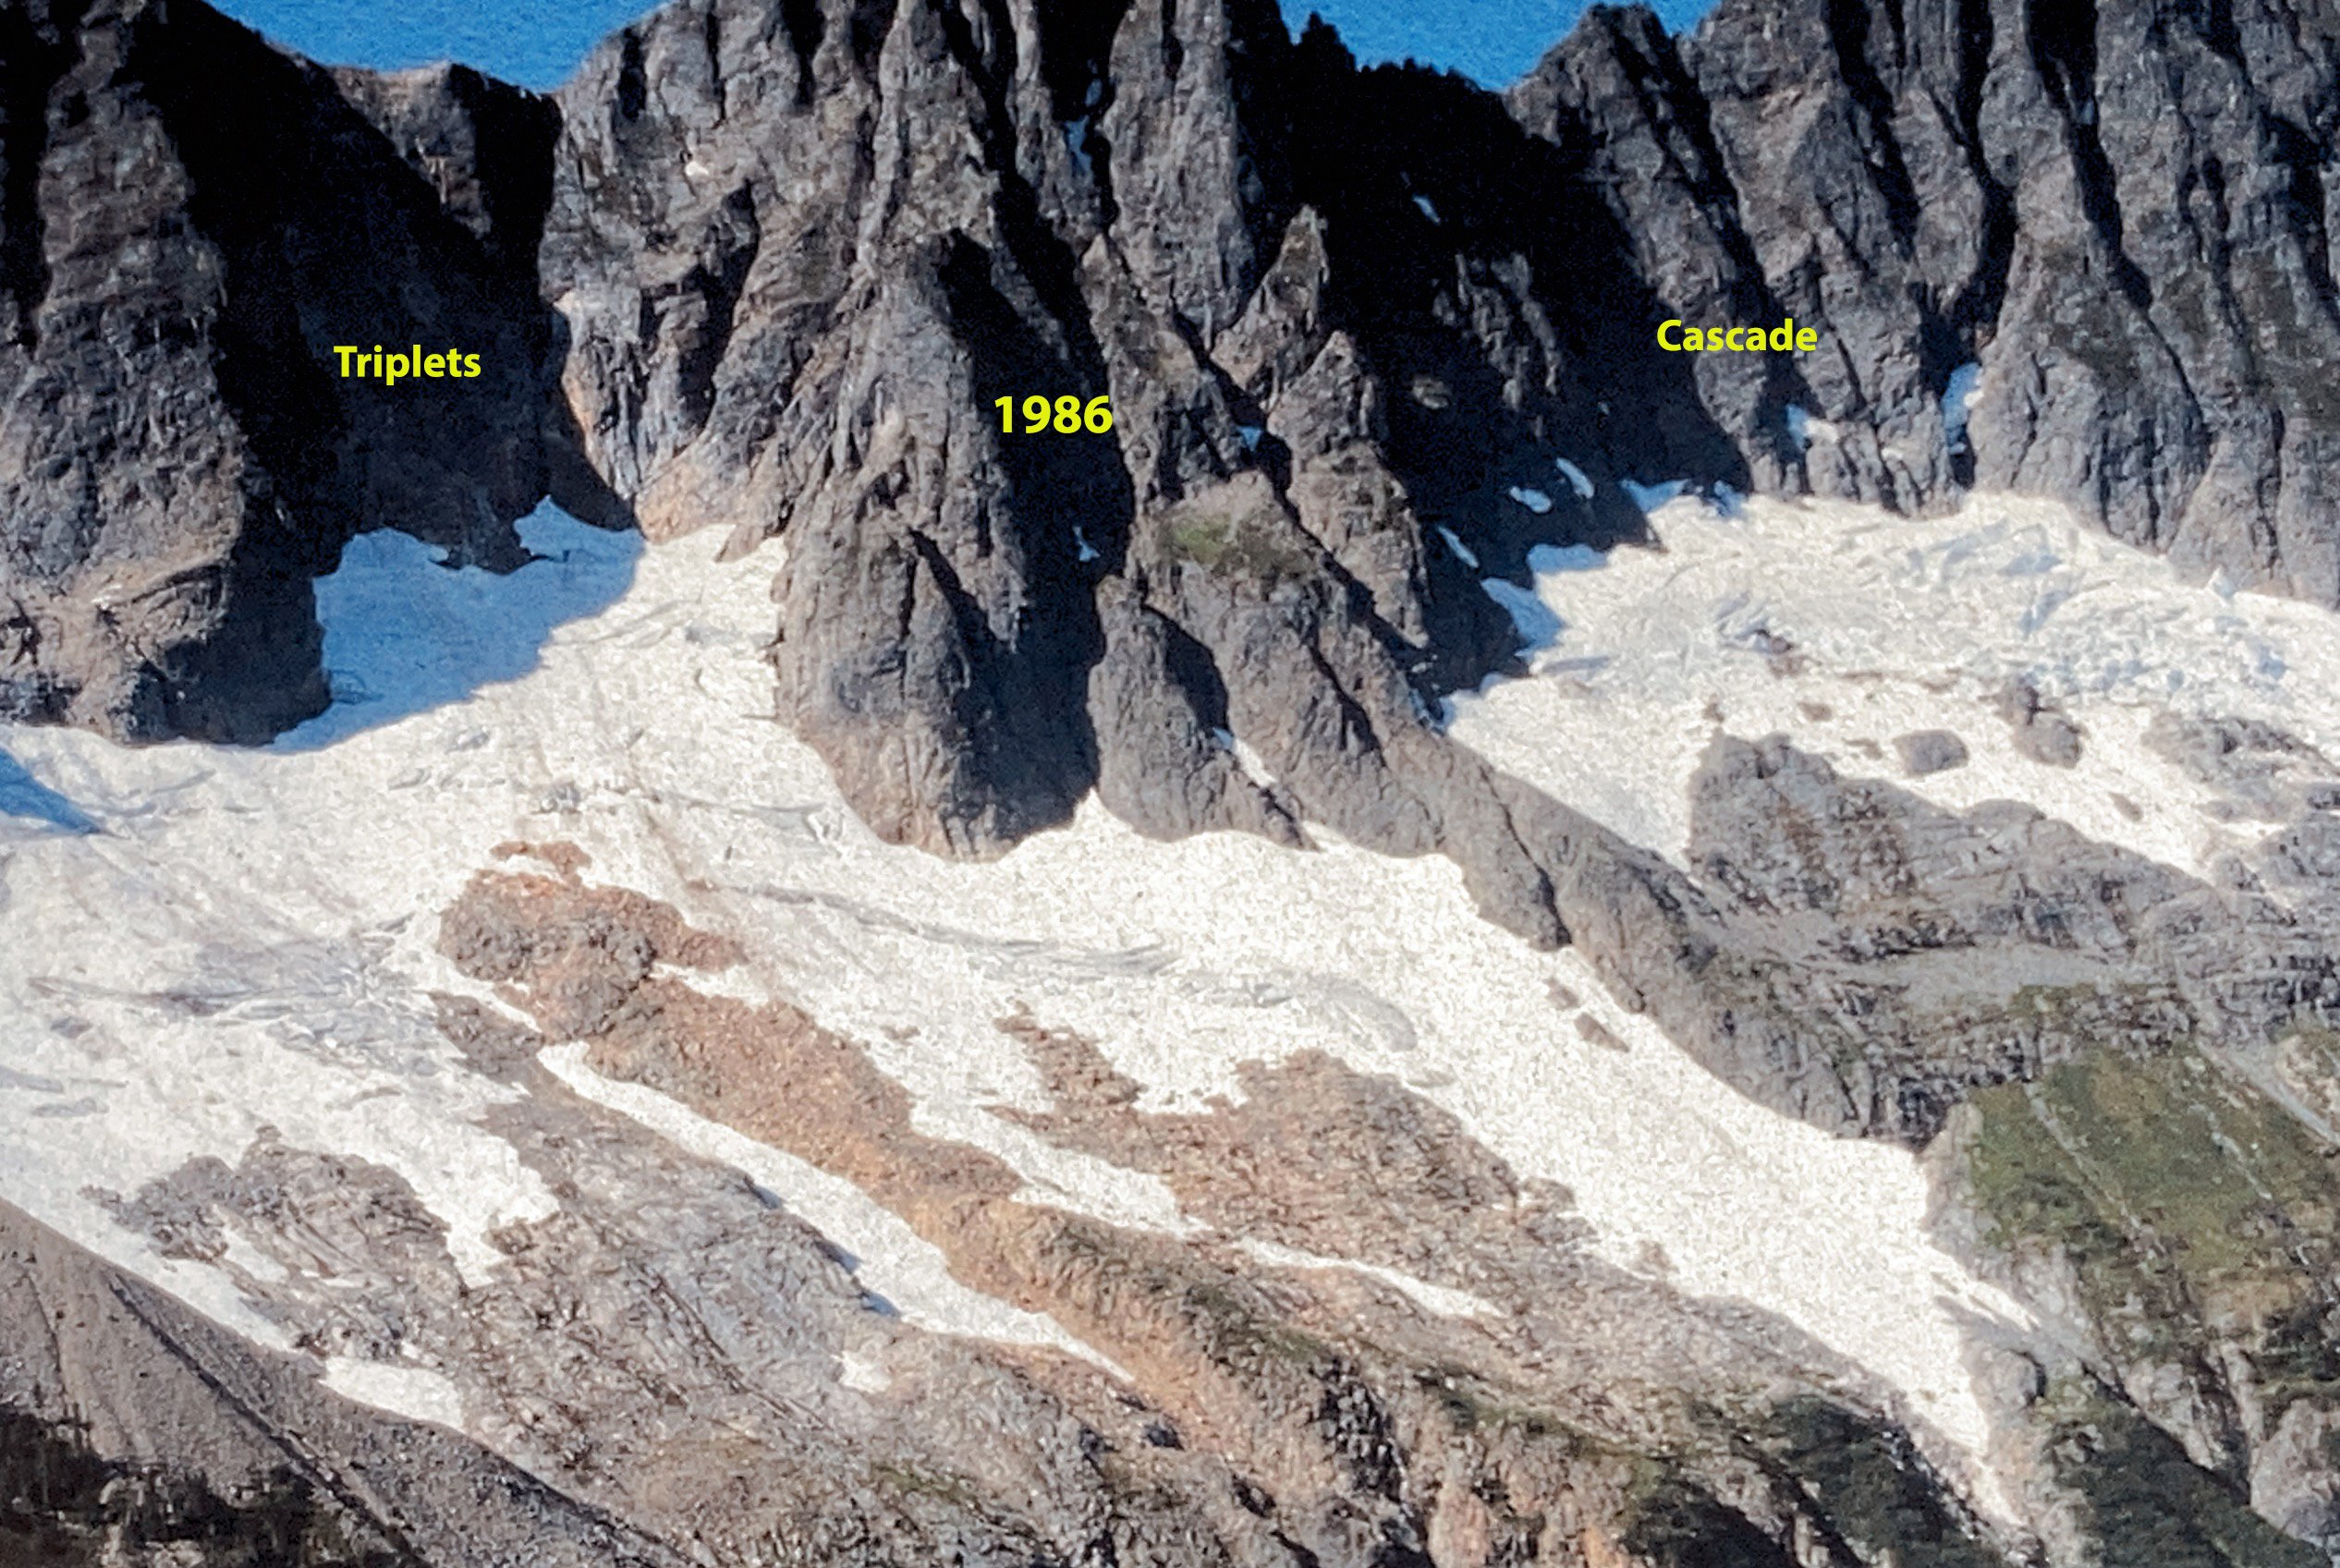
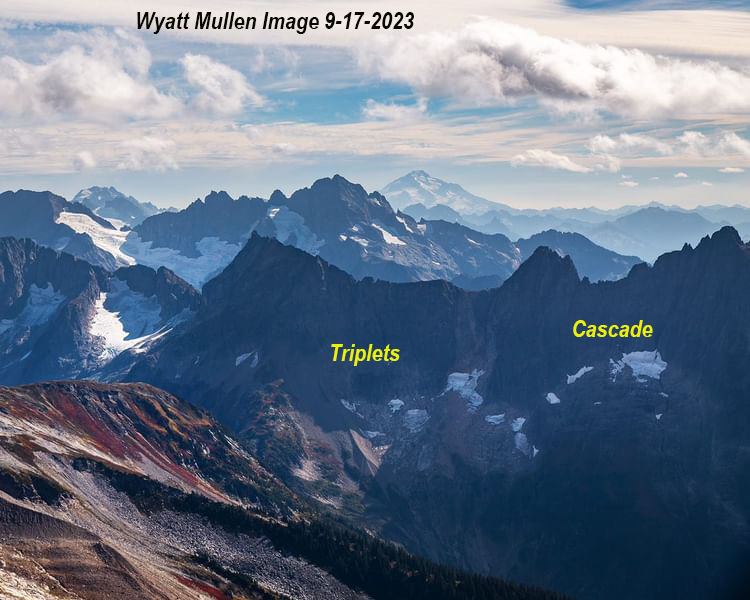
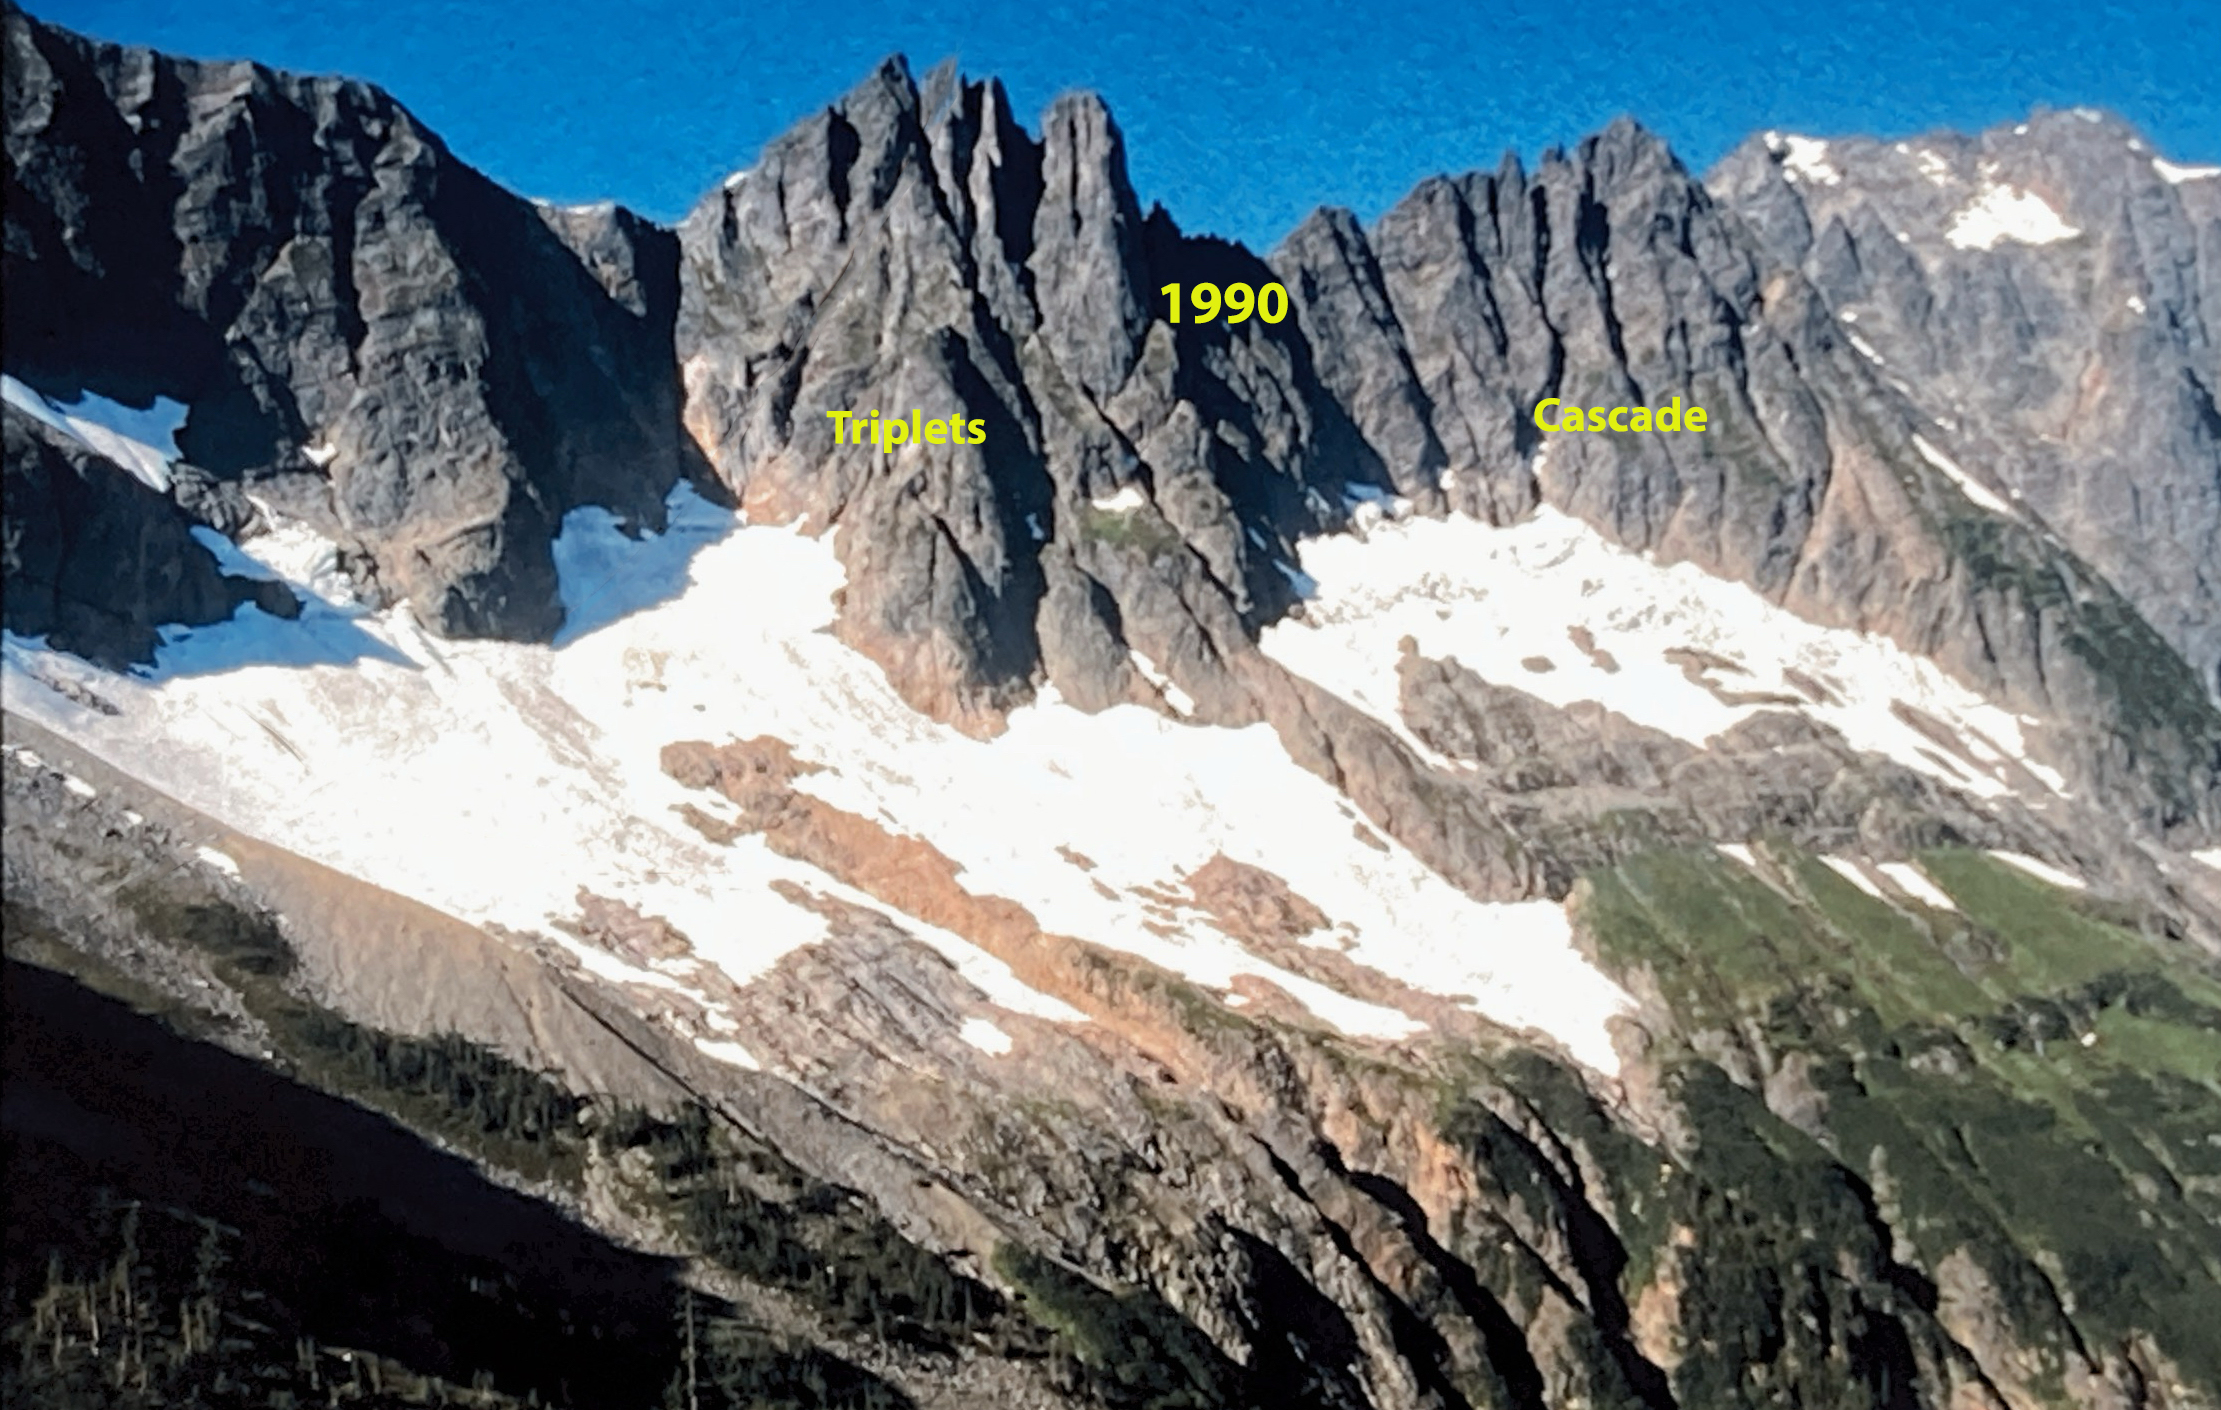
The Triplets and Cascade Peak glacier with significant retained snowcover in 1990 image I took from near Cascade Pass.

In 1986 I first walked on the two glaciers below The Triplets and Cascade Peak. They were crevassed glaciers fed on north facing benches below the peaks providing good radiational shading and fed by avalanches. The glaciers are also steep enough to shed avalanches. In 1992 these two glaciers did not retain significant snowpack and we noticed some crevasses within 50 m of the ice front reaching bedrock. Of more import was that several sections of glacier with bedrock reaching crevasses had slid detaching from the glacier on the steep smooth bedrock glacier bed.This process of melt driven thinning leading to detachment of small glacier sections is what prompted me to think these glaciers would not last. This type of detachment is evident in the 1998 Google Earth image, lower right of Cascade Peak Glacier.

triplets 1992

The Triplets and Cascade Peak glacier with limited snowcover on Triplets glacier even in early August 1992. We were on route to the glacier when I took this picture.

crevasse to bedrock

Crevasse on Triplet Glacier that reaches bedrock near terminus in 1996.

Screenshot

The Triplets and Cascade Peak glacier with active crevassing in 1998 Google Earth image (yellow arrows). Some of these crevasses reached bedrock and led to detachments, note lower right on Cascade Peak glacier.

cascade pass triplets 2003

The Triplets and Cascade Peak glacier with active crevassing in 2003 with developing separation between east and west sections at yellow arrows.

The Triplets and Cascade Peak glacier with active crevassing only on Cascade Peak glacier in 2016 Google Earth image (yellow arrow).

triplets-2023-Wyatt-Mullen

In Sept 2023 The Triplets is now six fragments Cascade Peak glacier is three fragments. Image from Wyatt Mullen, who shares spectacular images on Instagram daily.

From 2003-2005 each summer these two glaciers failed to retain much snowpack and continued to thin and lose area. The Global Land Ice Measurements from Space (GLIMS) assessed the The Triplets and Cascade Peak glaciers with an areas of  respectively 55,000 m² and 60,000 m², respectively this area was updated with a 2015 area assessment of 70,000 m² and 32,000 m² respectively. In 2019, 2021, 2022 and 2023 glaciers in the North Cascades experienced a sequence of years that left most glaciers in the range largely snow free for the last 4-6 weeks of the melt season leading to exceptional mass loss and consequently area loss. The area of the largest contiguous area of ice of the two glaciers declined from 51,000 m² and 31,000 m² in 2019, to 37,000 m² and 26,000 m² in 2021 and 18,000 m² and 15,000 m² in 2023. By 2023 neither glacier exhibited active crevassing as both approached the lower threshold for glacier existence. Thirty years after my initial assessment both The Triplets and Cascade Peak glaciers no longer exist. This is shown in the GLIMS glacier viewer which illustrates extinct glaciers as black dots. These two are in the list of 34 extinct glaciers in the North Cascades that I have measured since 1984 that are now gone, and are in this GLIMS extinct glacier layer. The sustained mass balance loss of North Cascade glaciers is what is leading to significant volume declines of all glaciers and loss of glaciers that were thin (Pelto, 2018).

Screenshot

The Triplets and Cascade Peak glacier in August 2019 Sentinel false color image. Area of  The Triplets  glacier =51,000 m²: Cascade Peak glacier=31,000 m² 

Screenshot

The Triplets and Cascade Peak glacier in August 2021 Sentinel false color image. Area of The Triplets glacier =37,000 m²: Cascade Peak glacier=26,000 m² 

Screenshot

The Triplets and Cascade Peak glacier in August 2023 Sentinel false color image. Area of The Triplets glacier =18,000 m²: Cascade Peak glacier=15,000 m² 

Kanchenjunga Glacier, Nepal High Snowlines Expanding Supraglacial Ponds in 2023

Screenshot

Kanchenjunga Glacier in Nov. 8, 2023 false color Sentinel image.  The flowlines of the six tributaries shown in green with the snowline on each at the purple dots. Percentage of glacier length above the snowline for each tributary shown as percentage. Two rapidly expanding supraglacial lakes shown at yellow arrows.

Kanchenjunga Glacier is the main glacier draining west from Kanchenjunga Peak draining into the Ghunsa River. Lamsal et al (2017). report a loss of -0.18 m/year from 1975-2010. They noted an increase in supraglacial ponds and that the glacier had decreased in thickness mainly between the terminus and 5500 m, with some thickness increases above 5850 m. The Kanchenjunga Region has produced 6 to 8 GLOF’s since the late 1960’s, but none from the Kanchenjunga Glacier which had lacked substantial proglacial or supraglacial lakes until now (Byers et al 2020). Here we examine Sentinel imagery indicating the high snowline in November 2020, January 2021 and November 2023.

Screenshot

Kanchenjunga Glacier in Jan,. 17, 2021 false color Sentinel image.  The snowline on each at the purple dots. Percentage of glacier length above the snowline for each tributary shown as percentage. Two rapidly expanding supraglacial lakes shown at yellow arrows.

A glacier needs a majority of its area to be in the accumulation zone to maintain its mass balance. In November 2020 the transient snow line averages 5800 m. By January 17, 2021 the snowline has risen to an average of 5950 m. Measuring the distance from the terminus to top of the glacier along the six main tributaries, and determining the percentage of this length above the snowline in the accumulation area, from 8-14% of the length is the accumulation area. This leaves a limited accumulation area. The January 2021 period had an unusually high snowline due to heat wave in January, that led to high snowlines on Mount Everest as well (Pelto et al 2021). In November 2023 the snowline averages 5900 m across the six tributaries, ranging from 10-17% of the length of the tributaries being above the snowline, mcuh too little to maintain equilibrium. The yellow arrows indicate one noteworthy change near the terminus the growth of new supraglacial ponds. The upper pond expanded from 20,000 m² in Nov. 2020 to 80,000 m² in Nov. 2023, the lower pond consisted of three discrete segments with an area of 50,000 m² in Nov. 2020 to 120,000 m² in Nov. 2023. These are the largest supraglacial lakes to appear on this glacier in the last several decades at least. These two ponds have a greater combined area than all ponds on the glacier in 2010 which Lamsal et al (2017) reported as 0.16 km². At that time the largest pond was 30,000 m².

Screenshot
Screenshot

Kanchenjunga Glacier terminus area supraglacial ponds in Nov. 8, 2023 false color Sentinel image.  Each has more than doubled in size in last three years, with areas of 80,000 and 120,000 m².

Screenshot
Screenshot

Kanchenjunga Glacier in Nov. 10, 2020 false color Sentinel image.  The snowline on each at the purple dots. Two rapidly expanding supraglacial lakes shown at yellow arrows.

Continental Glacier, Wyoming Fragmentation Accelerates

Continental glacier 1994-2023

Continental Glacier in 1994 Google Earth and 2016 and 2022 Sentinel images, illustrating the separation at the black arrows, into the northern middle and southern parts, with an impending separation at green arrow.

Continental Glacier is a long plateau glacier draped along the continental divide in the Wind River Range, Wyoming. It drains into Torrey Creek and then the Wind River. In 1994 this glacier extended 5 km from south to north with an area of 2.4 km². In 2012 Van Looy et al (2013) used GPR to determine ice thickness and project how long the glacier could last.  They found 59% of the glacier was less than 40 m thick, with two cirque depressions filled with deeper ice exceeding 150 m. They found a thinning rate of 0.3 m/year for the 1966-2012 period. They did not include the southern part of the glacier in their study.

In 2016 the glacier is in three parts and glacier area has been reduced to 1.9 km². By 2022 additional fragmentation at the green arrow in the middle segment is imminent. The northern and southern parts are wasting away rapidly. A closeup of the northern section of the glacier in 2022 illustrates how thin, fragmented, and stagnant the ice has become. Point A-E indicate bedrock areas emerging amidst northern part. Point F-I indicate very thin, old, dark ice in the middle part. This glacier is following a similar path to the Grasshopper Glacier just to the south.  Van Looy et al (2013) noted that in the next century the volume would be reduced by 43% and the glacier would be lost in 300-400 years. The pace of loss has increased significantly with volume loss of ~2% per year since 2013, which will lead to loss of all areas with less than 40 m of ice in 2012 being lost by 2040. The two areas of deep ice will persist much longer. This same trend has led to the loss of Heap Steep Glacier, Harrower Glacier and Twins Glacier in the Wind River Range since 2015.

Screenshot
Screenshot

Continental Glacier in 9-4-2022 false colar Sentinel image. Point A-E are bare rock areas amidst northern part of glacier. Point F-I dark, old thin ice in the middle part.

Storstrømmen Glacier, NE Greenland Retreat Releases New Islands

stormstrommen-2013-2023

Storstrømmen and L. Bistrup Brae in Landsat imagery from 8-23-2013 and 8-26-2023. Green dots on 2013 image is the 2023 margin. Yellow dots on 2023 image is the 2013 margin. Island A and Island B are at the glacier front in 2013 and are fully separated by 2023. R=Randsoen proglacial lake.

Storstrømmen and L. Bistrup Brae are large outlet glaciers in northeast Greenland that join at their terminus.  The calving front is long and has numerous island pinning points. They comprise a large relatively flat low lying terminus region, the southernmost floating ice tongue in East Greenland. Rignot et al (2022) radio echo soundings in August 2020 reveal a seabed at 350–400 m depth the ice shelf front, with shallower terrain (<100 m) over a 30-km wide region to the east that blocks the access of warm, salty, subsurface Atlantic Intermediate Water. This water would accelerate ice shelf bottom melting. They note a ~23 m thinning near the grounding line on Storstrømmen from 1999-2014. They also report a 1.1 km retreat of the grounding line from 2017-2021. Storstrømmen is a surging glacier fed by the NEGIS, that surged 3 times during the 20th century and is in a quiescent phase. The last surge was in 1978-1982. Mouginot et al (2018) indicate the differential between inland thickening and terminus thinning will yield pre-surge conditions by 2027-2030, this transition in elevation change occurs ~50 km inland of terminus. Grinsted et al (2022) point out that the NEGIS has accelerated and expanded laterally, above a point ~200 km inland, between 1985 and 2018, Storstrømmen terminus area is still slowing. Will these inland changes in the NEGIS impact the next surge cycle?

The thinning of the floating ice is leading to retreat and the release of new islands from the glacier. Here we examine Landsat images from 2013 and 2023 to illustrate. Island A is  at the front of Storstrømmen in 2023 is 2.1 km from the ice edge. Island B is at the front of L. Bistrup Brae in 2013 and by 2023 is 0.9 km from the ice edge. The other notable change is the expansion of the Randsøen proglacial lake (Point R). The glacier width between Randsøen and the ice front has narrowed from 10 km to 7 km from 2013-2023, with 2.3 km retreat of the main terminus in the embayment. This embayment with a narrow connection between the two glaciers developed in the early 1970’s, but the two glaciers did remain connected (Mouginot et al 2018).  There is substantial rifting in this section suggesting the next few years will see significant additional rifting. The supraglacial stream that drains Randsøen, flows along the boundary between Storstrømmen and Bistrup. The flow of this stream parts the sea ice in the Aug. 30, 2023 Sentinel image below. Will the glaciers separate in the next decade and how would that impact the next surge cycle? This post is an update to the 2013 post indicating that Storstrømmen is susceptible to rapid retreat

Screenshot

Storstrømmen and L. Bistrup Brae in Sentinel image from 8-30-2023. Island A and Island B  that were at the glacier front in 2013 are fully separated by 2023. R=Randsoen proglacial lake with the yellow arrows indicating surpaglacial stream draining this lake across the glacier and then making a channel through the sea ice and icebergs. Pink arrows indicate rifts that indicate areas prone to calving in next few years.

Satopanth and Bhagirath Kharak Glacier, India Shrinking Accumulation Zone

Screenshot
Screenshot

Satopanth and Bhagirath Kharak Glacier snowline (blue dots) on Oct. 8, 2020 (Sentinel image) mean elevation is 5350 m. T=Terminus location and blue line is flowline with distance from terminus in km.

Satopanth and Bhagirath Kharak Glacier are located at the headwaters of the Alaknanda River, Uttarakhand, India and have until recently shared a terminus. Glacier runoff is an important contribution to the 400 MW Vishnuprayag and 330 MW Alaknanda Hydroproject. Recent glacier behavior summarized by Thapliyal et al (2023)indicates retreat rates For Satopanth of 23.5 m/year and for Bhagirath Kharak of 18.5 m/year from 1968-2017. They also report a reduction of snowcover during a period of warming from 2000-2020. They considered the accumulation zone to be from 4500 m to 5600 m. Here we examine Sentinel images from Oct. 8, 2020 and Oct. 8 2023 indicating the snowline at 5350 m and 5250 m respectively. On Satopanth Glacier the glacier is 14 km long with ~87% of that length in the ablation zone both years. On Bhagirath Kharak Glacier the glacier is 16.5 km long with ~90% of its length in the ablation zone both years. A glacier needs more than 50% of its area to be in the accumulation zone, which means a snowline in the 4600 m range. The higher snowlines in recent years will drive an increased glacier loss. Below 4600 m debris cover dominates. Shah et al (2019) estimated mean sub-debris ablation ranges between 1.5±0.2 to 1.7±0.3 cm/day leading to thinning of this zone of the glacier.

Screenshot
Screenshot

Satopanth and Bhagirath Kharak Glacier snowline (blue dots) on Oct. 8, 2023 (Sentinel image- mean elevation is 5250 m. T=Terminus location. 90% of the length of each glacier is in the ablation zone.

Screenshot
Screenshot

Vishnuprayag Hydropower Plant a 400 MW run of river project 18 km downstream of Satopanth Glacier.

Coronation Glacier New Island Development-Baffin Island

coronation-glacier-island-development-scaled

This is a portion of the island emerging from beneath the terminus with the 20-50 m high ice front in July 2023, the main portion of the island extends to the left and then out from the glacier. (Bischke/Biner/Bessen/Klemmensen)

Coronation Glacier is the largest outlet glacier of the Penny Ice Cap on Baffin Island. The glacier has an area of ~660 square kilometers and extends 35 km from the edge of the ice cap terminating in Coronation Fjord. Retreat from 1989 to 2023 has been 1050 m on the northern side of the fjord and 900 m on the south side of the fjord. The average retreat of 975 m in 33 years is ~30 m/year, much faster than the 1880-1988 period. Locations 1-9 are tributaries that have each narrowed or retreated from the main stem of the glacier. I reported on a new island forming at the terminus in 2016, and I have been hoping to identify someone who would visit the island. The island now has an area of 0.25 km², its character is evident in images below. Amanda Bischke reached out on behalf of a four person climbing team heading into the area this summer. In mid-July the team had reached the front of the glaciers and over the next 20 days explored the glacier and its tributary. Here I analyse images taken by the team of Amanda Bischke, Shira Biner, Noah Bessen and James Klemmensen in conjunction with Sentinel images. One striking aspect of the Sentinel image from August 16, 2023 is how the snowline is on the ice cap feeding tributary 1-3 at 1500 m. This has become a common theme, and is resulting in less flow from the ice cap down these tributaries leading to detachment. Tributary 1, 3 and 6 have separated from the main glacier, while Tributary 2,4,7 and 9 have detachments nearly or completely severing the glacier enroute to the main glacier.

I appreciate the collaboration with the climbing party who have posted an initial report, I will update when further reports are published. Of their four first ascents, The Drawbridge was a visually compelling line to me. If you are heading out into a seldom visited glaciated area on a climbing expedtion reach out and see what would be valuable to observe. We can see overall changes from satellite imagery, but not the details. Two examples here are what the surface of the island is composed of, sand and small rocks in this case, or a developing detachment such as at the chasm are not evident from satellite imagery.

coronation glacier 2017-2023

As the glacier retreats the Island continues to expand from 2017-2023. The tributaries I hoped the climbing team  could document where possible if they were still attached.

coronation-terminus-from-island-scaled
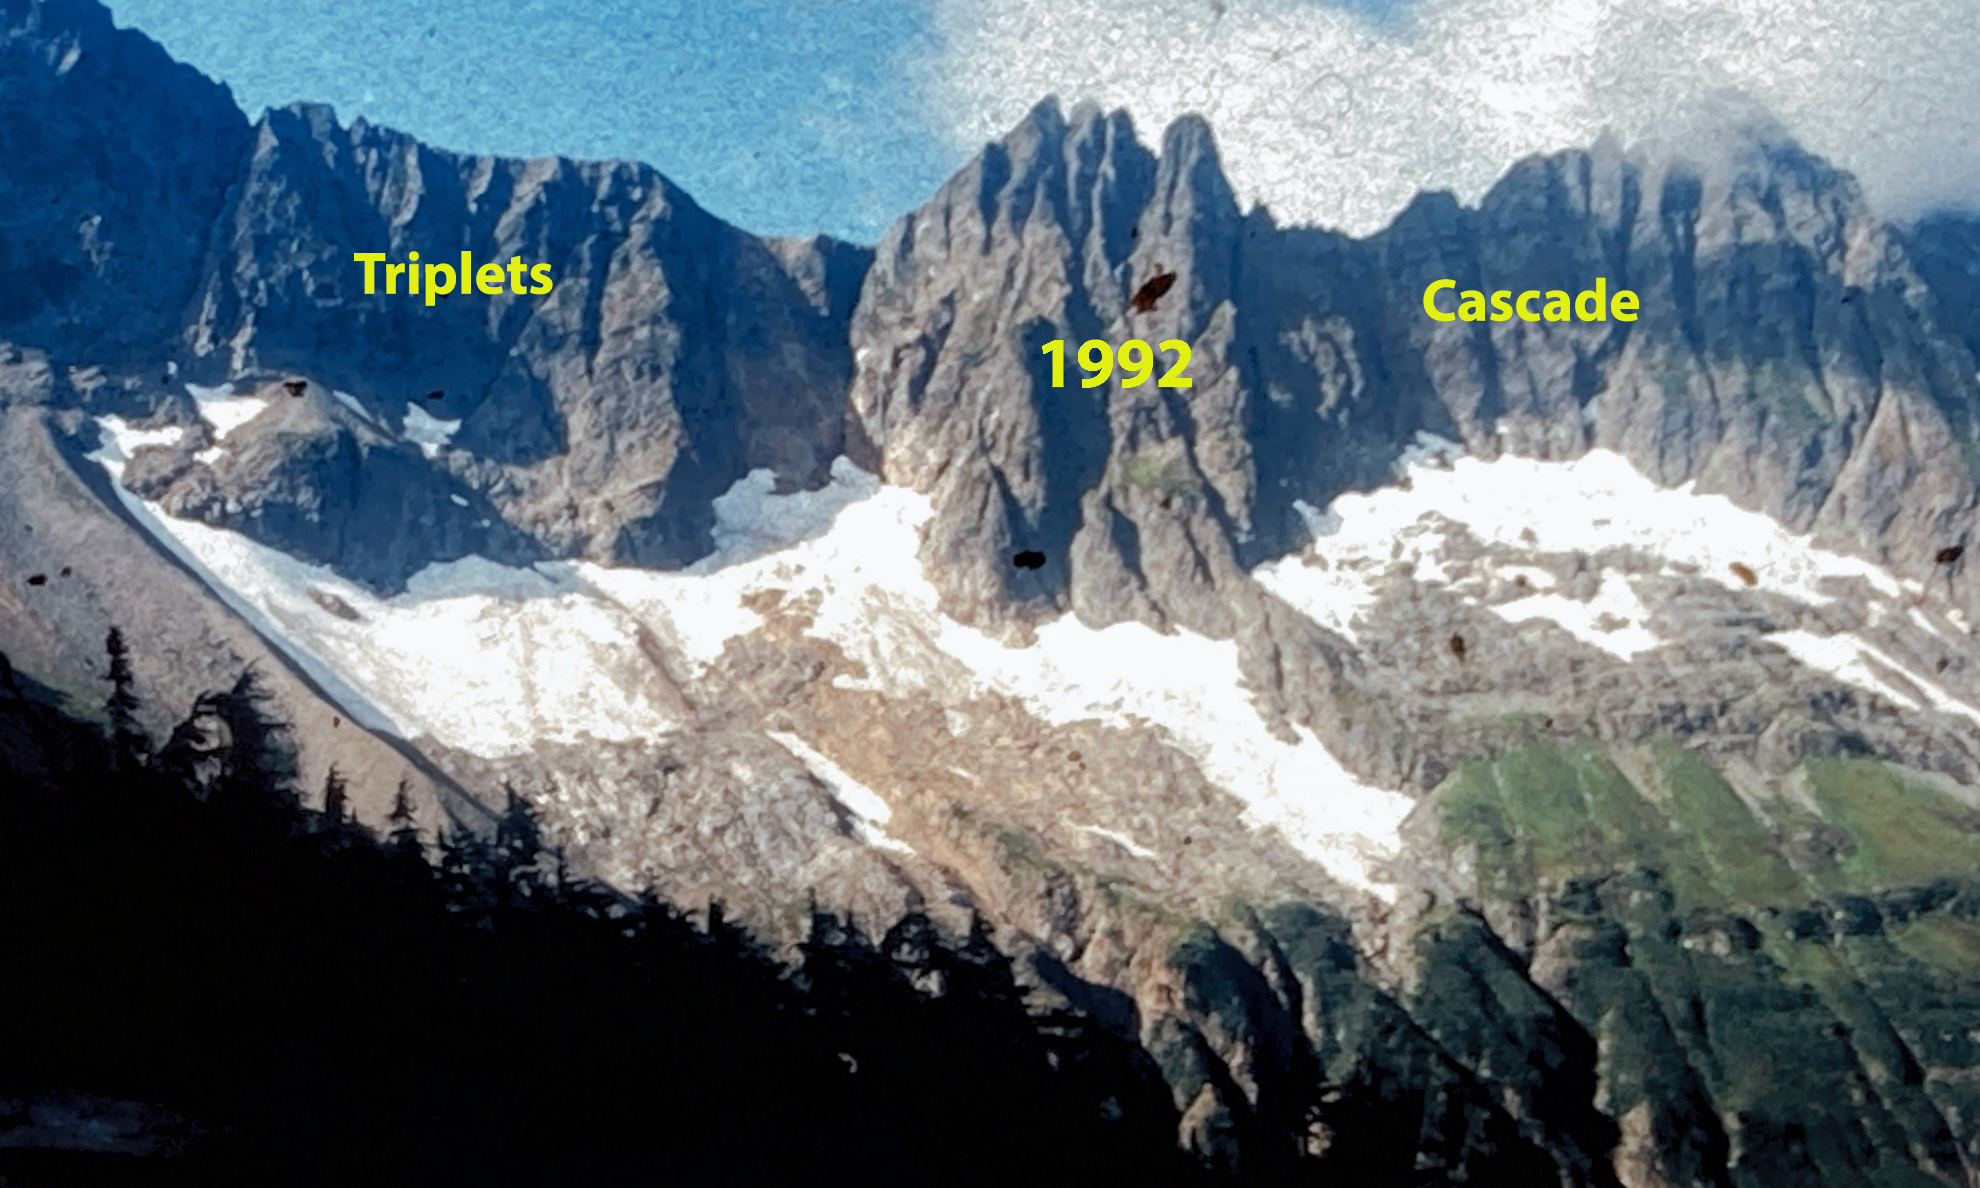
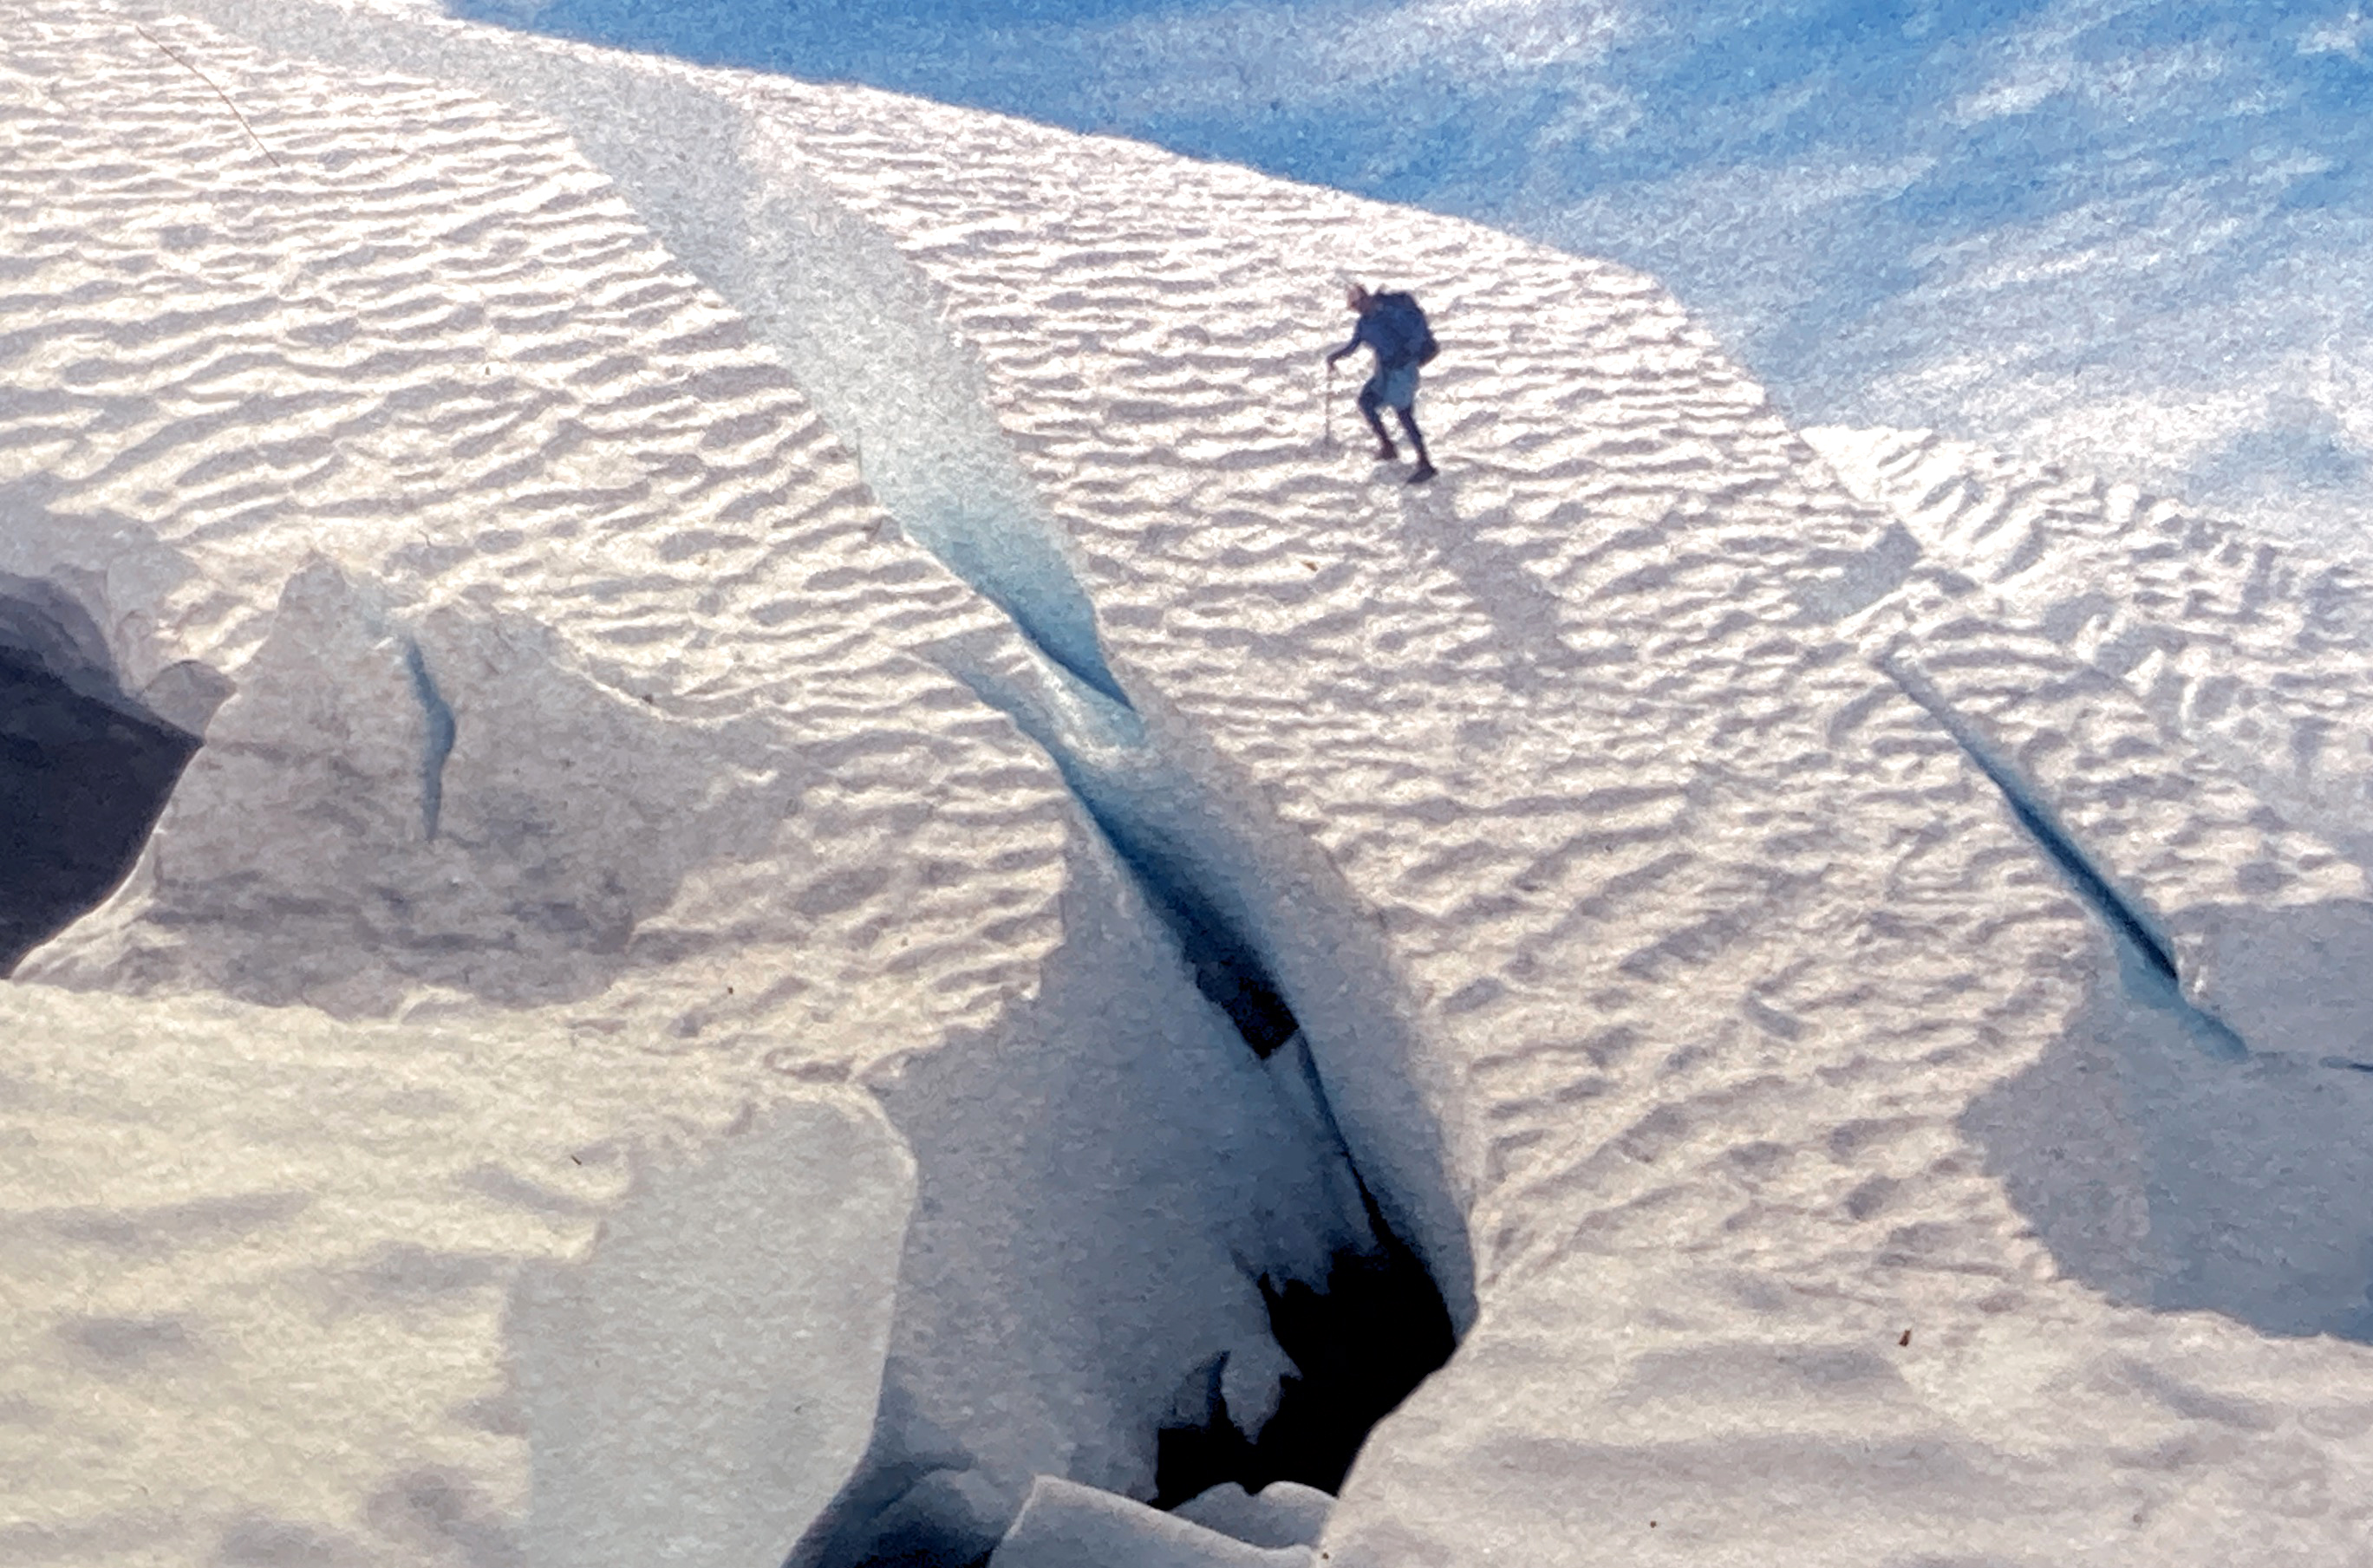
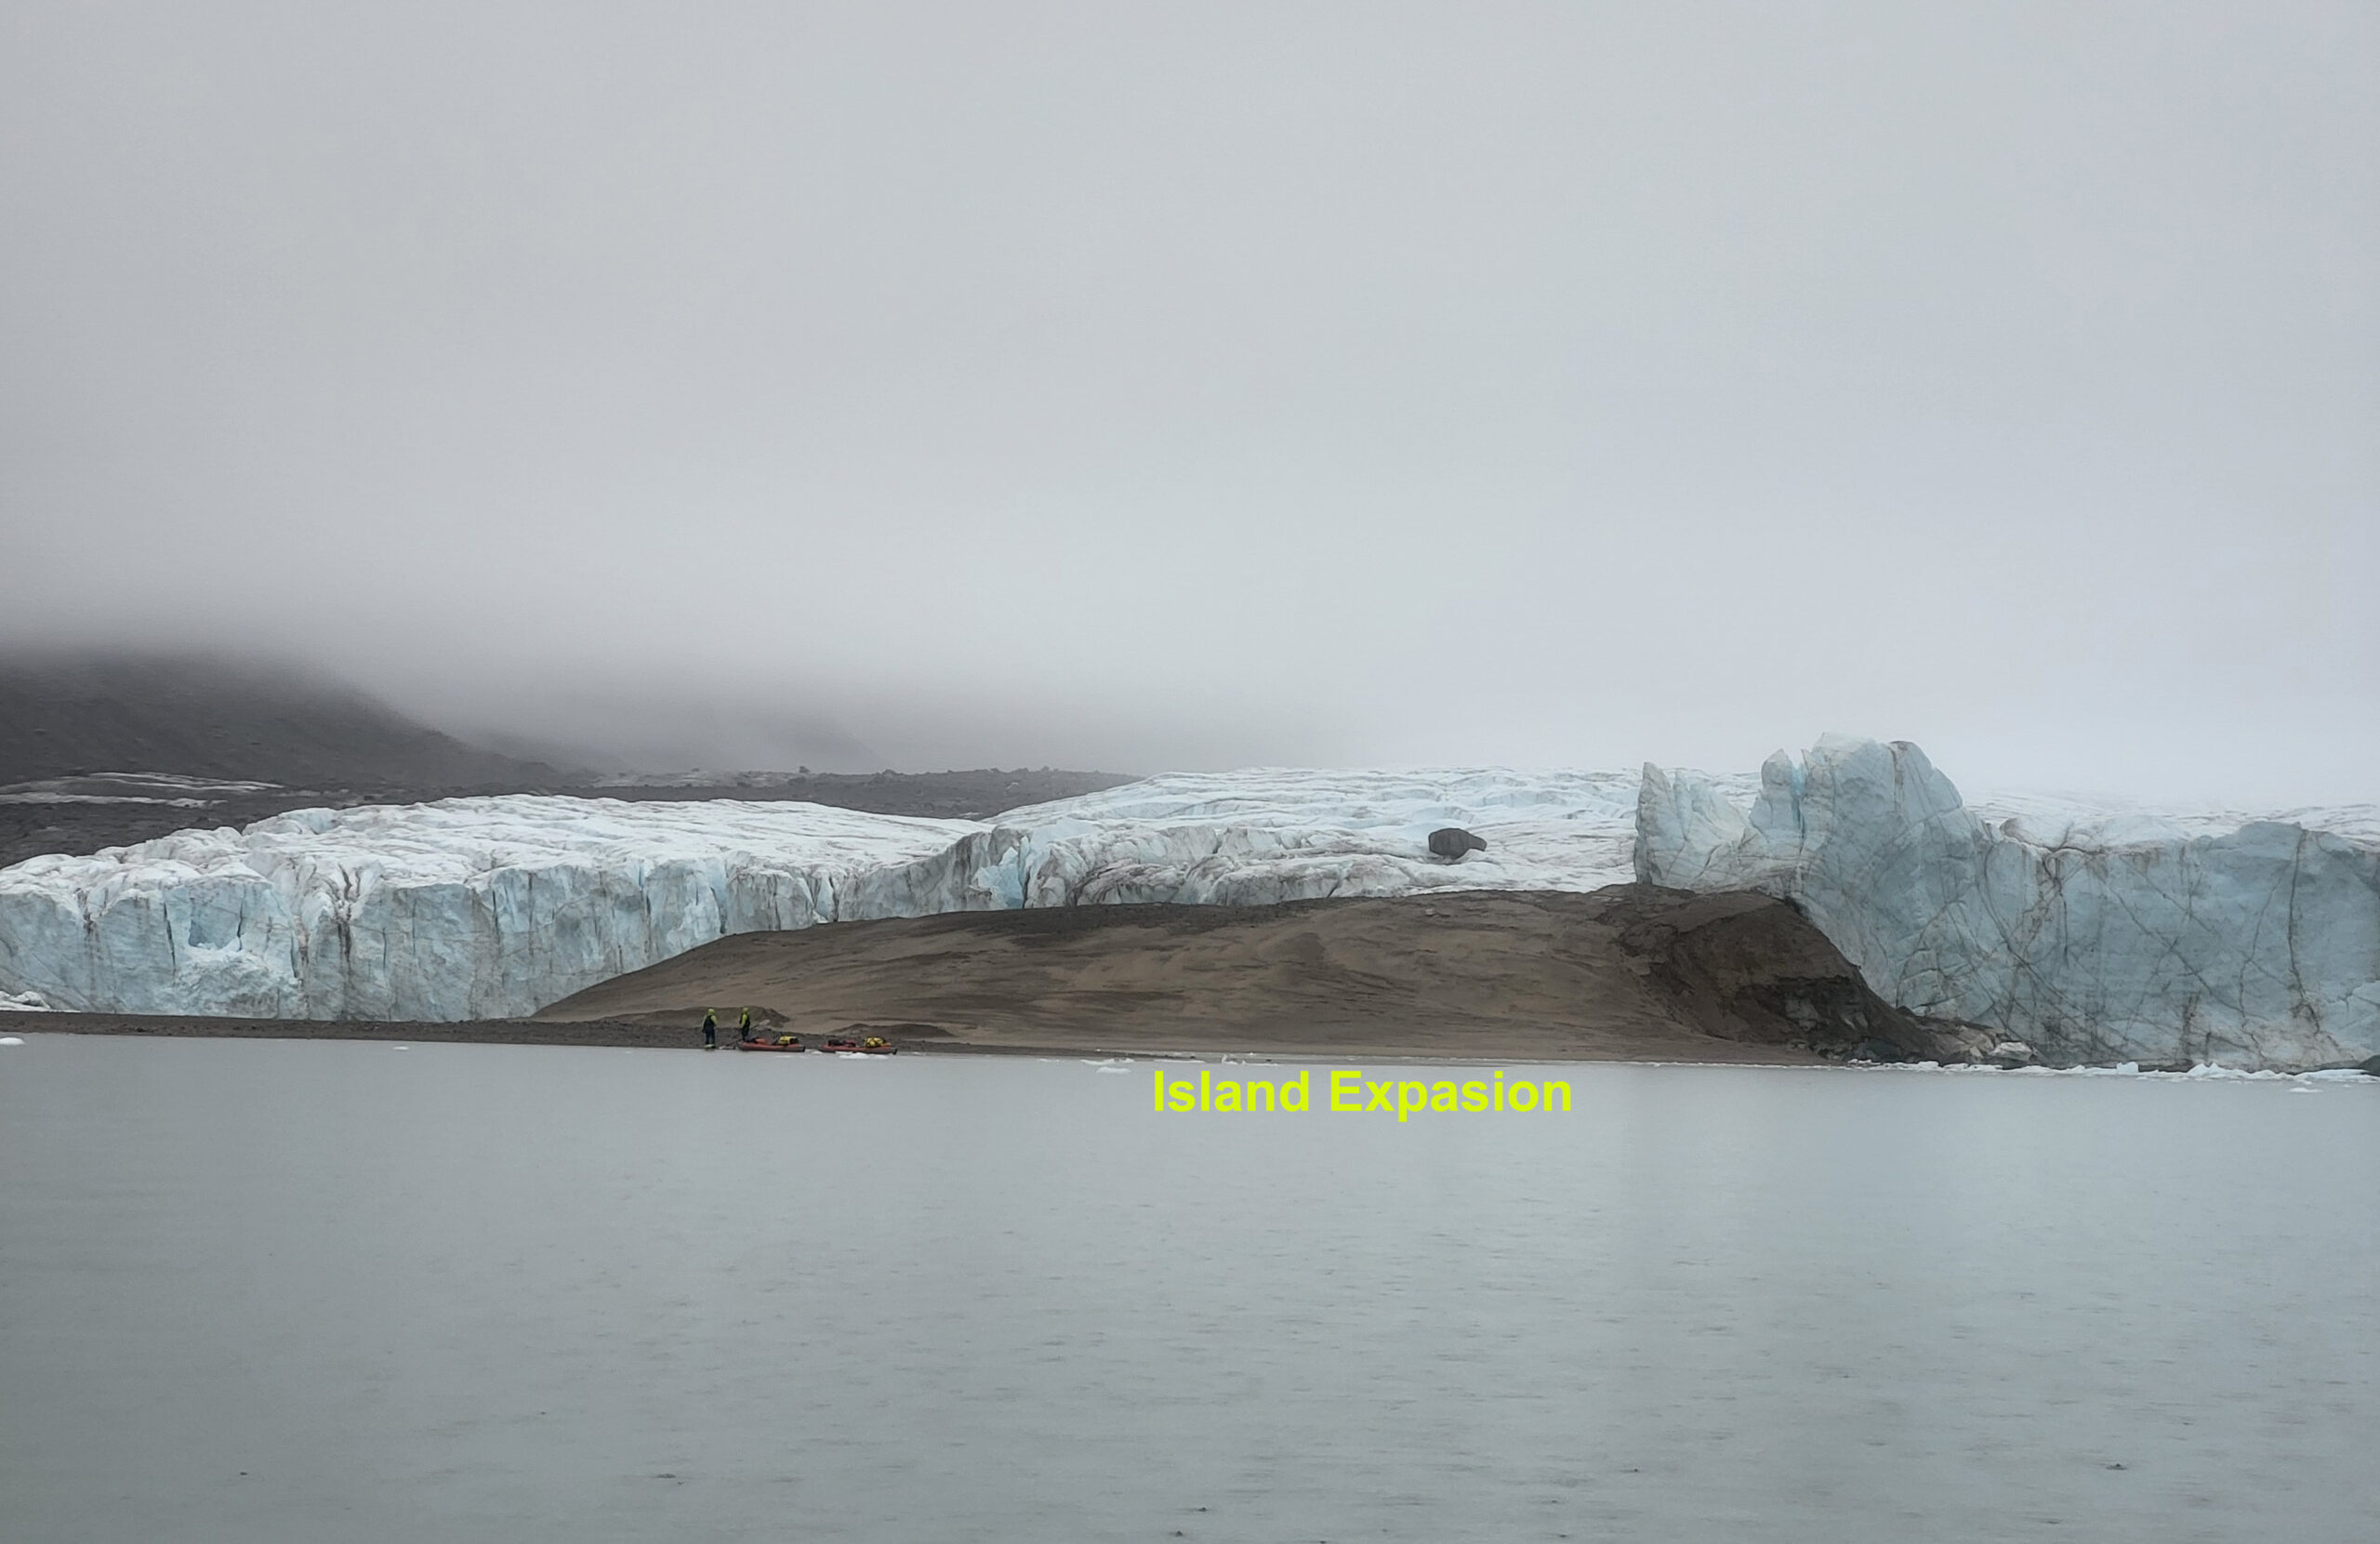
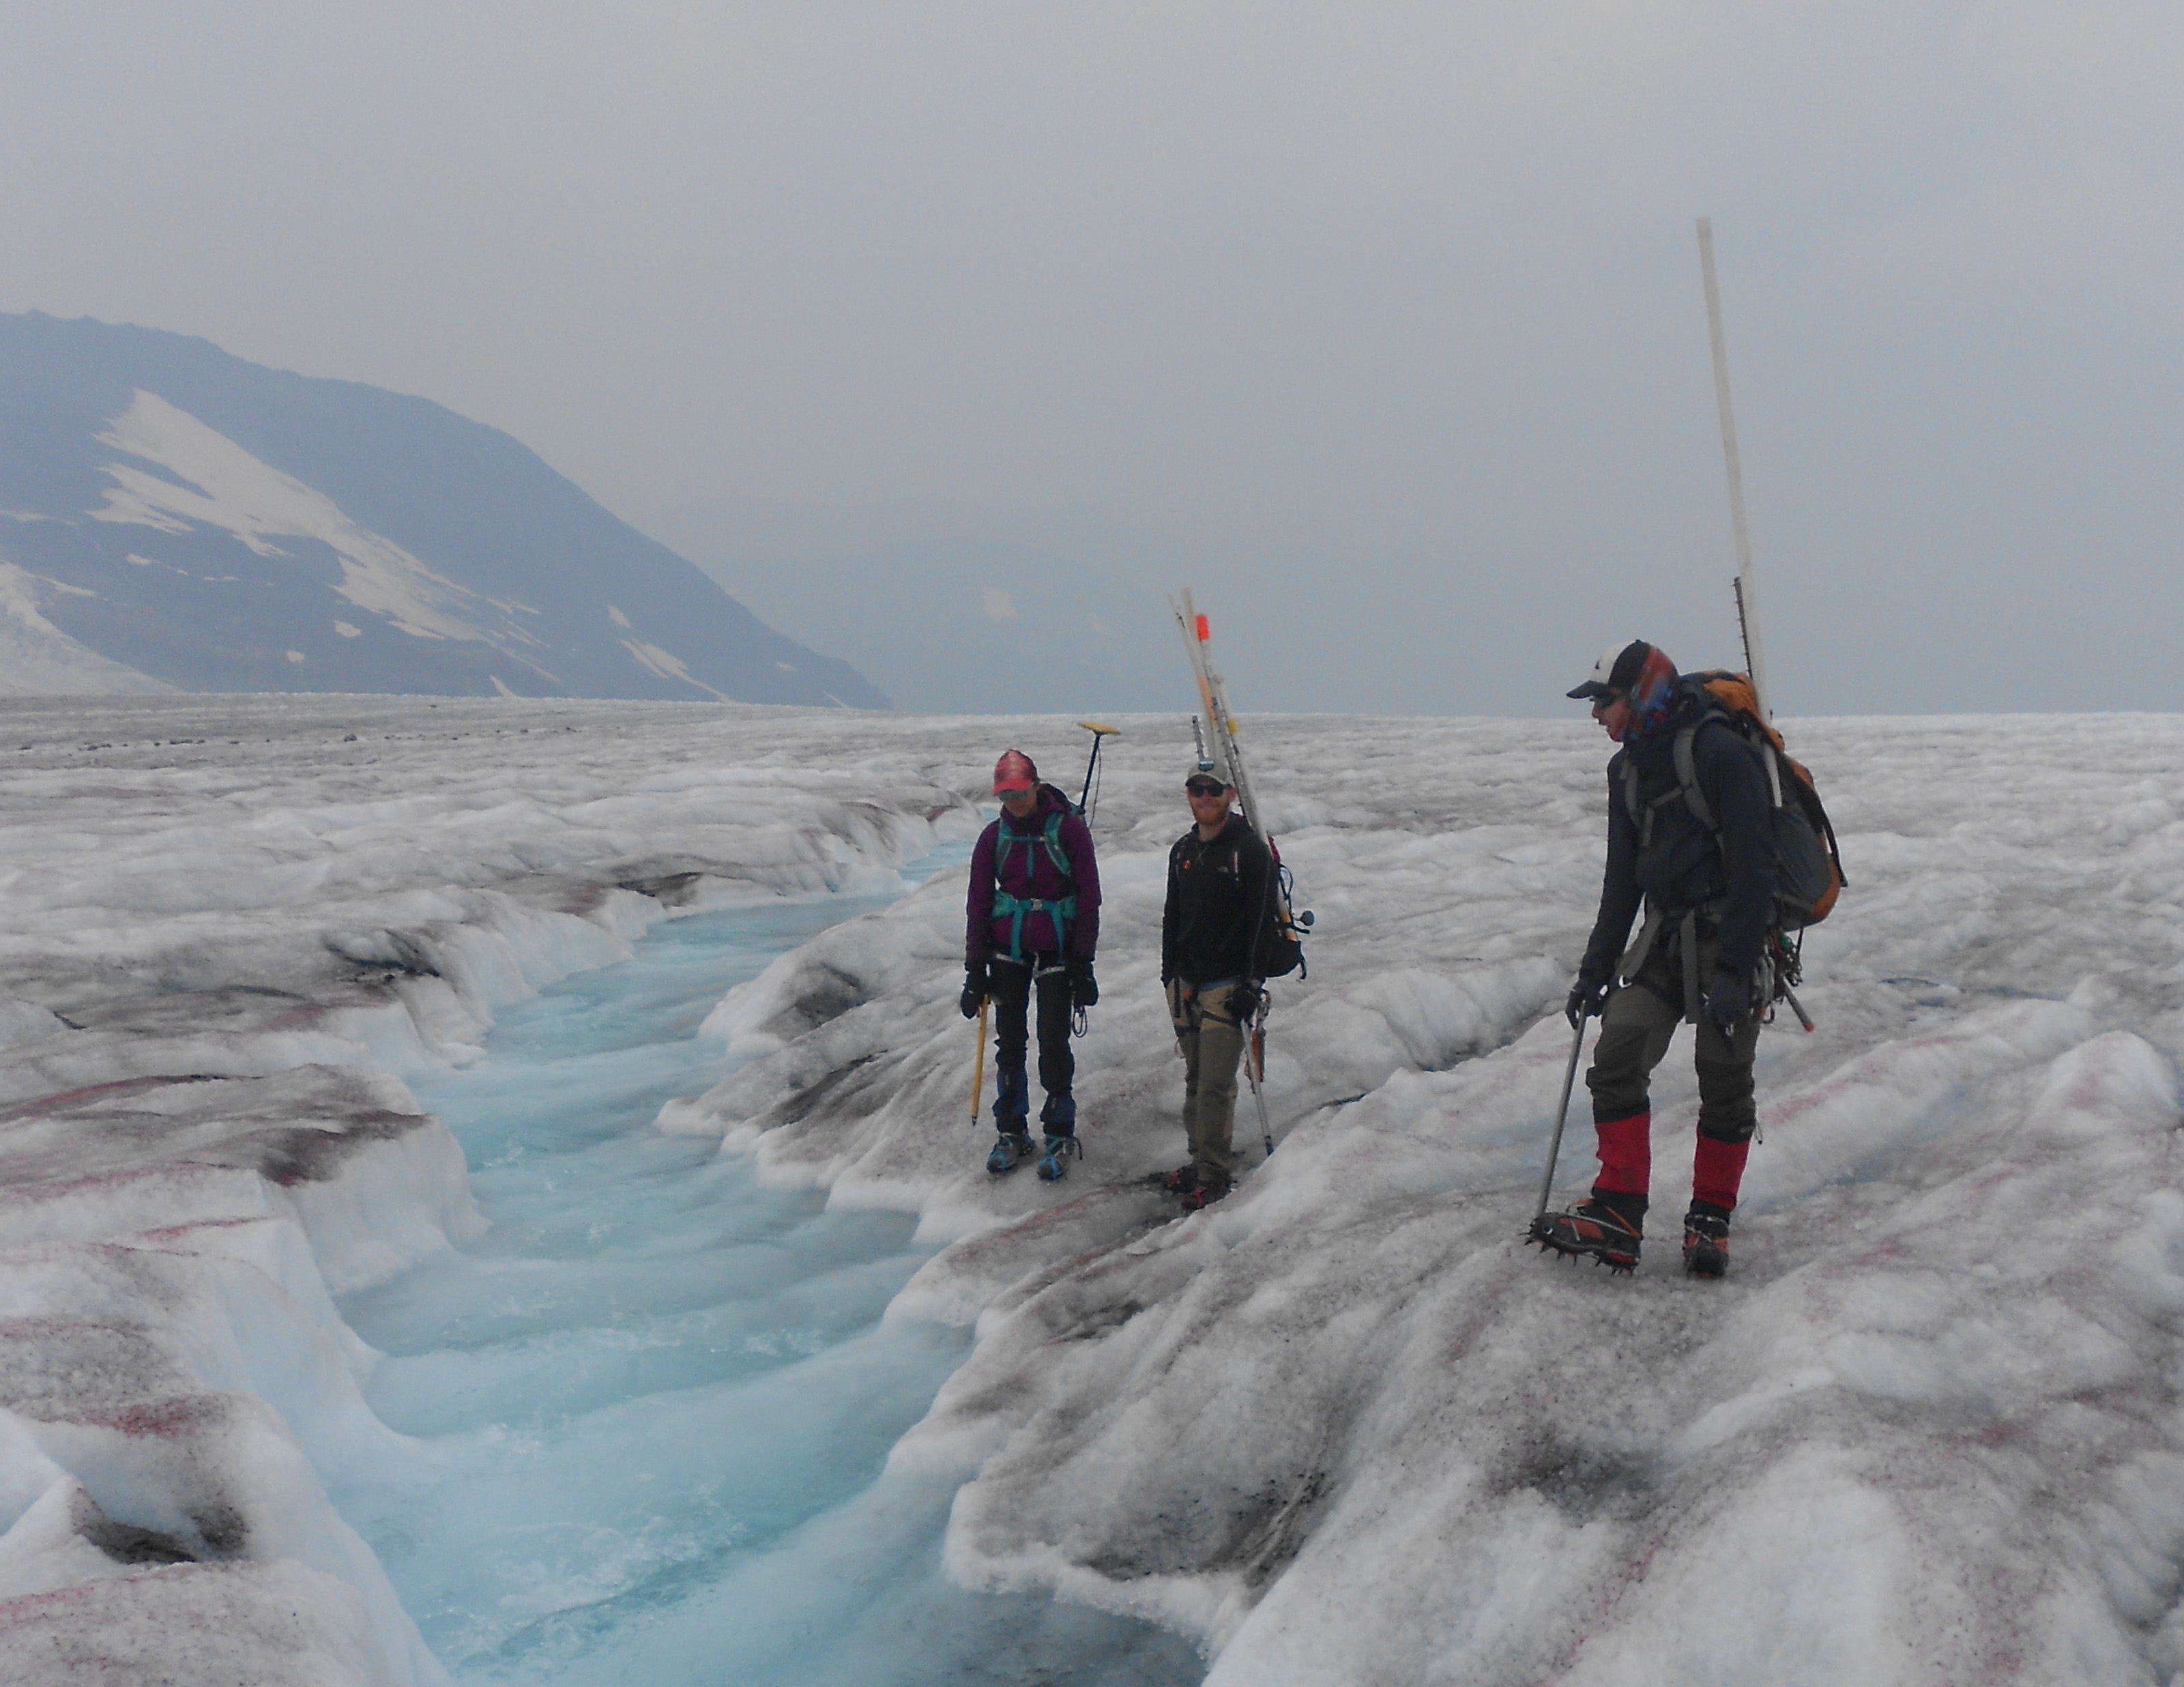
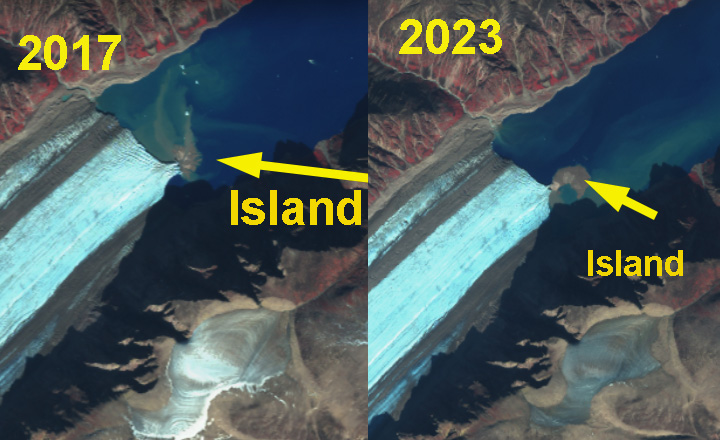
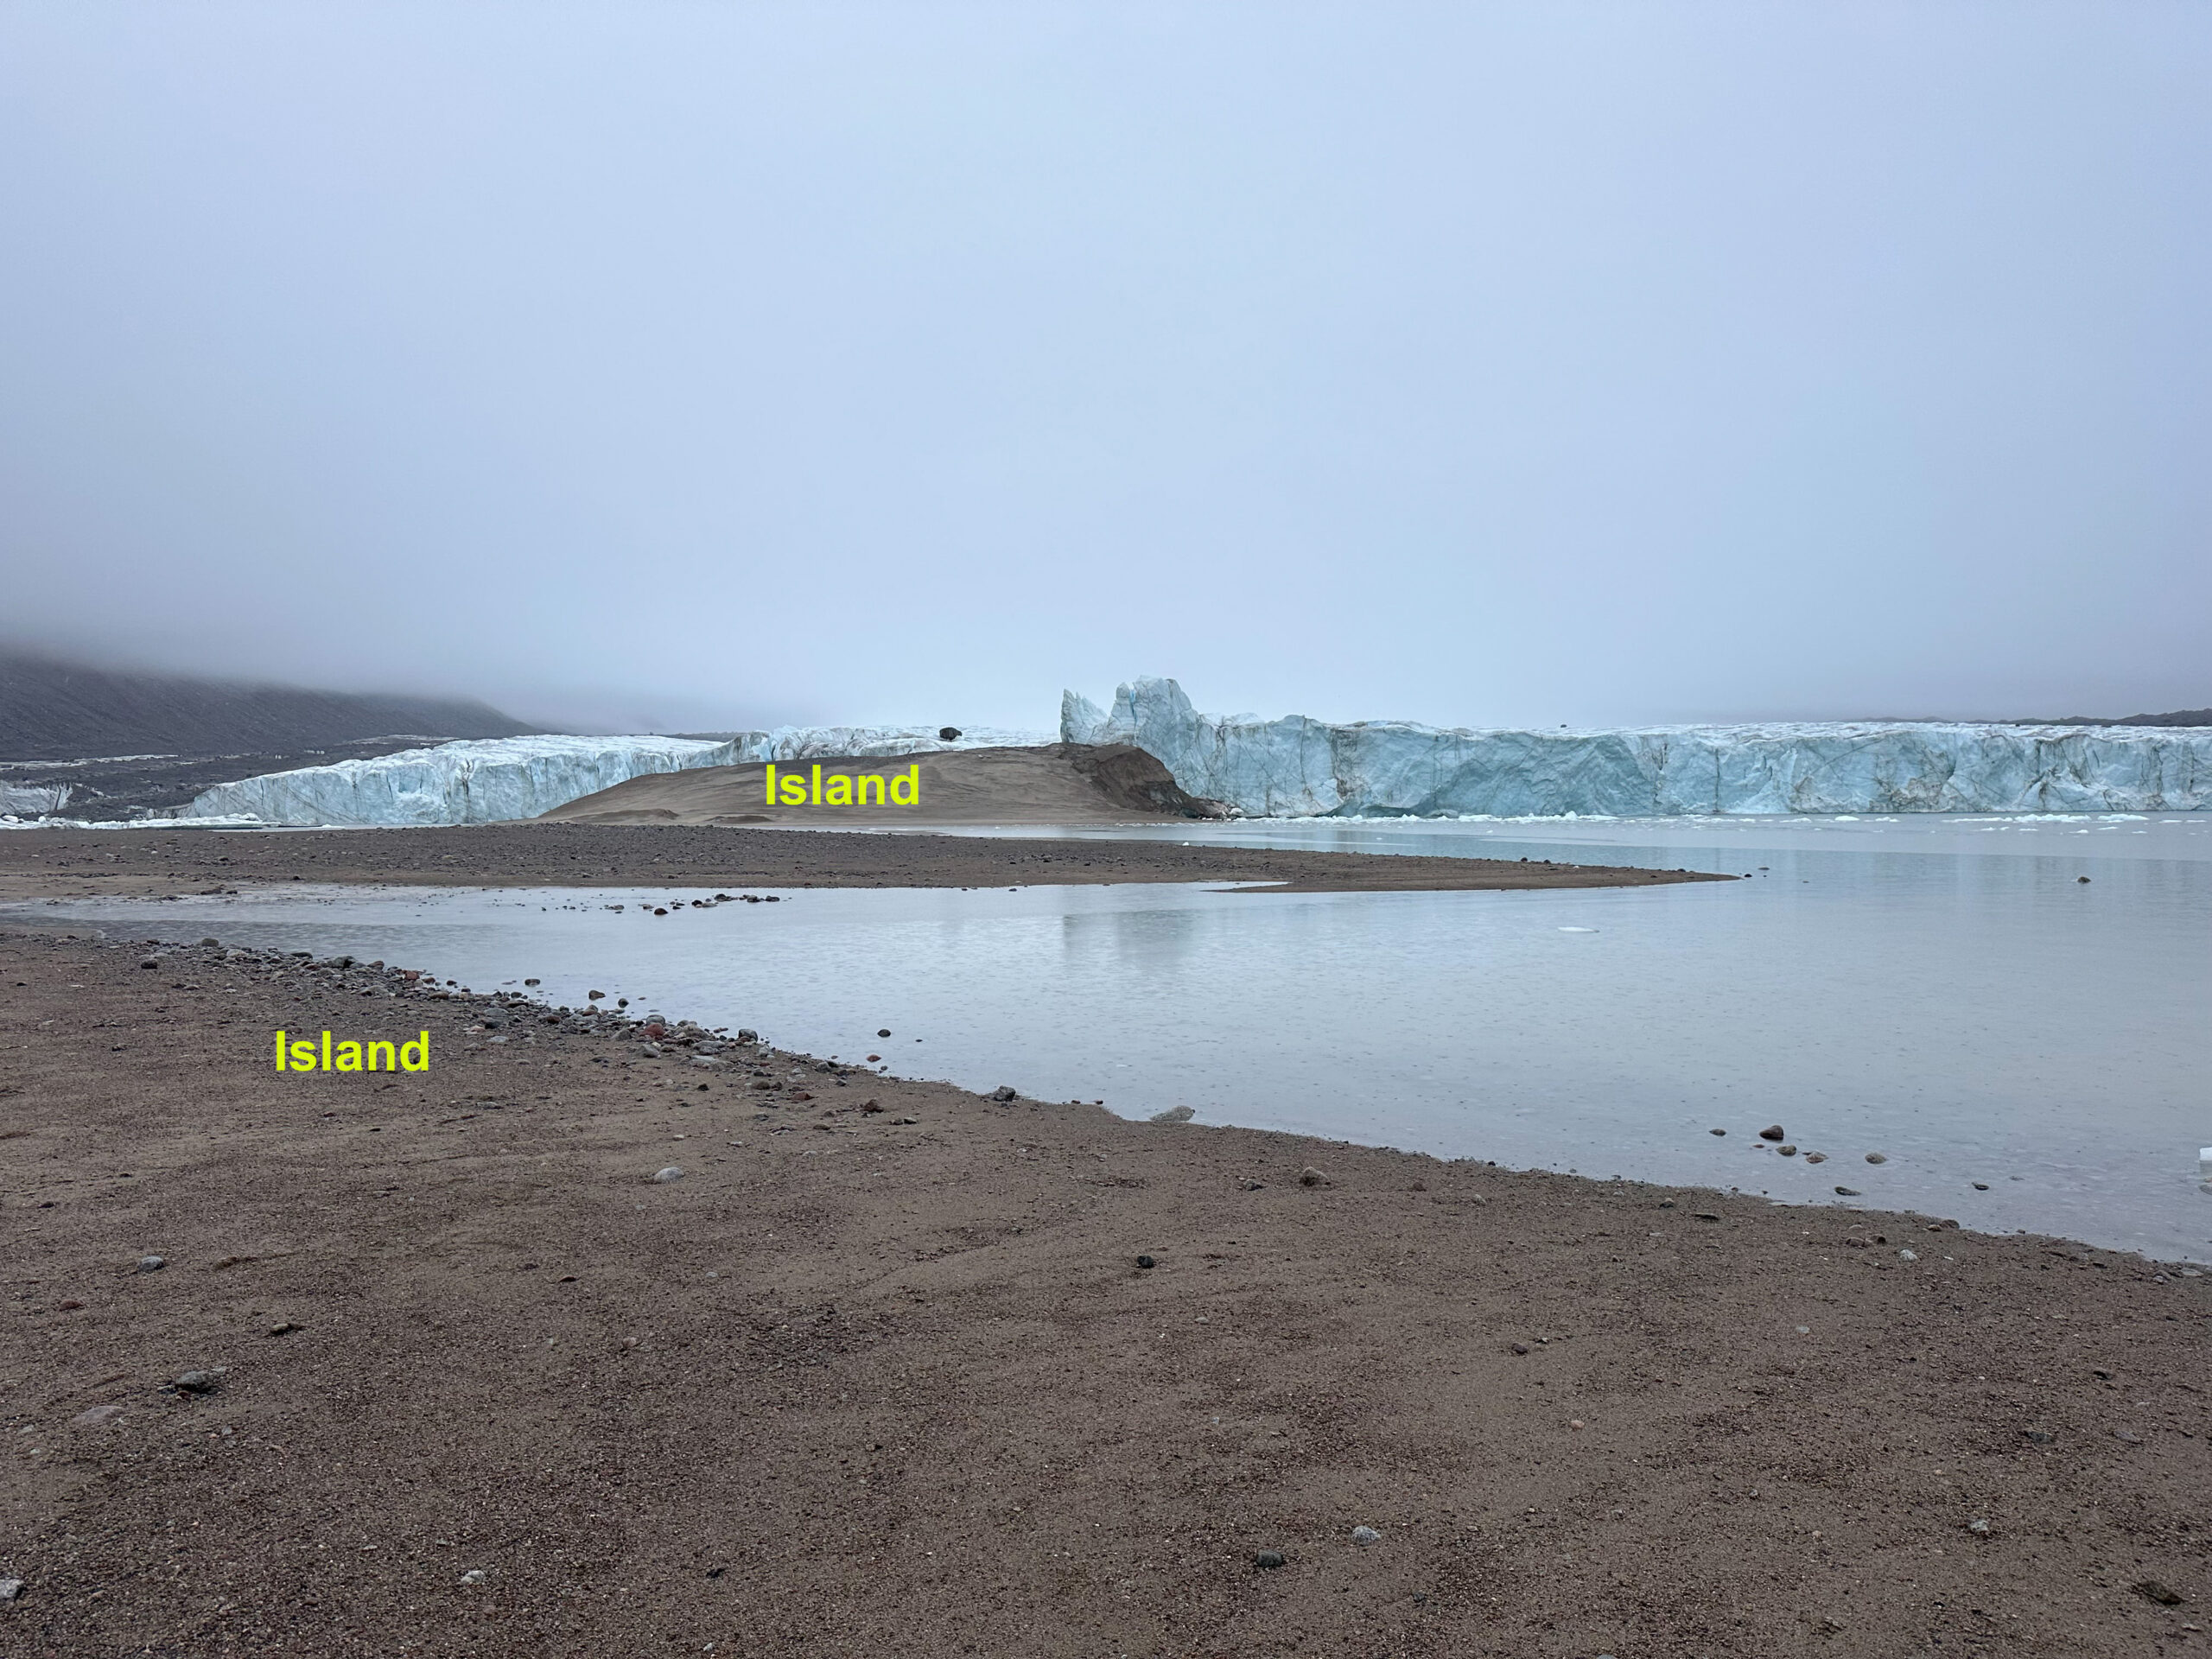
The climbing team visiting the oldest part of the island looking toward newest part (Bischke/Biner/Bessen/Klemmensen)

island-from-coronation-glacier-scaled

A view of the island from the north side of Coronation Glacier (Bischke/Biner/Bessen/Klemmensen)

island 2017-2023

Sentinel image of the expanding island at the Coronation Glacier terminus in Sentinel images.

tributary 1c

Tributary 1 detached from main glacier, note high snowline (Bischke/Biner/Bessen/Klemmensen)

tributary 2 and 3

Tributary 2 has a detachment point before the main glacier, though relict ice below still connects.  Note snow is only retained at very top of ice cap with a month of melt season left. (Bischke/Biner/Bessen/Klemmensen)

tributary 6a

Tributary 6 is still connected all the a detachment is occurring halfway from ice cap to main glacier. (Bischke/Biner/Bessen/Klemmensen)

tributary 7 and 8b
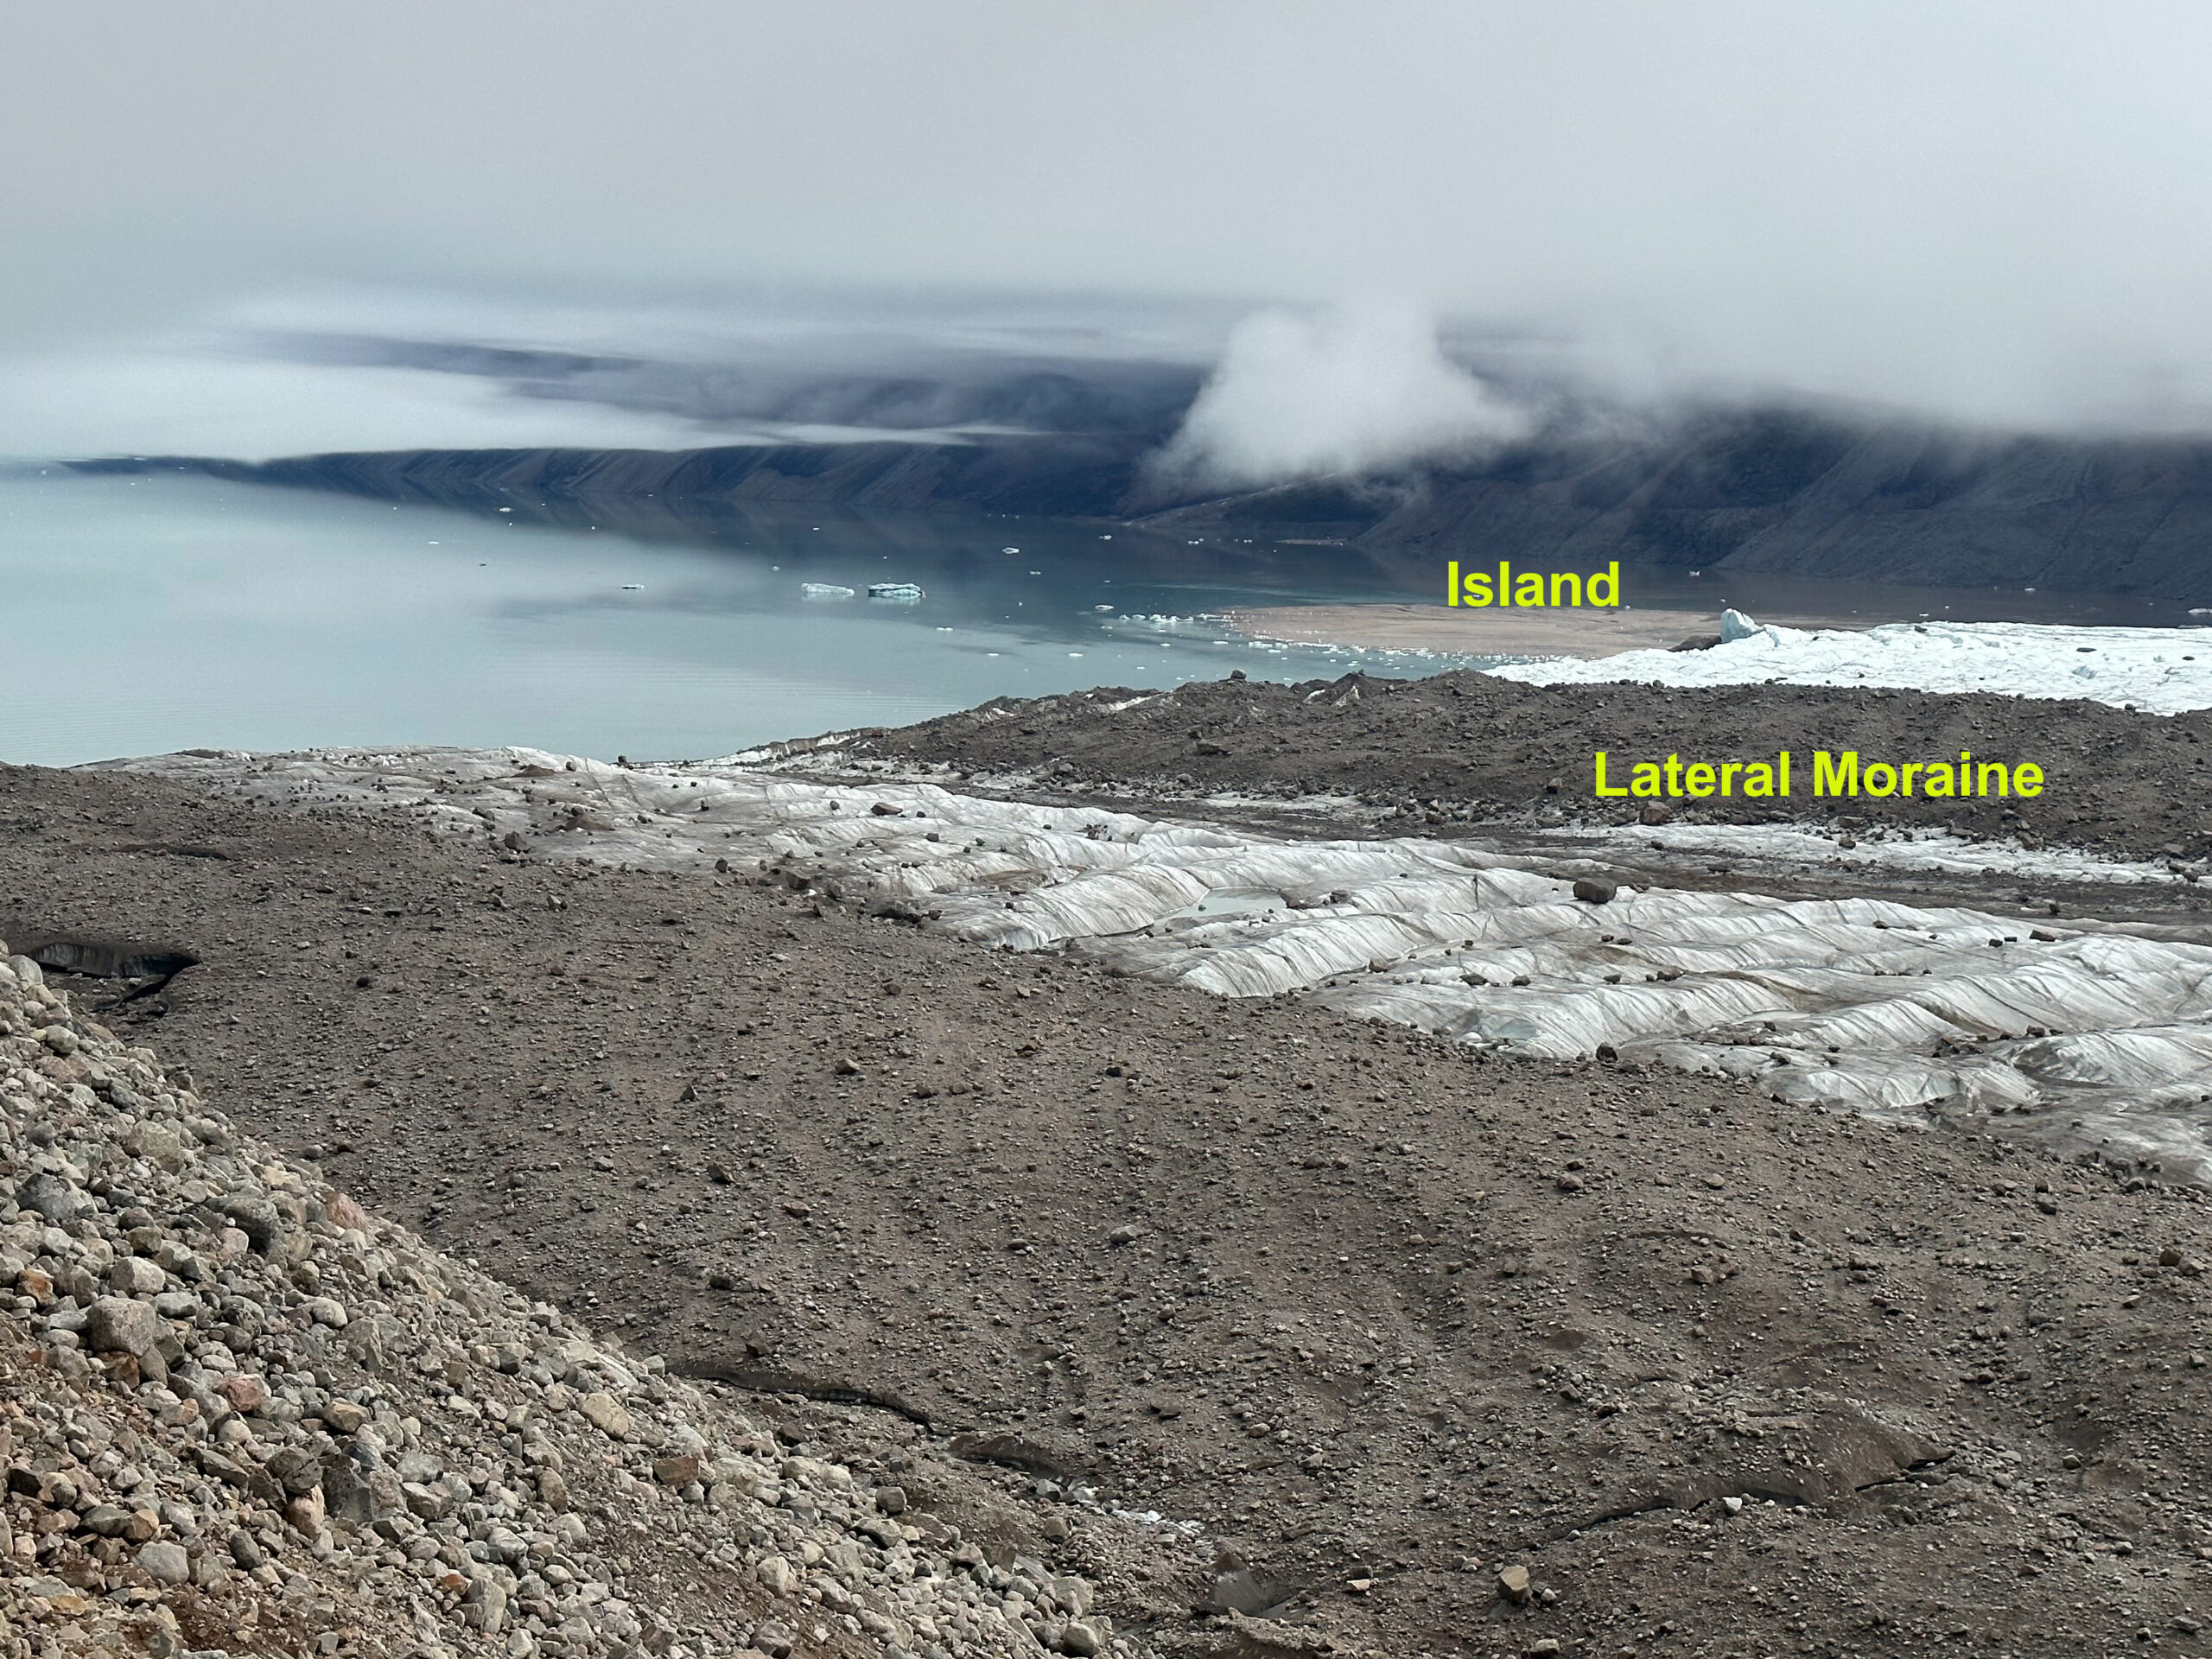
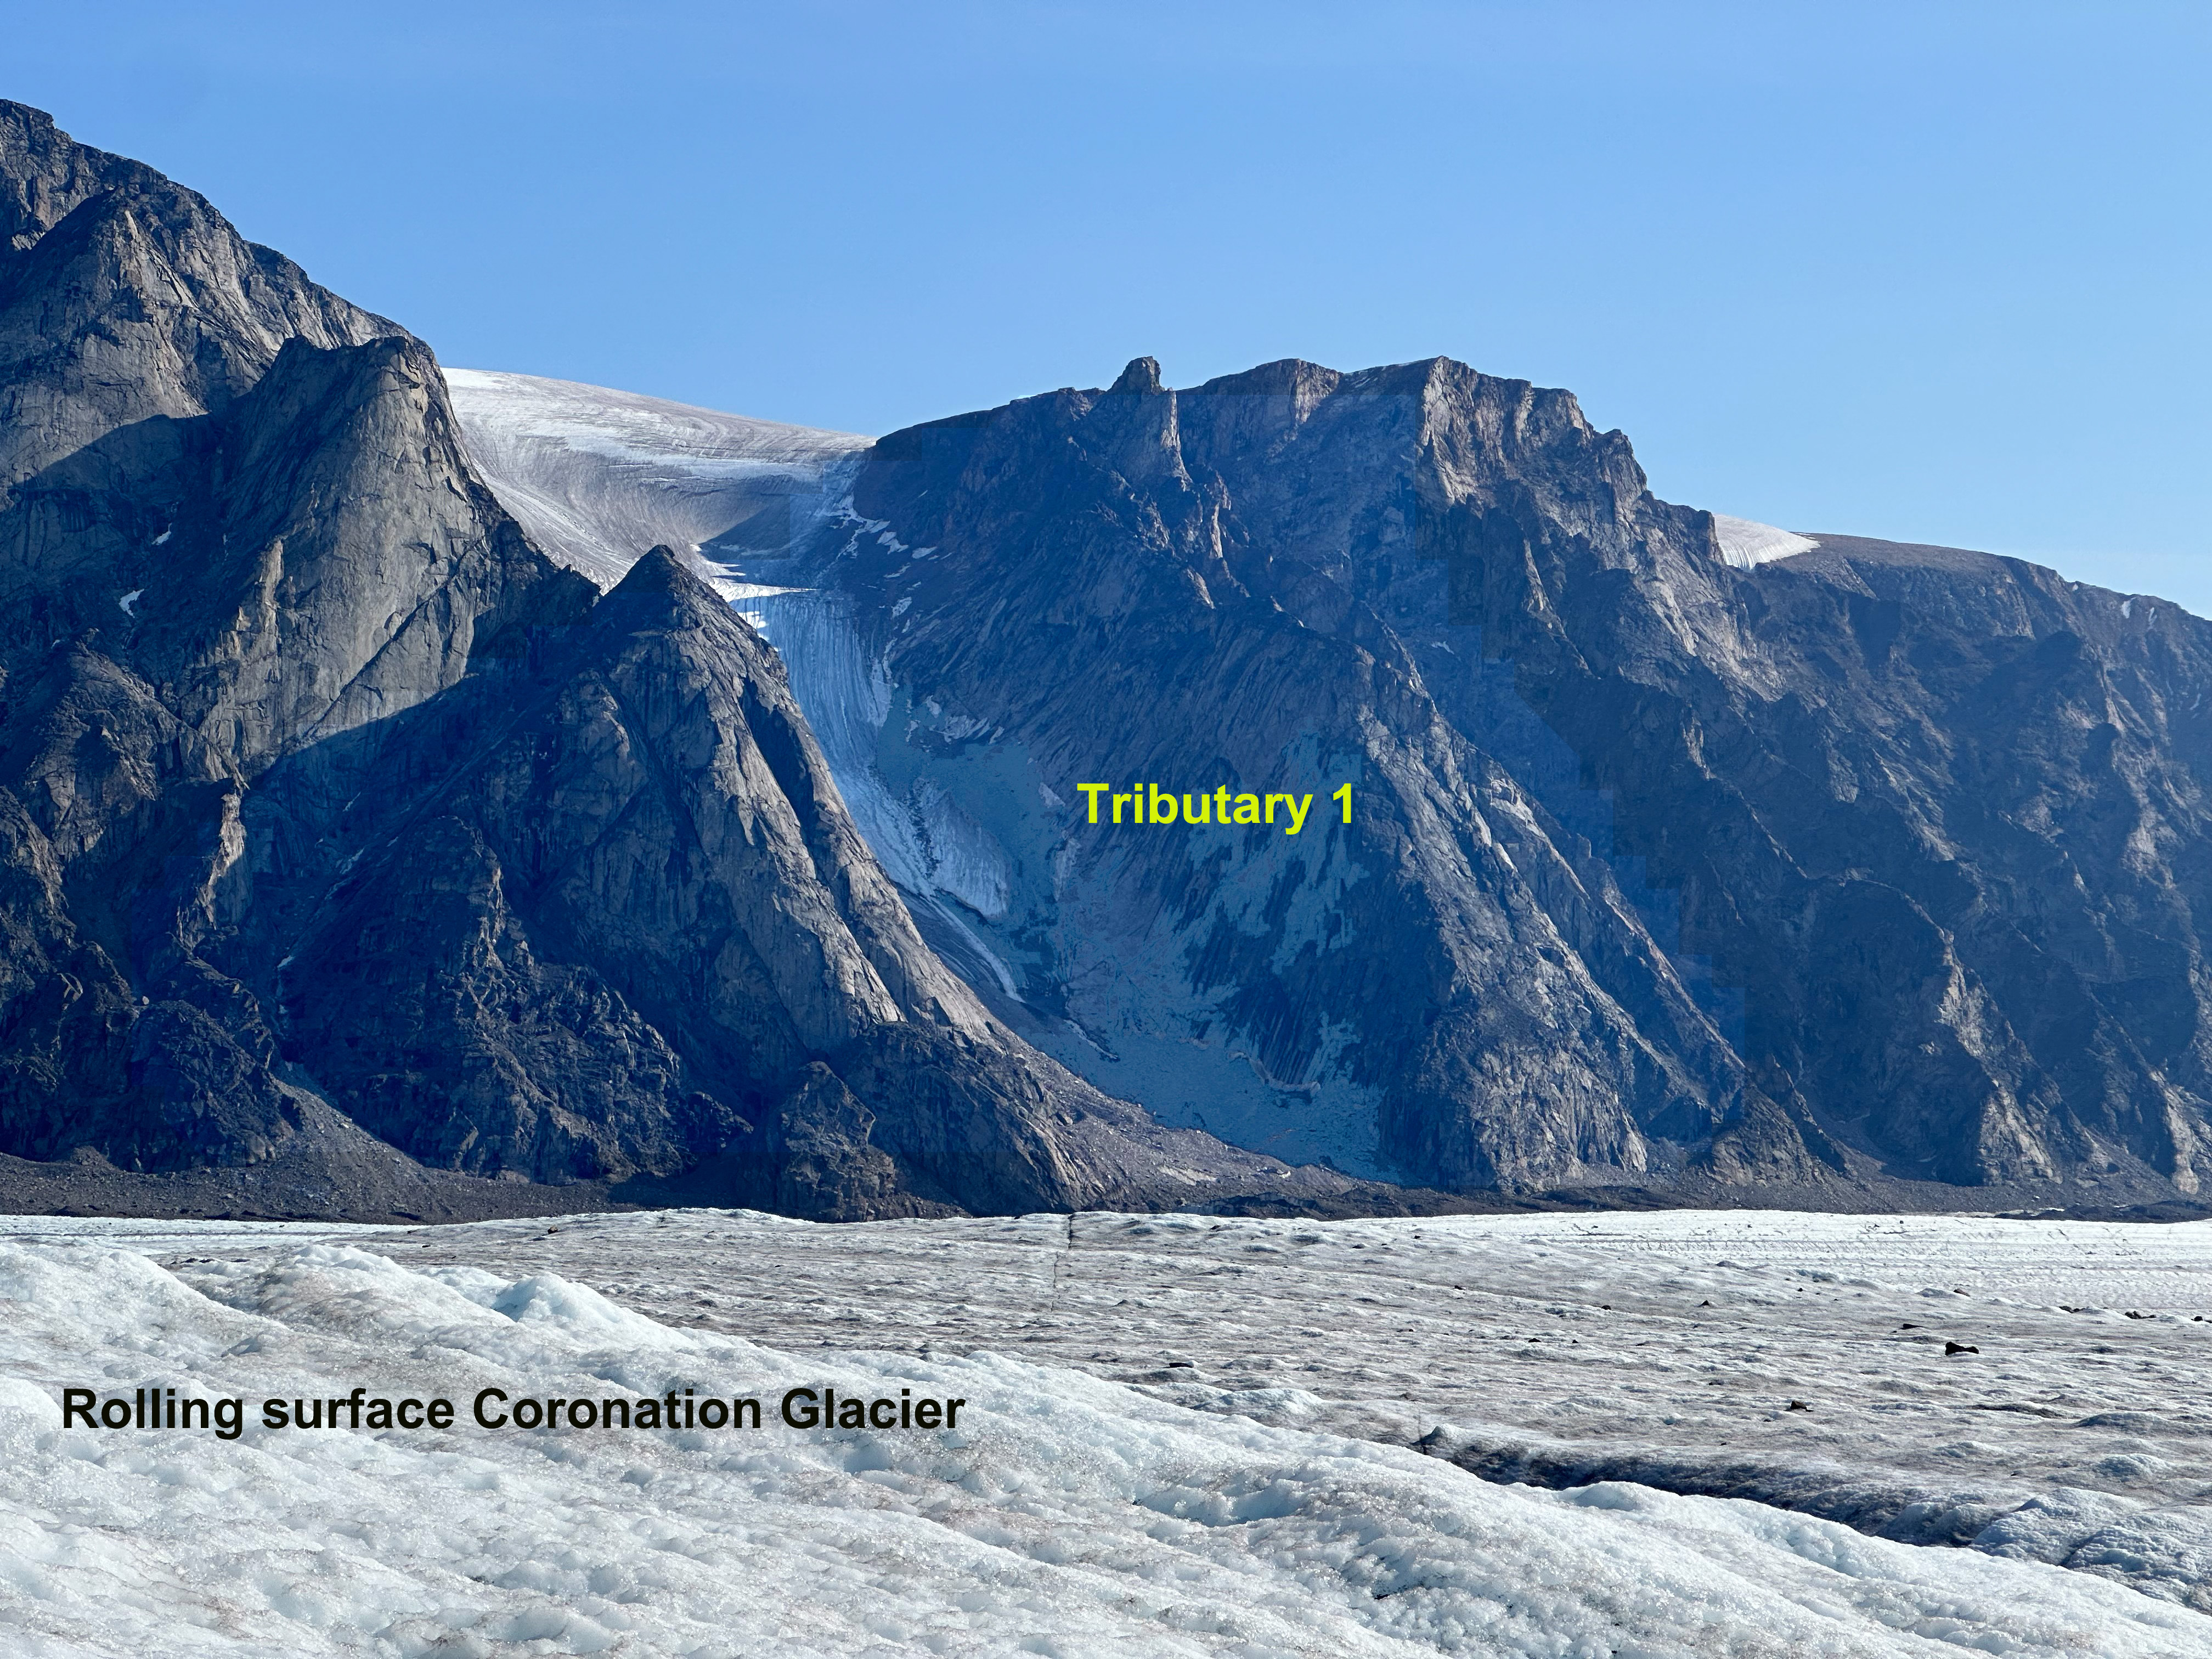
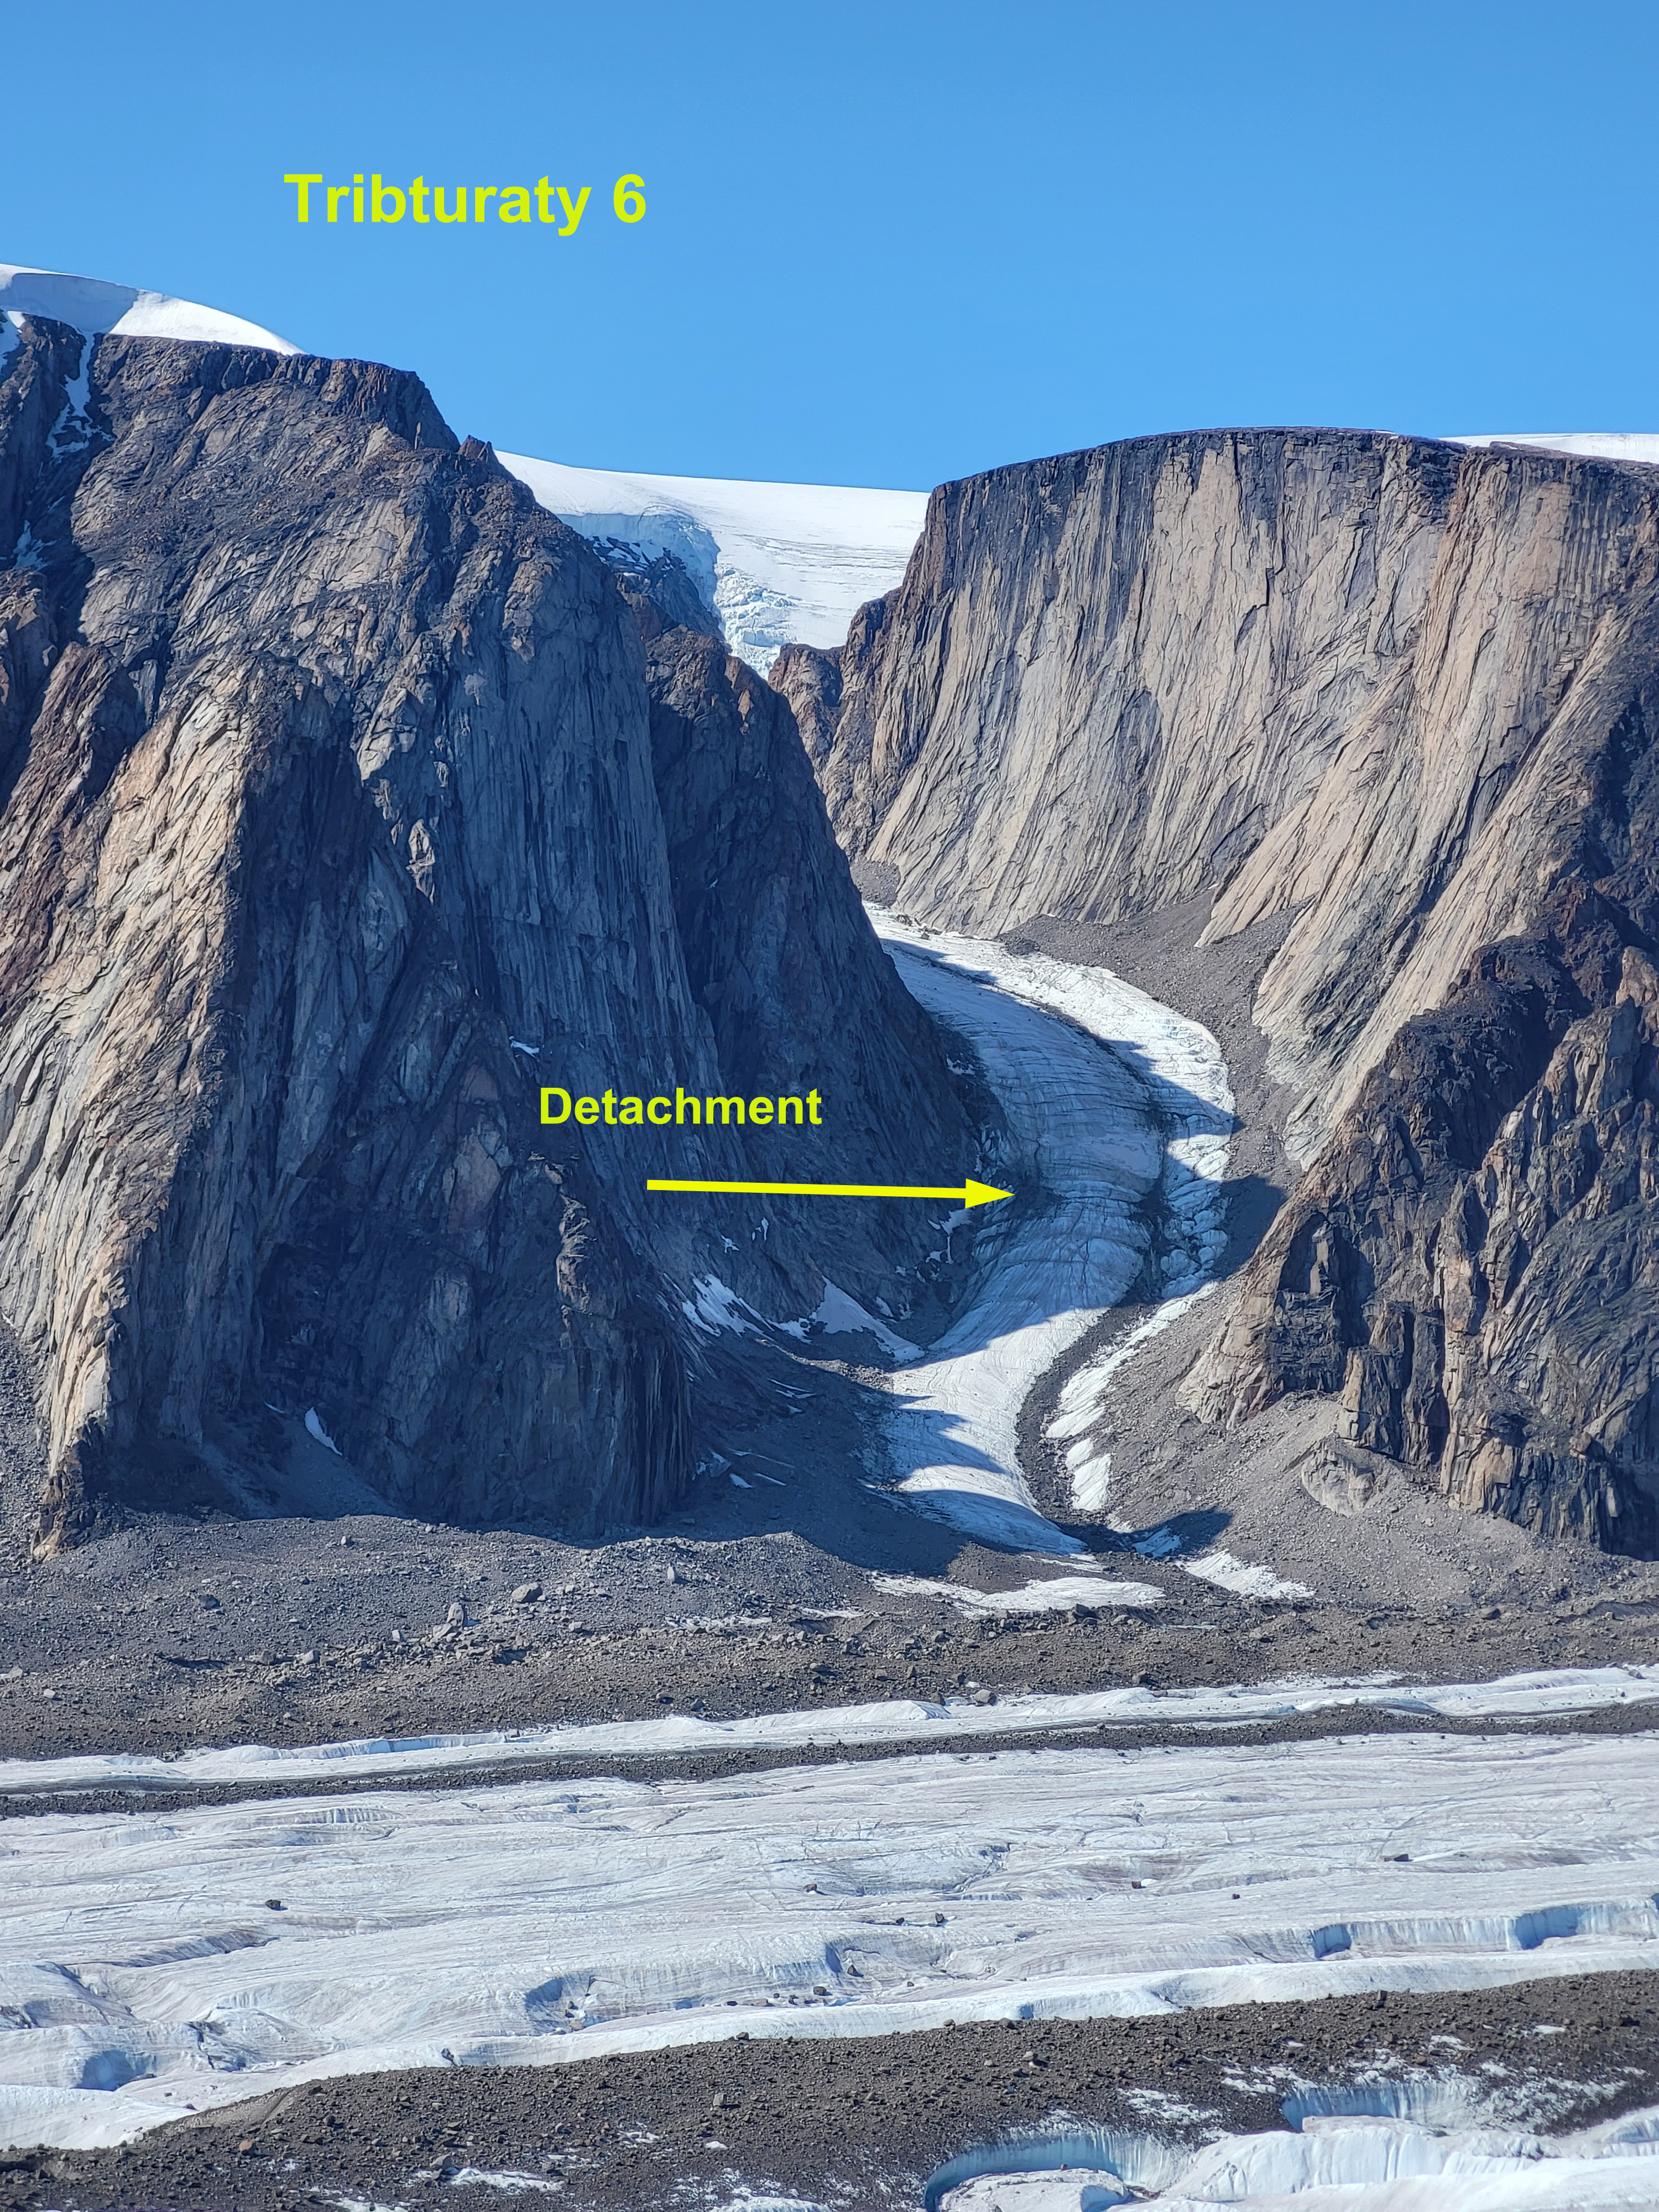
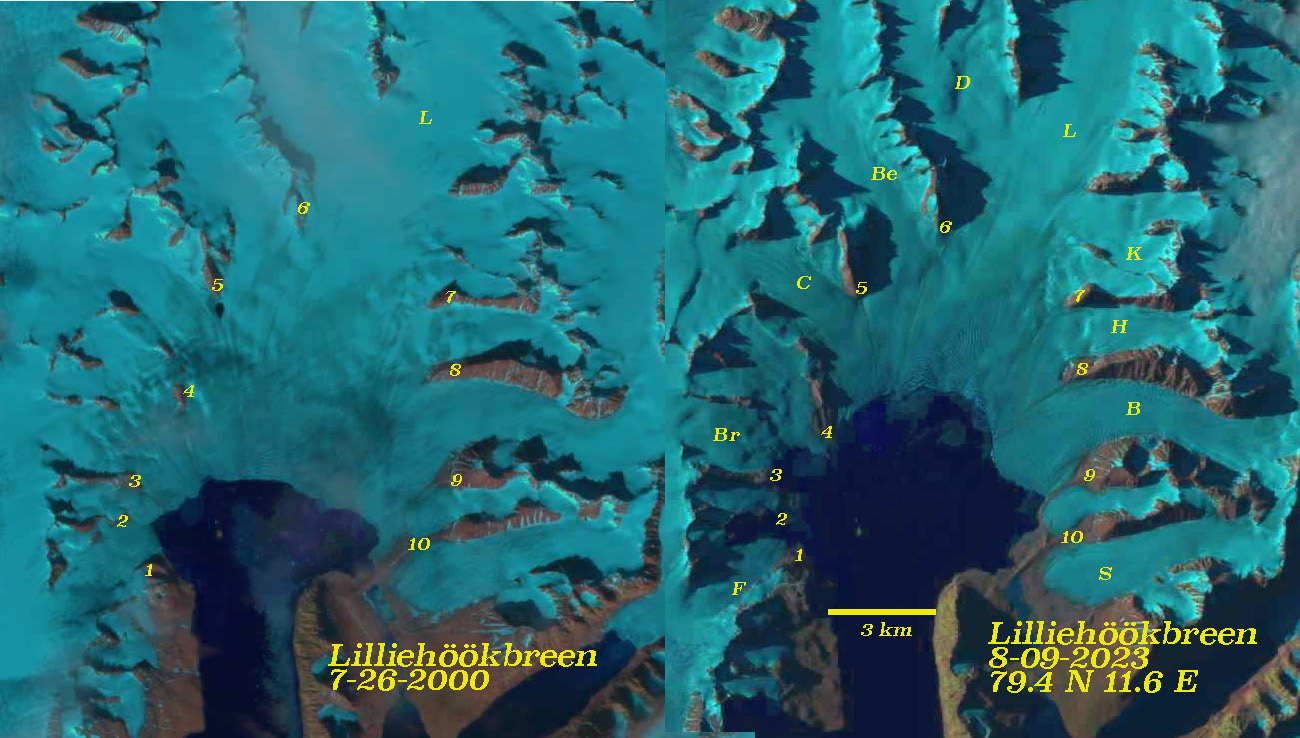
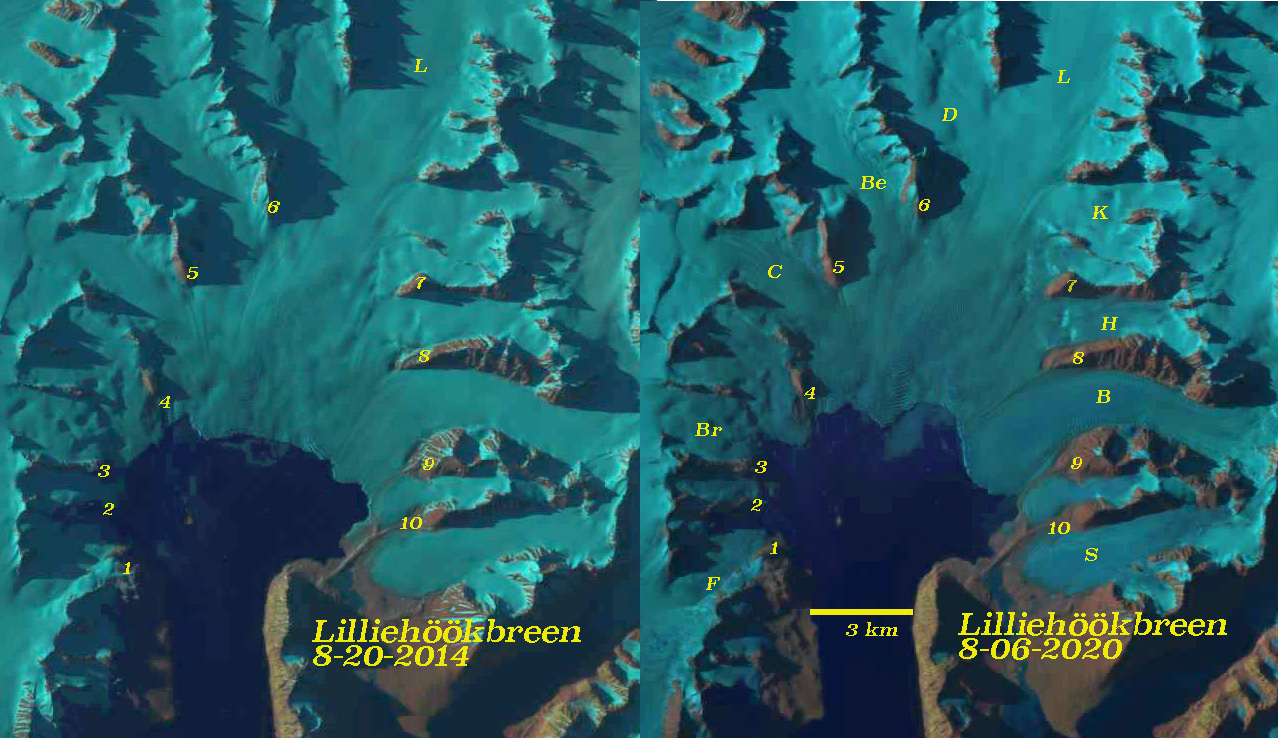
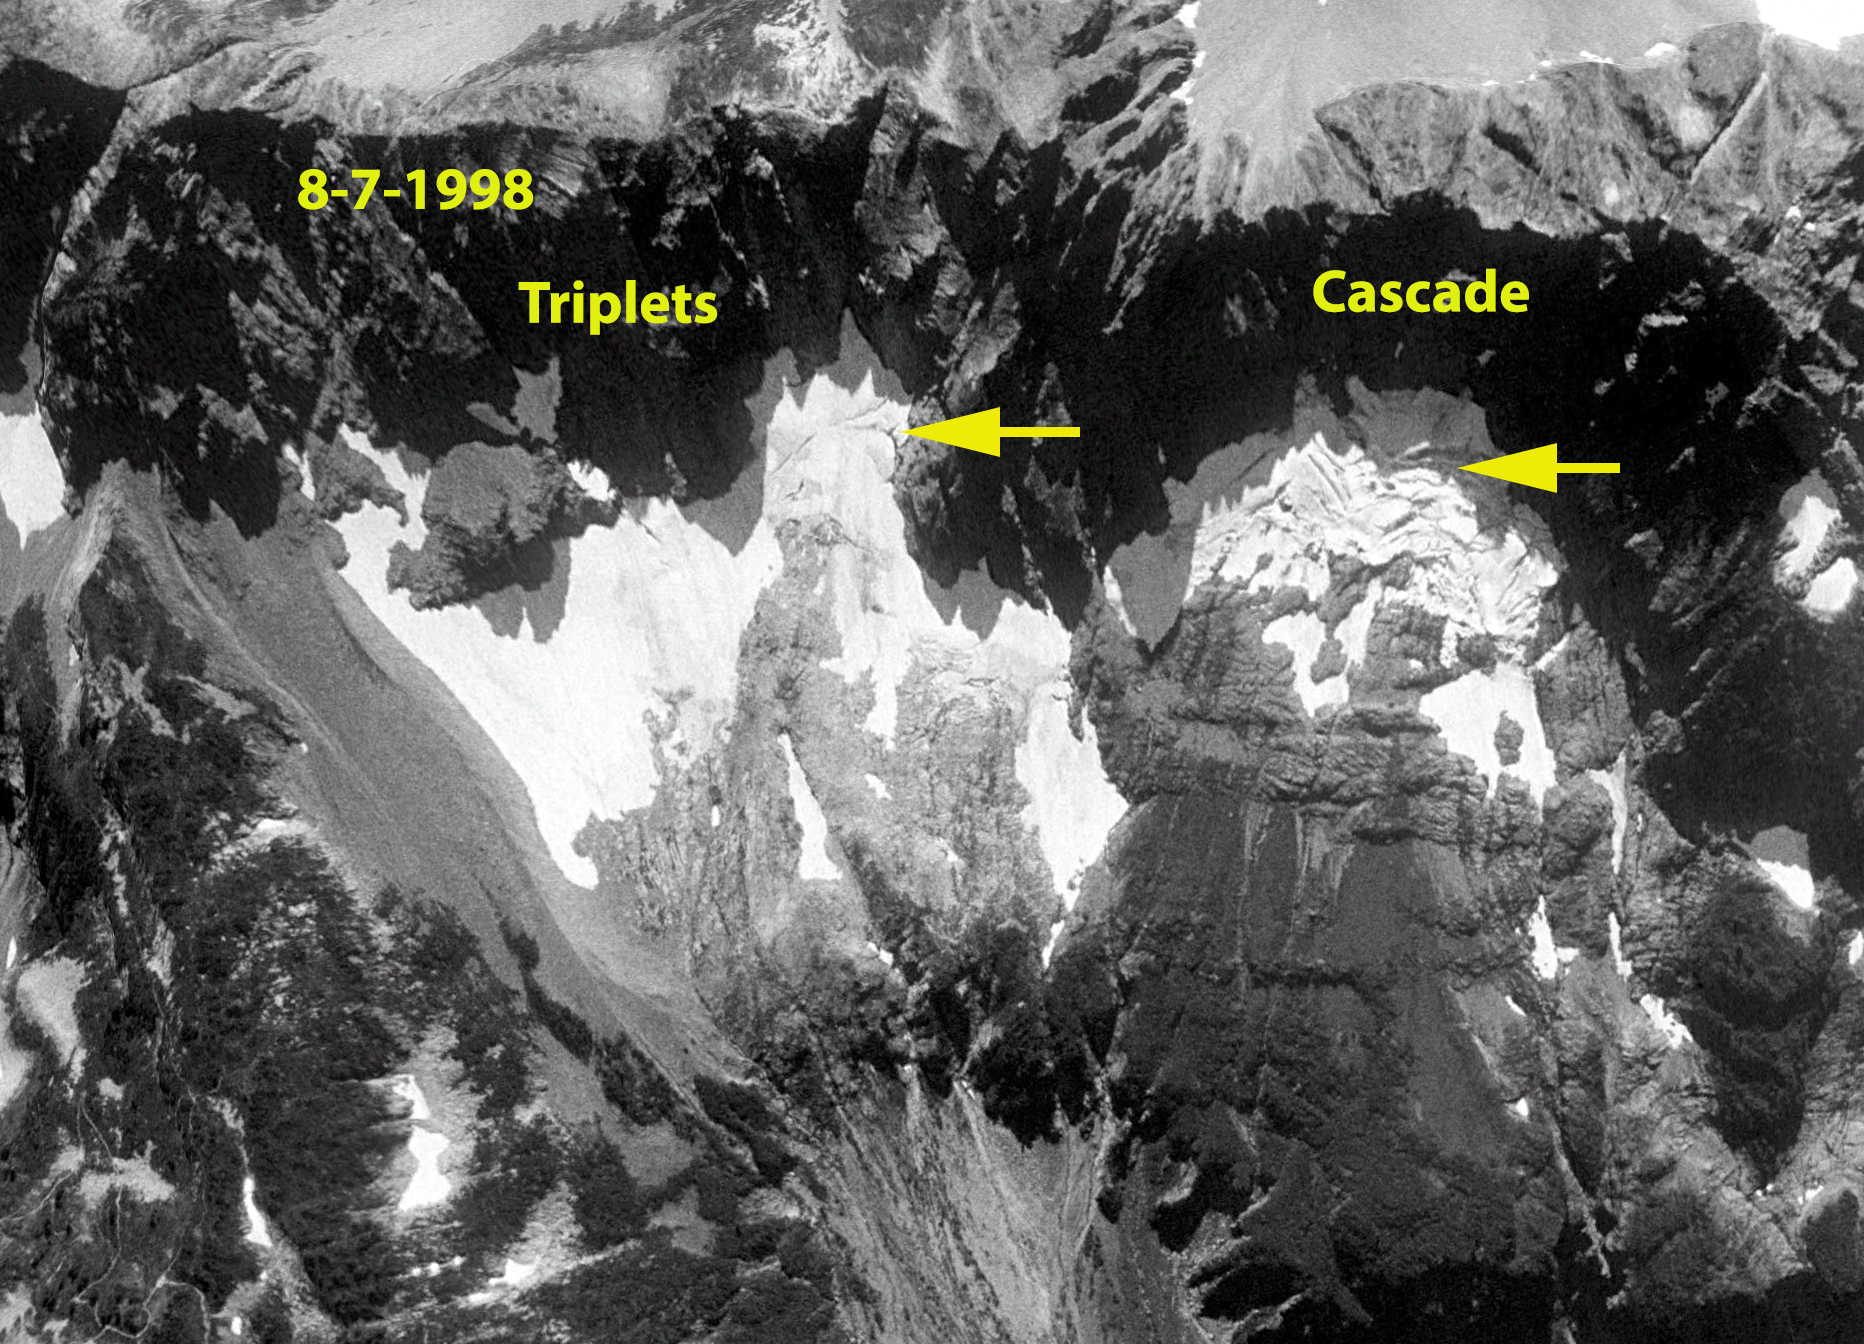
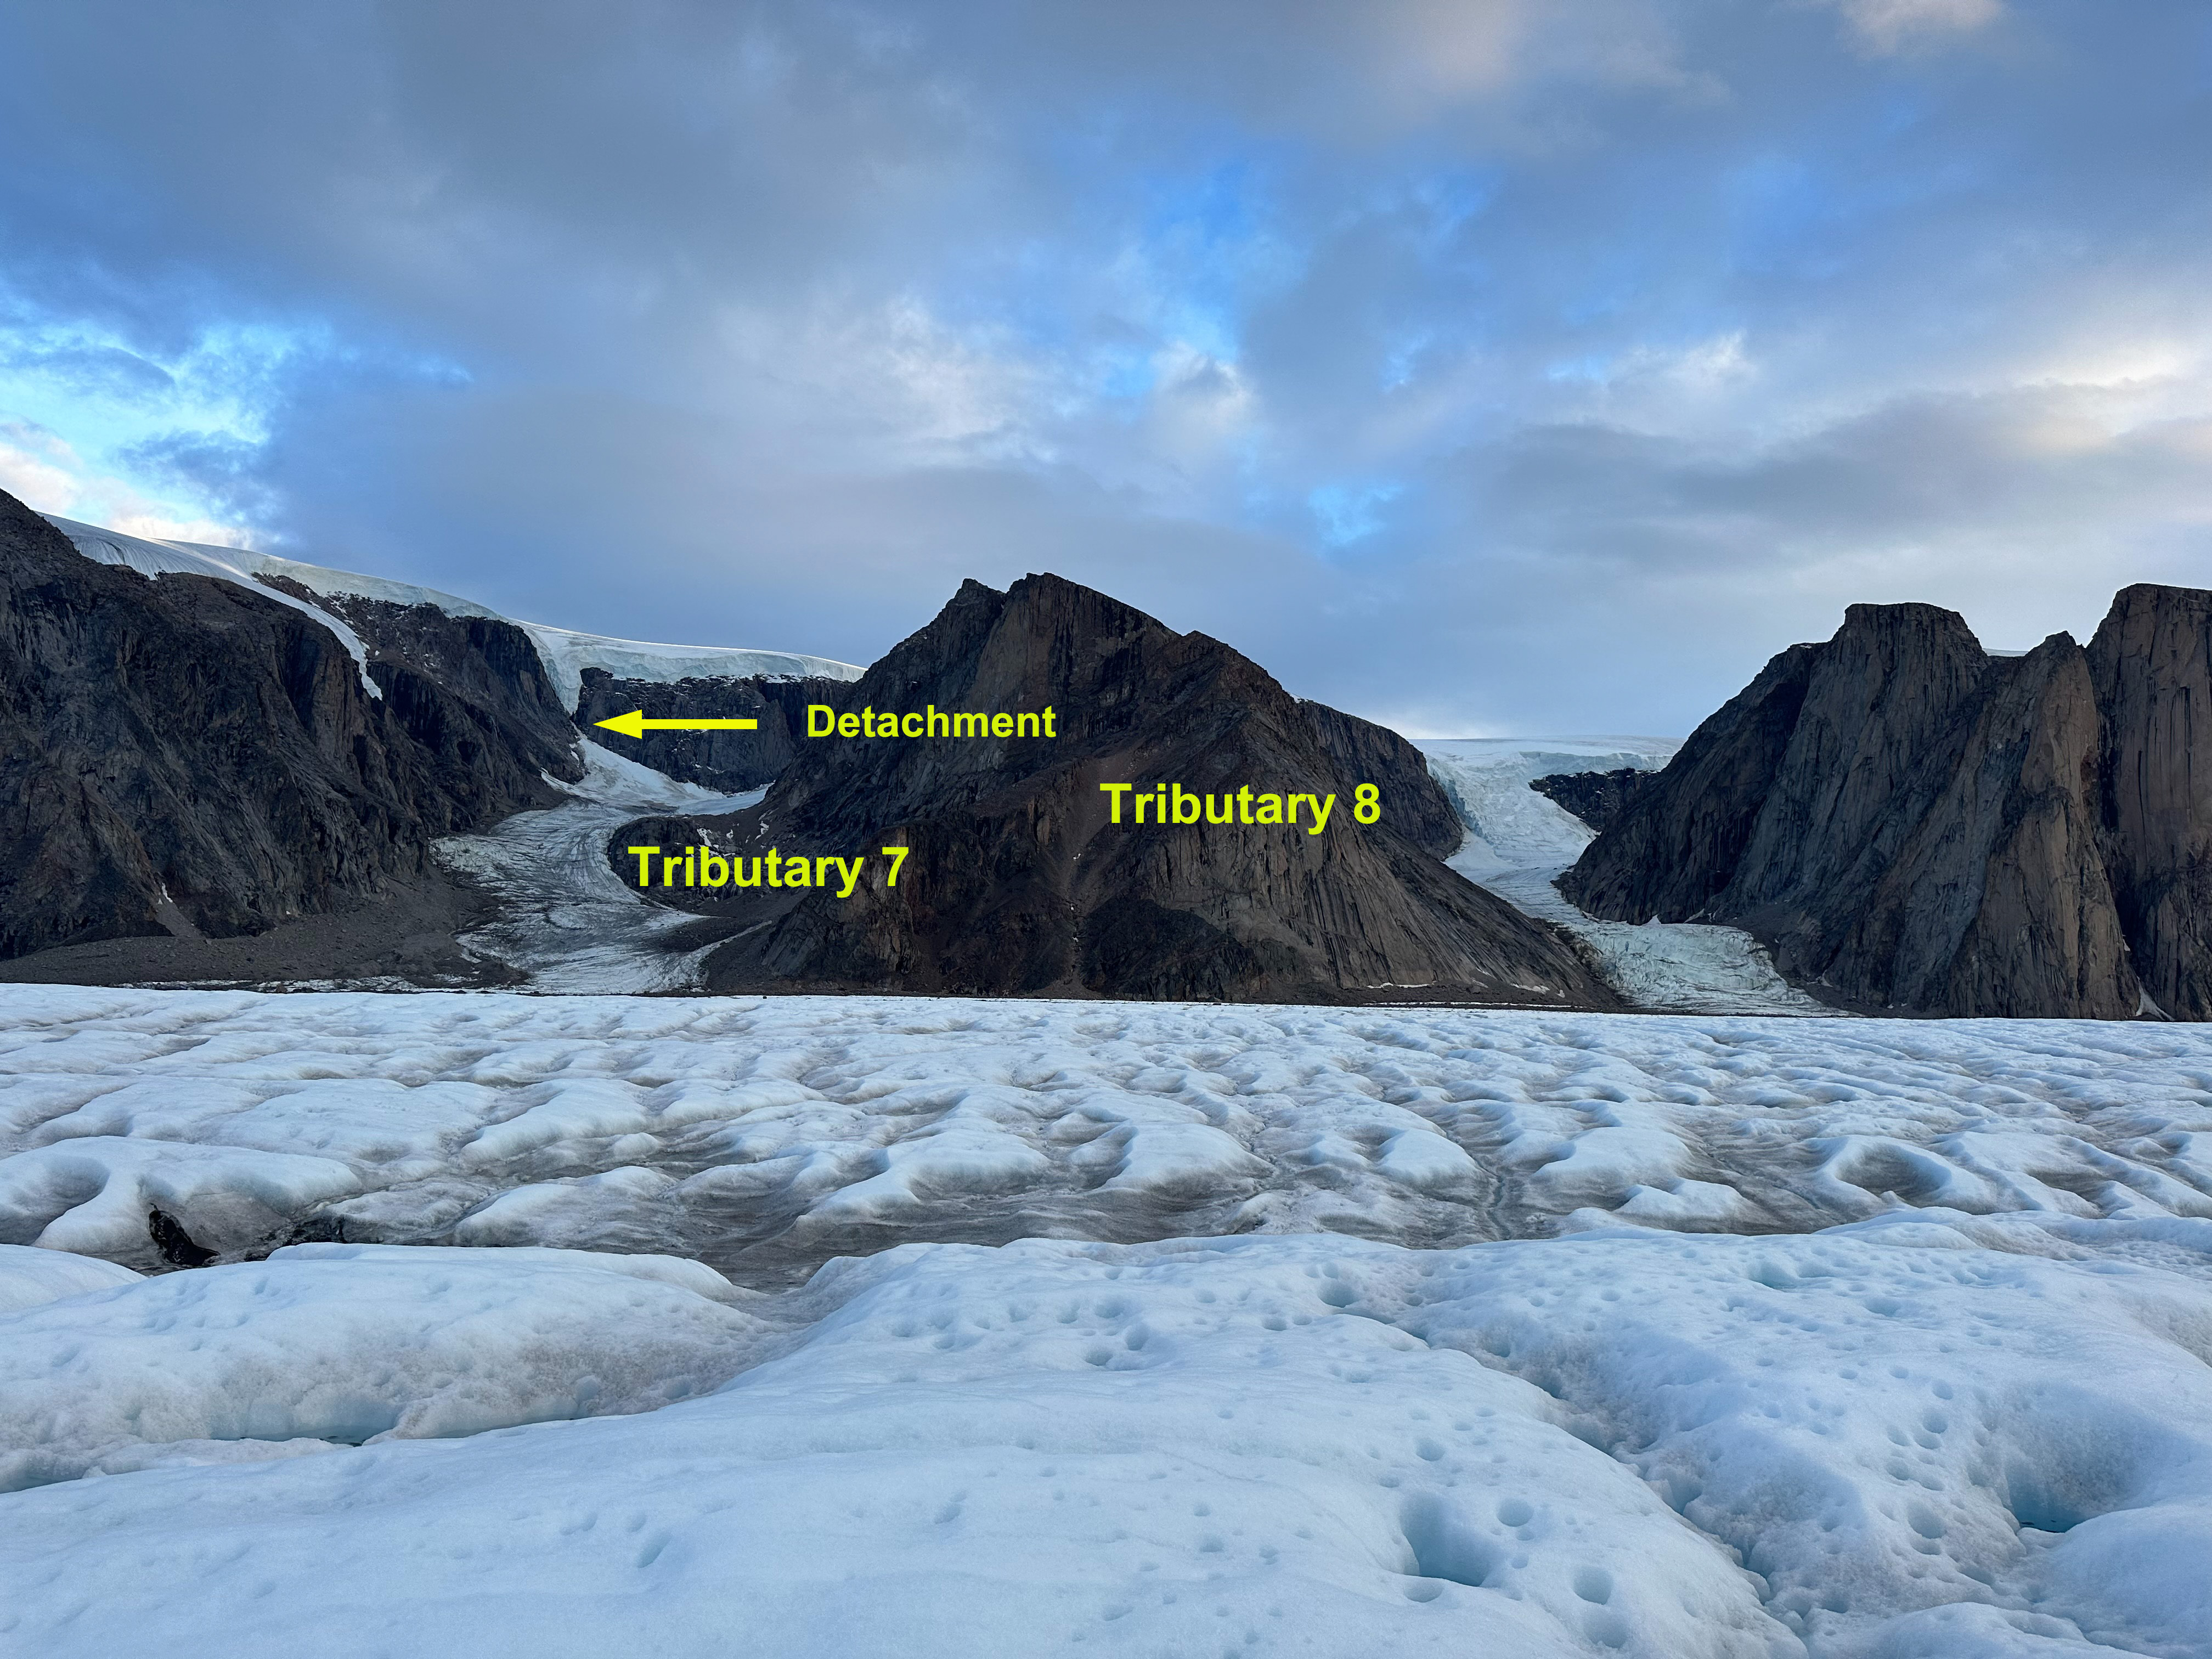
Tributary 7 and 8 are still connected, though 7 has a detachment now (Bischke/Biner/Bessen/Klemmensen)

Chasm Line

Triburary 9 had an interesting barrier to the climbers a deep chasm carved by an outlet stream draining meltwater, some of which had pooled in the lake shown. (Bischke/Biner/Bessen/Klemmensen)

Bernardo Glacier, Chile Lake Drainage as Retreat Continues

bernardo glacier 2022-2023 spring

Bernardo Glacier in Landsat images from Oct. 16, 2022 and Sept. 17, 2023 illustrating the drainage of the southern end of the proglacial lake by the northern terminus (N). The lake was full in 2021, partially drained by Oct. 2022, further drained by March 2023 and has not signficantly refilled by Sept. 2023, still 8 km² of exposed lake bed. 

Bernardo Glacier in Landsat images from 1986 and 2021 illustrating retreat at the southern (S), middle (M) and northern (N) terminus respectively. Red arrows are 1986 terminus locations, yellow arrows are 2021 terminus locations. Separation from Tempano (T) occurs at southern terminus, while lake expansion occurs at M and N.

Bernardo Glacier is an outlet glacier on the west side of the Southern Patagonia Icefield (SPI) that currently ends in an expanding proglacial lake system, with three primary termini.  The northern terminus retreated 4.1 km from 1986-2021 leading to an 8.7 km² lake expansion. Total lake area which had remained filled during this period was Their was a significant drainage of the lake at the north terminus that by late summer of 2023 had left 8 km² of lake bed exposed, and as spring arrives in 2023 has yet to refill.  Davies and Glasser (2012) indicate that over the last century the most rapid retreat was from 2000 to 2011. Willis et a (2012)  note a thinning rate of 3.4 meters per year during this period of the Bernardo Glacier region, which drives the retreat. Eñaut Izagirre conducted fieldwork in this area in 2019 and provided two images from the middle terminus of Bernardo Glacier, see below.

Bernardo Glacier in Landsat images from 1998 and 2020 illustrating retreat at the southern (S), middle (M) and northern (N) terminus respectively. Proglacial lakes not yet signficant in 1998, expansive by 2020. Red arrows are 1986 terminus locations, yellow arrows are 2021 terminus locations. Separation from Tempano (T) occurs at southern terminus, while lake expansion occurs at M and N.

In 1986 Bernardo the southern terminus of the glacier was in tenuous contact with Tempano Glacier.  The middle terminus primarily ended on an outwash plain with a fringing proglacial lake developing.  The northern terminus had retreated a short distance south from a peninsula that had acted as a pinning point. A small lake developed completely separating Bernardo Glacier and Tempano Glacier. By 1998 the northern terminus had retreated into the wider,deeper portion of the lake basin that was now filled with icebergs. In 2015 the northern terminus had retreated 3.5 km since 1986. By 2021 the northern terminus had retreated 4.1 km.  This led to a 7.8 km² lake expansion at the northern terminus, with a total area of 17.5 km². On October 2, 2022 the water level had dropped some, with lake area falling slightly. The lake continued to fall through the summer season of 2023. The lake has not refilled through the winter and into the spring of 2023, with the lake having an area of 9.5 km², and 8 km² of lake bed still exposed. Will the lake refill this summer or drop even further? Gourlet et al (2016) identify Bernardo Glacier as having thinner ice than other large outlet glaciers such Jorge Montt or O’Higgins, which helps lead to rapid terminus change. Other glaciers experiencing singificant retreat in this region of the Souther Patagonia Icefield include Oriental Glacier, Lucia Glacier, and Ofhidro Glacier.

Southern Andean huemel an endemic deer on the foreland beyond Bernardo Glacier (photograph from Eñaut Izagirre).

Middle terminus of Bernardo Glacier in 2019 taken by Eñaut Izagirre who considers this a condor-view

Sentinel images illustrating drop in lake level and resulting lake drainage from Oct. 2, 2022 to Sept. 17, 2023.

Retreat of Bernardo Glacier in Landsat images from 2003 and 2015.

From Mount Hood to Mount Robson Extremely Limited 2023 Snowcover Retained

Written by Ben Pelto, Jill Pelto and Mauri Pelto

jill sketch ice worm 2023

Field Sketch of Ice Worm Glacier from Aug. 13, 2023 on photograph of glacier. (Jill Pelto)

It was July 5, 1981 and Juneau meteorologist Brad Coleman had just informed us that Juneau had experienced one of its warmest least snowy winter ever. I was with the Juneau Icefield Research Program and we were headed up to the icefield the next day, it would be my first visit to a glacier. I was looking forward to plentiful summer skiing and now was concerned there would be limited snow. This worry proved unfounded, as once on the icefield, we stayed above 1000 m, and it was all snow, allowing me to ski 500 km in the next several weeks. From that summer through 2000, I continued to spend the majority of my time working on glaciers every August skiing whether in Alaska or in the North Cascade Range, Washington. Alpine glaciers need to maintain at 55%+ snowcover right to the end of the summer to maintain equilibrium. Hence, skiing should be plentiful. However, in 2003 I gave up skiing on glaciers during our August North Cascade field seasons, the snow had become too limited and patchy. During the last decade the percentage of snowcover has been consistently low, with the 2021-2023 period setting the record for persistent snowcover deficits in the North Cascacdes, but also throughout the Pacific Northwest from Mount Robson, BC to Mount Shasta CA. This sequence of difficult years for glaciers had led to the end for quite a few. -Mauri Pelto

I have spent 15 years with the NCGCP most years snow remains only at higher elevations or in large avalanche fans, with a couple of years having deep snowpack and lack of heat waves has led to a good year for the glaciers. And now years like 2015, 2021 and 2023 where there is so little snow that walking on the glaciers is almost a different landscape. Every feature is exposed, debris cover is piled up, and new or changed water features like melt channels or ponds emerge. In August 2023 it was most starkly seen on Mt. Daniel, on the eastern, drier side of the North Cascades. It was my first year seeing the loss of a glacier: the Iceworm Glacier. A remnant ice patch remains, but there are no longer any active features such as crevasses. It was also my first time seeing the very steep Daniel Glacier with essentially no snow. Navigating across bare ice on a 35+ degree slope for very few measurements had our whole team questioning how long it would be worth our effort. Some of my favorite moments of my 14 other seasons are glissading (or skiing with your hiking boots) down the steep slopes of Daniels. You can carve turns and do quick stops, and you can get down the glacier in about a quarter of the time you climb up. It’s always an exhilarating and rewarding way to end the season. This year the descent was difficult one firm crampon step at a time.  I clung onto one fun glissade on the adjacent Lynch Glacier. In that moment I needed to enjoy what I could, and after the season I needed to feel the loss of a place that has defined a piece of my life. 

Here we focus on this lack of snowcover we observed in the field and in satellite images from Mount Hood, OR to Mount Robson BC in August and Septemeber 2023. This combined with 2021-2023 has redefined many glaciers, making it clear how many cannot survive even current climate. We developed a forecast model of alpine glacier survival, published in 2010 that indicated significant accumulation zone thinning and/or lack of consistent accumulation zone are indicators of a glacier that cannot survive. The glaciers below on some of the highest peaks in OR, WA and BC are failing this metric in 2023.

Screenshot
Screenshot

At the end of August 2023 on the north side of Mount Hood, OR; Sandy Glacier and Ladd Glacier are so dirty looking in this Sentinel image that it is hard to discern that they are glaciers, both have limited patches of retained snow from the winter of 2023. Coe Glacier has three pockets of snow remaining from last winter covering close to 30% of the glacier. 

Screenshot
Screenshot

Across the Columbia River on Mount Adams, WA Wilson and Rusk Glacier are both over 90% bare firn and ice, with some snow on the upper margin above 2800 m where avalanche deposits endured.

Screenshot
Screenshot

On the south  slope of Mount Rainier, WA South Tahoma Glacier and Success Glacier lost all of their snowcover. There are a few patches of snow left on Kautz Glacier. The snowcover becomes more consistent at 3500 m, higher than can sustain most of the glaciers.

Ice worm glacier 1984-2023

Halfway between Mount Rainier and Glacier Peak is the Mount Daniel/Hinman area where glaciers are in rapid collapse. This includes Ice Worm Glacier on the east slope of Mount Daniel, which lost all of its snowcover in 203 (above) and Daniels Glacier that only has 5% snowcover in mid-August 2023 (below)

daniels-glacier-2022-2023

Foss Glacier on the northeast slope of Mount Hinman looks like a bug that splats on your windishield with wings/limbs in all directions, this will lead to rapid fragmentation.

Closer to Glacier Peak is Columbia Glacier, below Kyes, Monte Cristo and Columbia Peak. The view down the accumulation zone indicates a lack of snow or firn where there should be 2+ m of snowpack in early August.

Screenshot
Kololo Peak is on a ridge extending south from Glacier Peak and is host to several large glaciers. In September 2023 Whitechuck, Suiattle and White River Glacier lost all their snowpack, while the top of Honeycomb Glacier has a small area of snow left. Yellow arrows indicate where we observed the terminus of these glaciers 40 years ago.

Screenshot
Screenshot

On Glacier Peak Ptarmigan Glacier has separated into and east and west part and had no retained snow. Kennedy, Vista and Ermine Glacier had 10-20% retained snowcover on 9-15-2023 mostly in a band at 2500 m. Yellow arrows indicate terminus locations when I first visited these glaciers 40 years ago.

easton upper glacier composition

Easton Glacier is on the south/southwest side of Mt. Baker. The upper part of the glacier is a patchwork of ice, firn and snow, with new rock areas emerging even high on the glacier in August 2023. The difference with 2022 is evident. Two new waterfalls appeared in 2023 due to the extensive thinning and retreat at the terminus., yellow arrows. These are also depicted in the field sketch by Jill Pelto below.

jill easton sketch

Screenshot

Near Whistler, BC, the Garibaldi Neve (Icefield) showed little remaining snow in mid-September. Snow only clings high on Mount Garibaldi above 2200 m or 7200 ft.

Small glaciers across the region are losing all traces of seasonal and multi-year snow and are transitioning from active glaciers to remnant ice patches. The Stadium Glacier near Squamish British Columbia is one example of this. Photo by Ben Pelto.

Screenshot

The Conrad Glacier on the boundary of Bugaboo Provincial Park in British Columbia showing extensive bare ice and limited snow cover. The dark grey areas surrounding the white snow is firn, or multi-year snow, now exposed. The area covered by firn is important to glacier health. Firn that remains on a glacier becomes glacier ice and can retain meltwater. Areas of bare ice behave like a parking lot, nearly all water that reaches glacier ice leaves the glacier as runoff. The area of glaciers covered by firn is dramatically decreasing in the region. Pelto et al. (2019) found that 58% of the Conrad Glacier was covered by multi-year firn, a quick visual scan here shows that that number has declined to roughly 30-40%.

conrad smolke

Wildfire smoke darkens the sky and ice as Alexandre Bevington, Jacob Bailey and Margot Pelto stand on the Conrad Glacier in August 2018. Photo by Ben Pelto.

Coleman glacier 2018-2023 copy

Coleman Glacier is on the east flank of Mount Robson. In 2018 the terminus is in a small lake with the snow covering 25% of the glacier. By 2023 the glacier has retreated 400 increasing the lake size. The snowcovered area is less than 10% of the entire glacier and is restricted to regions above 2500 m.

The above images of snow free and nearly snow free glaciers is a sight that has until the last decade been very rare. It is now becoming a typical event. The glacier response has been rapid, profoundly changing most and leading to the end of some.

Lilliehöökbreen, Svalbard Calving Retreat and Separation 2000-2023

lilliehookbreen 2000-2023

Lilliehöökbreen terminus in 2000 was a continuous 11 km front fed by the tributary glaciers Supan (S), Hellman (H), Bjorlykke (B), Kutte (K), Darboux (D), Becqueret (Be), Cailletet (C), Bruckner (Br) and Forbes (F). By 2023 the continuous front was 8 km long having separated from Supan, Forbes, and Bruckner. Landsat images from 2000 and 2023 indicate a 2.5 km retreat resulting in a ~17 km² fjord expansion.

Lilliehöökbreen is a tidewater glacier at the head of Lilliehöökfjorden in Albertland-NW Svalbard.  The glacier had retreated at ~50 m/a year during the 1990-2008 period (Nuth et al, 2013). This glacier has a large region below 400 m, Noel et al (2020) observed that a 100 m rise in the ELA from 350 m to ~440 m led to extensive mass losses on Svalbard glacier increasing retreat rates.

The Lilliehöökbreen terminus in 2000 was a comglomeration of input from tributary glaciers Supan, Hellman, Bjorlykke, Kutte, Darboux, Becqueret, Cailletet, Bruckner and Forbes. Lilliehöökbreen’s calving front was a single unit that was 12 km long and typically around 50 m high. By 2013 Forbesbreen and Suppanbreen were no longer part of the continuous front with ridge #2, #3 and #10 reaching the ice front. By 2020 ridge #4 was just reaching the ice front after a period of rapid retreat of the main terminus, ~1 km in seven years.  In 2023 Brucknerbreen is completely separated by ridge #4 and the continual calving front is now 8 km long. The glacier has retreated 2500 m in 23 years, more than 100 m/year. This has expanded Lilliehöökfjorden by 17 km². Ridge #9 is nearing the ice front as well. Bjorlykke has experienced the least retreat of the tributaries feeding the Lilliehöökbreen terminus and Cailletet the most.

Screenshot
Screenshot

Toposvalbard map of the region indicating continuous 12 km calving front of Lilliehookbreen in 2005.

lilliehookbreen 2013-2020

Lilliehöökbreen terminus in 2014 was a continuous 12km front fed by the tributary glaciers Hellman, Bjorlykke, Kutte, Darboux, Becqueret, Cailletet, and Bruckner. By 2020 the continuous front was 9.5 km long having separated from Supan, and Forbes. Landsat images from 2000 and 2020.