35th Consecutive Year of Alpine Glacier Loss-in State of Climate 2022

wgms-annual-balance.

For the 14th year I had the opportunity to author the Alpine Glacier section of the State of the Climate 2022 report published in the Bulletin of the American Meteorolocial Society. Below is this report with additional images.

An increasing frequency of heat waves impacting glaciated mountain ranges continues to lead to large mass balance losses. In 2022 heat events in the European Alps, Svalbard, High Mountain Asia and the Central Andes of Argentina and Chile resulted in a mean annual mass balance of -1433 mm w.e., for all 108 reporting alpine glaciers, with data reported from 20 nations on five continents.  In the hydrological year 2021/22 the preliminary regionally averaged annual mass balance based on the World Glacier Monitoring Service (WGMS, 2021) reference glaciers was -1179 mm w.e. compared to the 1970-2020 average -490 mm w.e.

In 2022, a negative annual mass balance was reported from 34 of the 37 reference glaciers reported  to WGMS. The mean annual mass balance of thereference glaciers reporting was -1547 mm w.e.. Reference glaciers each years of observation are used to generate regional averages. Global values are calculated using a single value (averaged) for each of 19 mountain regions in order to avoid a bias to well observed regions. The regionally averaged annual mass balance was -1179 mm w.e., less negative than the general mean. This makes 2022 the 35th consecutive year with a global alpine mass balance loss, and the 14th consecutive year with a mean global mass balance below -500 mm w.e. This acceleration in mass loss from global alpine glaciers in the 21st century matches the findings of Huggenet et al (2021).

heat wave alpine glacier incompatibilityThe lack of retained snowpack is evident at glaciers around the world in 2022.

More frequent and intense heat waves impacting glaciated ranges continued to take a toll on alpine glaciers in 2022. Heat waves reduce snow cover extent earlier in the melt season,  exposing ice surfaces earlier and enhancing surface darkening, both causing higher melt rates on alpine glaciers (Shaw et al. 2021; Pelto et al. 2022; Cremona et al., 2023).

All 32 reporting glaciers in the Alps, Pyrenees and Caucasus Mountains had a negative mass balance averaging –3100 mm w.e. in 2022.  In the European Alps the combination of low winter snowpack and several summer heat waves generated unprecedented mass loss (BAMS, 2023?). In Switzerland the 25 days of heat waves in 2022 are estimated to have melted 1.27±0.10 km3 w.e., equivalent to 35 % of the overall glacier mass loss during the summer (Cremona et al, 2023).

In Norway and Sweden, the average balance of 11 reporting glaciers was -443 mm w.e., with three glaciers in Norway having a positive balance.  Iceland completed surveys of nine glaciers, five had a positive balance and four a negative balance with a mean mass balance of -7 mm w.e., e.g. equilibrium.

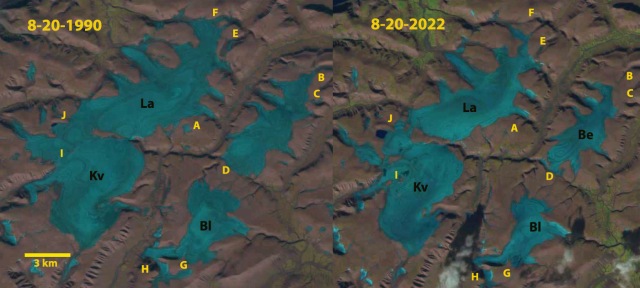
blaisen ice cap compare 2022Langjokulen (La), Kvitisen (Kv), Bergfonna (Be) and Blaisen (Bl) ice caps on Edgeøya in Sentinel image from 8-20-2022 illustrating the lack of snowcover, limited firn areas and numerous annual layers.

On Svalbard the mean loss of the four reporting glaciers was -1102 mm w.e.. The negative mass balances were due to several summer heat events (BAMS, 2023?), which led to many glaciers and ice caps losing all or most of their snow cover, further accelerating mass loss (Figure 2.c.3.1).

Screenshot
Screenshot

Helm Glacier BC with limited retained snowpack.

In Alberta and British Columbia, Canada and in Alaska and Washington, United States,19 glaciers had a negative mass balance, averaging -965 mm w.e.. The Alberta, British Columbia and Washington region again experienced several prolonged heat waves. Daily glacier ablation in this region was noted as increasing by 30-40% during heat wave periods (Pelto et al 2022).

Screenshot
Screenshot

Volcan Overo, Argentina with no retained snowpack

In South America, mass balance data, reported from five Andean glaciers in Ecuador, Argentina, and Chile, were negative with a mean of -1465 mm w.e.. The combination of drought and heat events left many central Andean glaciers snow free by mid-summer in 2022. Shaw et al. (2021) noted a significant decline in surface albedo (Section 2.h.1) due to decrease fractional snow cover that further enhances melt.

In the High Mountain Asia mass balance measurements were completed on glaciers in China, Kazakhstan, Kyrgyzstan, Russia, and Tajikistan. All twenty glaciers reported negative balances. The average mass balance was -1040 mm w.e.. The negative balances were driven by above average melting during the May-July period (BAMS, 2023?).

In New Zealand the mass balance assessed on Brewster and Rolleston Glacier was strongly negative at -1125 and -1065 mm w.e. respectively. This matched the end of year snowline observations on 50 glaciers that was one of the five highest of the last 45 years.

Annual mass balance is reported in mm water equivalent (w.e.). A value of -1000 m w.e. per year is representing a mass loss of 1,000 kg m-2 of ice, or an annual glacier-wide thickness loss of about 1100 mm yr-1

Allen Glacier, Alaska Terminus Tongue Breakoff 8-21-2023

allen glacier comparison 2023

Allen Glacier terminus in Landsat image from 8-21-2023 indicating the three new icebergs with an area of 1.5 km² that calved. Lake area is now 14 km².

allen glacier 1987

Allen Glacier drains east from the Chugach Mountains terminating in an expanding proglacial lake adjacent to the Copper River. In 1987 the terminus filled most of the proglacial with only the northeast corner open, lake area 2 km². A landslide is also evident spreading below across the snowline in this Landsat image below.

allen glacier 2002

By 2002 the lake had expanded with the northern bay ice free and a fringing area of open water along entire margin. In this Landsat image below lake area 6 km².

allen glacier 2017

In 2017 a southern bay had opened and become ice free, with a central tongue separating the northern and southern bays of the proglacial lake, lake area 11 km². The Landslide continues to move downglacier in this Landsat image below.

allen glacier 2021In 2021 rifting had developed 2 km upglacier of the terminus, with the central tongue calving some smaller icebergs ~01. km² in this Landsat image below.

Screenshot
Screenshot

In July 2023 the central tongue continued to calve small icebergs in this Landsat image, with a rift evident that had developed in 2022.

Screenshot
Screenshot

On August 21 2023 a calving event occurred along the rift that had been visible for over a year. This generated several icebergs with the 3 primary icebergs having a combined area of 1.5 km². The proglacial lake has expanded from 2 km² to 14 km² since 1987. Terminus retreat has been ~3 km in this interval.

Collapse of the Glacier Complex on Mount Daniel-Hinman, Washington

jill sketch ice worm 2023

Jill Pelto Sketches the demise of Ice Worm Glacier August 13, 2023.

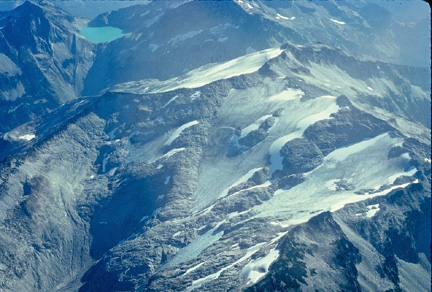
In 1984, as the North Cascade Glacier Climate Project began, the largest concentration of glaciers between Mount Rainier and Glacier Peak was on Mount Daniel-Hinman; Daniels, Foss, Hinman, Ice Worm and Lynch Glacier. Hence, I felt these glaciers were worth monitoring. Now in August 2023, we just finished our 40th annual survey of these glaciers and they have had their worst year yet in terms of mass loss. Each year we ascend the Cathedral Rock trail, hike passed Peggy’s Pond and set up camp to observe the glaciers. The rapid mass loss builds on the last two year leading to dramatic thinning and area loss. Ice Worm Glacier and Hinman Glacier are no longer glaciers. Pelto (2010) developed a forecast model that identified a glacier that retreats and thins not just at the terminus but even on the upper glacier, does not have a consistent accumulation zone and cannot survive. Foss Glacier may not survive the summer. Daniels Glacier is rapidly shrinking. Only Lynch Glacier remains active. This is the story of the glacier’s decline and the impact.

In 1958 these five glaciers had a combined area of 3.8 km². In 1984 the area was 3.2 km², in 2009 the area had declined to 1.5 km², and 0.8 km² in 2023. This is an 80% decline since 1958 and ~a 50% decline since 2009. This area loss is driven by mass balance losses. We measure the mass balance annually on Daniels, Ice Worm and Lynch Glacier from 1984-2023, and on Foss Glacier 1984-2005.  From 1984-2022 mean annual balance averaged -0.6 m w.e., a cumulative loss of 21.3 m w.e.. The mass balance losses have driven the reduction in glacier area. In recent years, the mass losses have been consistent and greater than the long term mean at –1.20 m w.e. annually.  This summer is not complete but will finish close to -3 m in a single year.

On Ice Worm Glacier the retreat of the top of the glacier has been faster than the terminus of the glacier. This summer we observed a dozen holes that reached the bottom of the glacier 4-6 m below, indicating how thin the ice is. There is no movement, the size and thickness are too low to generate future movement, hence this is no longer a glacier. A glacier is a body of snow and ice that is moving, this requires a persistent thickness of 20-30 m, which is typically associated with snow/ice areas of ~50,000 m² or larger. As a glacier becomes thinner or smaller than this movement will not be sustained.

Hinman Glacier crossed that threshold either in summer 2021 or 2022 with no patch of ice exceeding 30,000 m². This had been the largest glacier in the region, but had no avalanche accumulation to supplement.

Daniels Glacier has a long terminus section that leads to rapid area loss with even a retreat of 20 m. This year the lowest 20% of the glacier is quite thin and much of this likely will melt out in the coming month. For the first time ever in our 40 years of observation there is no significant retained snow in early August. Glacier length has been reduced by 60% since our monitoring began.

Lynch Glacier had filled Pea Soup Lake basin until the late 1970’s. After its rapid retreat exposed this beautiful new lake, the glacier retreated slowly at its terminus. However, the entire western third of the glacier is nearly gone, even up to the ridge top. This illustrates again that retreat does not always of the terminus.

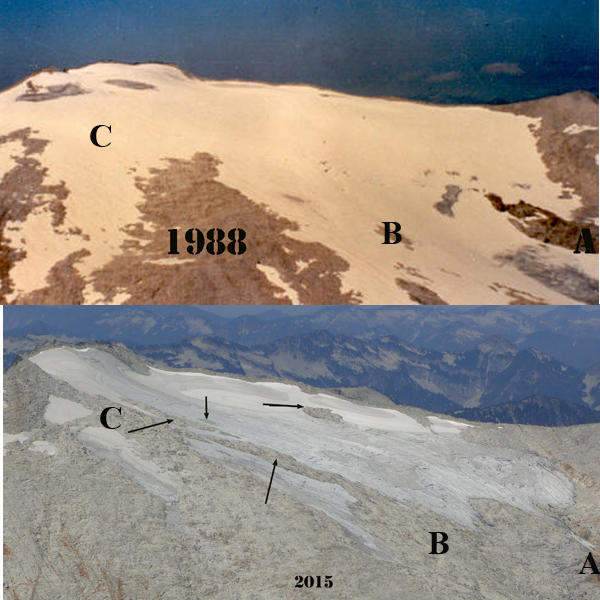
Foss Glacier was a large slope glacier filling the northeast face of Mount Hinman in the 1980s. By 2005, the glacier had retreated exposing two new alpine lakes and was clearly on the path of Hinman Glacier. Fragmentation began in 2015 and has accelerated during the 2021-2023 period. This will no longer be a glacier either later this year or next year.

daniels-glacier-2022-2023

Daniels Glacier in 2023, less than 50% remaining from 1984. The glacier terminus has retreated 700 m, with the longest glacier section now at 450 m. Daniels Glacier on Aug. 14 2022 and Aug. 14 2023. In 2022 a late start to summer preserved snowpack, but summer conditions did not end until Octs. 21. (Jill Pelto, photographs). 

Daniels1990

Daniels Glacier in 1990. This blue ice tongue is now completely gone. 

Daniels 2010 copy

Daniels Glacier indicating change from 1984 to 2010.

ice worm 821u

Ice Worm Glacier in 2013 area 0.08 km², 33% less than in 1984.

ice worm demise

Ice Worm Glacier in 2023 area 0.04 km², 67% decline since 1984 and 50% since 2013.

Ice worm glacier 1984-2023

Ice Worm Glacier comparison Aug. 13 2022 and Aug. 13, 2023. Jill Pelto photographs.

Lynch glacier 1984-2023

Lynch Glacier in 2023 with west side melted out.

foss compare

Foss Glacier covered the northeast slope of Mount Hinman in 1988 and by 2015 was only 50% of the  1984 size.

DSC05998

Foss Glacier in 2023, it is not some thin rapidly fragmenting sections of ice covering 0.14 km².

hinman glacier

Hinman Glacier in 1988 four separate ice masses.

Hinman glacier 1958-2022 copy

Hinman Glacier from 1.3 km² in 1958 to 0.04 km² in 2022.

The three largest glaciers on these mountains in 1958 fed the SkykomishRiver supplying 1.5 to 2 m³/sec durng the summer melt season (Pelto, 2011).  This summer we measured melt on these glaciers yielding 25-30% of this level.  The result has been declining flow during late summer low flow periods in the Skykomish River resulting in higher water temperatures. Daniels and Ice Worm Glacier feed the Cle Elum River, whose reservoir is an important resource for irrigation in the Yakima Basin. A key threshold of in-stream flow levels considered insufficient to maintain short term survival of fish stocks is below 10% of the mean annual flow. For the Skykomish River at the USGS Gold Bar site 10% of mean annual flow is 14 m3s-1. In the Skykomish River from 1958-2021 there were 344 melt season days with discharge below 14 m3s-1. Of these only 3 occurred before 1985, and 70% have occurred since 2000. Of more concern for aquatic life is the occurrence of extended periods of low flow. From 1929-2023 in the Skykomish River basin there have been 14 years where streamflow dropped below 14 m3s-1 for 10 consecutive days during the melt season, 1986, 1987, 1992, 1998, 2003, 2005, 2006, 2007, 2015, 2017, 2019, 2021, 2022 and 2023. All years occurring during our annual monitoring project, 6 in the last decade. In 2022 this occurred beginning on Sept. 9 after stream temperatures had declined from elevated levels. In 2023 flow dropped below this threshold on Aug. 13 and remains below this threshold coinciding with high water temperatures.

The Skykomish River was listed as impaired for temperature in a 2008 303(d) listing.  Several segments of the Skykomish River as well as its tributaries consistently exceed water quality temperature standards (King et al 2013). During select summer periods from 2001-2006, temperature monitoring in the Skykomish River at Monroe indicated that the average 7-Day maximum frequently exceeded the 16°C criteria between July and September in 2001-2006 (King et al 2013).

A water temperature sensor became operational in early July 2022 at the USGS Gold Bar site. The temperature exceeded 18oC for the first time on July 27. It surpassed 18oC diurnally on most days from July 27-September 7, 37 of 42 days. The TMDL for the Skykomish River indicates the maximum temperature should not exceed 16oC for 7 consecutive days. In 2022 16oC was exceeded continuously from July 26th-August 4th, August 14th-August 28th, and August 29th-September 4th. In 2023 the 16°C threshold was exceeded from July 28-Aug. 21. The reduced late summer glacier flow has reduced the ability of these ice masses to buffer both temperature and discharge during droughts. This same process has been observed in the Nooksack River (Pelto et al 2022).

The impact of glacier loss is not the only reason for declining streamflow, but it is a significant reason. The loss of glacier ice is thus causing issues that extend all the way to Puget Sound or the Columbia River system.

skybasemap

Skykomish River Basin, GB=Gold Bar, blue arrows indicate glaciers 1=Columbia, 2=Hinman, 3=Foss and 4=Lynch.

skykomish flow 2022

Temperature and discharge observations at the USGS Gold Bar site in late summer 2022.

skykomish 2023 temp and discharge

Temperature and discharge observations at the USGS Gold Bar site in late summer 2023.

Hall Peninsula Ice Cap, Baffin Island Retains No Snowcover in 2023 Fosters Fragmentation

Hall Peninsula Ice Cap east of Popham Bay is snow free on 8-14-2023. Comparison of Landsat images from 2014 and 2023 arrows indicate four locations where the ice cap is fragmenting and at each Point D is an emerging/expanding bedrock area amidst the ice cap.

Hall Peninsula is host to many glaciers and ice caps, almost all unnamed. Here we examine the largest ice cap on the Peninsula using Landsat and Sentinel images. This ice cap is shrinking like Grinnell Ice Cap and Terra Nivea Ice Cap due to limited retained snowcover most years.

The center of the ice cap is just over 1000 m in elevation. By early August in 2023 the ice cap had lost all snowcover. The emergence and expansion of a dozen bedrock areas amidst the ice cap indicates the ice cap is thinning across most of its extent. At Arrow C and E the ice cap has fragmented. At Arrow A and B the fragmentation is nearly complete. Given the lack of any retained snowcover in several recent years, this ice cap will not survive current climate conditions.

Hall Peninsula Ice Cap on 8-6-2023 in Sentinel images. Arrows indicate locations of fragmentation. Point D marks expanding bedrock areas amidst the ice cap.

40th Field Season of North Cascade Glacier Climate Project Underway

Illustration by Megan Pelto of key numbers behind what it takes to undertake a 40 year field study on glaciers.

For the 40th consecutive summer the North Cascade Glacier Climate Project is heading into the field to measure and communicate the impact of climate change on North Cascade glaciers. This field season follows the 2021 and 2022 seasons that featured a historic heat wave and periods of extended warm weather. The heat led to a greater exposure of bare ice on glaciers, particularly at higher elevations. For ice surfaces with a higher albedo and greater density the observed melt rates are 7-9 cm per day water equivalent during warm weather events vs 4-6 for snow surfaces. This led to substantial mass losses on North Cascade glacier for the two years of -2.5 m. Winter snowpack in the North Cascades in 2023 was 80-90% of normal on April 1 and May 1.

Science objectives: We will complete detailed measurements on 10 glaciers, three of which are part of the World Glacier Monitoring Service reference glacier network (42 glaciers globally), which have 30+ consecutive years of mass balance observations. This summer we will have an opportunity to assess the long-term ramifications of the 2021 and 2022 summers and measure the response of glaciers to the weather of 2023 with detailed mass balance, crevasse depths and glacier surface elevation profiling.

Art Objectives: We will collaborate with several artists who will join us for a portion of the field season. They will be able to create their own work about the landscape and the science or may join us for fieldwork and make plans for future artwork. Potential artists include painters, a podcast creator, a photographer, and a printmaker. We hope to use this art to share our research with a broader audience and highlight the beauty and importance of these places.

Communication Objectives: We are seeking expedition sponsors this year with brands who have a climate change focus. These organizations can help spread our message; we have two so far. We are looking to support the production of podcasts as well.

Terminus change at two World Glacier Monitoring Service reference glaciers. Columbia and Eastson Glacier. 

Field Team 2023:

Jill Pelto  (she/her)is an artist and scientist from New England who grew up loving winter sports and trips to the mountains. She incorporates scientific research and data into paintings and prints to communicate environmental changes. Her multi-disciplinary work weaves visual narratives that reveal the reality of human impacts on this planet. She completed both her B.A. degrees in Studio Art and Earth and Climate Science, and her M.S. focused on studying the stability of the Antarctic Ice Sheet at the University of Maine, spending two field seasons at a remote camp in the southern Transantarctic Mountains. Jill will be joining the project for her 15th field season. She is excited about continuing to document the change in North Cascade glaciers that she has witnessed each of the last ten years — through science and art.

Painting by Jill Pelto that incorporates mass balance data from NCGCP from 1983-2022 along the top of the glacier.

Mauri Pelto (he/him) has directed the project since its founding in 1984, spending more than 800 nights camped out adjacent to these glaciers. He is the United States representative to the World Glacier Monitoring Service. For a decade he has been author of the AGU blog “From a Glacier’s Perspective,” and associate editor for three science journals.  He is on the Science Advisory Board for NASA’s Earth Observatory. His primary position is Associate Provost at Nichols College, where he has been a professor since 1989. He either runs on trails or ski’s on trails alpine and cross country everyday.

Mauri Pelto looking at deglaciated envioronment below Easton Glacier

Mariama Dryak-Vallies (she/her) is the Director for the Polar Science Early Career Community Office (PSECCO) hosted by CIRES at University of Colorado Boulder. Mariama grew up on a farm in west-central Wisconsin before earning her B.A. in physical geography and archaeology at Durham University (UK)—where her passion for studying, researching, and teaching about glaciers, climate change, and the natural environment was born. She completed her M.S. in Earth and Climate Sciences at the University of Maine, studying Antarctic glaciology and ice-ocean interactions. During graduate school she was actively involved advocating for polar early career scientists as board member and co-chair of the US Association of Polar Early Career Scientists (USAPECS). Mariama is passionate about working towards building accessible Earth and polar sciences spaces for all.

2018 field team including Jill, Mauri, Mariama and Erin

Kaiyuan Wang (he/himis a recent graduate from McGill University with a B.Sc in Honours Physical Geography, a minor in Geology. Originally from China, he developed an aspiration for Geoscience in the Great White North while living on the former bed of the Laurentide Ice Sheet. His passion for the cryosphere has led him to fieldwork on glaciers in the Kluane National Park in Yukon, Jasper National Park in Alberta, and a glaciological conference in Iceland. He will be doing his Ph.D. in Arctic Hydrology at the Northern Change Research Laboratory at Brown University. Kai is thrilled to be part of the 40-year-long effort of documenting glaciers as a living testimony to a warming world.

Shivaprakash Muruganandham (he/him) is currently a PhD candidate in Ocean Science and Engineering at the Georgia Institute of Technology, Atlanta, USA. He is back in school after a few years as a strategy consultant, during which time he specialized in satellites and space applications: earth observation and satellite communications in particular. Prior to this, he graduated with Master’s degrees in Space Technology and Cybernetic Systems/Control. Shiva is fascinated by ice, and his research focus on ice sheet/glacier modeling is motivated by his interests in the downstream impacts of cryosphere-climate interactions on coastal and mountain communities..

Field Partners 2023

Lizz Ultee (she/they) is an Assistant Professor of Earth & Climate Science at Middlebury College, Vermont.  They earned a B.Sc. in mathematical physics at Queen’s University (Canada) and a Ph.D. in climate science at the University of Michigan, specializing in mathematical methods to understand and predict glacier change.  Lizz finds ice endlessly inspiring.  Beyond inspiring, though, glaciers are important for downstream communities — motivating Lizz’s present research focus on glacier contributions to sea-level rise and water resource availability.

Alia Khan’s research team including grad students Sally Vaux, Colby Rand, and Anne Wilce focus on environmental chemistry in the cryosphere, including black carbon and snow algae to document global change of glacier and snow melt in mountainous and polar regions.Western Washington University Cryosphere Studies and Aquatic Biochemistry Lab.

Claire Giordano is an environmental artist, writer, and educator creatively telling the stories of science, climate change, and the modern experience of nature. From creating rain-dappled sketches in an old growth forest to filming a watercolor class beside a glacier, careful observation of nature inspires her goal is to connect people and place through art. In 2021 she founded the Adventure Art Academy – a series of virtual watercolor classes filmed outside – to invite others into the joy of painting outside.

Field study by Claire Giordano, artist in residence with the NCGCP for her 4th year. She creates these incredible pages with notes, paintings, and sketches from her days out exploring the landscape.

Kathleen Shannon is a freelance journalist & radio producer telling science and environmental justice stories across the West. She is based in Missoula and earned a master’s degree in Environmental Science and Natural Resource Journalism from the University of Montana in 2023. Her work has appeared on NPR, in High Country News and elsewhere.

Julia Ditto is a science illustrator from Anchorage, Alaska who specializes in environmental and ecological graphics. Julia spends much of her time recreating in the backcountry, which inspires much of her work. She has always used art as a tool for observing and communicating her experiences, both inand out of the field. She is currently attending CSU Monterey Bay’s Graduate Science Illustration Program.

Who are we? NCGCP was founded in 1983 to identify and communicate the response of North Cascade glaciers to regional climate change. NCGCP is a field project including scientists and artists that has a broad interdisciplinary scope and examines more glaciers than any other program in North America.  We do so cost effectively relying on no permanent camps or helicopter support. The field season includes no days off and each day is spent completing measurements on glaciers.  The focus is on glacier mapping, mass balance measurement, terminus observations, glacier runoff monitoring and capturing the environment with art.  

Why study glaciers in the North Cascades? Glaciers are one of the world’s best climate monitors and are a critical water resource to many populated glaciated regions. This is particularly true in the North Cascades where 700 glaciers yield 200 billion gallons of summer runoff and glaciers have lost 30 % of their area in the last century. This has reduced glacier runoff in late summer in the region as the reduction in glacier area has exceeded the increase in melt rate. During heat waves this role is even more profound with the glacier fed North Fork Nooksack River discharge rising ~24% due to greater melt, while unglaciated South Fork Nooksack River discharge declines by ~20%. The increased discharge limits the rise in river temperature during heat waves to 0.7 C in the North Fork, with the South Fork increasing by 2 C, increasing stress on the salmon in the South Fork (Pelto et al., 2022).
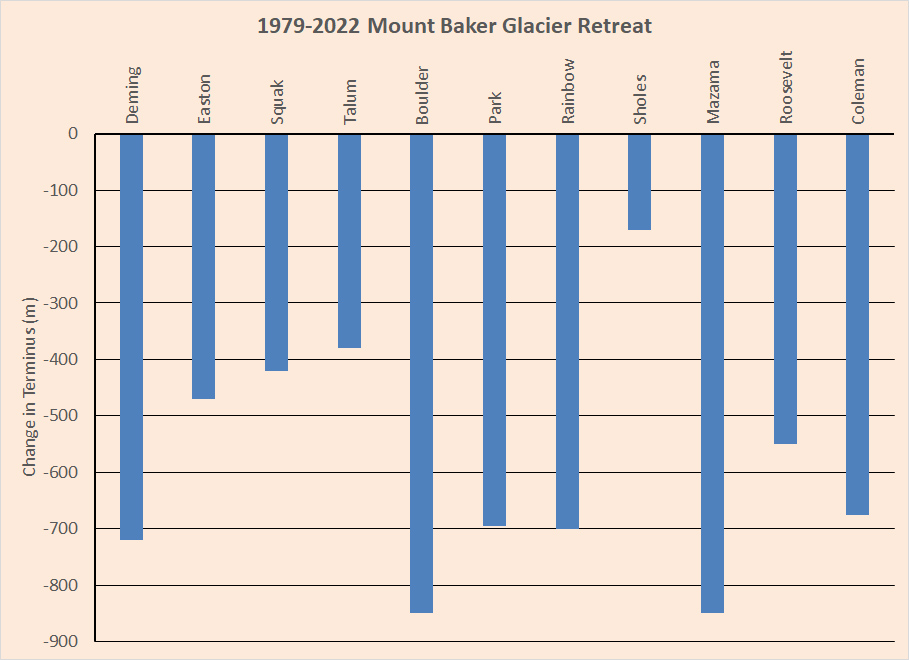
Retreat of Mount Baker glaciers documented by our program

The mass balance record we have compiled since 1984

Summer temperature records from NOAA WA Division 5

Winter Snowpack from North Cascade long term Snotel stations on April 1

Mount Baker Glacier’s Perspective on Climate Change 1984-2022-Disastrous!

Camp above Coleman Glacier on Heliotrope Ridge, (Jill Pelto painting)

Mount Baker is the most glaciated peak and highest mountain in the North Cascade Range at 3286 m.  The Nooksack Indian Tribe refers to this strato volcano as Komo Kulshan, the great white (smoking) watcher. Mount Baker has 12 significant glaciers that covered 42 km2 in 1984 and ranged in elevation from 1320 m to 3250 m.  Kulshan watches over the Nooksack River Watershed, and its flanks are principal water sources for all three branches of this river and Baker River.  In 1984 we began an annual monitoring program of glacier mass balance, terminus position and glacier area on these glaciers. Over the last 40 years we have visited these glaciers every summer observing their response to climate change.

In 1984/85 we visited 11 of the 12 glaciers mapping their terminus position.  All but one had advanced between 1950 and 1975 emplacing an advance moraine.  In the 1980’s as each glacier retreated from this moraine we used these prominent moraines as a benchmarks, as their ice cores have melted and erosion has occurred they have become less prominent. The distance from the typically well preserved, fresh moraines  to the current glacier front has been measured in each case using a laser ranging device with an accuracy of +1m.   In 2009 Mount Baker glacier had declined to 38.5 km² Pelto and Brown (2012). The Randolph Glacier Inventory reported a glacier area of 37 km² in 2015.  In October 2022 an updated area was determined for Mount Baker glaciers at 33.5 km². This represents a decline of 20% in 38 years. Pelto and Brown (2012)  identified a mean annual mass balance loss of -0.52 m/year from 1990-2010 on Mount Baker glaciers. From 2013-2021 the mass loss had more than doubled to -1.30 m/year. Below we review each glacier circling the mountain counter-clockwise

Measurement of glacier retreat from the advanced moraines ~1979 to 2022. We have measured terminus position of these glacier on 130 occassions from 1984-2022.

Easton Glacier from our survey camp  in (2022) above and 2003 (below) illustrating 470 m retreat from 1990-2022.

Change at terminus from August 2022 to August 2023. Image from same location though different orientation area the size of a hockey rink lost all of its ice here.

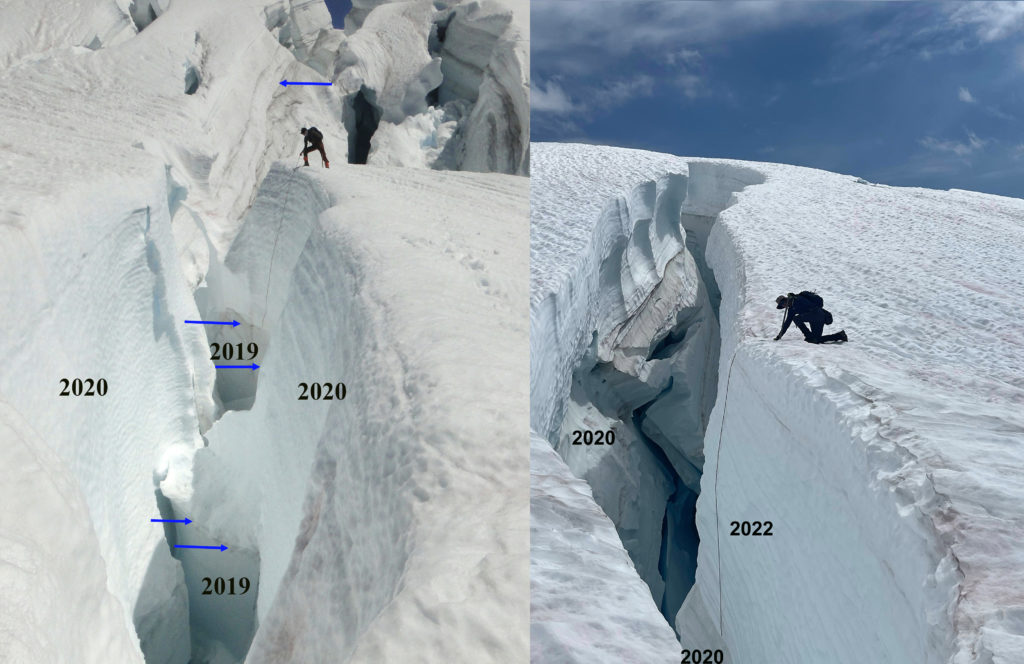
Crevasse measurement of annual snowpack at 2500 m on Easton Glacier comparison of 2019-2022.

Easton Glacier flows down the south side of the mountain and feeds the Baker Lake Hydropower project. We have monitored the mass balance and terminus change of this glacier every year from 1990-2022. This is a World Glacier Monitoring Service reference glacier. In recent years thinning has exposed a few bedrock knobs near 2200 m on the glacier. The glacier has lost 21 m w.e. since 1990 driving a 470 m retreat during this interval. The pace of loss and retreat has been faster since 2013. The typical snowpack retained at the end of the summer has declined from 2.6 to 1.2 m w.e. at 2300 m.

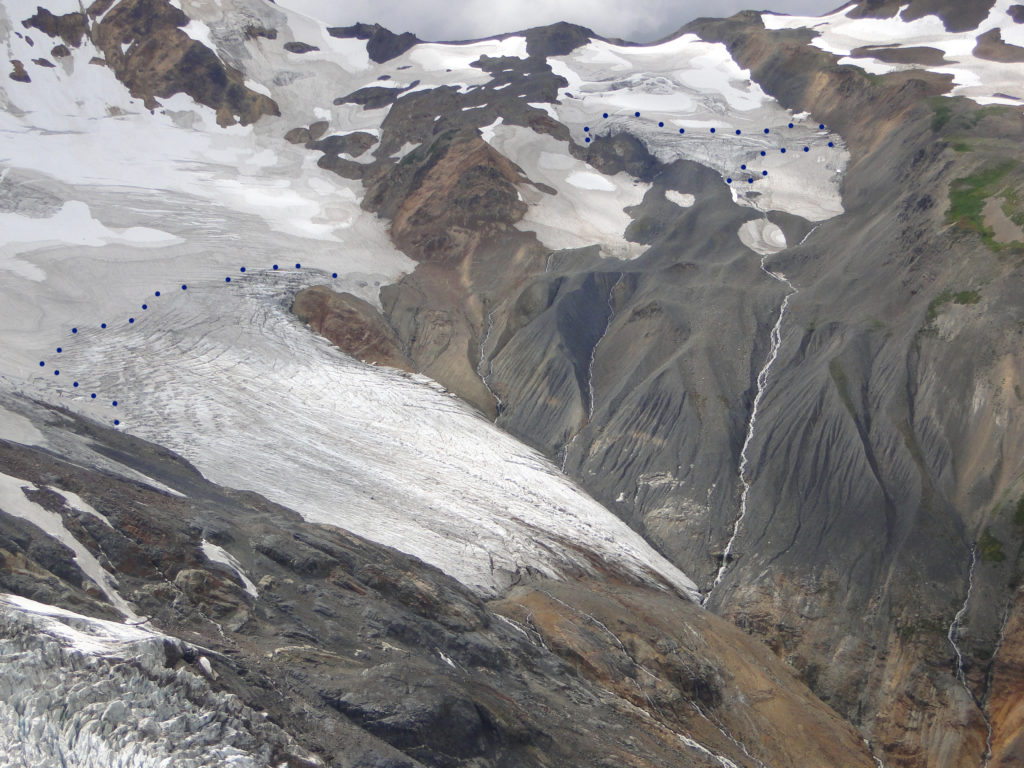
Deming Glacier icefall indicating velocity locations and change in terminus from 1979.

The Deming Glacier drains the southwest side of the summit of Mount Baker a stratovolcano in the North Cascades of Washington, with a massive icefall feeding the lower valley terminus reach of the glacier. The icefall begins at 2200 meters and descends to 1600 meters. The glacier feeds the Middle Fork Nooksack River which provides water supply to Bellingham, WA. Deming Glacier flows from the summit and is the headwaters of the Middle Fork Nooksack River. We observed the terminus of this glacier every year from a survey point and conduct snow depth measurements at 2200 m on the glacier. he NASA Measures ITS_LIVE application uses feature tracking to determine glacier velocity. An examination of velocity change from the top of the icefall to the bottom on Deming Glacier from 2015-2022 indicates deceleration at the three points within or below the icefall, but no change at the top of the icefall.  At the top of the icefall red X velocity has declined ~20%. In the middle of the icefall, green X, velocity has also declined ~20% since 2017. Near the base of the icefall, orange X, velocity has a chaotic signal lacking a clear trend.  Below the icefall at the blue X, velocity has declined by ~20-30%.  The resulting reduction in flux to the terminus will continue the rapid retreat.  Pelto and Brown (2012) measured a 360 m retreat of Deming Glacier from 1979-2009, ~20 m/year. From 1979-2021 the glacier has retreated 725 m, with the rate of retreat from 2009-2021 of ~30 m/year.

Coleman Glacier and Roosevelt Glacier terminus at their maximum size in 1979, photo from Austin Post. Each has receded above the first prominent icefall step indicated by extensive crevassing.

Coleman and Roosevelt Glacier in 2014

In 1984 Coleman Glacier had just completed its advance begun in 1948.  The Roosevelt Glacier on left almost merged with it and Coleman stretched across the Glacier Creek in the valley bottom leaving a prominent moraine that we surveyed retreat from.  The Coleman Glacier has retreated 200 m upslope from Glacier Creek by 1997. Retreat has accelerated with 675 m of retreat from the 1979 moraine to 2022. In 2019 we surveyed the same line across the glacier at 1800 m that we had examined in 1988 and found the glacier had thinned by 38 m in this area.


Coleman Glacier Terminus in 2022.

Roosevelt Glacier retreating to top of bedrock step in 2019.

Roosevelt Glacier is adjacent to Coleman Glaier on the northwest side of Mount Baker. It has followed the same pattern as the Coleman Glacier with less total retreat since 1979 of 550 m.  The glacier in 2022 has retreated above a large bedrock step and has a thin profile that will encourage ongoing rapid retreat.

Mazama Glacier in 2015

Looking up Mazama Glacier from near the saddle with Rainbow Glacier at 2000 m.

Mazama Glacier  flows from the summit down the north side of Mount Baker. The glacier terminates at the head of Wells Creek at 1470 meters. This is a glacier we visit briefly each summer since 1984, but is not a focus of detailed observations. The glacier had a low slope relatively stagnant tongue in 1988 that has led to a rapid retreat of 825 m by 2022. The glacier has a high snow algae region near the Dorr Steamfield.

Sholes Glacier terminus in 2015 with stream gaging location, we calibrated this stream discharge station for the Nooksack Indian Tribe.

Sholes Glacier terminus in 2022 with 1984 terminus location indicated.

Sholes Glacier is on a ridge extending northeast from Mount Baker. We have surveyed mass balance on this glacier each year since 1990. In 2012 in a joint project with the Nooksack Indian Tribe we began summer long monitoring of streamflow below this glacier that has identified the response of glacier melt to heat waves (Pelto et al 2022). The glacier has lost 24.6 m w.e. thickness since 1990 and retreated 170 m, most of that retreat since 2010. Our studies of streamflow indicate how during heat waves glaciers in this basin increase discharge by ~20% and limit water temperature increases (Pelto et al 2022).

Rainbow Glacier terminus in 2014 indicating the 2o14 and 1984 position. Taken by Tom Hammond from Rainbow Ridge.
Rainbow Glacier annual accumulaiton layer thickness in 2013.

Rainbow Glacier is a World Glacier Monitoring Service reference glacier that we have measured the mass balance of each year since 1984.The glacier begins at 2200 m at a saddle with Mazama and Park Glacier and drains the northeast flank of Mount Baker into the headwaters of Rainbow Ceeek and then Baker Lake. The glacier has lost 17.7 m w.e thickness which has driven a retreat of 700 m. The glacier was advancing during our first two years of observations. At the 2000 m saddle with Mazama Glacier the accumulation zone has persisted. The average retained snowpack has declined from 2.7 m to 1.5 m.

Park Glacier Cliffs in 2003

Park Glacier drains the northeast side of Mount Baker’s summit area, meltwater flowing into Baker Lake. Each year we work on the adjacent Rainbow Glacier and during the 1980’s and 1990’s the Park Glacier Cliffs provided a daily sequence of avalanches, the noise echoing across the valleys. By 2010 this occurrence was rare, as the cliffs receded and diminished in height. This accompanied the retreat of the main valley tongue that most of these avalanches had fallen onto.  By 2022 the glacier has receded 690 m from the advance moraine of the 1970’s

Boulder Glacier in 1993 from just below its 1970s advance moraine.

Boulder Glacier from our camp in 2003 illustrating retreat

Debris covered terminus of Boulder Glacier, due to subglacial debris exiting onto glacier surface

Boulder Glacier drains the east side of Mount Baker into Boulder Creek and then Baker Lake. The glacier was advancing rapidly in the 1950s. Our second visit in 1988 revealed a significant retreat underway.  The terminus area of the glacier is debris covered due to subglacial debris flows from the crater exiting onto the glacier surface. This glacier has retreated 850 m retreat from its advance moraine of the 1970’s.

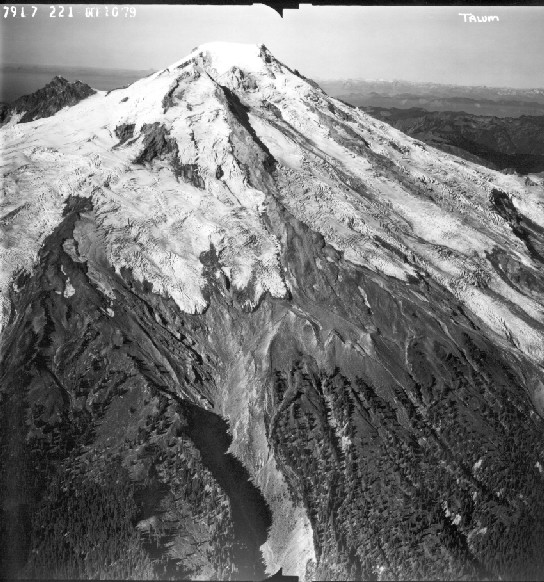
Talum Glacier in 1979 image from Austin Post

Talum Glacier has a wider bottom then top, as it is pinched between the Boulder and Squak Glacier on the east flank of Mount Baker. There are several terminus tongues, which tends to reduce the rate of retreat. Retreat from the advance moraines to 2022 has been 380 m.

Squak Glacier from survey camp in 1990

Squak Glacier from survey camp in 2009

Squak Glacier is adjacent to Easton Glacier on the southeast slope of Mount Baker. This glaciers retreat has been 420 m since 1984 when it was still in contact with its advance moraine. There are several bedrock areas emerging in what was the accumulation zone of the glacier, indicating a substantial expansion of the ablation zone. Thinning of the glacier from 1990-2009 is evident with expansion of ridge between Squak and Talum.

In 2023 we will again be on Mount Baker assessing the ongoing rapid response to climate warming generating glacier thinning and retreat.


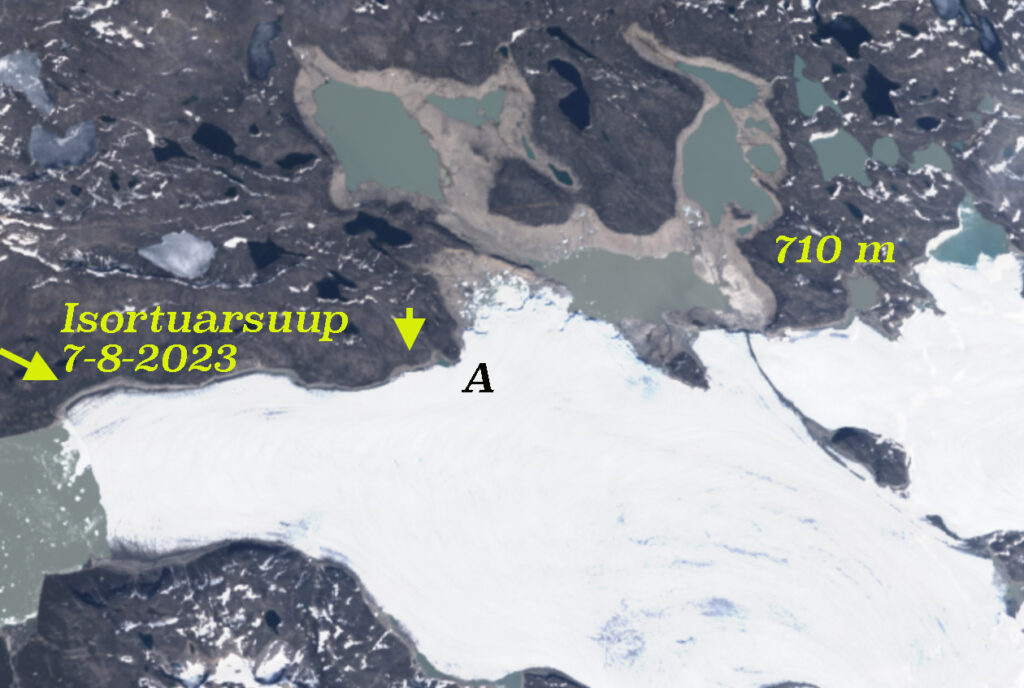
Isortuarsuup Sermia Lake Drainage September 2022

Isortuarsuup Sermia ice dammed lake drains between 9-9-2022 and 9-19-2022. The lake area on 9-9-2022 is 29 km². False color Sentinel images illustrate.

Isortuarsuup Sermia terminates in Isortuarsuup Tasia on the west margin of the Greenland Ice sheet   at 63.8 N  W. The glacier dams a proglacial lake that when full has had an elevation of 710 m, and has been observed to periodically drain from 1937-2011 (Geological Survey of Denmark and Greenland, Bull. 27, 2012). Here we examine the drainage event between Sept. 9 and Sept 19, 2022 that has resulted in a lower than usual drained lake level.

The history of this lakes filling and drainage has been relatively conistent  period of 8-10 years from 1937-2011 (GEUS, 2012). The typical low lake elevation of ~650 m.  The lake drains along a marginal channel on the north side of the glacier into Isortuarsuup Tasia. The lake is dammed at Point A. The lake level during July 2017 was at 660-670 m, during the fill cycle. By July 2021 the lake was essentially full. The lake had an area of ~29 km² from July 2021 through 9-9-2022. A rapid drainage event occurred by 9-19-2022 stranding many icebergs on the lake bottom, reducing lake area to 10 km². There is no remaining lake along the Isortuarsuup Sermia glaciers northern margin, indicating a lower lake level than typical during drainage, ~630-640 m. There is ice at the front of Isortuarsuup Sermia after this event, likely from small bergs draining down the outlet channel. By 7-8-2023 the lake shows no indication of filling in a Landsat image. Given the lower drainage level of this event, will this lake refill as has been its pattern for the last century? How et al (2021) in an inventory of Greenland Ice Sheet proglacial lakes, noted a 75% increase in lake frequency from 1985 to 2017 along the western margin of the Ice Sheet, with a decline in average lake area. This lake may fit that pattern.

Isortuarsuup Sermia on July 22, 2017 with lake level on the rise at ~680-690 m, false color Sentinel image.


Isortuarsuup Sermia on July 8, 2023 with lake level on the rise at ~640 m, Landsat image.

Figure from GEUS Bulletin 27 (2012) of lake 710 m.


Loss of Conrad Glacier, Goat Rocks Wilderness, WA

Conard Glacier looking south across Conrad Lake in 1993. Glacier terminates 193 m from lake.

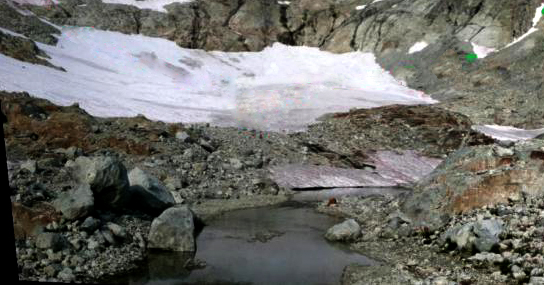
In 1993 we surveyed the glaciers of the Goat Rocks Wilderness, Washington. Conrad Glacier was our main focus, we worked with a field class from Pacific Lutheran University to measure snowpack, area and runoff from the glacier. In 1958 the glacier reached Conrad Lake and had an area of 0.5 km². In 1993 at our first visit the glacier had retreated 193 m from the lake and had an area of 0.25 km². There was no movement on the lower glacier. In 1998 and 2006 we noted continued retreat and thinning with retreat from the lake of 495 m in and an area of 0.16 km² of the largest upper eastern segment. The western upper section had completely separated from the lower western part, and both had separated from the upper eastern segment. In 2015 the USGS inventory indicated an area of 0.13 km² for Conrad Glacier. The area of the largest ice mass  (C1 and C2) had further declined by 2020 to  0.10 km². Summer of 2021 and 2022 were years of exceptional melt from Mount Shasta through southern British Columbia that further reduced the four glacier fragments by October 2022. The largest having an area of less than 0.04 km², too small to qualify as a glacier as this small area does not allow for movement. The combined area of all four fragments is less than 0.1 km². The loss of volume of this glacier parallels that of many North Cascade glaciers we have observed annually for 40 years including glaciers that have disappeared such as Hinman, Lewis, Lyall, Milk Lake and Spider Glacier.

Conrad Glacier in October 2022 false color Sentinel images indicating the four remaining fragments the largest C1 is  less than 0.04 km².


Conrad Glacier in 2020 Google Earth image indicating the fragmentation that has occurred.


Conrad Glacier in 2006 Google Earth image indicating the retreat of the glacier and fragmentation. Glacier now terminates 495 m from lake.

Traversing the lower Conrad Glacier in 1993, notice the low slope of this section that melted away by 2006. The steeper slopes with blue ice are where C1 and C2 developed.

Conrad Glacier in 1958 USGS map when it connected to Conrad Lake.


Baird Glacier, Alaska Retreat Generates Proglacial Lake

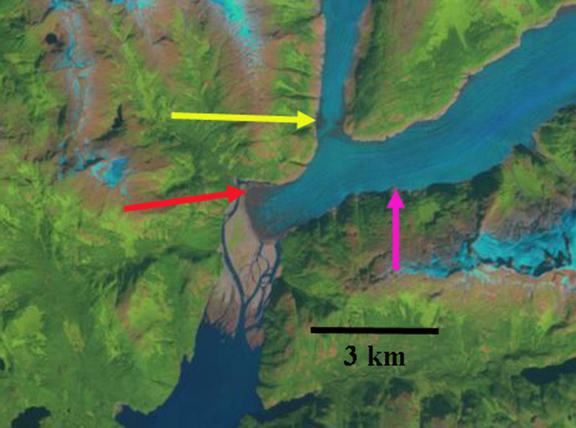
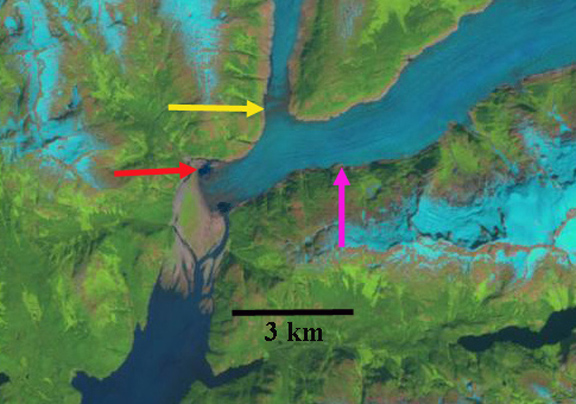
Baird Glacier on 8-11-1990 and 7-6-2023 Landsat images indicating initiaton of retreat and formation of proglacial lake (PGL). The lake is now 3.25 km², retreat has been 2600 m since 1990-yellow dots indicate margin.

Baird Glacier drains the west side of the Stikine Icefield in southeast Alaska. It is the only glacier of the Stikine Iceifield that did not retreat significantly from 1960-2010. Pelto et al (2013) predicted the onset of significant retreat of this glacier, which like Brady Glacier had been slow to begin retreat despite thinning. From 1887 to 1941, the advance totaled ~1 km and from 1941-1980 it advanced ~1 km. The terminus location did not change from 1980-2010. In 1984 I had a closeup look at the terminus from the outwash plain, it was heavily debris covered and lacked crevassing. This indicated a limited velocity, yet the ice was clearly quite thick, and it would take considerable melting to initiate retreat. In this post we examine Landsat images from 1990, 2005, 2013, 2015 and 2023 along with Sentinel images from 2022 and 2023 to identify how the terminus is responding to climate change.

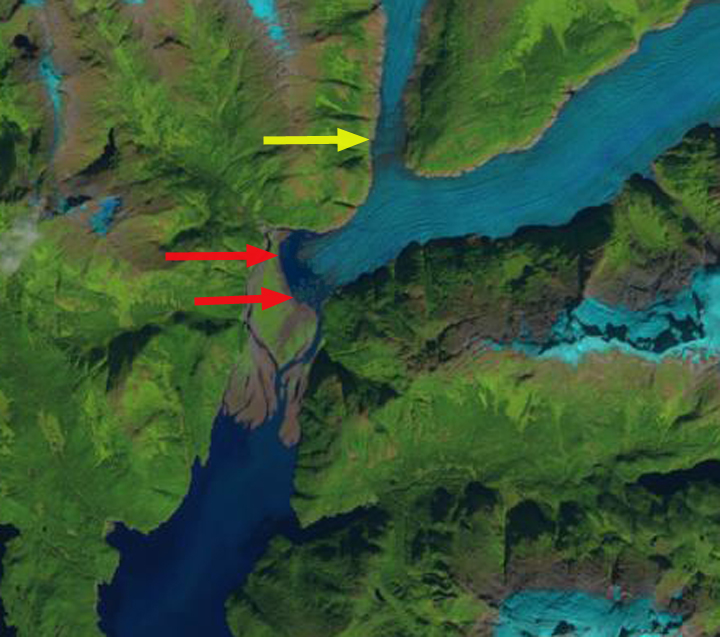
Baird Glacier in false color Sentinel images from July 2022 and July 2023. Proglacial lake (PGL) expanded from 3.00 to 3.25 km² width of tongue extending upvalley toward North Baird Glacier (NB) has declined from 700 m to 400 m.

In 1990 the Baird Glacier was sitting on an outwash plain, with no lake at the terminus. The North Baird Glacier was 1100 meters wide at the yellow arrow, just before joining the Baird Glacier. The main Baird Glacier is 1350 m wide at the pink arrow. By 2005 the North Baird Glacier is 900 m wide at the yellow arrow, and the Baird Glacier 1200 m wide at the pink arrow. The terminus appears unchanged in 2005. By 2013 the North Baird Glacier is just 700 m wide at its junction at the yellow arrow and the Baird Glacier just 1100 m wide at the pink arrow. In 2013 two small marginal lakes have appeared at the terminus, red arrows indicating a measurable retreat, had begun, the lakes are 400-600 m across. By 2015 the glacier has retreated 750 m and the lake has an area of ~1 km².  In 2022 the glacier has retreated leading to a lake expansion to 3.00 km². In July 2023 the tongue of ice extending across the front of the North Baird Glacier valley has thinned 40% since July 2022. This tongue is poised to breakup later this summer or next. The North Baird Glacier is separated by ~1 km from the Baird Glacier. The proglacial lake has an area of 3.25 km2 and the glacier retreat is 2600 m from 1990-2023.
Larsen et al (2007) using repeat laser altimetry note that North Baird Glacier in its lowest 10 km from the junction with Baird Glacier was losing 2 m per year in ice thickness. From 2000-2009 the thinning rate is even higher, with Baird Glacier main trunk losing 10-20 m in thckness in the lowest 20 km Larsen et al (2009)  Baird Glacier is joining the rest of the Stikine Icefield is already in retreat, Dawes GlacierPatterson Glacier and Great Glacier. With Sawyer Glacier retreating from tidewater in 2023.

2005 Landsat image of Baird Glacier indicating terminus still on outwash plain. and the Baird and North Baird Glacier firmly connected.

2013 Landsat image of Baird Glacier indicating terminus still reaches outwash plain, with two new lakes forming. and the Baird and North Baird Glacier still connected.

2015 Landsat image of Baird Glacier indicating terminus no longer reaches outwash plain, with proglacial lake now formed. Baird and North Baird Glacier no longer connected.

Expanding Proglacial Lakes on Land Terminating Margin of Sermeq Kujalleq

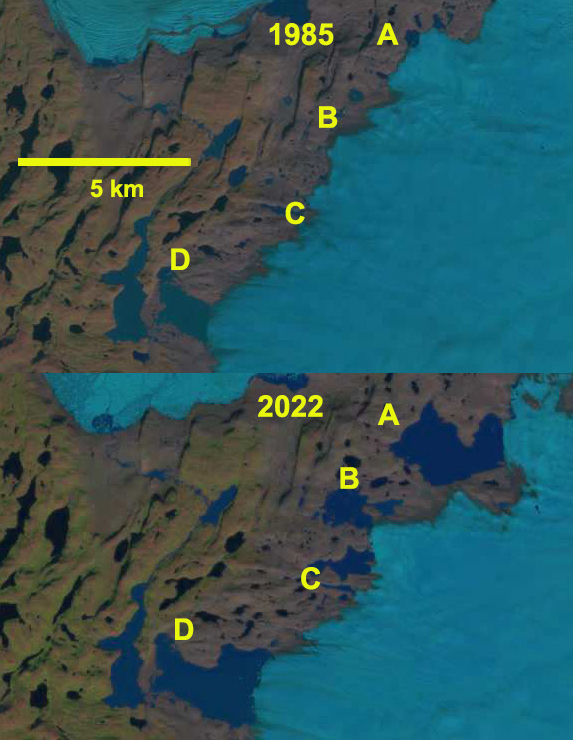
Expansion of proglacial lakes (A-D) along west margin of Greenland Ice Sheet along southern land terminus of Sermeq Kujalleq in 1985 and 2022 Landsat images.

How et al (2021) in an inventory of Greenland Ice Sheet proglacial lakes, noted a 75% increase in lake frequency from 1985 to 2017 along the western margin of the Ice Sheet. In 1985 I had a chance to work on the Sermeq Kujalleq (Jakobshavn Glacier) and observed a few small proglacial lakes along the southern land terminating section of this glacier. At the time we were assessing the volume flux of the glacier, which led us to conclude the glacier was at the time in an equilibrium state (Pelto et al 1989). We were there to map the velocity field before the impacts of climate change kicked in. Here we look at the changes of these lakes from 1985-2022. Image below is from the margin of the glacier a short distance north of Point A, note the prominent trimline in foreground.

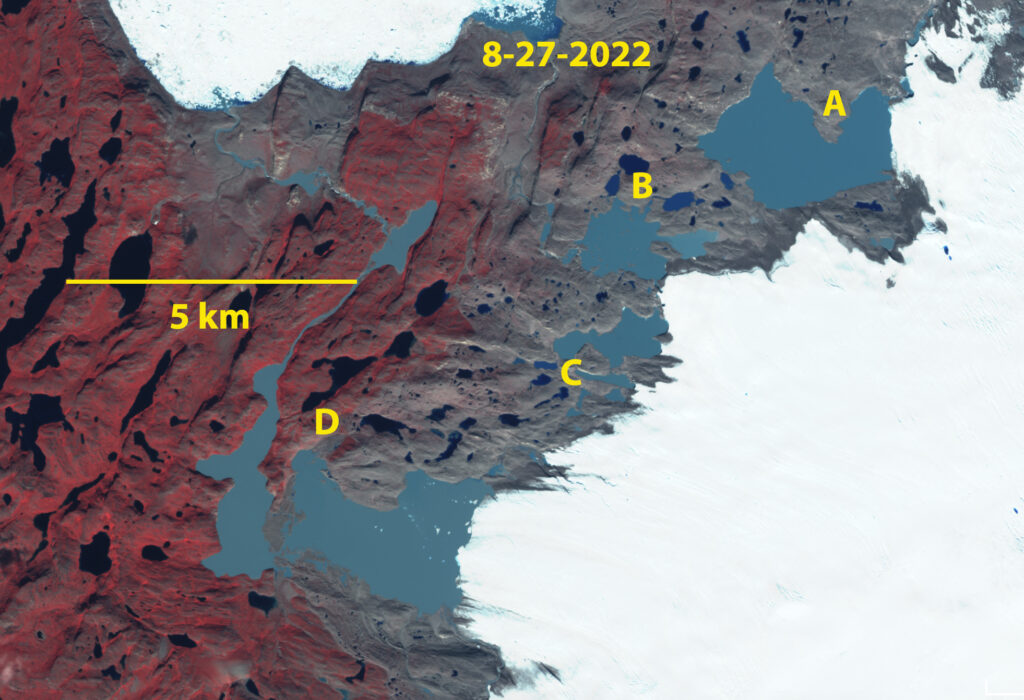
In 1985 Lake B and C did not exist, Lake A=0.4 km² and Lake D=2.2 km². By 2002 as the main glacier accelerated, thinned and retreated Lake B (0.9 km²) and C (0.4 km²) formed while Lake A expanded to 0.6 km² and lake D to 3.2 km². By 2022 this new lake district is still expanding with Lake A at km², Lake B at 1.8 km², Lake C at 1.2 km² and lake D at 5.5 km². The total lake area expanded from 2.6 km² to 13.5 km² , a 425% area expansion. Lake A and D are poised to continue expanding, while Lake B and C look to be near maximum size. This region of numerous small lakes being formed by glacial retreat, reminds me of what the  Boundary Waters region along the Minnesota/Ontario border or  Mikkeli region of Finland  would have looked liked as ice sheet retreat occured. Some of these lakes could drain away with continued retreat.

Expansion of proglacial lakes (A-D) along west margin of Greenland Ice Sheet along southern land terminus of Sermeq Kujalleq in 2002 and 2022 Landsat images.

Margin of glacier in 1985 a short distance from Point A. Note trimline of recent deglaciated terrain in foreground.

Proglacial lakes (A-D) along west margin of Greenland Ice Sheet along southern land terminus of Sermeq Kujalleq in 8-27-2022 false color Sentinel images.

Rodman Glacier, Alaska Retreat Expands Lake Ustay

Rodman Glacier in Landsat images from 1987 to 2021 indicating 1987 terminus=red arrow, A=Akwe Lake, U=Ustay Lake, B=glacier base exposed,  C=expanding nunatak

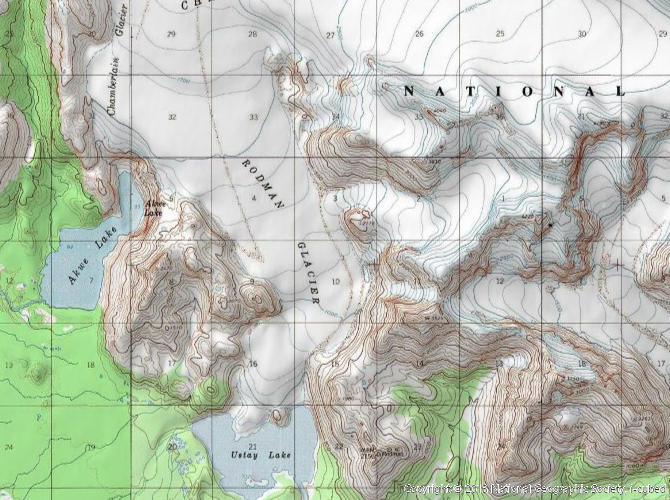
Rodman Glacier flows south from the Brabazon Range ending in Ustay Lake at the margin of the Yakutat Foreland. In the 1906 International Boundary Commission survey of the region Ustay Lake does not yet exist, Akwe Lake has just started to form with the terminus ending in it named Chamberlain Glacier. Chamberlain Glacier was a distributary terminus from Rodman Glacier and by 1948, the thinning Rodman Glacier no longer generated this second terminus. In the 1950’s the glacier terminated on an island in Ustay Lake. By 1968 Austin Post indicated that it had retreated 1400 to 2000 m from its maxiuum Little Ice Age position, but was still grounded on the island.

In 1987 the glacier had retreated 200 m from the island. In 2021 the glacier had retreated 800 m from the island. A slow retreat compared to nearby Yakutat Glacier, 21 km since 1906 and 10+ km since 1987) or East Novatak Glacier (2.75 km snce 1987). By Sept. 2022 the glacier had developed a 1 km long 0.4 km² terminus tongue that has significant rifts and will break up in the next year or two. This condition persists into June 2023. The glacier has also developed a significant area of 1.25 km² around Point B where bedrock is exposed in Sept. 2022 and an occasional glacial lake forms filling part of the basin such as in June 2023. At Point C an expanding nunatak indicates extensive thinning up to 800-900 m on this glacier.

.

Rodman Glacier in Sept. 2022 and June 2023 Sentinel Images indicating the terminus tongue with open water on both sides that is poised to breakup, yellow arrows. At Point B is an expanding area of bedrock in Sept. 2022 that is partially water filled in June 2023.

Rodman Glacier in 1950’s topographic map no Island yet in Ustay Lake.

Terra Nivea Ice Cap Expanding Bedrock Outcrops and Proglacial Lakes

Terra Nivea Ice Cap in Sentinel false color images from 2017 and 2022. Point A=bedrock outcrops expanding. Point L=expanding proglacial lakes. Red arrow=supraglacial stream chanels, yellow arrow=annual layers, green arrow=location where ice cap will separate.

Terra Nivea Ice Cap is the southern most Ice Cap in North America, on the Terra Incognita Peninsula of Baffin Island. Mercer (1956) noted that the ice cap accumulation during most years was via superimposed ice, though some years snow did endure at the top of the ice cap. Paspodoro et al (2015) observed a 34% reduction in ice cap area from 1958-2014 with an acceleration after 2007. Here we note a lack of retained snow, firn or superimposed ice on the northern portion of the ice cap in 2017 and 2022. The lack of retained accumulation as snow or ice results in rapid thinning that is leading to bedrock expansion within and at the margin of the ice cap and the expansion of peripheral proglacial lakes.

Point A marks specific locations where bedrock areas amidst the ice cap are expanding. This expansion will lead to separation of the ice cap at the green arrows soon. The ice cap was 1.9 km wide at this point in 2017 and 1.5 km in 2022. Point L marks locatsions of proglacial lake expansion. The yellow arrows indicate annual layers even at the summit area, which would not be visible if superimposed ice was forming. The red arrows indicate supraglacial stream channel that lead all the way to the summit region. For an ice cap retaiining firn or superimposed ice, the channels would begin below that margin. This illustrates that during the the 2017-2022 there was no retained accumulation on Terra Nivea Ice Cap. This is true of the rest of the ice cap as well. Here in order to better visualize change, the focus is just on the northern portion.

This same story is playing out on Grinnell Ice Cap.

Terra Nivea Ice Cap in Sentinel false color images from 2017 and 2022 illustraing separation region. Point A=bedrock outcrops expanding. Point L=expanding proglacial lakes.  Green arrow=location where ice cap will separate.