Pyramid and Van Trump Glacier, Mount Rainier No Longer Glaciers-Thresholds Leading to Glacier Loss

Screenshot

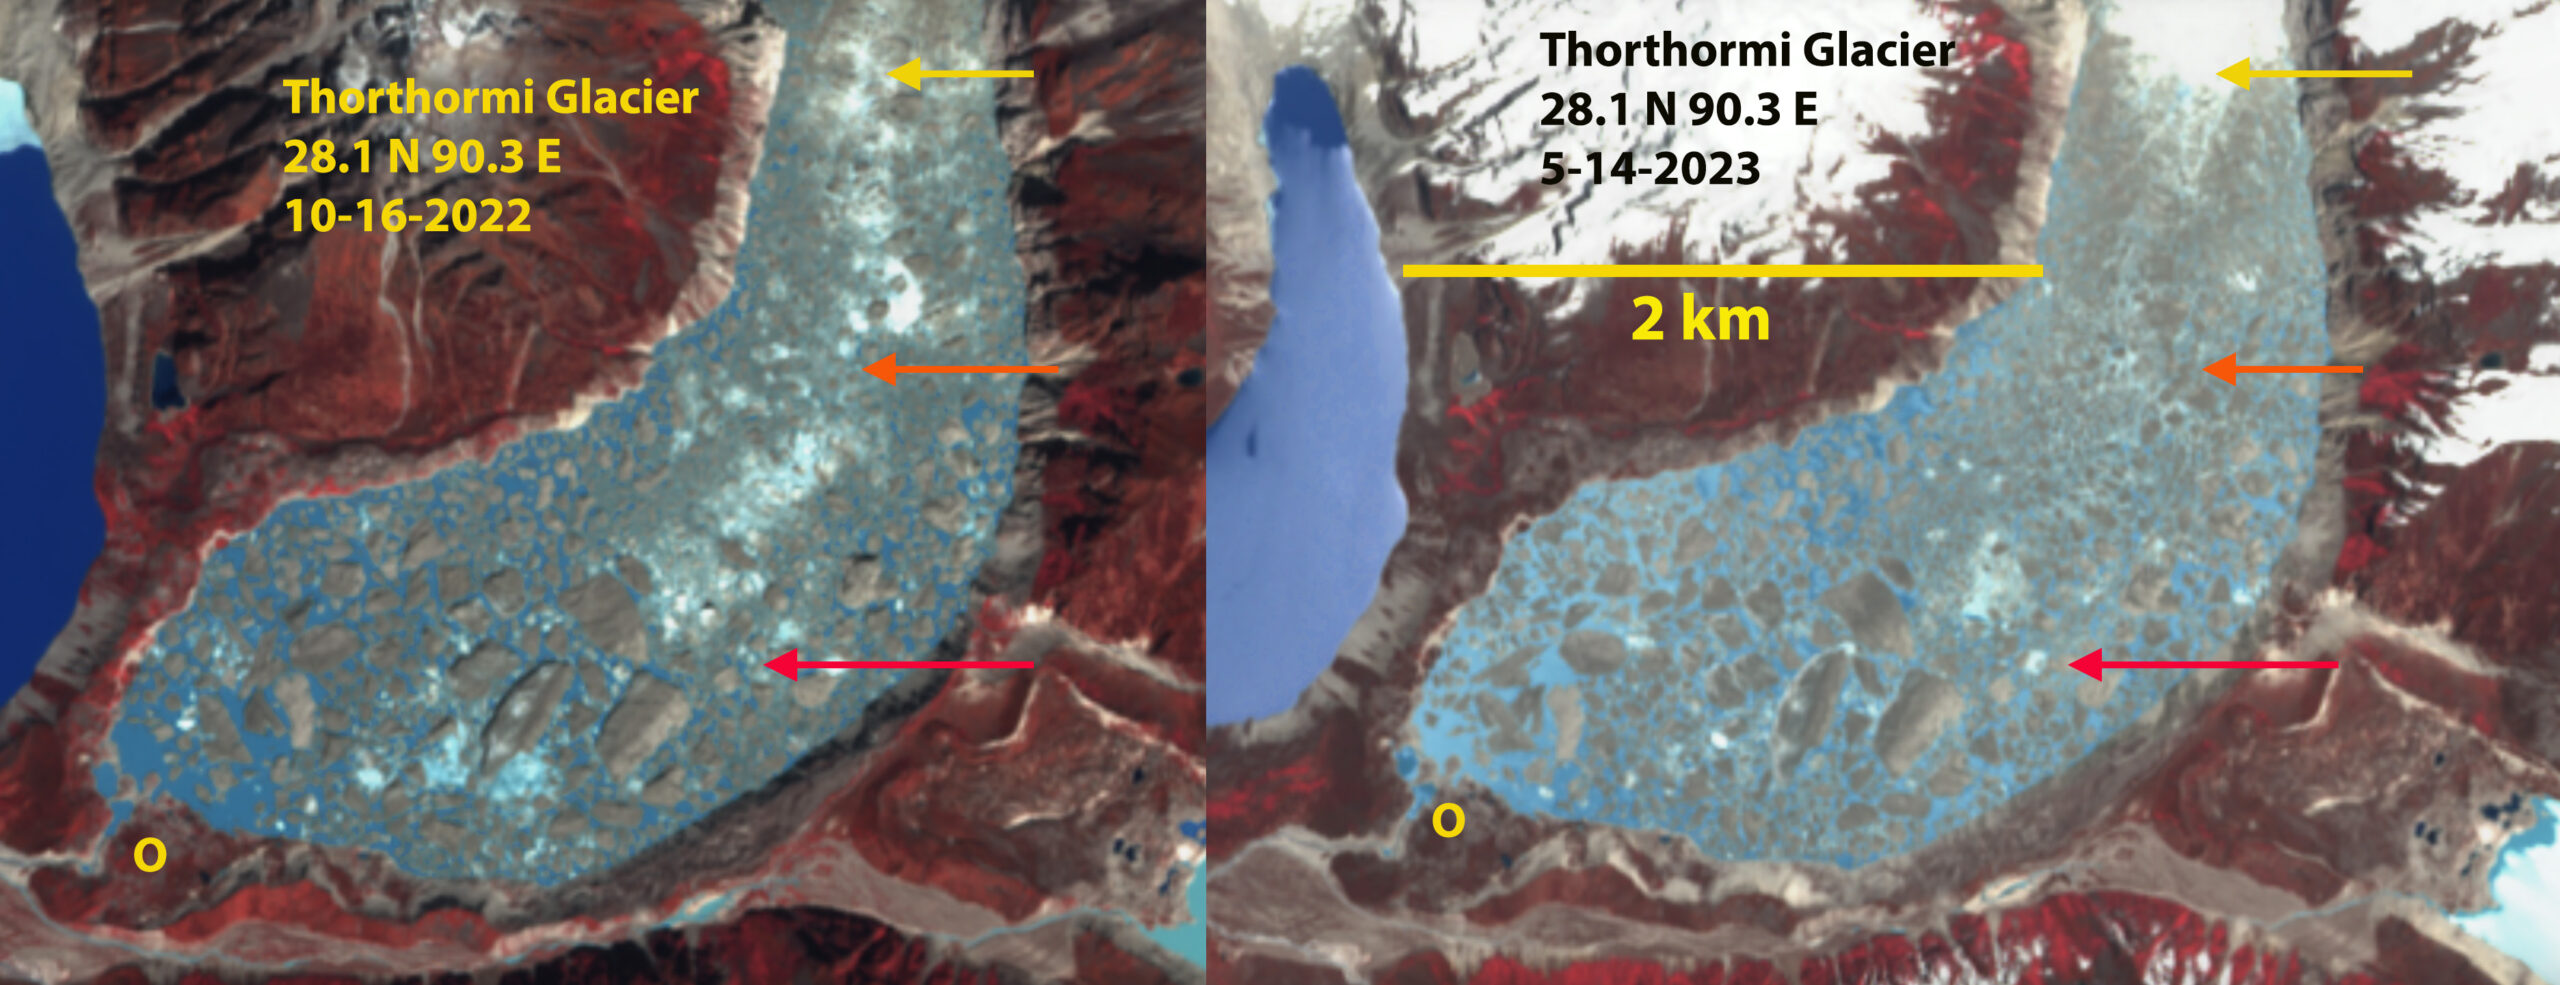
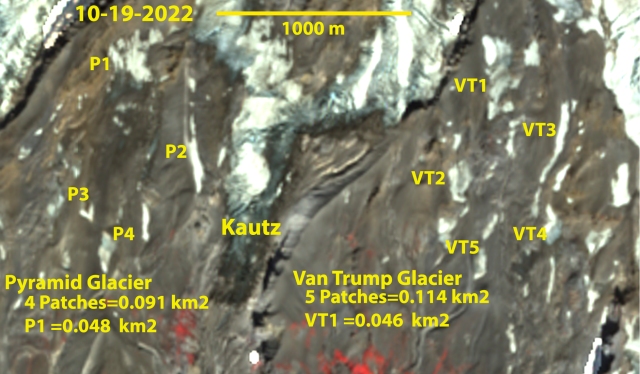
Van Trump (VT)  and Pyramid (P) Snowfields Oct. 19, 2022 false color Sentinel image. VT1 and P1 are the largest at ~0.046 and 0.048 km² respectively.

Scott Beason, Taylor Kenyon, Rob Jost and Lauren Walker (2023) provide an excellent record of glacier extent change on Mount Rainier Glaciers for the 1896-2021 period. They note a 41.6% reduction in Mount Rainier glacier area during this 125 year period. This study identified Stevens Glacier as no longer existing as of Sept,. 2021. They also note that Pyramid and Van Trump Glacier are in serious peril having lost 33% of their area from 2015-2021. For Van Trump they mapped the combined area of six separate snow/ice areas at 0.117 km² (Beason et al 2023). For Pyramid they mapped the combined area of eight separate snow/ice areas at 0.176 km² (Beason et al 2023).

The summer of 2021 and 2022 both led to substantial mass losses in the Cascade Range, with many glaciers losing all snowcover. The typical minimum size threshold for a glacier is 0.1 km², with areas smaller than this to small to generate the ice motion that identifies a glacier from a perennial snowfield. On October 19, 2022 it is evident that there is no single ice mass/patch with an area of more than 0.05 km² for Pyramid or Van Trump Glacier. The collective five primary pathces of Van Trump combined = 0.114 km² and four on Pyramid Glacier combined=0.91 km². Smaller patches (crumbs) that add up to the minimum threshold as in this case, cannot be put together to qualify these as glaciers (cookies). Hence, it is evident that Van Trump and Pyramid Glacier as of 2022 do not meet the threshold to be glaciers. In the North Cascade Range I have witnessed a number of glaciers disappear including Hinman, Lewis, Lyall, Milk Lake, Snow Creek and Spider Glacier. This led to the identification of three key thresholds that lead to glacier loss.

van trump map-2019
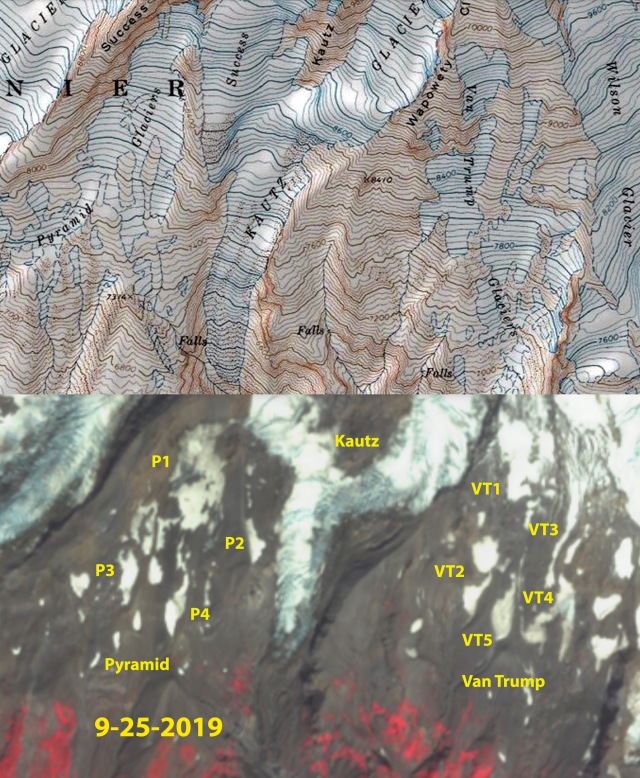
Van Trump (VT)  and Pyramid (P) Snowfields  Sept. 25, 2019 false color Sentinel image, with USGS map above.

Threshold 1-Disquilibrium Response

Glaciers respond to climate in an attempt to achieve equilibrium. A glacier advances due to a climate cooling/snowfall increase that causes positive mass balance.  A climate warming/snowfall decrease leads to negative mass balances and glacier retreat. To reestablish equilibrium a retreating glacier must lose enough of its highest ablating sections, usually at the lowest elevations, so that accumulating snows in the near the head of the glacier once again are equivalent to overall ablation, and an equilibrium balance is approached. This is the expected response for glaciers.

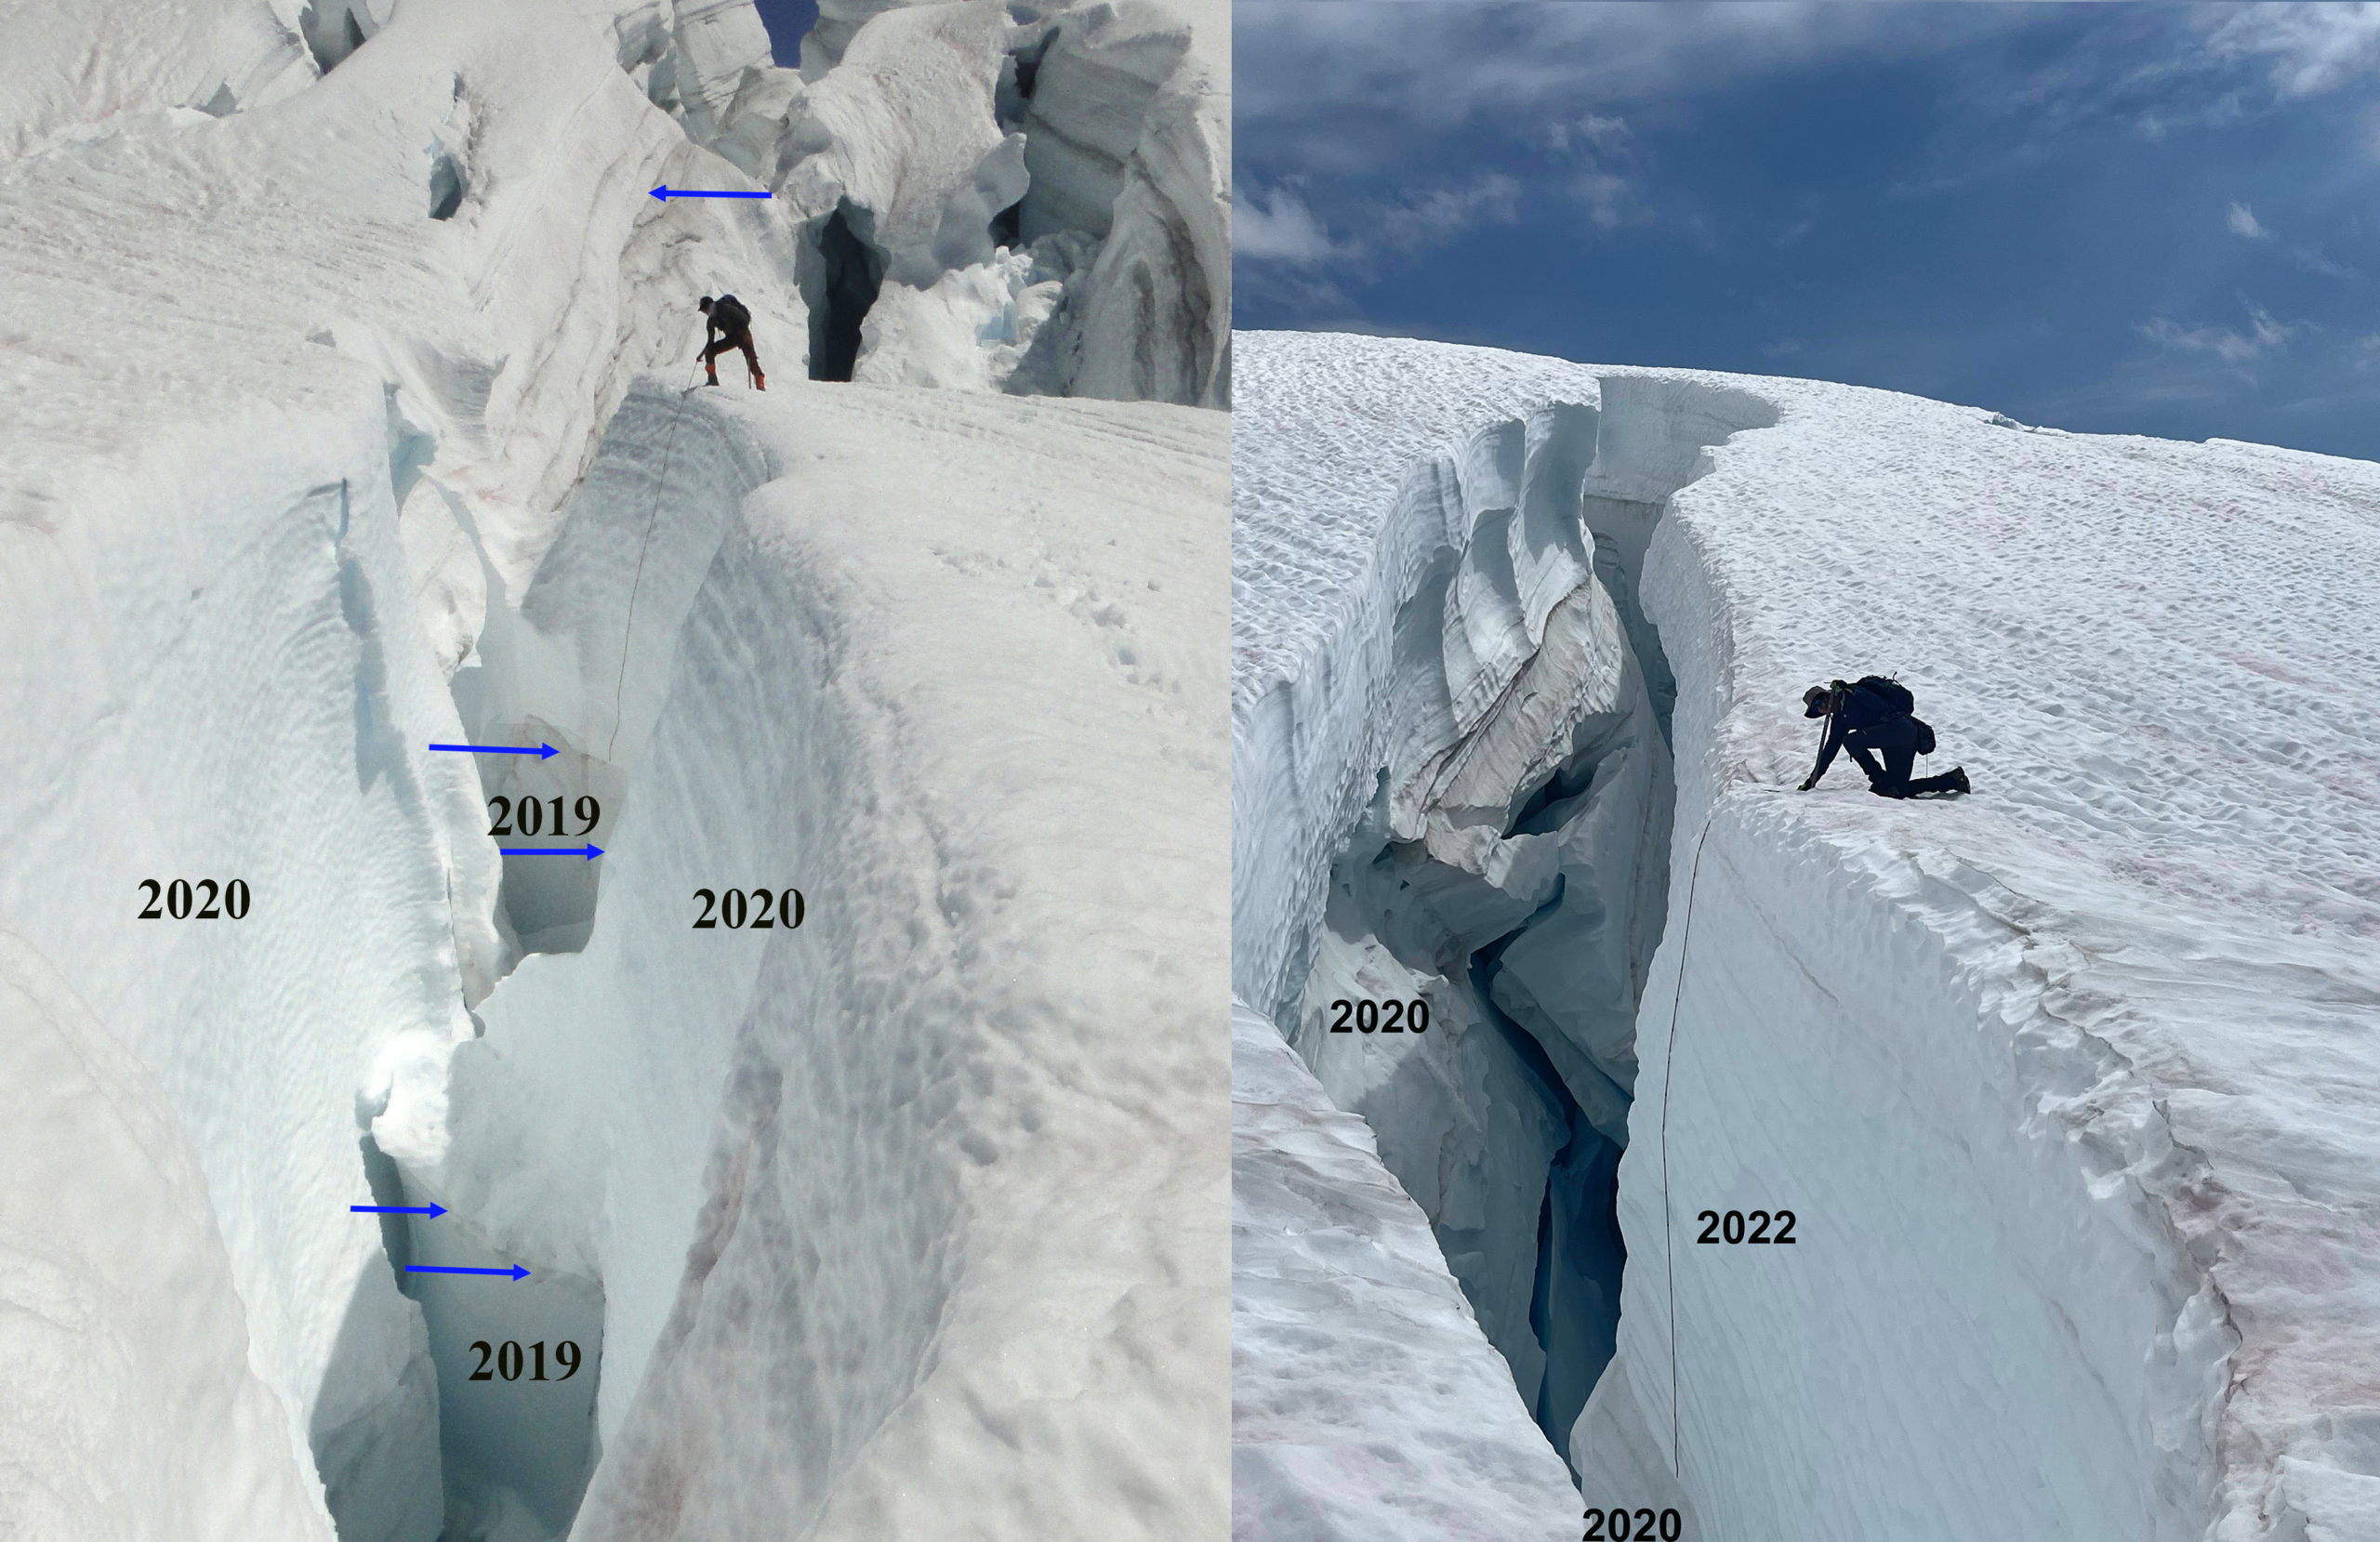
From 1984-2022 I have worked annually in the field on North Cascade glaciers monitoring their resonse to climate change.  By 2005 it was apparent that many of the glaciers were experiencing a disequilibrium response, and were not able to reestablish equilibrium through retreat.  This was not what I had expected in 1984, but in 2005 the disappearance of Lewis, Milk Lake and Spider Glacier had forced me to develop this model (Pelto, 2006). A glacier that is in disequilibrium with present climate will melt away with a continuation of this climate, because it cannot retreat to a point where it is sustaining. A key trait of a glacier in disequilibrium is when the glacier is experiencin significant thinning from the terminus through the accumulation zone.

Foss 2022

Foss Glacier, North Cascades with bedrock emerging as glacier thins and fragments even near the top of the glacier.

colonial 2006w

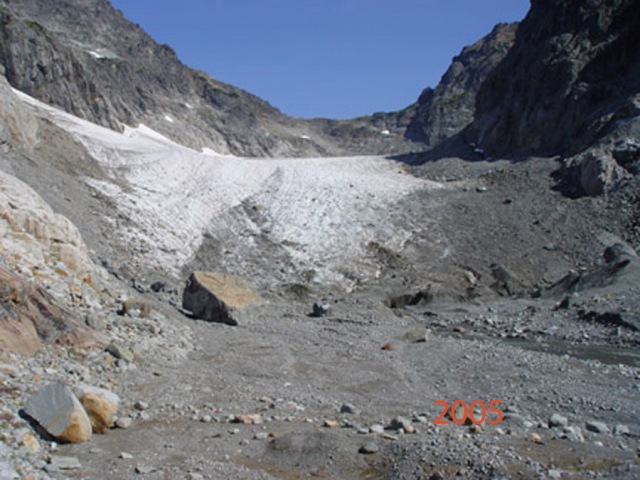
Rapid area loss of Colonial Glacier, North Cascades not just at the terminus but also at the top of the glacier.

Threshold 2-Accumulation Zone Lacks Persistence

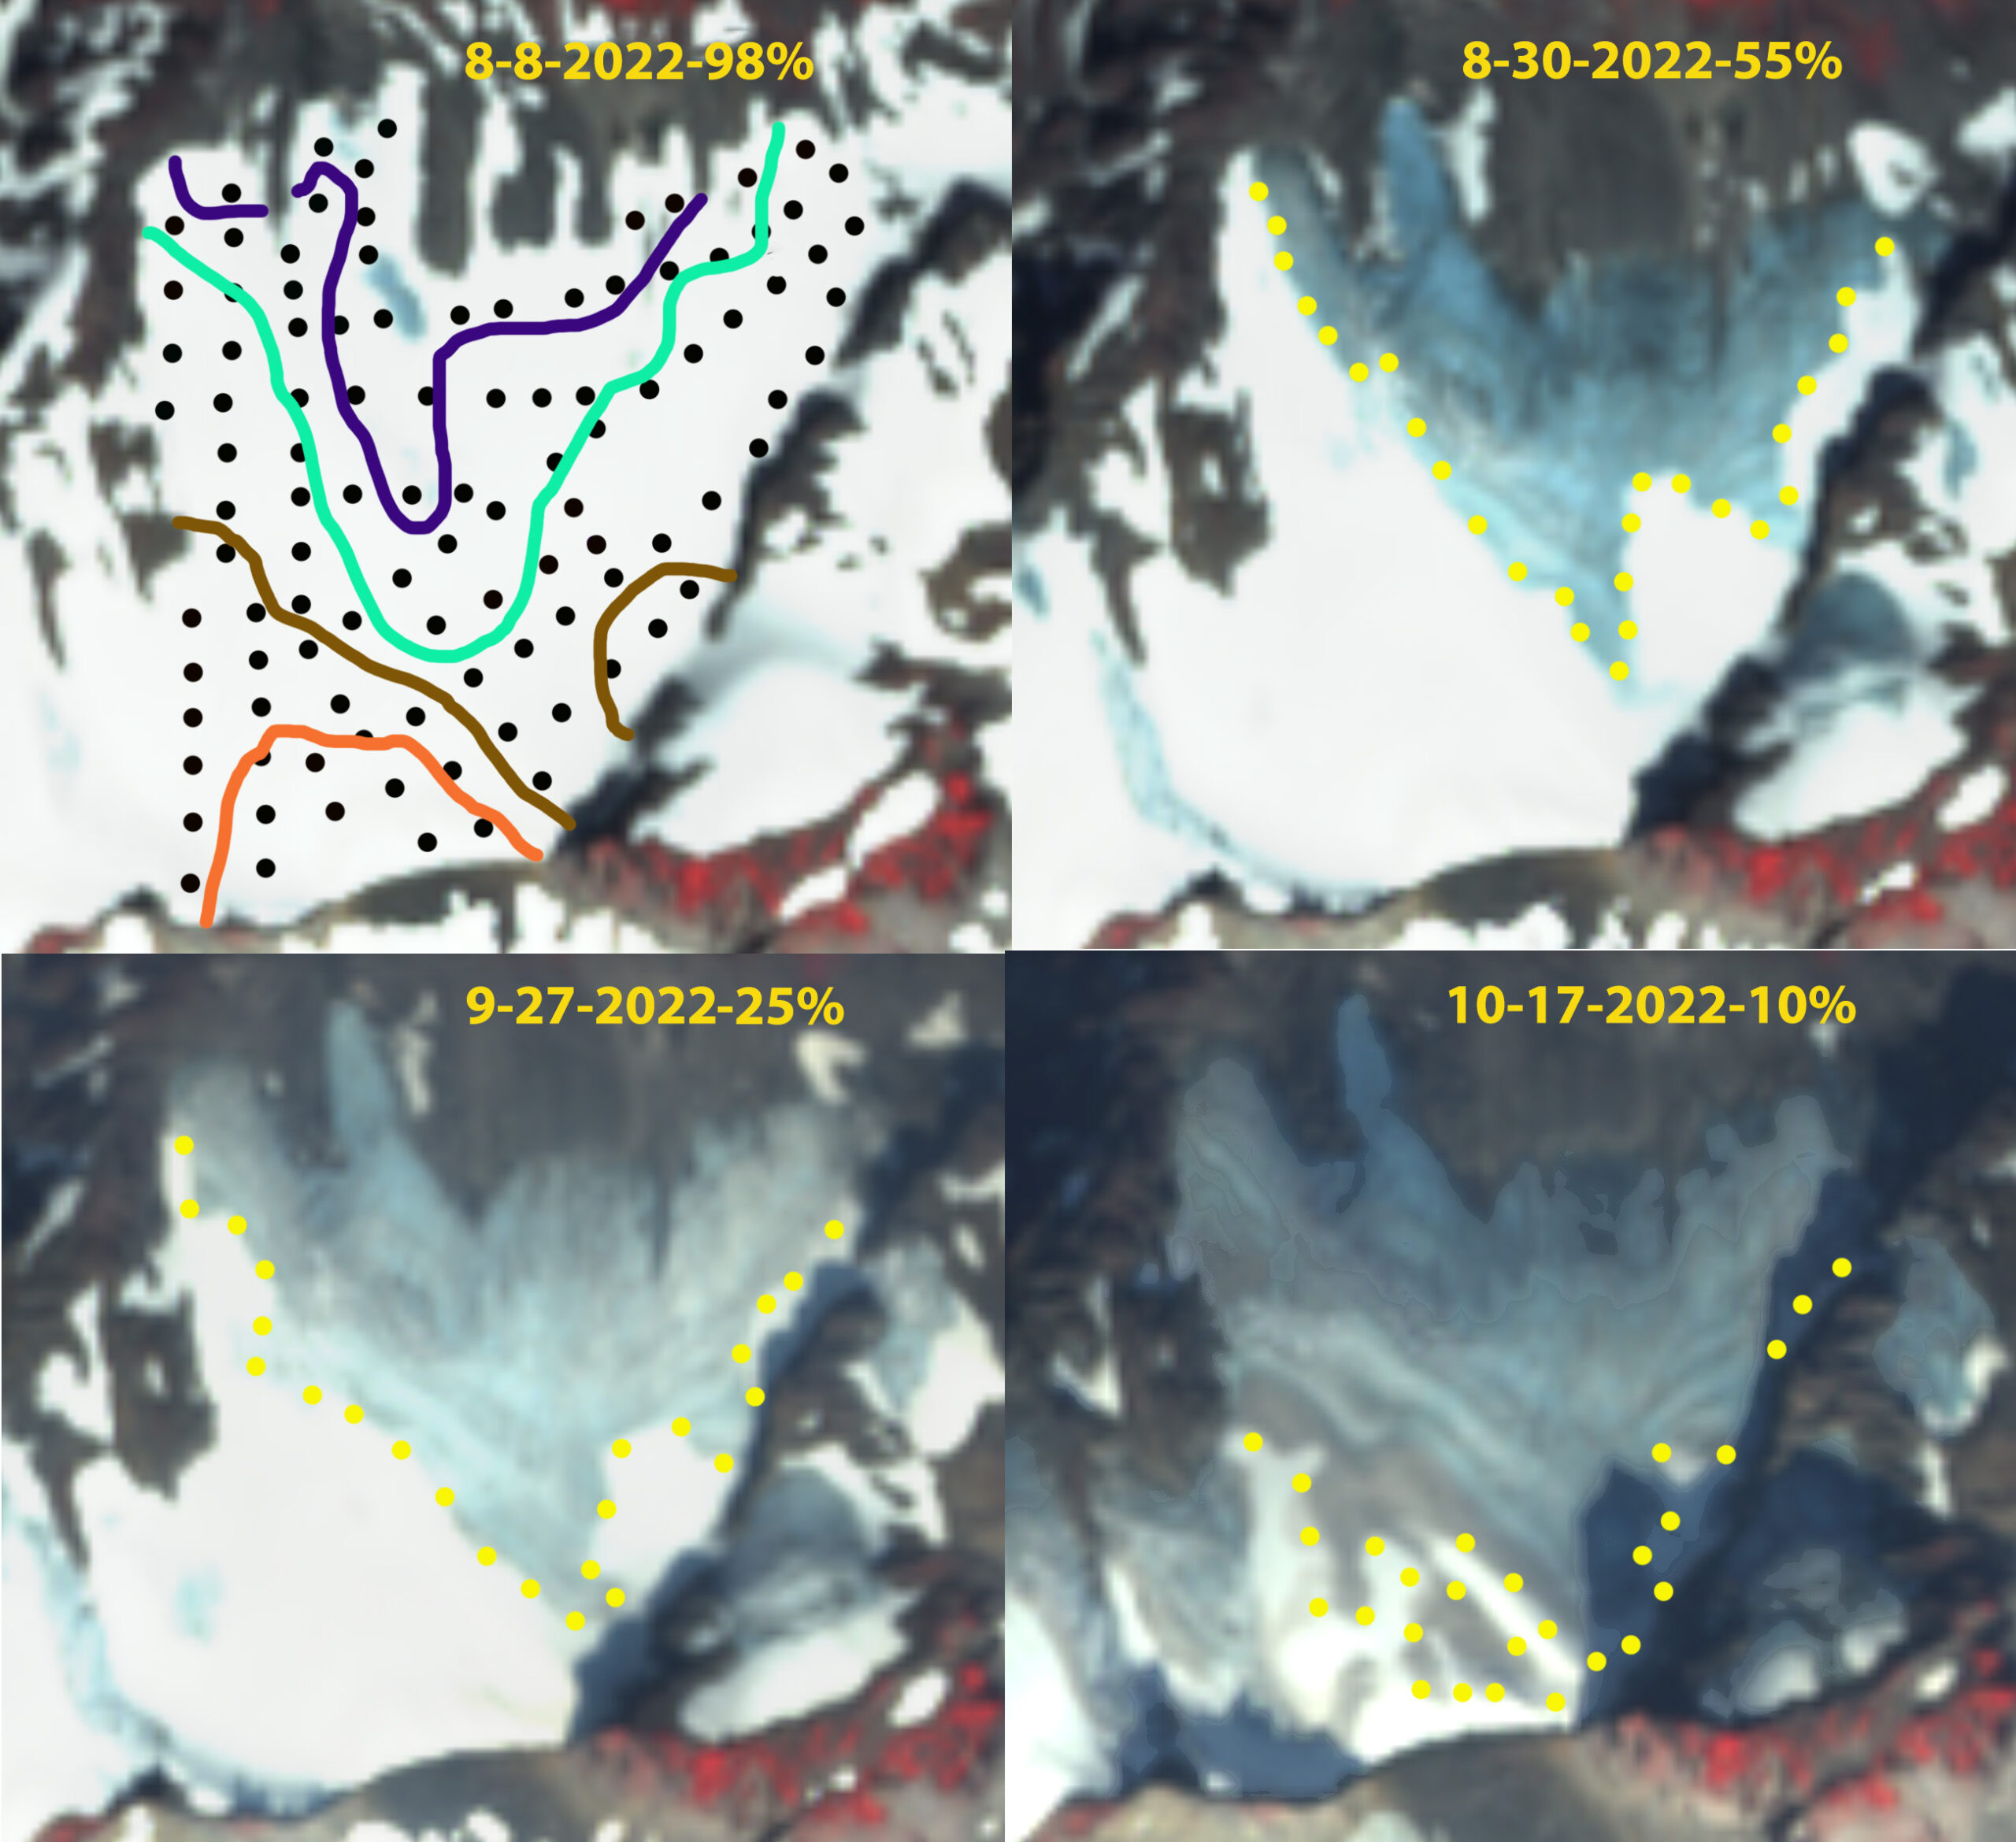
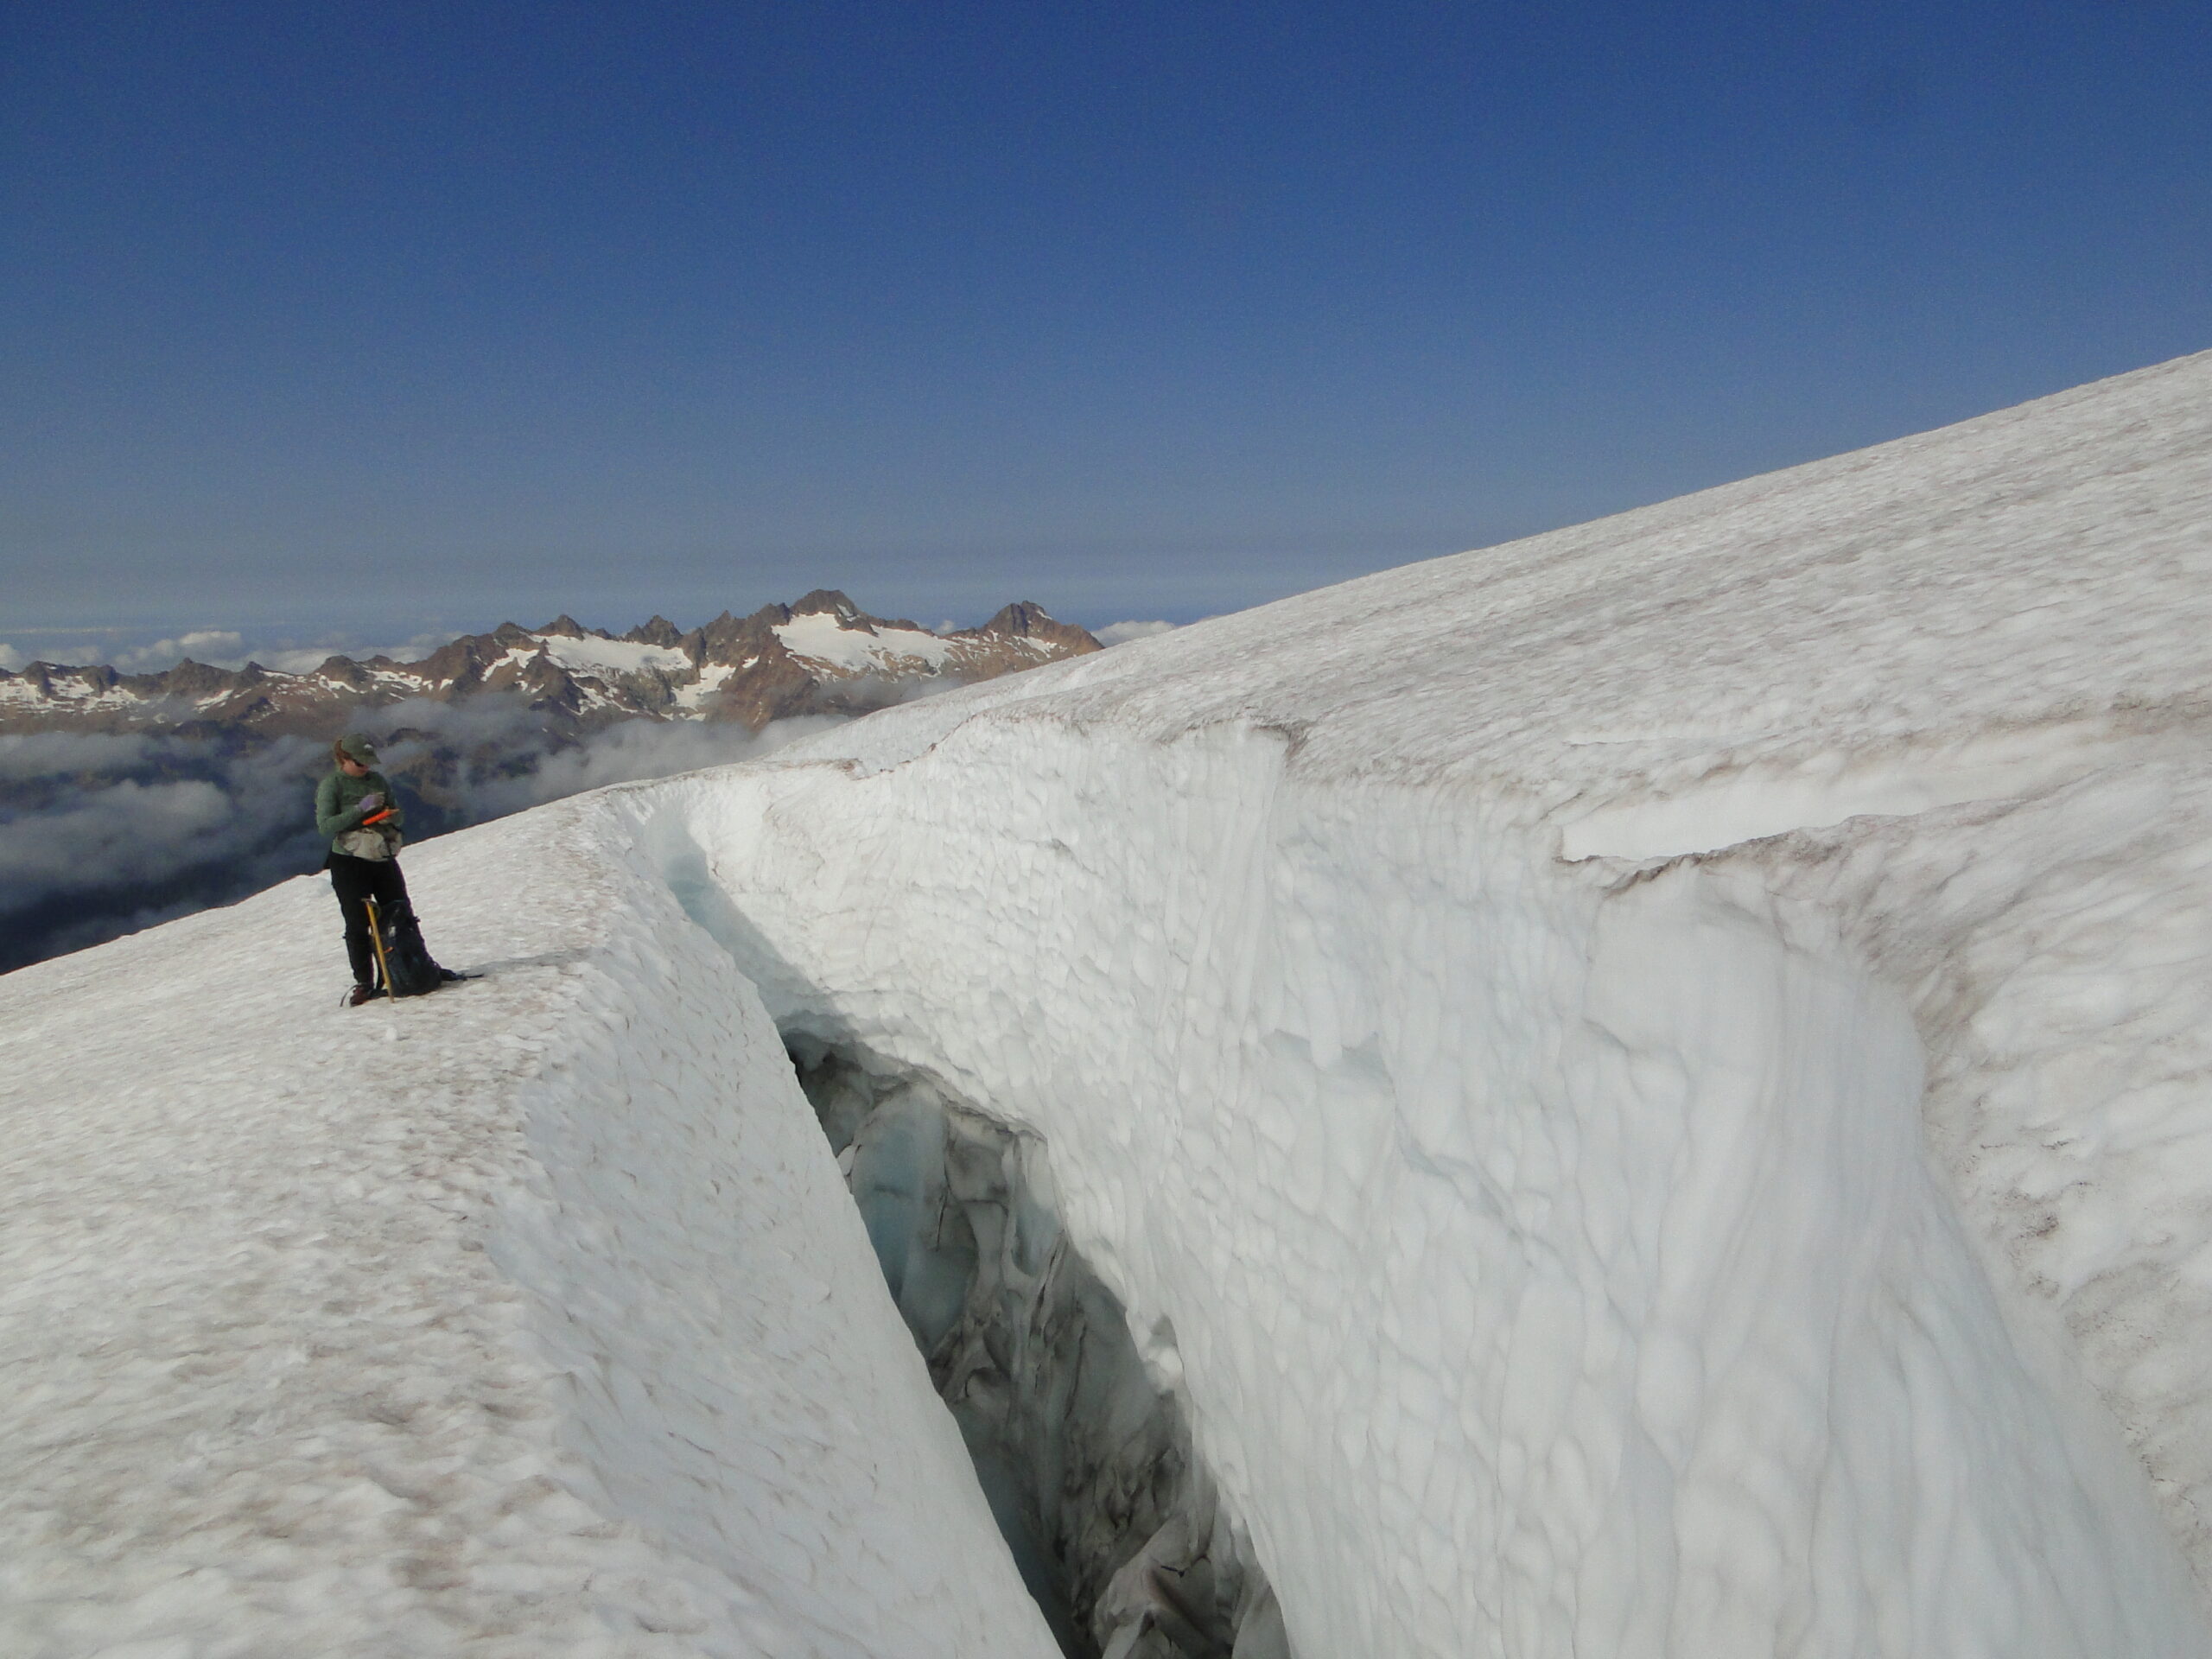
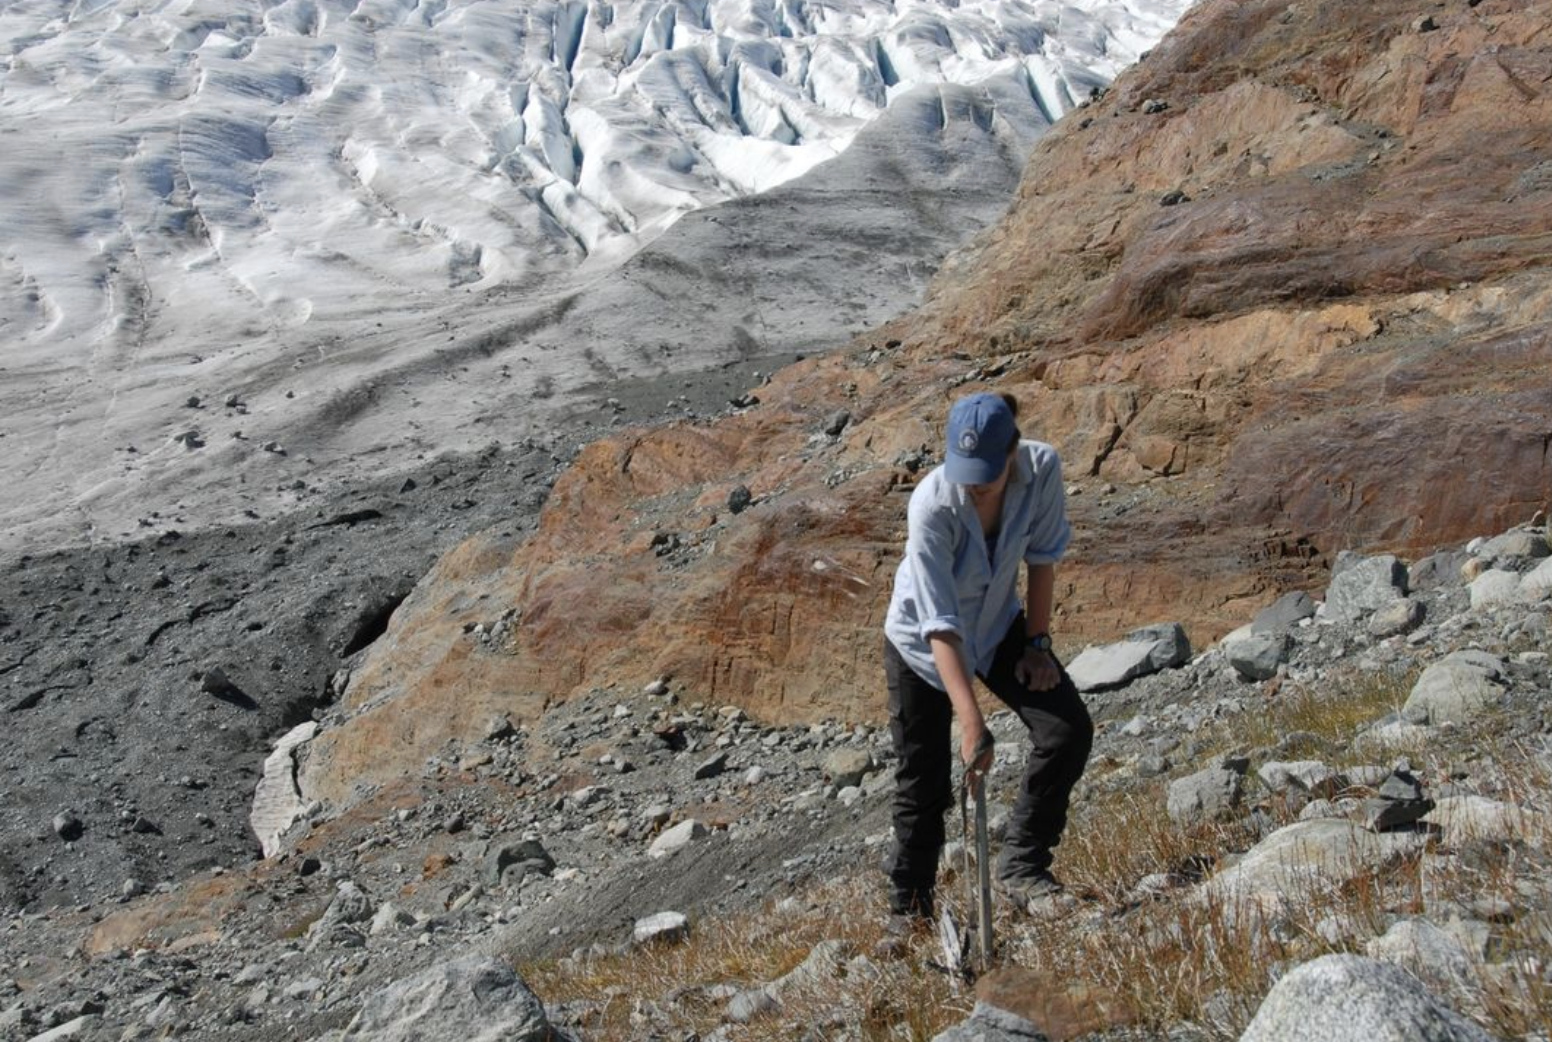
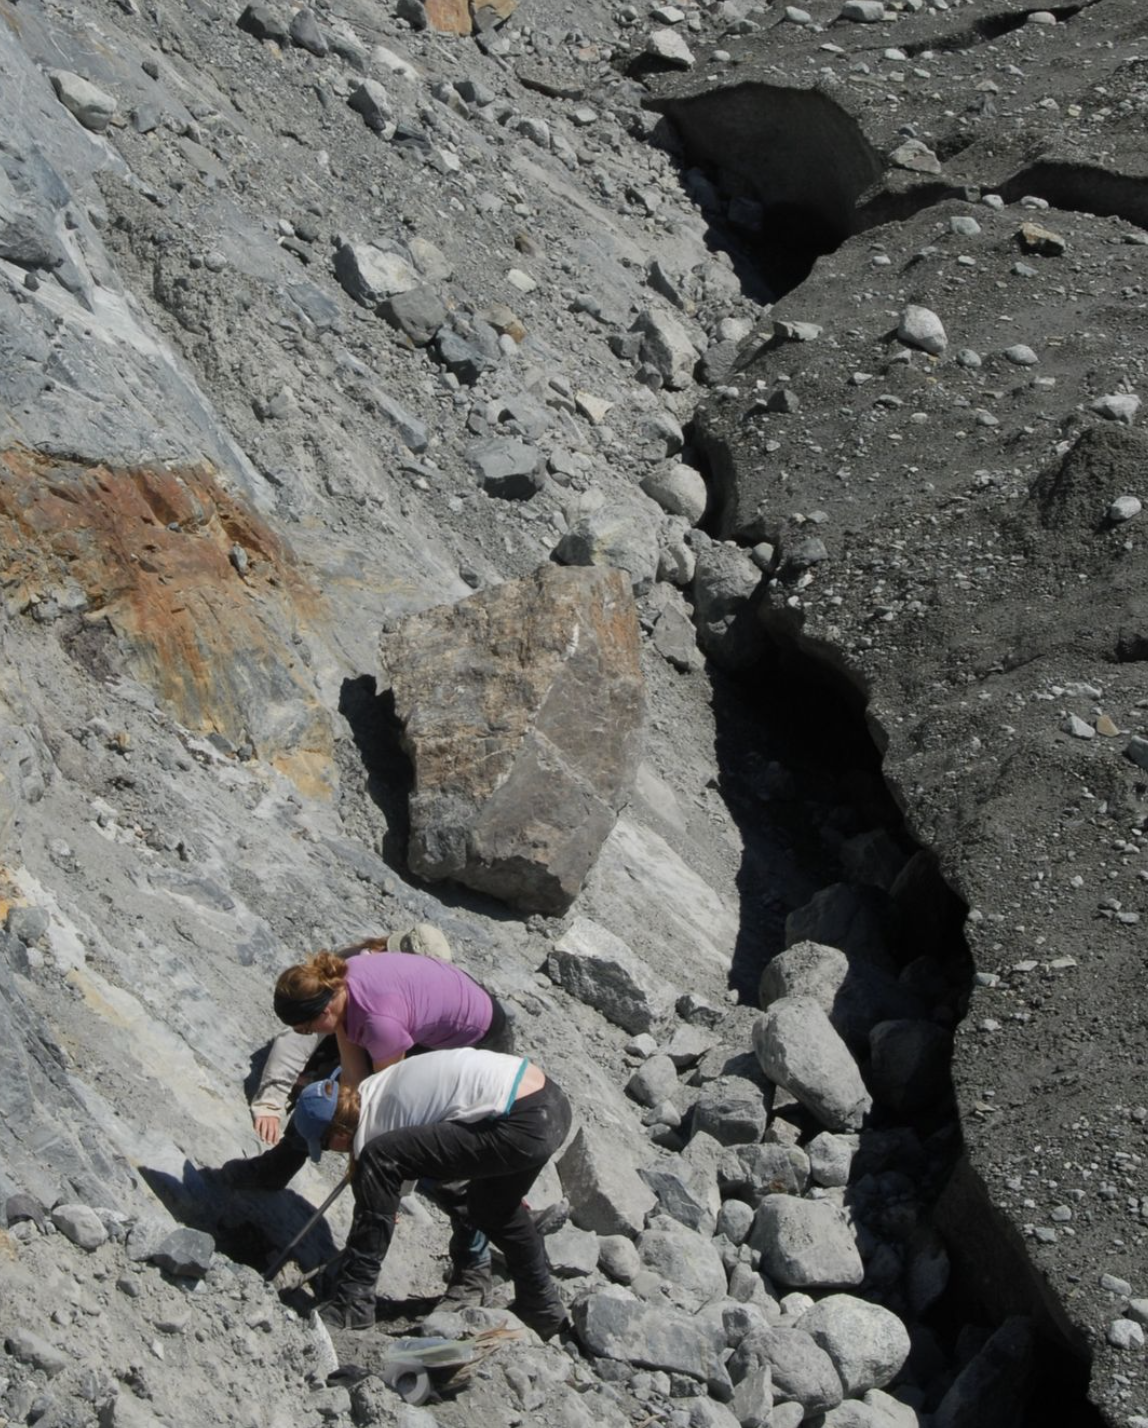
Temperate alpine glacier survival is dependent on the consistent presence of an accumulation zone (Pelto, 2010). The accumulation zone area is the region where snowcover persists through the year, and is referred to as the accumulaiton area ratio (AAR), typically 50-65% to be in balance. Low AAR values are indicative of the lack of a sizable accumulation zone during  a specific year.  Periodic years with low AAR values identify inconsistent accumulation zones. During consecutive years with low AAR values there is a loss of nearly all accumulated snow and considerable firn in the accumulation zone. The multiple annual firn layers exposed to ablation eliminates accumulation layers from the years when the AAR was higher. There are years where an accumulation zone exists, but this accumulation does not persist through the aforementioned years of extensive negative mass balances, hence there is no persistent accumulation zone. This is observed to have occurred on many North Cascade glaciers in 1992, 1993, 1994, 1998, 2003, 2004, 2005, 2009, 2014, 2015, 2019, 2020, 2021 and 2022. In 2005 and 2015 on Columbia Glacier the exposed annual layers in the accumulation zone are evident and indicate no preserved firn from recent years. This indicates no persistent accumulation zone, which leads to substantial thinning of the glacier in the accumulation zone

.columbia glacier 2005

Columbia Glacier accumulation zone in 2005 in early August, with limited snowpack and many exposed annual layers.

columbia firn mapping 2015

Columbia Glacier accumulation zone in 2015 in early August, with limited snowpack and many exposed firn layers.

Threshold 3-Glacier Loss

If there is an ongoing lack of a persistent accumulation zone a glacier will disappear. Repeated consecutive years of exceptional mass loss, bring the process into clear focus. Many alpine glaciers have experienced this scenario in  2021-2022, resulting in a clear delineation of those that have no persistent accumulation zone.  I have observed the disappearance of quite a number of glaciers after 40+ years of working in glaciated mountain ranges. It is no longer a shock. The pace is quickening, and the number of glaciers experiencing a disequilibrium response is skyrocketing.

milk lake glacier 2009

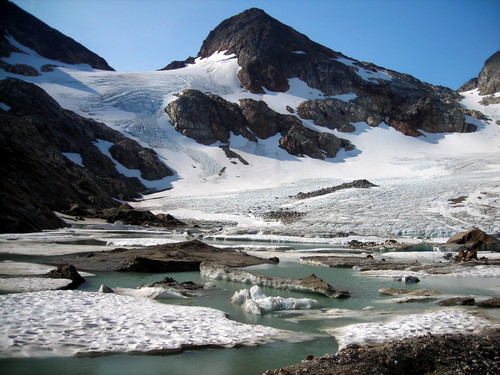
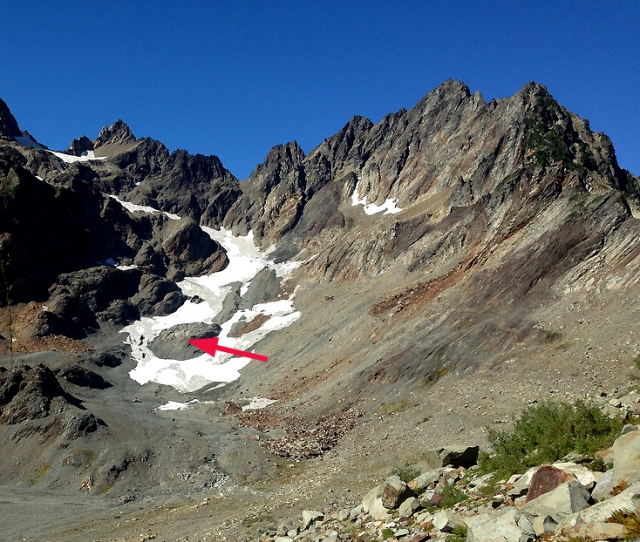
Milk Lake Glacier in the North Cascade Range disappears.

Hinman glacier loss 1958-2022

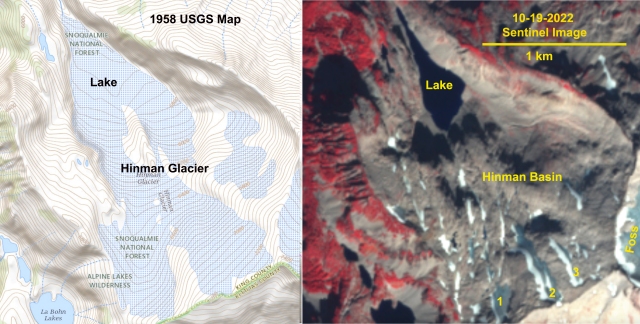
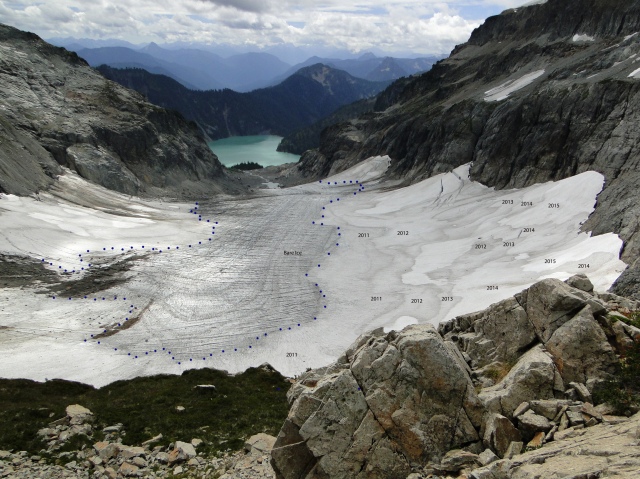
Hinman Glacier in the North Cascade Range disappears. Remanant small ice patches in 2021 Sentinel false color image.

anderson glacier 2014

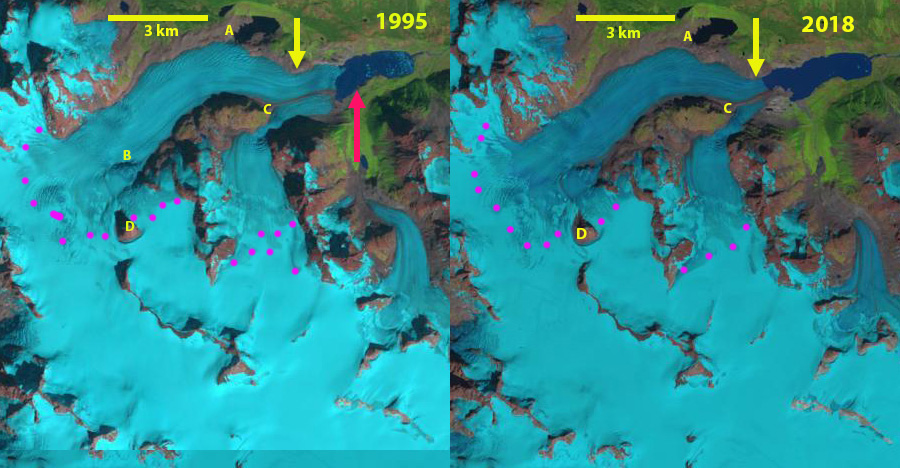
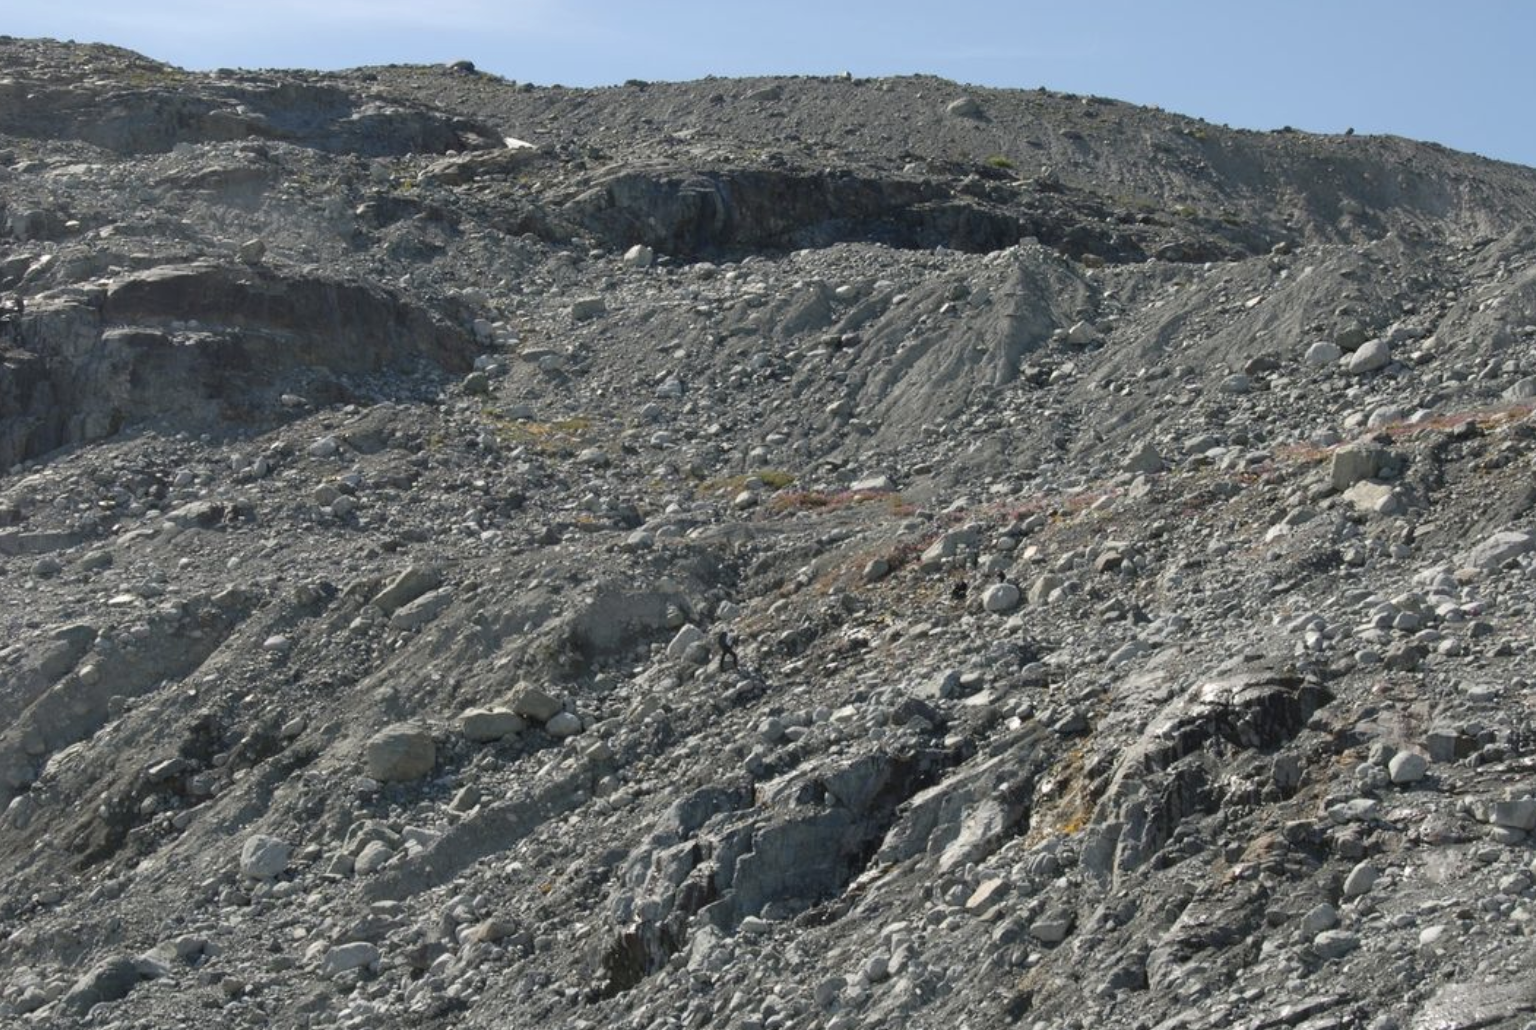
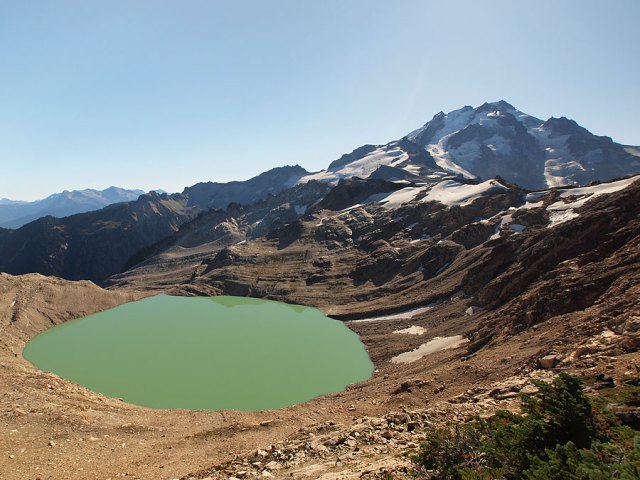
Anderson Glacier, Olympic Range disappears. Green arrow is 1959 terminus, pink arrow is 1990 terminus location and red arrow is bare rock area that emerged from below the glacier in this 2009 Google Earth image.

Sawyer Glacier, Tracy Arm Alaska Retreats from Tidewater

Sawyer Glacier Alaska in False Color Sentinel images from Sept. 12, 2022 and May 23, 2023. Note the the calving face in 2022 between the yellows arrows has become bare ground by May 23, 2023. TA=Tracy Arm

Sawyer Glacier in May 19, 2023, taken by Steve Backus (Lindblad Expeditions Naturalist), not touching tidewater.

Sawyer Glacier, is an Alaskan glacier where the retreat has long been viewed by many visitors. It is one of  the two primary glaciers that calves into Tracy Arm fjord, that is often visited by cruise ships. The 3.3 km retreat from 1961-2022 has made approach to the actual terminus difficult for larger cruise ships (Lindblad Expeditions, Allen Marine Tours or Holland Amreica) . The terminus of the glacier was almost to the main arm of the fjord in 1961, USGS map below.  Landsat images from 1990 to 2013 indicate retreat from the 1990 terminus, red arrow, to the 2013 terminus, yellow arrow is 2800 km, 120m/year. From 2013-2022 the retreat has been slower with ~500 m retreat, 50 m/year.

Sawyer Glacier retreat from 1990 to 2013 in Landsat images. Yellow arrow=2013 terminus; Red arrow=1990 terminus; purple arrow

Sawyer Glacier retreat from 1990 to May 10, 2023 in Landsat images. Green Arrow=2023 terminus Yellow arrow=2013 terminus; Red arrow=1990 terminus; purple arrow

From 1874 when John Muir first enthused about the calving glaciers of this fjord through 2022 their has been a calving front in the fjord.  This was true as the cruise ship season ended in 2022. False color Sentinel images in Sept. and Oct. 2022 indicate a calving front that is 250 m wide. False color Sentinel images on May 10 and 23, 2023 indicate the front of the glacier entirely resting above fjords waters. High tide may touch the glacier at ts southernmost point. When I first visited the in 1982 I could not imagine it retreating from the fjord in my lifetime. Melkonian et al (2016) observed a rapid thinning of the Stikine Icefield of -0.57 m/year from 2000-2014. This loss has been driving by rising snowlines.  Pelto (1987) reported a snowline of 1125 m the 1980’s, that now averages over 1300 m. The retreat here is similar to that of nearby Dawes and South Sawyer Glacier. This loss of iceberg  production will impact harbor seals as they prefer icebergs to haul out on. (Alaska Department of Fish and Game ).

May 10 and 23, 2023 Sentinel images indicating bare ground across entire terminus front.

Sawyer Glacier Alaska in False Color Sentinel images from Sept 12, 2022 and Aug. 7, 2016. Note the the calving face in 2016 and 2022 between the yellows arrows.

USGS 1961 topographic map showing location of terminus in 1961 and 2003.

Turnback Glacier, South Georgia, Retreats from Tidewater

Turnback glacier 1999-2023

Retreat of Turnback Glacier (T) from the shore of Fortuna Bay (FB) and retreat of Compass and Crean Glacier (A,B,C) exposing new terrain along the shore of Antarctic Bay (AB) in Landsat images. Also note the expansion of bedrock nunatks at Point E-H.

Turnback Glacier terminated on the west shore of Fortuna Bay on the northwest coast of South Georgia Island.  In 1989 the glacier extended the shore of Fortuna Bay (BAS map).  Crean and Compass Glacier have a joint terminus at the southern end of Antarctic Bay terminating on new small islands and a small peninsula.  Gordon et al., (2008) observed that larger tidewater and sea-calving valley and outlet glaciers generally remained in relatively advanced positions until the 1980’s.  After 1980 most glaciers receded; many of these retreats have been dramatic including Twitcher, Herz, Ross, Hindle, Konig and Neumayer Glacier (Pelto, 2017).  Here we examine 1999-2023 Landsat imagery and 2017-2023 Sentinel images to identify glacier change.

In 1999 Turnback Glacier (T) is within a 100 meters of the Fortuna Bay shore and has a single terminus with a medial moraine extending to the terminus near the glacier center. Crean and Compass Glacier have just retreated from two islands adjacent to Point B and C, and reaches the shore in a cove at Point A. By 2017 Turnback Glacier has retreated 500 m from the shoreline of Fortuna Bay and has begun to separate into two separate termini, with the medial moraine extending from Point J to the terminus still largely a medial moraine. An increasing area of deglaciated terrain extends from Point A-B along the shore where Crean Glacier is retreating. Compass Glacier has retreated 375 m from the island at Point C.  By 2023 Turnback Glacier has retreated 650 m, and has separated into two termini separated by a deglaciated ridge extending from Point J to the terminus. Compass Glacier has retreated 450 m from the island at Point C. At Crean Glacier there is a 1 km² contiguous area of deglaciated terrrain along the shore that previously had been smaller separated segments. The glaciers begin on shared accumulation plateau with Fortuna Glacier at 500-600 m. This region is thinning as indicated by the increasing exposure of nunataks at Point E-H, which will drive ongoing retreat.  The British Antarctic Survey map below illustrates glacier retreat and the elephant seal beaches (yellow X) and penguin colonies (purple dots) in the two bays.

The retreat here is signficicantly less than the larger glaciers Ross/Hindle, Neumayer, Konig and Twitcher Glacier, but is still exposing new coastal regions that are being occupied by flora and fauna.

Turnback glacier 2017-2023

Retreat of Turnback Glacier (T) from the shore of Fortuna Bay (FB) and retreat of Compass and Crean Glacier (A,B,C) exposing new terrain along the shore of Antarctic Bay (AB) in false color Sentinel images. Also note the expansion of bedrock nunataks at Point E-H. Also the medial moraine transitioning to deglaciated ridge at Point J.

turnback glacier map

British Antarctic Survey map of the Fortuna Bay to Antarctic Bay shoreline and glaciers. Colored lines indicate glacier retreat, yellow X=elephant seal beaches, purple dots=penguin colonies.

Thorthormi Glacier Retreat and Rapid Lake Expansion 2019-2023

Thorthormi Glacier terminus lake in false color Sentinel images from October 2022 and May 2023. Red arrow=terminus locaiton in August, 2019, Orange arrow=terminus location October 2021, Yellow arrow terminus location in October 2022. Lake area in October 2022 is 4.3 km².

Thorthormi Glacier drains south from the border with China into the Pho Chu River, Bhutan.  Osti et al (2012) reported in detail on the nature of potential Glacier lake outburst floods (GLOF) in the Pho Chu, noting there are eight dangerous lakes including Thorthormi Cho at the terminus of the Thorthormi Glacier. In 1994 Lugge Cho experienced a glacier lake outburst flood GLOF which incurred substantial damage in the Pho Chu basin. The 1994 GLOF event had a peak discharge of about 2539 cubic meters/second and extended 200 km downstream as a flood wave Osti et al (2012).The National Center for Hydrology and Meteorology has added Thorthormi Cho has one of 17 potentially hazardous lakes in Bhutan and installed a water level sensor as part of a flood warning system. On June 20, 2019 Thorthormi Glacier lake experienced a smaller GLOF that was indicated by the water level sensor. A detailed report of this event was completed identifying that the outlet channel had changed position, which meant the water level sensor had to be relocated NCHM. Water released from Thorthormi Glacier lake does not flow into the Raphstreng Lake directly to the west as it is separated by a 300-500 m wide moraine that rises 50 m above Thorthormi glacial lake.

Thorthormi Glacier before and after June 2019 outburst flood. Note channel development at red arrows. NCHM. noted a 0.8 m water level drop and 2.7 million m³ of water loss.

The Thorthormi Glacier had marginal pockets of proglacial lake in 2000 with the debris covered terminus extending across the lake basin to the Little Ice Age moraine (M).  By 2013 Thorthormi Glacier’s debris covered terminus connection to the moraine (M) had melted away and the lake had an area of ~1.5 km². The retreat of Thorthormi was 700 m from 2000-2013. In 2013 it was evident tht the lowest 1 km of the glacier is stagnant and melt should be enhanced by calving into the lake, and that retreat would remain quick in the next decade (Pelto, 2014). From 2013 to 2019 an additional 1100 m retreat occurred and the lake expanded to 2.2 km². From 2019-2022 the narrow terminus tongue disintegrated leading to a further 2250 m retreat. The lake has doubled in size from 2019-2023  4.3 km². The lake is still largely filled with icebergs. Rinzin et al (2023) observe that Lugge and Thorthormi glacial lakes are most prone to GLOF in te Pho Chu valley, and can potentially impact over 16,000 people, two hydropower projects, and agricultural land. The run-of -river 1,020 MW Punatsangchhu-II  and run of river 1,200 MW Punatsangchhu-I Hydroelectric Project are the two hydropower projects.  A further detailed assessment in the Fall of 2019 by NCHM indicated that the moraine between Raphstreng and Thorthormi glacial lakes remains unstable, but showed no signs of recent landslide activity after the June event. The moranie at its narrowest is 300 m wide and has a crest that is 33.5 m wide.

Thorthormi Glacier terminus lake in August 2019 and October 2021. Red arrow=terminus locaiton in October, 2019, Orange arrow=terminus location August 2021, Yellow arrow terminus location in October 2022. 

Thorthormi Glacier (T) retreat from 2000-2022 from the Little Ice Age moraine (M). Lugge Glacier and lake (L) is just to the east. Yellow arrows point out the tongue of debris covered ice representing the terminus that has disintegrated after 2019.

Mount Baker Glaciers, Washington Snowpack Recession and Evolution May 2022-May 2023

Sholes Glacier snowcover extent change from 8-8-2022 to 10-17-2022. Snowcover declined from 98% of glacier to 10% of glacier during this period. Black dots are measurement sites, yellow dots the transient snowline, purple contour= 1.5 m, green contour= 2 m, brown contour= 2.5 m, and orange contour= 3 m snow depths on 8-8-2022.

The 2022 melt season for Moutn Baker glaciers was one for the record books, with a slow start and a prolonged intense melt lasting into Late October. Peak snowpack was not reached until May 20, 2022 at the Lyman Lake (1515 m) and Middle Fork Nooksack (1825 m) Snotel sites, with limited melt before June 1. These two sites have the highest correlation with our glacier mass balance observations (Pelto, 2018). Peak snowpack at Paradise, Mount Rainier  (1565 m) was reached on May 26. The snowpack on June 1 at LL and MFN was 1.45 m Snow Water Equivalent (SWE) and 1.40 m SWE respectively.  Snowpack at LL melted completely on July 14 and at MFN on July 11, with an average daily loss of 3.2 cm/day SWE. From June 1-Oct. 19 when the melt season ended, observed melt exceeded the previous highest years, we have observed during the 1984-2022 period. In 2023 peak snowpack was reached in mid-April at both LL and MFN, with rapid melt reducing snowpack during the first half of May.

Lyman Lake and Midde Fork Nooksack Snotel site snowpack depth in cm SWE observations beginning April 1 in 2022 and 2023. In 2022 May was a period of snowpack increase in 2022, while the first half of May 2023 has resulted in rapid snowpack depletion.

Heather Meadows  snowpack depth (inches) at 1300 m, with 2022 rising above average during late April, while 2023 dips to average by the start of May.

On Sholes Glacier on August 6th-8th, 2022 we observed snow depths at 110 locations with an average snow depth of 2.25 m, 1.35 m SWE. We also checked two ablation stakes emplaced on June 1 indicating 3.55 m of snow melt, 2.1 m SWE. Sentinel images from Aug.8, Aug. 30, Sept. 9, Sept 27 and Oct. 17 reveal the recession of the snowline through the observation network allowing identification of snow ablation during these intervals. On Aug. 8, 98% of the glacier was snowcovered. On Aug 30, this had declined to 55%, with the snowline intersecting regions of the glacier that had 1.1 m SWE of snow cover on Aug. 8. By Sept. 9, the glacier was 40% snowcovered. On Sept. 27 the glacier was 25% snowcovered, with the snowline interseting sites that had 1.9 m SWE on Aug. 8. This is usually approximately the end of significant melt.  However, in 2022 summer conditions continued through Oct. 19. The glacier was 10% snowcovered on Oct. 17, with the snowline intersecting sites that had 2.7 m SWE on Aug. 8.

The total observed snow melt for the June 1-Oct. 17 period was 4.8 m SWE on Sholes Glacier, eclipsing the previous June-end of melt season highs in 2015 of 4.0 m and in 2021 of 4.4 m.  In both of those years the melt season did not extend into October, though May had significant melt. The Sholes Glacier did not suffer as much mass loss, because the initial snowpack was significantly greater in 2022. To have an equilibrium mass balance a glacier typically requires 55-65% of its area be snowcovered at the end of the melt season. A 10% snowcover indicates substantial mass losses.

On Rainbow Glacier on Mount Baker observations of snow depth on Aug 5-6, 2022 identified snow depths across the glacier. By Oct. 17th the areas of the glacier with 3.8 m or less of snowpack in early August had lost snowcover, indicating ablation of 2.4 m SWE of snowpack after early August. There was an area of exceptional snow algae at ~2100 m downwind of Dorr Steamfield on Rainbow Glacier, that Alia Khan’s Western Washington University research group examined. We led them through the Rainbow Icefall to this location.

On Easton Glacier, Mount Baker at 2500 m on Aug. 10th there was 5.25 m of snow remaining, compared to 2.75 m on September 27. At 2100 m there was 2.6 m of snowpack on August 10th with this snowpack melting completely between Sept,. 22 and Sept. 27. Indicating 1.6 m SWE of ablation during this period.

What 2022 illustrated is that a good winter season of accumulation, followed by a delayed melt season start, still cannot offset the persistent extended heat the region has experienced the last two summers.  With the melt season off to a faster start in 2023 the outlook for Mount Baker glaciers is for another significant mass loss.

Snow depths on Rainbow Glacier on Aug 5-6, 2022. 

Snow algae on Rainbow Glacier at 2100 m on Aug. 5th. Alia Khan’s WWU collecting samples.

Contrasting snow depth in crevasse in mid-August of 2020 and 2022 at 2500 m on Easton Glacier. Snow depths remaining on August 10, 2022 was ~5.25 m in 2022.

Snow depth at 2100 m on Aug 10th, 2022 on Easton Glacier


Jacobsen Glacier, BC Diminishes to Smallest Size in Thousands of Years

Written with Dan Smith

Jacobsen Glacier in Landsat images from 1987 and 2019. Red arrow 1987 terminus location, yellow arrow 2022 terminus location and purple dots the snowline. Point A indciates ice marginal lake in 1987, Point C is the glacier junction, Point B an emerging rock rib and Point D a nunatak.

Jacobsen Glacier is a large outlet glacier flowing from the Monarch Icefield in the Pacific Ranges of the British Columbia Coast Mountains. The glacier has sustained significant ongoing retreat and down wasting since achieving its Holocene maximum during the Little Ice Age (LIA) (Desloges and Ryder, 1990, Harvey and Smith 2013). The retreat and thinning of Jacobsen Glacier revealed a dendroglaciological samples that help identify periods of glacier advance and thickening over the last several thousand years.  VanLooy and Forster (2008) noted that the glacier retreated at a rate of 30 meters/year from 1974 to 1992 and 47 meters/year from 1992-2000. Menounos et al (2018) identified a mass loss for glaciers in this region of ~0.5 m year from 2000-2018 which is driving retreat.

Meltwater from Jacobsen Glacier flows northward into Jacobsen Creek, which drains into the Talchako River to eventually join the Adnarko River to form the Bella Coola River. The Bella Coola River is a key  salmon producing rivers on the British Columbia’s central coast, supporting large chinook and chum salmon populations, surveyed at 23k and 190k in surveys during the last decade (Pacific Salmon Foundation, 2021)  The sockeye and pink salmon runs have largely collapsed this century (Pacific Salmon Foundation, 2021). In this post we examine Landsat satellite imagery from 1987-2022 to illustrate recent changes and field images from University of Victoria expeditions, provided by Dan Smith, in 2002 and 2010.

The historical terminal retreat and thinning of Jacobsen Glacier led to exposure of the remains of trees overwhelmed and buried by mid-Holocene glacier advances. Expeditions to the site in 2010 provided the opportunity collect samples of these remains for tree-ring analysis and radiocarbon dating. Lichenometric measurements in 2002 and 2010 were used to date the LIA moraine building episodes and to provide a record of the rates of deglaciation. Moraine building intervals were identified prior to 1280–1320 and 1490–1530 AD and describe early-LIA advances; whereas advances prior to 1680–1720 and 1820–1870 AD describe the results of late-LIA advances (Harvey et al 2012).

In 1987 Jacobsen Glacier terminated in a 1.8 km long proglacial lake at an altitude of ~1080 m . The north margin had a separate terminus in the proglacial lake at Point A. The terminus in the main proglacial lake was 900 m wide. At Point B there was an icefall, but no exposed bedrock. The snowline at this time was at 2050 m. By 1995 the glacier had retreated 500 m up valley. The glacier remained in contact with the proglacial lake at Point A and the snowline was at 2100 m. Due to thinning by 2000 the glacier had retreated from the proglacial lake at Point A and in 2016 the snowline was at 2150 m. By this time the glacier was separated from the proglacial lake at Point A by ~500 m and the southern tributary no longer reached the expanding proglacial lake. By 2018 bedrock was exposed at Point B and the snowline was at 2100 m.

The retreat and downwasting at Jacobsen Glacier continues at the present time. In 2022 the proglacial lake had expanded to a length of 3.6 km, a total retreat distance of 1800 m from 1987-2022. Lake area is 2.8km² in 2022, with the glacier calving front being 500 m long. The rate of terminal from 1987-2022 amounted to ~50 m/year, only a slightly change rate reported from 1990-2000 reported rate. In 2022, the local snowline was found at 2050 m. The reduced calving front length and likely lake water depth will reduce calving losses, surface mass balance losses will be the key driver of ongoing retreat. In 2010 the University of Victoria expeditions had noted the glacier had retreated to a point where it was smaller than it had been in 6000 years, exposing buried trees. Since then the retreat has continued likely exposing a few more buried treasures to be examined.

Jacobsen Glacier in Landsat images from 1995 and 2018. Red arrow 1987 terminus location, yellow arrow 2019 terminus location and purple dots the snowline. Point A indciates ice marginal lake in 1987, Point C is the glacier junction, Point B an emerging rock rib and Point D a nunatak.

Jacobsen Glacier in Landsat images from 2000 and 2016. Red arrow 1987 terminus location, yellow arrow 2019 terminus location and purple dots the snowline. Point A indicates ice marginal lake in 1987, Point C is the glacier junction, Point B an emerging rock rib and Point D a nunatak.

Recently deglaciated bedrock outcrops beside Jacobsen Glacier. Monarch Icefield area, Pacific Ranges, British Columbia Coast Mountains. (July 18, 2010)

The lateral moraines at Jacobsen Glacier are big, complex and, in places, are partially eroded. For scale, there are at least three UVTRL team members in this photograph. Can you find them? (July 17, 2010)

A dendroglaciological treasure located above Jacobsen Glacier. UVTRL Team member points to the detrital remains of a masticated tree stem plastered onto the moraine slope. One of many pieces of subfossil wood found in the general area, it proved to be the remains of a tree killed when the glacier was expanding up this slope 6500 years ago (July 17, 2010)

Jacobsen Glaciers western margin in 2010. Field team is resting on the recently deglaciated terrain in the lower left (July 17, 2010).

 The diggers are excavating a rooted and sheared stump in growth position. Radiocarbon dating indicate the tree was killed as Jacobsen Glacier expanded  some 6500 years ago. While the glacier unquestionably waxed and waned over those six millennia, this is the first time that it has shrunk to its contemporary size.   (July 17, 2010)


Tyndall Glacier, Chile April 2023 Calving Retreat

Tyndall Glacier in Sentinel images from March 11, 2023 and April 12, 2023 indicating the calving event and three icebergs generated.

Tyndall Glacier is a large outlet glacier of the Southern Patagonia Icefield (SPI). This glacier has an area of over 300 km². The main glacier terminus is in Lago Geikie, which began to form around 1940, and the east terminus previously terminated in Lago Tyndall. Laboratorie de Glaciologie reports on both the retreat of this glacier and the Lago Geikie water depth. Extendingaross the middle half of the lake from the 2003 terminus location most of the way to the southern margin  of the lake is a basin that is over 200 m deep.Weidemann et al (2018) indicate a -2.5 m/year mass balance loss for the glacier from 2000-2014, much of the loss resulting from frontal ablation, that has driven the continued thinning and retreat. This thinning has exposed dinosaur fossilson the east margin 12 km upglacier of the terminus (NASA EO, 2022).

Tyndall Glacier change from 1986 to 2023 in Landsat images indicating the retreat and lake expansion from 12 km² to 21 km². Red dots the 1986 termins, yellow dots the 2023 terminus locaiton.

The glacier experienced a significant calving event and associated recession in April 2023, with a 1.5 km² recession from March 11-April 12, 2023. This has increased the area of Lago Geikie to 21 km². In 1986 the area of the lake was 12 km² and the glacier was in contact with Lago Tyndall. Recession had expanded the lake to 17 km² by 2003,  and 18 km² by 2010 when the glacier separated from Lago Tyndall. In 2003 a similar calving event took place as the glacier lost much of its protruding central tongue, see iceberg below. From 2013 to 2022 terminus retreat was limited though thinning continued. In late March or Early April of 2023 first the central terminus tongue broke off as seen on April 5. A significant rift is evident that then led to a larger calving event prior to April 12. Is this the largest calving event in the last two decades for this glacier?  There is a surface steepening within a 1/2 km of the current terminus indicating a reduction in lake depth. Sakakibara and Sugiyama, (2014)report a decelaration of this glacier from 1986-2011 and a retreat rate of ~100 m/year during this interval. The calving event is similar to the breakup of the terminus tongue I noted at Soler Glacier this year. This is a more active front experiencing a calving retreat similar to that of Glacier O’Higgins.

Tyndall Glacier change from 2003 to 2008 in Landsat images indicating the retreat and lake expansion from 17 km² to 18 km².

Tyndall Glacier change from 2013 to 2022 in Landsat images indicating the limited retreat and lake expansion.

Tyndall Glacier on April5, 2023 in Sentinel imagery indicating rift and iceberg.

Glaciers Across the Central Andes Snowcover Free Summer 2023

Bajo del Plomo Glacier, Argentina in Sentinel image with no retained snowcover this summer, and rapid bedrock expansion at Point A-C. This is 2nd consecutive year without retained snowcover for this glacier at the head of the Rio Plomo.

For an alpine glacier to thrive it must remain 50-60% snowcovered throughout the year, even at the end of the summer. To survive it must have consistent significant snowcover at the end of summer, indicative of a persistent accumulation zone. This year in the Central Andes of Argentina and Chile I have chronicled the near total loss of snowpack through February, leading to dirty/dark snowcover free glaciers. This is a same story we observed in 2022, though snowcover was lost in January last year (Pelto, 2022). The consecutive summers with glaciers laid bare results in significant losses. The darker bare surfaces of the glacier melt faster leading to more rapid area and volume loss.  This includes fragmentation and rapid expansion of bedrock areas amidst the glacier. We saw in the Pacific Northwest two consecutive summers with limited snowcover retained. Hopefully the Central Andes region will experience a good winter much as the Mount Shasta, CA area has in winter 2023.

Here is an update at the end of the summer using false color Sentinel imagery to highlight a sample of these glaciers that have remained largely bare for two months.  Individual posts during 2022 or 2023 include: Volcan Peteroa glaciers, Rio Atuel glaciers, Sollipulli Glacier, Palomo-Cipreses Glacier,  Bajo del Plomo Glacier Cortaderal Glacier, Volcan San Jose Glaciers , Cobre Glacier, Olivares Beta and Gamma Glaciers and Volcan Overo Glaciers,

Olivares Beta and Gamma Glacier, Chile  in Sentinel image with no retained snowcover this summer, retreating away from proglacial lakes and bedrock expansion. This is 2nd consecutive year without retained snowcover for these glaciers.

Nevado Piquenes, Argentina has less than 5% snowcover retained in this Sentinel image, right near the 6000+ m summit.

Bello and Yeso Glacier, Chile have no trace of snowcover for 2nd consecutive summer. The dirtier surface is leading to faster melt.

El Morado Glacier, Chile has no trace of snowcover for 2nd consecutive summer. The dirtier surface is leading to faster melt, and fragmenting.

Volcan San Jose Glaciers in Sentinel image continues to fragment with a 2nd consecutive year without retained snowcove.

Cortaderal Glacier, Chile in Sentinel image with no retained snowcover this summer, leading to terminus tongue loss at Point A.

Corto, Fiero and Humo Glacier, Argentina with no retained snowcover in 2023, for 2nd consecutive summer. These glaciers feed the Rio Atuel, and their rapid retreat will lead to less summer glacier runoff.


Volcan Overo in Sentinel image continues to fragment with no retained snowcover this summer, and bedrock expansion causing fragementation at Point A, B and C.

Tinguiririca Glacier, Chile drains into the river of the same name. In 2023 this fragmenting glacier lost all its snowcover for 2nd consecutive summer.


Cobre Glacier, Argentina lost all its snowcover in 2023, just like 2022. Here it has separated at Point B and nearly so at Point A.

Volcan Peteroa Glacier, Chile/Argentina border in Sentinel image continues to fragment at Point A with no retained snowcover, this is also leading to lake expansion at Point B.

Map of Central Andes indicating glacier locations from 33-36° S that we focus on here.

Sierra Nevada, California Glaciers Rapid Decline 2018-2022

MacClure and Lyell Glacier in 2018 and 2022 Sentinel images illustrating a decline from 0.09 to 0.06 km²

The Sierra Nevada, California has a number of small glaciers that have clung to the north facing slopes of the High Sierra. An inventory of these glaciers completed by Basagic and Fountain (2011) identified glacier area in 2004, which had declined by 55% since 1903. At that time the MacClure Glacier had an area of 0.15 km², the West Lyell Glacier an area of 0.42 km², Conness Glacier an area of 0.16 km² and Darwin Glacier an area of 0.12 km². The Palisade Glacier is the largest glacier, with an area of 0,84 km² in 1984. Yosemite NPS has been assessing area change of Lyell and MacClure Glacier, they found a rapid acceleration of area loss beginning in 2012, noting a thickness loss of 3-4 m per year during the 2012-2015 drought.  These losses are similar to those observed on Whitney Glacier, Mount Shasta. The NCEI NOAA Division 5 climate data for this area indicates that meltseason temperatures have been the primary cause of the recent decline, though declining accumulation season precipitation has been as well, see bottom.

The thickness loss of 2012-2015 has been matched during the 2020-2022 drought. Area decline from 2018-2022 on West Lyell Glacier has been from 0.18 to 0.13 km², on MacClure Glacier from 0.09 to 0.06 km², on Conness Glacier from 0.08 to 0.05 km² and on Palisades Glacier from 0.62 to 0.48 km². In September of 2021 and 2022 all of these glaciers were completely bare of snowcover, even in areas of avalanching. A glacier requires 50-60% snowcover at the end of summer to be in equilibrium and cannot persist without a consistent accumulation zone. This illustrates the glaciers cannot survive the climate of the last decade. The area has declined ~30% in just five years from 2018-2022 on West Lyell, MacClure, and Conness Glacier, they each lost all of their snowcover both years by late August. Fiske (0.02 km²),  Dana (0.04 km²), Darwin (0.05 km²), Matthes (0.01 km²) and Powell Glacier 0.04 km² no longer qualify as glaciers. The next glaciers to join this class will be MacClure and Conness Glacier. The only glacier with even a small persistent accumulation zone has been Palisades Glacier.

The lost of glacier thickness in just 2021 and 2022 is 5-6 m w.e. ice thickness. To replenish this loss requires 5 m w.e of snowpack to be retained at the end of the melt season in early October. This equates to 8-9 m of snowpack remaining. This will not happen in a single season even a record snowfall year such as 2023.

Palisades Glacier in 2018 and 2022 Sentinel images, retreat indicated by lake expansion. Purple dots indicate area of firn indicating region where some snow from recent years has remained, but less than 10% of glacier area in 2021 and 2022. Note marginal recession along east and west edge of glacier.

Conness Glaciuer diminishing and darkening from 2018 to 2022 in Sentinel images. Area declined from 0.08 to 0.05 km². If it is hard to pick out the glacier on high resolution imagery like this, that is telling.

Darwin and Powell Glacier no longer have sufficient area to qualify as glaciers at 0.05 km² between two perennial ice masses for Darwin Glacier and 0.04 km². No retained snowcover in 2021 or 2022. That they are hard to discern is visual evidence of their current insignficance as ice masses.

Dana Glacier has an of perennial ice of 0.04 km².  No retained snowcover in 2021 or 2022. 

Matthes Glacier in 2021 with no retained snowpack and an area of perennial ice of 0.015 km².

Palisade Glacier with narrow fringe of snow and firn in 2021.

Lyell ad MacClure Glacier in 2021 with no retained snowpack.

NCEI NOAA Division 5 climate data for melt season temperatures  (May-Sept.) and accumulation season precipitation (November-April)

Soler Glacier, Chile Terminus Tongue Breakup in 2023

Soler Glacier, Chile terminus tongues is 1.9 km long on 12-26-2022 and by 3-21-2023 it has broken up, with four larger bergs A-D. False color Sentinel images.

In 2020 I noted that the Soler Glacier “terminus tongue in its lowest 1.5 km continue to thin and will collapse in the lake in the near future.” Here the breakup of this tongue in 2023 is reported. Soler Glacier is an outlet glacier on the east side of the Northern Patagonia Icefield (NPI). The terminus response of this glacier was slower and more limited than on most NPI glaciers, just 200-350 from 1944 to 1984 (Aniya and Fujita 1986).  Glasser et al (2016) note the recent 100 m rise in snowline elevations for the NPI, which leads to the 2 m thinning per year identified by Willis et al, (2012)  in the ablation zone from 1987-2011.  Loriaux and Casassa (2013) examined the expansion of lakes on the Northern Patagonia Ice Cap reporting that from 1945 to 2011 lake area expanded 65%, 66 km2.

Soler Glacier had no proglacial lake in 1987. By 2000 a small lake had developed both on the north and south side of the main terminus with a total area of ~0.3 km2 see Mike Hambrey image below. In 2016  lake had expanded, with the northern arm mostly filled with ice.For Soler Glacier lake formation did not occur until the last decade reaching an area of 1 km² by 2020. As the 2022/23 melt season began the glacier had a 1.9 km long central tongue extending down the middle of the lake, that had an area of 1.4 km², as evidenced on Dec. 26, 2022. By early March the tongue had broken up as revelaed by the Sentinel image on March 21, 2023. On this date the lake surface has refrozen on the south side and has some new snow on it. The lake has expanded to 2.75 km², with the largest iceberg B, occupying 10% of the lake. The lake expansion is small compared to Steffen Glacier or San Quintin Glacier, but just as significant for this smaller glacier.

Soler Glacier in 1987 and 2020 Landsat images.  Red arrow indicates 1987 terminus location, yellow arrow indicates 2020 terminus location on north side of glacier.  Yellow dots indicate margin of lake and purple arrows indicate specific locations where glacier thinning is evident.

Soler Glacier in 2020 and 2023 Landsat images.  Red arrow indicates 1987 terminus location, yellow arrow indicates 2020 terminus location on north side of glacier.  Yellow dots indicate margin of lake and purple arrows indicate specific locations where glacier thinning is evident in 2020.

Mike Hambrey Photograph of Soler Glacier in  2000, illustrating narrow nature of the proglacial lake.


Soler Glacier in 2016 Landsat image.  Red arrow indicates 1987 terminus location, yellow arrow indicates 2020 terminus location on north side of glacier. Lake area is still limited.


Snowcover Free Glaciers in Antarctica in 2023

Eastern Ice Cap on Vega Ice Cap is snow free in Feb. 19, 2023 Sentinel images. Bedrock areas at Point A and B will expand with snow free conditions.

In 2023 the near complete loss of snowcover is apparent on a number glacier and ice caps In Antarctica, on several islands along the Antarctic Peninsula. This yields a more extensive bare ice and firn surface area, that increses melt rate and increases the density of light absorbing particles on the surface.  This snowcover loss is the result not of a heat wave but of a consistenly warm summer. At Esparanza Base:

  • November mean temperature 2.5 C above average
  • December mean temperature 0.5 C above average
  • January mean temperature 1.5 C above average
  • February mean temperature 1 C above average

This yields an mean melt season temperature 1.5 C above average compared to 2020 that had a mean average temperature 0.5 C above average.  The most anomalously warm month was November. Monthly temperature anomlies for the region are evident in the global monthly maps from NCEI NOAA, see below. The net amount of melt for these temperatures is still low, which indicates the limited accumulation in the region.

On Vega Island the eastern end features an ice cap that has no retained snowcover from the north to south shore, with two expanding areas of bedrock amidst the glacier at Point A and B. Snowcover begins at 300 m on an ice cap toward center of island. On Vega Island’s western end the ice cap has lost 70% of its snowcover, with snow retained above 400 m.

On the Ulu Peninsula of James Ross Island three of five glaciers along the Lachman Crags are snowcover free. Triangular, Lachman and San Jose Glacier lack snowcover and have a much darker surface, which further enhances melting, then seen in field photographs of these glaciers (Davies, 2020) and Jennnings et al (2021). Glasser and Lachman North Glacier both have significant snowcover above 500 m.

Whisky Glacier is a tidewater glacier terminating in Whisky Bay. This glacier is 90% snowcover free on Feb. 19, 2023. Snow patches are evident above 250 m near the ice divide, note green arrow. The southwest extension (SW) is also snow free.

As reported separately, Eagle Island Ice Cap in Sentinel image from Feb. 19, 2023 has only small patches of snowcover left, 5-10% of ice cap all above 300 m. The peripheral ice caps and glaciers here are not an indicator of the larger ice sheets. They are an indicator that snowcover free glaciers are now occurring not just at temperate latitudes. These glaciers like many glaciers in the Central Andes of Chile and Argentina have lost nearly all their snowcover.


A series of glaciers on the Ulu Peninsula of James Ross Island Feb. 19, 2023 Sentinel images. San Jose, Lachman and Triangular have lost all snowcover and have a low albedo. Glasser and Lachman North Glacier have snowcover above 500 m.

Whisky Glacier on the Ulu Peninsula of James Ross Island Feb. 19, 2023 Sentinel image, illustrating 90% of the snowcover has been lost, green arrow is ice divide.

Western Vega Island Ice Cap in Feb. 19, 2023 imnage is 70% snowcover free with snow along summit area above 400 m.

Eagle Island Ice Cap in Sentinel image from Feb. 19, 2023 illustrating only small patches of snowcover left, 5-10% of ice cap. 

NCEI NOAA Monthly Global temperature anomalies.


Eagle Island Ice Cap, Antarctica Loses its Snowcover in 2023

Screenshot

Eagle Island Ice Cap in Sentinel image from Feb. 19, 2023 illustrating only small patches of snowcover left, 5-10% of ice cap. 

On February 19, 2023 Eagle Island Ice Cap, Antarctica has less than 10% snowcover. This is less snowcover than observed even after the period of record warm weather over the Antarctic Peninsula in February 2020.  Temperature when the all time Antaractica temperature record was set at Esperenza Base. That year also led to record melt and ponding on the George VI Ice Shelf  (Banwell et al, 2021). Here we examine Landsat and Sentinel imagery of the Eagle Island Ice Cap (63.65 S 55.50W), 40 km from Esperanza, to identify surface melt extent and surface melt feature development in 2020, 2022 and 2023. The summit of the ice cap is at 250-300 m and it has an area of 21 km².

In 2020 we observed blue ice areas (BI) and saturated snow areas (SS) rapidly developed from a snow covered ice cap during the heat wave (NASA EO, 2020). The impact of short term melt events like this on an ice cap like this, is visible and significant for annual mass balance, but not large in terms of long term glacier mass balance (volume change) and area. In 2022 a similar patter nof blue ice developed, but no saturated snow. In 2023 the loss of snowcover is nearly completely yielding a more extensive bare ice and firn surface area. This is the result not of a heat wave but of a consistenly warm summer. At Esparanze Base:

  • November mean temperature 2.5 C above average
  • December mean temperature 0.5 C above average
  • January mean temperature 1.5 C above average
  • February mean temperature 1 C above average

This yields an mean melt season temperature 1.5 C above average compared to 2020 that had a mean average temperature 0.5 C above average.  The most anomalously warm month was November. This led to a mostly snow free ice cap by January 10. The ice cap then experienced a month of mostly snow free conditions with the darker ice melting more rapidly then the snow would. This in particular will lead to marginal retreat of the ie cap along bare rock margins.

Screenshot

Eagle Island Ice Cap in Sentinel image from Jan. 10, 2023 illustrating only 15-20% snowcover left.

eagle-2-2020

Eagle Island Ice Cap, Antarctica in Landsat images from Feb. 4, 2020 and Feb. 13, 2020.  Point E indicates an are area of snow/firn that is saturated with meltwater. Point A and B indicate locations where the amount of bare rock/ground and hence albedo have changed dramatically.