Volcan Peteroa Glaciers Argentina/Chile Fragment During Snow Cover Free Summers

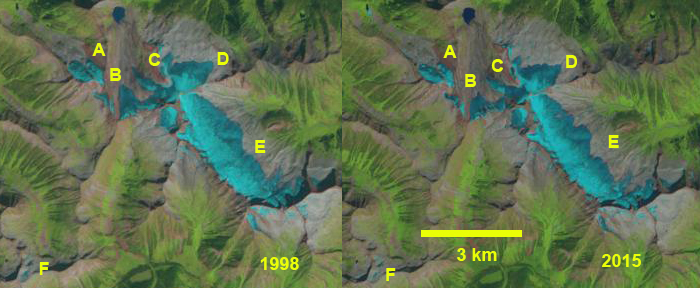
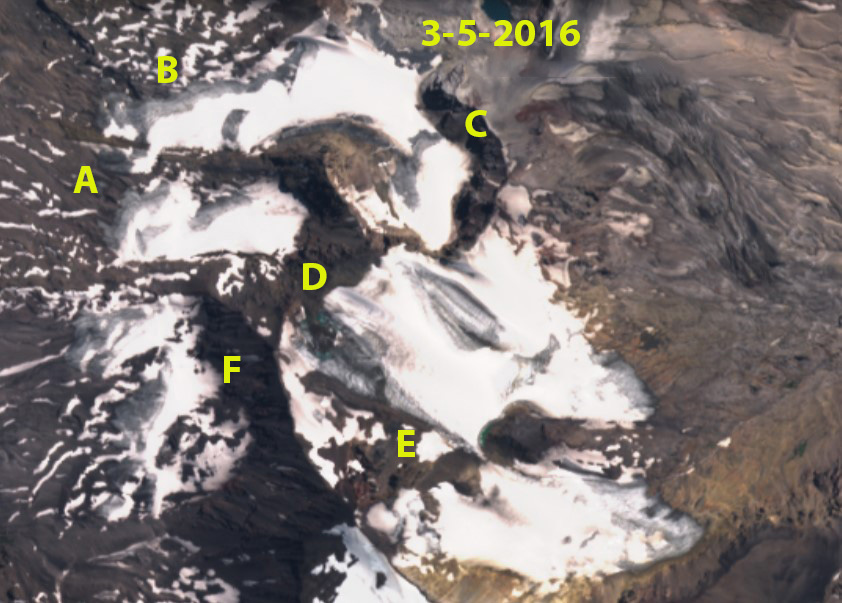
Volcan Peteroa glaciers in Sentinel images from March 2016 (below) and March 2023 (above). This illustrates fragmentation, 50% area loss, and a new lake formation. All the result of repeated snowcover free glaciers. 

For an alpine glacier to survive it must remain mostly snowcovered throughout the year, even at the end of the summer. This is one reason for the majesty of glaciated mountains, they shine brightly even in summer.  This summer in the Central Andes of Argentina and Chile, just as in 2022, I have chronicled the near total loss of snowpack due to summer heat waves, leading to dirty/dark glaciers (Pelto, 2022).  The heat wave this summer led to maximum temperature anomalies 3-5 C during the first half of March in the Central Andes of Argentina (SMN Argentina, 2023). An ice surface melts faster than a snow surface and the darker surface of the glacier also enhances melt rate leading to more rapid area and volume loss. This includes fragmentation and rapid expansion of bedrock areas amidst the glacier, other regional glacier obsrvations include: Sollipulli Glacier, Rio Atuel Glaciers, Palomo-Cipreses Glacier and Volcan Overo Glaciers,Here we examine Volcan Peteroa glaciers on its north flanks, which straddles the Chlile-Argentina border during the 2016-2023 period using Sentinel images. Reinthaler et al 2019 observed a ~2% annual area loss of Volcan Peteroa glaciers.

Here we examine the impact of several years of snow cover loss on the Volcan Peteroa glaciers. In 2016 it is evident there are six key ice masses on the north flank of the glacier A-F, with a combined area of 4.5 km².  In 2022 early snowcover loss led to rapid glacier thinning and lake formation, see below.  In 2023 the glacier at Point A has contracted by 50% to 0.22 km². At Point B and C the glacier has separated and is now two fragments with area of 0.36 km²  and 0.12 km² respectively. At Point D a new lake has expanded rapidly in 2022 and 2023, the lake has an area of 0.12 km² and the glacier a area of  1.21 km².  At Point E the glacier fragmented and pulled away from D and its two fragments have an of 0.36 km². At Point F the glacier has melted away. The combined area of 2.27 km² is ~50% of the glacier area just seven years prior. This is much faster than the 2% loss of the 1986-2015 period. The significant darkening of the snowfree surface will speed the loss of this glacier that no longer has a consistent accumulation zone.

Volcan Peteroa Glacier in false color Sentinel image continues to fragment with ~2% retained snowcover in 2022.  New lake at Point D. A small fragment of ice is apparent at Point F. and bedrock expansion at Point A. New lake has also formed.

Snowcover Free Glaciers Generates Fragmenting in Central Andes, Chile

Snowcover free glaciers in the Central Andes in 2014 ad 2023 Landsat images. The ongoing fragmentation and retreat is evident at Point A-H, see closeup details below. The glacier as Point B has melted away, At Point G and H glacier tributaries have separated from the Norte Cipreses Glacier in the valley below. At Point D-F expanding bedrock areas amidst glacier driving further fragmentation. Glaciers at Point A and C rapidly melting away. 

Palomo Glacier and North Cipreses  are three comparatively large glaciers in the Central Andes of Chile. The three glaciers are adjacent to each other with the Palomo and Coton Glacier feeding  the Rio Cortaderal. Rio Cortaderal is part of the Cachapoal River watershed that supplies two Pacific Hydro projects; a 110 MW run of river project at Chacayes and a  78 MW Coya run of river project. Norte Cipreses Glacier feeds the Rio Cipreses. These glaciers are important water resource from December-March Bravo et al (2017) quantified this resource for adjacent Universidad Glacier, which supplied 10-13% of all melt season runoff to the Tinguirica Basin. La Quesne et al (2009) reported that Palomo Glacier retreated 1160 m from 1955-1978 and advanced ~50 m 1987-2007, due tot Palomo Glacier having an equilibrium balance durng the 1987-2000 period. Pelto (2022) reported a retreat of the glacier front of 1250 m from 2002-2022.  Here we examine the changes of this glacier from 2014-2023 using Landsat 8 and 9 images along with Sentinel images, that illustrate the impact of essentially snowcover free glaciers during the summer of  2022 and 2023 due largely to a January heat wave in 2022 (Washington Post, 2022) and February heat wave in 2023 (Pelto, 2023).

Point A is a small glacier in a south facing cirque below Alto de los Pejerreyes. From 2014 to 2023 area declined from 0.3 km² to 0.1 km². There is remanent glacier ice, but this is no longer active ice and will soon disappear. At Point B in 2014 the area of remanent glacier ice is 0.1 km², by 2023 it is gone. At Point C the glacier has declined from  0.35 km² to 0.15 km² and retreated 300 m from 2014-2023.  At Point D a bedrock area amidst the Maria Angeles Glacier, has expanded from 0.04 km² to 0.20 km², this reflects the lack of flow now reaching the terminus, which retreated 700 m from 2014-2023. At Point E the glacier has retreated 300 m and is separating into three fragments. At Point F the bedrock area amist Palomo Glacier has expanded from 1.1 km² to 1.7 km² between 2016 and 2023. This again reflects diminineshed flow to the terminus which has retreated 800 m during this period, ~100 m/year.  At Point G two glacier tongues connected to the Norte Cipreses Glacier in the valley below in 2014. By 2018 they had nealy separated and by 2023 they had completely separated from the glacier below, retreating 200-300 m to the top of this bedrock step. At Point H, the glacier disconnected from Norte Cipreses Glacier in the valley below after 2002 and retreated 300 m from 2014-2023. There is also a new expanding bedrock area high on the glacier, Point I below. The story is not unique with Sollipulli Glacier to the south and Rio Atuel glaciers in the next watershed to the east also having lost their snowcover in 2022 and 2023.

Retreat of Palomo Glacier from 2016 (red arrow) to 2023 (yellow arrow), 800 m. Separation of tributaries at G, yellow arrows that had fed Norte Cipreses Glacier. False color Sentinel images.


Glacier loss at Point B, Glacier retreat at Point C, yellow arrows marks 2016 location. Bedrock expansion at Point D, E and I. retreat from green arrow to yellow arrow of the Maria Angeles Glacier terminating near Point D. Glacier retreat at Point H, yellow arrows marks 2016 location. False color Sentinel images.

Glacier O’Higgins, Chile Rapid Calving Retreat 2016-2023

Glacier O’Higgins in February 16, 2023 Sentinel image with the 2002, 2016 and 2019 terminus also indicated. Point D marks a detached lobe on of ice on the northern margin in 2023. Point F marks the southern margin terminus front.

Glacier O’Higgins is a large outlet glacier of the Southern Patagonia Icefield (SPI) that terminates in Lago O’Higgins. Cassasa et al (1997) report that from 1896-1979 the glacier had retreated 13.8 km up an inlet of Lago O’Higgins.  The glacier remained stable in this position from 1979-1986 with a retreat of 800 m from 1986-1995.  Schaefer et al (2015) examined the mass balance of SPI and found Glacier O’Higgins had a calving flux of 2.15-2.97 cubic kilometers/year, and a calving front velocity of 2300 m/year. Malz et al (2018) noted a mean elevation change of -1.04 m/year for Glacier O’Higgins from 2000-2016, with the greatest thinning near the terminus.  Despite this thinning there is limited retreat during this period as the glacier terminated on a shallow bedrock sill (Gorlet et al 2016). They observed that the bed elevation of O’Higgins dropped off into a deeper basin beyond this ~1 km wide sill and remained below sea level for 15-20 km inland of the 2012 ice front location. Here we use 2016-2023 Landsat imagery to update changes observed from 1986-2018.

Topographic map of the terminus area of Glacier O’Higgins, with the ~2016 terminus. Note the elevation step at both the 2016 terminus sill and the sill just upglacier of the 2023 terminus.

From 2002-2016 retreat is limited with the terminus located on a sill, then in 2016 the glacier begins to retreat off of the sill into the deeper sub-glacial basin leading to a rapid retreat from January 2016 to February 2019 of  1900 m on the southern margin, 1800 m in the center and 600 m on the north side, with total recession of 3.0 km². The calving front was 1.75 km widenwith the glacier having retreated into a confined channel. From 2019-2023 the rapid retreat across the sub-glacial basin continued isolating a stagnant region on the north side of the terminus (Point D). The main calving front in 2023 is 1.6 km long with the stagnant region still calving as well. The recession from 2016-2023has been 7 km² with 4 km² from 2019-2023.  The retreat since 2016 has been 3000 m on the northern margin, 3700 m in the center and 3500 m on the souther margin. The glacier along the southern margin in 2023 is near the next bedrock sill as identified by Millan et al (2019).  The sub-glacial basin between sills is ~4-5 km across, helping drive the rapid retreat across the basin. This is evident in the topographic map as well. The northern terminus still is over deep water, and has ~1 km to retreat to reach the sill crest.  Millan et al (2019) Figure 3 illustrates this is a wide sill that should provide short-term terminus stability until further thinning driven by mass balance losses leads to retreat much as occurred from 2000-2016. The retreat of this glacier is similar to that of Dickson Glacier and Upsala Glacier.

Glacier O’Higgins in Jnauary 9, 2016 Sentinel image Point D marks a detached lobe on of ice on the northern margin in 2023. Point F marks the southern margin terminus front in 2023.

Glacier O’Higgins in February 10, 2019 Sentinel image . Point D marks a detached lobe on of ice on the northern margin in 2023. Point F marks the southern margin terminus front in 2023.

Glacier O’Higgins in February 16, 2023 Sentinel image with the 2002, 2016 and 2019 terminus also indicated. Point D marks a detached lobe on of ice on the northern margin in 2023. Point F marks the southern margin terminus front. LM marks the lateral moraine from the Little Ice Age. FF is the forefield that has been deglaciated for ~50 years.

Rio Atuel Glaciers, Argentina Stripped of Snowcover February 2023

Snowcover loss on Cofto, Fiero and Del Humo Glacier in Sentinel images from January 13 and February 9, 2023, snowpack diminished from 45% to less than 3%.

Rio Atuel drains from the high Central Andes in Western Argentina and is a snow and glacier fed system In the headwaters region there are a series of glaciers that have been losing mass and retreating.The most negative mass balance rates from 2000–2018 in this region of Argentina were in the  Atuel basin at −0.70  m/year (Ferri et al 2020). Both minimum and annual discharge in the Rio Mendoza has diminished from 1980-2010 (Lauro et al 2019).

Here we examine the snowcover loss between January 13 and February 9, 2023 on four of these glaciers from south to north Fiero, Corto, Del Humo and La Laguna. In mid-January snowcovered 40-50% of these glaciers. After a significant heat wave from January 28-Feb. 9. the snowcover had declined to less than 3% with six weeks left in the melt season.  This is the second year in a row these glaciers have lost all snowcover. This has further concentrated light absorbing particles at the surface, decreasing albedo, and increasing glacier melt. The glaciers simply put look quite dirty.  This is a cumulative process that is enhanced by consecutive high melt years and causes rapid volume loss.  Shaw et al (2020) found a significant ongoing decline in ice albedo in these region of the Andes that is impacting their overall mass loss.  The increased frequency of heat events continues to enhance melting of Central Andean glaciers. This process is playing out this year on Sollipulli Glacier and in 2022 on many Central Andean glaciers.

Snowcover loss on La Laguna Glacier in Sentinel images from January 13 and February 9, 2023, snowpack diminished from 40% to less than 3%.

Volcan Overo is a 4619 m high Andean mountain in Argentina with a relatively low sloped broad summit region above 4000 m. The summit region is host to a glacier complex that is shrinking and fragmenting. In mid-January, 2022 the glacier has lost all of its snow cover. Volcan Overo in February 2023 the glacier complext has again lost all snowcover, which is leading to furtherfragmentation at the yellow arrows, even since 2022.

Volcan Overo in 2022 and 2023 having lost all of its snowcover. Expanding lakes at blue arrows.


Sollipulli Glacier, Chile Rapid Melt: Fire and Ice February 2023

Sollipulli Glacier, Chile snowcover loss during summer 2023 heat wave in false color Sentinel images from January 20-Feb. 9. Snowcover delcined from 94% to 12% in 20 days.

Nevados de Sollipulli is a volcano, is in the central Andes of Chile near the border with Argentina in Parque Nacional Villarica, Chile. The 4 km wide summit caldera at ~2100 m is filled by a glacier.  In 2022 the summer heat waves stripped the glacier of all snowpack in January and that persisted through March, see below (Pelto, 2022). The volcano is dormant last producing lava flows 700 years ago and last erupting 2900 years ago (NASA, 2017). Reinthaler et al (2019) identified a 27% decline in glacier area from 1986-2015 on 59 volcanoes in the Andes. The study included Sollipulli where the area declined from 16.2 kmin 1986, 20 12.5 km2 in 1999 and 11.1 km2 in 2015 (Reinthaler et al 2019). Here we examine Landsat imagery illustrating the recession from 1986-2022 and the loss of all snowcover for most of the summer of 2022. The summer of 2022 led to early summer loss of most/all the snowpack on Central Andes glaciers from 30-40 S. (Pelto, 2022).

This summer central Chile has experienced a persistent extreme heat wave that has generated ongoing disastrous forest fires (NASA EO, 2023), CONAF continues to update the fire area daily. Most of the Solllipulli Glacier is at  2000-2200 m elevation, CECS has a weather station at 1900 m on nearby Volcan Villarrica that had a high temperature on Jan. 29 and Feb. 4 of  over 24 C. The highe tempertature has been above 16 C everday from Jan. 28 to Feb. 8 (see below). This has led to the snowcover diminishing rapidly on Sollipulli Glacier from January 20 to February 9, 2023. The glacier was 94% snowcovered on Jan. 20, 84% on January 30, 35% on Feb. 4 and 12% on Feb. 9. How long until it is down to 0%? This blog will be updated in this coming week to identify that and to better quantify the heat. By February 17, 2023 snowcover is down to 1%

Sollipulli Glacier, Jan. 20, 2022 and fifty five days later the glacier is still bare of snowpack.

Sollipulli Glacier on Feb. 17, 2023 in false color Sentinel image, 1% snowcover left.

Temperature from the CECS station on Volcan Villarica at 1900 m. showing the average minimum and maximum.


Burroughs Glacier, Alaska Down to Last 1%

Burroughs Glacier in 1986 and 2022 Landsat images. The red arrow marks the west margin and the yellow arrow the east margin in 1986. Yellow dots mark the outline of the glacier in 2022. Glacier area declined from 12.5  km² to 1.5 km² during this 36 year period.

Burroughs Glacier in Glacier Bay National Park, Alaska has been retreating without pause since 1892 when it was part of the Muir Glacier complex. The glacier is unusual in that it has not had an accumulation zone over the last century, where snow persists through the year. Without an accumulation zone a glacier cannot survive (Pelto, 2010). Mickelson (1971) summarized the retreat of the glacier from 1892-1960. In 1892 the Burroughs ice plateau was assessed as a 10 km by 25 km ice cap. By 1960 it had thinned by as much as 750 m and its calving margin had retreated 27 km.. By the 1970’s the glacier was essentially stagnant (Molnia, 2008). In 1982 I briefly visited the western terminus, which provided a still imposing slope, made more so by the rain and clouds lowering onto its surface.

Here we examine the glacier in Landsat imagery from 1986 to 2022 to illustrate the retreat, the lack of snowcover  and the thinning. In the 1948 map of Burroughs Glacier, the glacier is 12.1 km long, and much of the glacier is already stagnant, the glacier has both a north and south terminus, purple arrows. To the west of Burroughs Glacier is Plateau Glacier (P).

burroughs map

Burroughs Glacier in 1948 USGS map.

In 1948 Burroughs Glacier has an area of 22 km² and is 12.5 km long, with the crest of the glacier at ~1500 feet. In 1986 Burroughs Glacier has an area of 12.5 km² and has no snowcover by mid-summer. The glacier terminates in proglacial lakes at both the north and south terminus red and yellow arrow respectively, and is 9 km long, purple arrows indicate 1948 terminus. By 1986 Plateau Glacier has only three small remnants marked by P, surrounding these vegetation is still limited, with considerable expanse of bare glacial sediments. By 2003 Plateau Glacier is gone and vegetation is filling in most of the area that was still bare sediment in 1986. In 2003 Burroughs Glacier again lacks any snowcover. The southern terminus has retreated 2.2 km from the lake, and the northern terminus has retreated into a second lake basin. The glacier is 6.3 km long, half of its length in 1948. In 2004 snowcover is again lacking anywhere on the glacier. In 2010 snowcover is lacking and retreat has continued shrinking the glacier to 5.4 km in length.  The glacier was assessed with an area of 2.8 km² and a median elevation of  313 m (1025 feet) by GLIMS. In 2013 the glacier lacks snowcover in this September Landsat image even though snow has returned to the surrounding mountains. This indicates how far below the snowline the glacier lies. Portions of a glacier are supposed to be the first locations that receive snowcover. The terminus has continued to retreat and the glacier was 4.6 km long in 2013. The northern terminus was retreating into a third basin of the proglacial lake. Vegetation has reclaimed almost all of the Plateau Glacier area and has reclaimed the region deglaciated by Burroughs Glacier before 2003. By 2022 the glacier area has been reduced to 1.5 km², this is just 12% of its area remaining from 1986 and 1% of the 1892 area.  The length of the glacier in 2022 is 2.3 km, only 50% of the lenght just a decade ago, and ~20% of the 1948 length.

Thinning of this glacier from 1948-2016 is evident from a comparison of topographic maps. Thinning in remaining glacier are averages 225 m during this period, that is a rate of ~3.3 m/year. Larsen et al (2007) had found a thinning rate of ~3 m/year for the 1948-2000 period.

Overlay of 1948 (blue labeled contours) and 2014 elevation map (Brown labeled contours) for Burroughs Glacier.

Burroughs Glacier has not been in equilibrium with climate since the end of the Little Ice Age. Its retreat has been hastened by the rising snowline of the last decade note by Pelto et al (2013) on Brady Glacier. This glacier area has declined by 88% since 1986, with volume loss being even larger.  Retreat usually increases as elevation declines and as the size of the remnant ice declines. There is no debris cover or persistent snowcover to slow the loss. Thus, it seems likely this glacier will be gone within 25 years. The 2011 Google Earth image at bottom indicates no snow, the reduced albedo from the dirty surface and a few crevasses near the margin that are collapse features. This is unlike nearby glaciers that are retreating significantly but not disappearing, like Brady Glacier, Geikie Glacier, Yakutat Glacier and Riggs Glacier. 

r.

1986 Landsat image of Burroughs Glacier. The  purple arrows mark the 1948 margin, red arrow the west margin in 1986 and the yellow arrow the east margin.

2003 Landsat image of Burroughs Glacier. The red arrow marks the west margin in 1986 and the yellow arrow the east margin.

2004 Landsat image of Burroughs Glacier. The red arrow marks the west margin in 1986 and the yellow arrow the east margin.

2010 Landsat image of Burroughs Glacier. The red arrow marks the west margin in 1986 and the yellow arrow the east margin.

2013 Landsat image of Burroughs Glacier. The purple arrows mark the 1948 margin, red arrow the west margin in 1986 and the yellow arrow the east margin in 1986, pink arrows the 2013 margin.

2022 false color Sentinel image of Burroughs Glacier. The ice is dirty but not debris covered at this point.


Grasshopper Glacier, Wyoming Disintegration Underway

Grasshopper Glacier, Connie Glacier, J Glacier and Sourdough Glacier in 1966 map (black outline of glaciers) and in 2022 false color Sentinel image (green dots for glacier outline). The area of Grasshopper Glacier declined from 3.28 km² to 0.81 km². Closeup of area in 2021 and 2022 illustrates the many glacier fragments.

Grasshopper Glacier in the Wind River Range of Wyoming has a southern terminus calving into a lake, and a northern terminus. The southern terminus is calving and retreating expanding the unnamed lake it terminates in and retreated 350 m from 1966-2006 (Pelto, 2010).  The northern terminus retreated 730 m from 1966-2006 the most extensive retreat in the Wind River Range. (Pelto, 2010). The main accumulation area on the west side of the glacier has become segmented by large bare rock areas as noted by comparing the 1966 map and 2006 image. The area declined from 3.28 km² to 2.34 km², a 27% decline (DeVisser and Fountain, 2015).  Thompson et al (2011) noted a 38% loss in area of the 44 Wind River Range glaciers from 1966-2006. Maloof et al (2014) noted an even larger drop in volume of 63% of the same glaciers from 1966-2012.The combined retreat of the two terminus is over 1000 m is 26% of its 1966 length of 3.8 km. In 2006 it was clear that the significant thinning and marginal retreat at the head of the glacier was symptomatic of a glacier that would disappear with current climate.  Here we return to examine how this glacier has fared particularly in the exceptionally warm summers of 2021 and 2022 using false color Sentinel images and comparison with the 1966 map.

In 2021 and 2022 the glacier was nearly snowless by the end of August, this resulted in significant thinning and marginal recession. In 2021 and 2022 there are six glacier fragments with remaining glacier ice that are no longer connected to the glacier. In 2022 the glacier area has declined to 0.81 km², a 75% loss in area since 1966 and a 66% loss since 2006. The overall length from the north to south terminus is now 2.1 km in 2022. What is leading to the rapid area loss is the lack of avalanche accumulation on this glacier and increased summer temperatures, leading to additional ablation. The length is declining less than the area, because the central axis of the glacier has the thickest ice. Because the glacier in many years such as 2021 and 2022 has retained no snowpack, and any snowpack that had been retained in other years, as firn, has also been lost, the glacier no longer has an accumulation zone. With current climate it still will disappear. This is the same forecast as for most Wind River Range glaciers, such as Sacagawea and Mammoth.

Grasshopper Glacier in September 2021 and 2022 false color Sentinel images. Separated glacier fragments numbered 1-6.

Google Earth image with outline of glacier in 2006 and 1966 map outline in orange.

Grasshopper Glacier southern terminus in 2012 Sarah Meiser image.


Marconi Glacier, Chile Fragmentation and Retreat 1986-2022

Marconi Glacier in Landsat images from 1986 and 2022. Red arrows=1986 terminus locations, yellow arrow=2022 terminus location. Tributaries labelled 1-6, bedrock divides A-D and LE=Lago Electrico. In 1986 Lago del Marconi does not exist, by 2022 it is apparent at red arrow.

Marconi Glacier, Argentina is one of the more common routes onto the Southern Patagonia Ice Cap (SPI) via Marconi Pass. The glacier is no longer fed by the ice cap itself. The glacier drains into Electrico Lake and Rio Electrico. The good news is despite the name Rio Electrico will not be developed, since it is in Parque Nacional Los Glaciares, Argentina.  A decade ago I wrote about the retreat of this glacier, noting an overall retreat from 1986 to 2012 of 800-850 m. Here we update the changes in the glacier observed in Landsat imagery from 1986 to 2022. This encompasses nearly the entire history of nearby Argenitne trekking captial El Chalten, created in 1985, with routes to Lago Electrico.

In 1986 the glacier ends in the valley bottom, without a proglacial lake km from Electrico Lake, red arrow.  The glacier has one connection to the SPI with Tributary 2 at Point D. The glacier has already separated from Tributary 1. Tributary 4 and 5 are not separated at this time. In 2002 the glacier retreat has exposed a new developing proglacial lake, Lago del Marconi and a lateral moraine is developing at Point B.  By 2012 the glacier has retreated from the Lago del Marconi  it ended in. In 2015 there is exposed bedrock at Point B, Tributary 6 is still only separated by a lateral moraine from Tributary 5. In 2022 the glacier is no longer connected to the SPI. The bedorck areas at Point A-C have significantly expanded further separating Tributaries 3-6. Tributary 6 has fragmented no longer connecting to the main glacier. From 1986-2022 Marconi Glacier has separated from two key tributaries, this fragmentation a common result of signficiant retreat and glacier thinning. Retreat from 1986-2022 of Marconi Glacier is 1200 m, and for Tributary 1 is 1000 m.

Average thinning of this glacier from 2000-2015 was reported as 1.5 m/year by Malz et al (2018). From 2011-2017 Forestra et al (2018) found a similar rate of thinning. The rising snowlines, drive thinning and then retreat similar to other SPI glaciers such as San Lorenzo Sur Glacier , Oriental Glacier and Lucia Glacier.

Marconi Glacier in Landsat images from 2002 and 2015. Red arrows=1986 terminus locations. Tributaries labelled 1-6, bedrock divides A-D and LE=Lago Electrico.

Marconi Glacier in Sentinel image from 2-24-2022.  Tributaries labelled 1-6, bedrock divides A-D and LE=Lago Electrico.

Tenderfoot Glacier, BC Fragmentation Accelerates

The glaciers of Tenderfoot Mountain in 1987 and 2022 Landsat images illustrating the decline in area and fragmentation. Tenderfoot Glacier B-C has lost more than 70% of its area and fragmented. Glacier D and E have experienced recession along their broad lower margins. Glacier F has disappeared

Tenderfoot Mountain has an array of glaciers on its flanks that have been rapidly losing area and fragmenting. One of these is Tenderfoot Glacier (B-C) that feeds into the Lardeau River in the Kootenay Lake Watershed. The glacier filled a north facing basin with an area of  km² in the 1980’s topographic map of the area. This is a region where glaciers are struggling.  Bevington and Menounos (2021) inventory of glaciers in Western Canada identified an increase rate of loss in this Southern Interior Range from 6.6 km²/year during the 1984-2010 interval to 22.1 km² per year from 2011-2020. They identified for the region that 14,329 glaciers larger than 0.05 km2 existed in 1985, of these 13,270 glaciers larger than this threshold remained by 2020, this represents an 8% decline in the number of glaciers. They also identified an +300% increase in fragmentation of glaciers. Here we examine a sequence of Landsat images from 1987-2022 to illustrate the changes in the Tenderfoot Mountain region that and suppliment with a Sentinel 2022 false color satellite image.

In the National Topographic map the area of Tenderfoot Glacier had an area of 1.8 km² with the eastern tributary C feeding the main glacier (B).  By 1987 the eastern Tributary (C) is nearly disconnected from Point B. There is a small cirque glacier at Point F. The glacier at Poit A is 0.6 km². In 1987 the combined area of the slope glaciers (D and E) is 5.0 km². In 1998  the Tenderfoot Glacier has not retained any snowcover illustrating why this glacier is more prone to both fragmentation and disappearing. By 2015 Point A glacier is beginning to fragment as well. By 2022 the Tenderfoot Glacier has three fragments with a combined area of 0.5 km², a 70% loss in area since 1987. The glacier at Point A has declined to 0.3 km². The glacier at Point F is gone. The combined area of Glacier D and E had declined to 3.4 km²  a 30% decline. Tenderfoot Glacier did not retain any snowcover in 2021 or 2022, illustrating that it cannot survive even present climate. The Lardeau River is known Kokanee salmon . The Kokanee salmon population collapsed in Kootenay Lake after 2014 from 1 million to ~12,000 in 2017, rebounding somewhat to 90,000 in 2020 before declining again to 24,000 in fall 2021 (Nelson Daily, 2021).

Kokanee Glacier is another example of a struggling glacier in the region that Ben Pelto has monitored since 2014, too often with little snowcover by the end of summer, see below.

Tenderfoot Glacier in Canadian Topographic map and October 1, 2022 false color Sentinel image. Point B and C indicate two segments of the Tenderfoot Glacier that have now fragmented.

The glaciers of Tenderfoot Mountain in 1987 and 2022 Landsat images illustrating the decline in area and fragmentation. Tenderfoot Glacier B-C has lost more than 70% of its area and fragmented. Glacier D and E have experienced recession along their broad lower margins. Glacier F has disappeared.

Kokanee Glacier in 2021 stripped bare of snowcover, with a relatively dirty surface (Ben Pelto-image).

King George Bay, Antarctica Glacier Retreat Expands Turret Point Oasis and Releases New Island

King George Bay Glacier retreat releases a new island (Point B) and expanded ice free oases in 1989 and 2022 Landat Images. Point A marks an area where the glacier had reached the coast until after 2005. Point B is the new island, Point C= new oasis, PI=Penguin Island, TP=Turret Point Oasis

King George Bay is on the southeast coast of King George Island. This coastline is comprised mainly of glacier margins ending in th sea, with limited ice free areas. The east end of the bay features the Turret Point Oasis, with Penguin Island just offshore. This oasis is a location used for breeding by Chinstrap and Adelie Penguins, and is a significant breeding area is for southern giant petrels, and Antarctic ‘blue-eyed’ shags. Elephant seals and fur seals are numerous in the latter part of the season (Korczak-Abshire,et al 2018). Here we examine Landsat images from 1989-2022 to identify changes in the glacier margin and the impact on this oasis and generation of a new island.

King George Bay Glacier retreat releases new island in Sentinel images from 2018 and 2022. Point A marks an area where the glacier had reached the coast until after 2005. Point B is the new island, Penguin Island=PI, TP=Turret Point, Point C is the new oasis.

In 1989 the Turret Point Oasis had an area of ~1 km². The King George Bay Glacier terminated on a bedrock rise at Point B. The glacier reached the coast between Turret Point and Point A. To the west there is no other ice free coastline, Point C. In 2005 the glacier was still terminating on the bedrock rise at Point B. The glacier is still reaching the coast between Point A and Turret Point and there is no ice free area near Point C. By 2018 there is a narrow finger of ice connecting to the Point B Bedrock rise and the shoreline between Turret Point and Point A is now free of glacier.  there is a small strip of ice free coast near Point C. In 2022 the glacier has receded from the new island at Point B. The retreat at Point B is 950-1000 m since 1989, with a similar retreat across the broad front of the King George Bay Glacier to Point C.  Glacier retreat from the shoreline near Point A has been 400 m. The Turret Point Oasis has expanded to 2 km², a doubling in size that expands oppportunity for greater diversity of flora and fauna.  There is a new ~0.6 km² oasis that has formed at Point C.  This is a narrow 200-400 m wide strip that is 1.7 km long. In the false color Sentinel images red indicates plant life for 12-24-2022 the Point C oasis does not have enough flora to be visible. This is in contrast to Turret Point and Penguin Island. The retreat here fits the pattern seen further west on King George Island on the Warsaw Ice Cap.

In 2016 the Arctwoski Station research survey found ~150 pairs of breeding Adlelie Penguins and 220 breeding pairs of southern giant petrels (Korczak-Abshire,et al 2018). In the Antarctic Treaty Turret Point oasis has specific visitor guidelines.  The confluence of threats from climate change and human activity (Lee et al, 2022) makes Turret Point an important location to monitor. The retreat of glaciers opening up new potential breeding and feeding areas has been observed at Stephenson Lagoon on Heard Island and at Hindle Glacier on South Georgia.

Map illustrating  locations bird and penguin species onTurret Point and Penguin Island from a UAV flight in 2016 from Korczak-Abshire,et al (2018)

King George Bay Glacier false color Sentinel image. Vegetation is evident on Turret Point=TP and Penguin Island=PI, but not at Poiunt C oasis.

Loss of Hinman Glacier, North Cascade Range 1958-2022

Himan Glacier in 1958 USGS map and in 2022 Sentinel 2 False Color image. The three ice masses with an area greater than 0.01 km² are indicated.

Hinman Glacier had descended the northwest flank of Mount Hinman in the North Cascades, Washington and based on 1958 aerial photographs, Hinman Glacier the USGS had listed this as the largest glacier in the North Cascades south of Glacier Peak with an area of 1.3 km² (Post el al 1971). In 2022 the glacier is gone with the largest relict fragment of ice at 0.04 km². This is the story of this glaciers demise that as documented by the North Cascade Glacier Climate Project, that for 40 years has observed in the field the response of glaciers to climate change.

Hinman Glacier in 1988 with 4 distinct ice masses.

In the 1960’s the glacier extended from the ridge top of Mount Hinman at 2250 m to the bottom of the valley at 1675 m. In 1988, Hinman Glacier from the west was  a group of four separated ice masses that we surveyed. The amount of blue exposed that year indicates the glacier lacked a consistent accumumulation zone. This is indicative of a glacier that cannot survive (Pelto, 2010).  In 1992 we mapped the largest of these remaining ice masses at 0.12 km², this was another year with only pockets of blue ice left. In 1998 the glacier has a few areas of blue ice are seen, the glacier was 20% of its mapped size 0.25 km².

In 2005 we observed how thin the ice was including being able to see rock at the bottom of several crevasses  (see below). In 2006, from a Google Earth image,at this point the glacier is no longer detectable under the snowcover that persisted that summer, note the map outline and the gorgeous new “Hinman” Lake  The new lake is 1 km long. A 2009 view from the far end, north end of Lake Hinman up the valley and mountain side that was covered by the Hinman Glacier, now 90% gone. Each of the two larger ice masses from 1998 is now divided into at least two smaller portions. By 2022 the ice fragments have further diminished with the largest just 0.04 km2, less than 4% of its 1958 size. The tendency of this former glacier to be bare of snowcover by late August in many years, is what led to the rapid loss. This same story is playing out on Foss Glacier on the other side of the ridge, though not as quickly.

Hinman Glacier thin sections of ice fragmenting in 2005.

The loss of glacier area of this glacier and in the Skykomish River Basin has impacted summer runoff in the Skykomish River watershed. From 1958-2009 glacier area declined from 3.8 km² to 2.1 km²,  (Pelto, 2011), and in 2022 has further diminished to 1.7 km², a 55% reduction. We have monitored all four major glaciers in the basin Columbia, Foss,  Hinman and Lynch Glacier, the primary glaciers in the basin, declined in area by 25%, 70%, 95% and 40% respectively since 1958. Despite 15% higher ablation rates during the 1985-2022 period, the 55% reduction in glacier area led to a 40-50% reduction in glacier runoff between 1958 and 2022. The impact on the Skykomish River is evident.

Glacier runoff on Hinman Glacier heading the Skykomish River. Streams like this used to drain across the glacier all summer long. Now they no longer exist to feed the Skykomish in late summer.

A key threshold of in-stream flow levels considered insufficient to maintain short term survival of fish stocks is below 10% of the mean annual flow (Tennant, 1976).   For the Skykomish River 10% of mean annual flow is 14 m3s-1.  In the Skykomish River from 1958-2021 there have been 363 melt season days with discharge below 14 m3s-1.  Of these only three occurred before 1985, and 67% have occurred since 2003. The loss of 55% of the glacier runoff is a key reason for the onset of critical low flow days. Of more concern for aquatic life is the occurrence of extended periods of low flow (Tennant, 1976). From 1929-2021 in the Skykomish River basin there have been 12 years where streamflow dropped below 14 m3s-1 for 10 consecutive days during the melt season, 1986, 1987, 1992, 1998,  2003, 2005, 2006, 2007, 2015, 2017, 2019, 2021 and 2022.  Precipitation has not declined during this interval, hence earlier snowmelt, reduced glacier runoff and greater evapotranspiration must be causing the increase in late summer low flow periods.

In 2022 a cool start to summer allowed snowpack to persist in the basin into August. Runoff was strong from Columbia Glacier on Aug.1 as we forded the outlet stream, see below. By September glaciers represented the main area of melt. An extended warm period extending into October led to persistent low flow conditions, below 495 cfs (14 m³/sec), from Sept 9.-Oct. 20.

The former Himan Glacier from the new”Hinman” Lake that has formed since 1958 with glacier retreat, 3 small ice patches remain in this 2009 view.

Hinman Glacier basin in 2006 Google Earth view, with “Hinman Lake”.

Himan Basin in Open Elevation map and in 2022 Sentinel 2 False Color image. 

Streamflow and temperature in the Skykomish River at the USGS site at Gold Bar. Period of low flow begins after flow drops below ~500 CFS.

(https://waterdata.usgs.gov/monitoring-location/12134500/)

Fording headwaters of North Fork Skykomish, which is the runoff from Columbia Glacier, on 8-1-2022. 

Lekhziri Glacier, Georgia Retreat Leads to Separation 1996-2022

Lekhrziri Glacier in 1996 and 2022 Landsat images illustrating the retreat and separation of the three tributaries central (Lc), eastern (Le) and western (Lw). Red arrow indicates 1996 terminus and yellow arrows the 2022 terminus locations

Lekhrziri Glacier has been the largest glacier in Georgia, and was until 2011 a compound glacier comprised of three tributaries joining a short distance from the terminus (Tielidze et al 2016).  Tielidze et al (2015) observed in 2011 that the central tributary separated from the east and west tributary that year at the headwaters of  the Mestiachala River Basin. From 2000-2020 Lekhziri Glacier experienced the largest retreat, of 1395 m, of 16 large Caucasus glaciers examined by (Tielidze et al 2022). Here we examine Landsat and Sentinel imagery from 1996-2022 to illustrate the changing nature of this glacier.

In 1996 the three tributaries joined at 2300 m and then flowed jointly south for 1 km to the terminus, red arrow on Landsat image. The August snowline is at 3300 m. By 2013 the central glacier has visibly separated by 500 m from the other tributaries. The primary terminus has had a retreat of ~500 m since 1996. The August snowline is at 3400 m in 2013. In 2022 additional retreat as separated the east and west tributaries, with an evident river emanating from each tributary, yellow arrows, feeding into the Mestiachala River. The central tributary terminates 800 m from the former junction. The retreat of the east tributary has been 1.3 km since 1996 and the west tributary 1.25 km since 1996. There is also a small lake that is evident, green arrow, in 2022 that will fill in with sediment.  The snowline at the end of August 2022 is at 3450 m. The persistent high snowlines due to warm melt season conditions has led to ongoing mass loss that will lead to continued declines in the Lekhziri Glacier system. This is one example of the widespread retreat of glaciers in the region chronicled by Levan Tielidze. The high snowlines of 2017 and 2022 have been noted for Gora Gvandra glaciers and Zeno Svaneti glaciers.

Lekhrziri Glacier in 2013 Landsat image illustrating the retreat and separation of the three tributaries central (Lc), eastern (Le) and western (Lw). Red arrow indicates 2013 terminus and purple dots the snowline.

Lekhrziri Glacier in 2022 Sentinel image illustrating the retreat and separation of the three tributaries central (Lc), eastern (Le) and western (Lw). Yellow arrows the 2022 terminus locations aand green arrows the small lake at headwaters of Mestiachala River Basin.