Great Glacier Retreat 1965-2023 Leads to formation of “Great Lake”

Great Glacier terminus change from 1986-2022 illustrating lake expansion. Red arrow=1986 terminus location, Yellow arrow=2022 terminus location. Terminus has retreated 2.1 km during this time with the lake growing 15 km2.

Great Glacier is the largest outlet glacier of the Stikine Icefield feeding the Stikine River. The name came from the large expanse of the glacier in the lowlands of the Stikine River during the late 19th and early 20th century, that has now become a large lake. In 2023 I worked on a signage project for the Great Glacier Provincial Park with Hailey Smith, BC Park Ranger, documenting the changes in this glacier particularly since 1914.

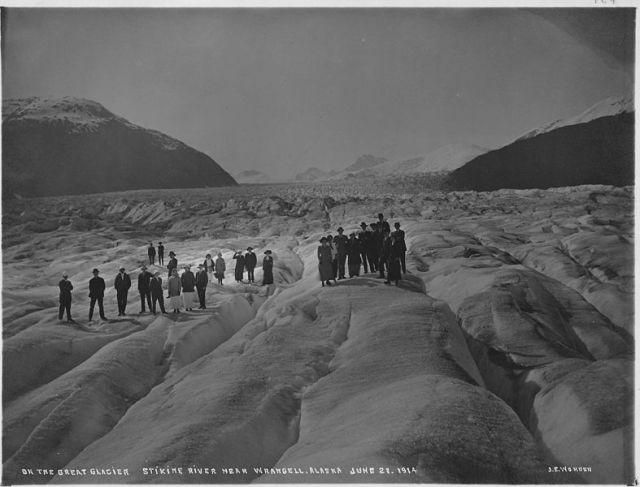
The glacier filled what is now a large lake at the terminus of the glacier pushing the Stikine River to the east side of the valley. The Tahltan nation oral history relates when the glacier bridged the Stikine River and meet Choquette Glacier. In 1914 the glacier was easy to ascend from the banks of the Stikine River, the picture above is from the National Railroad Archive. By 1965 the new lake had formed, but the glacier still reached the far side of the lake in several places as indicated by the 1965 Canadian Topographic Map below. R. Patterson (Writer and Canadian Explorer 1898-1984) noted that Great Glacier came down onto the river flats, and displayed a 7 km front visible from the Stikine River.

Map of Great Glacier in 1965 illustrating the fringing lake.
Landsat images from 1990 and 2022, illustrating changes in the glacier and lake. The transient snowline is at ~900 m in both images.

A comparison of 1986, 1990, 2011 and 2022 illustrates the retreat. By 1986 the new lake had largely developed, and the glacier was beginning to retreat into the mountain valley above the lake. Retreat from the moraines of the late 19th century was 3200 m. By 2011 the glacier had retreated further into valley, 900 m retreat from 1986-2011. From 2011 to 2022 the glacier retreated another 1200 m. The lake has expanded to an area of 15 km2

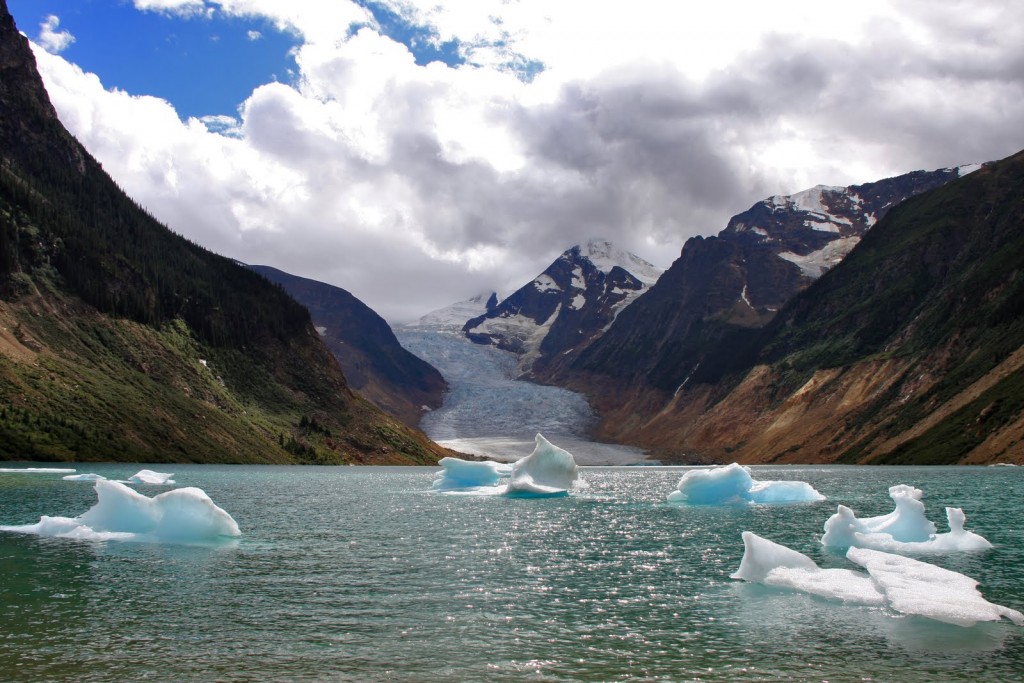
A view of the glacier from across the lake today indicates the distance to the now valley confined glacier, and the trimlines of the former ice surface, yellow arrows in middle image The Great Glacier has one major tributary on the northeast tributary that is very low in elevation with a top elevation of 800 m. Given the regional snowline of 1100-1200 meters in the 1980s (Pelto, 1987) this is too low to retain snowcover through the summer and will lead to rapid progressive thinning. In 2018 and 2019 the highest observed snowlines in the region occurred, the snowline averaged 1500 m, leaving just 10% of the Great Glacier snowcovered. This is instead of the 60% needed to maintain equilibrium. Stikine Icefield outlet glaciers are all undergoing substantial retreats including Sawyer Glacier, Baird Glacier and Dawes Glacier.

Great Glacier snowline end of summer in 2018 and 2019 reached the highest levels observed at 1500-1600 m.

Porcupine Glacier Major Iceberg Turns 3 Years Old, What Next?

Porcupine Glacier in Landsat images from 2016 and 2018 and 2019 Sentinel Image.  Iceberg A and Ice tongue B are indicated on each. The haziness in 2019 is forest fire smoke. The yellow arrows mark the 2019 terminus location.

Porcupine Glacier is a 20 km long outlet glacier of an icefield in the Hoodoo Mountains of Northern British Columbia that terminates in an expanding proglacial lake. During 2016 the glacier had a 1.2 km2 iceberg break off, the iceberg is still present. This is an unusually large iceberg to calve off in a proglacial lake, the largest I have ever seen in British Columbia or Alaska. NASA  generated better imagery to illustrate this observation. Here we examine the  change in terminus position and iceberg deterioration from 2016-2019  using Landsat images from 2015, 2016, 2018 and 2019.

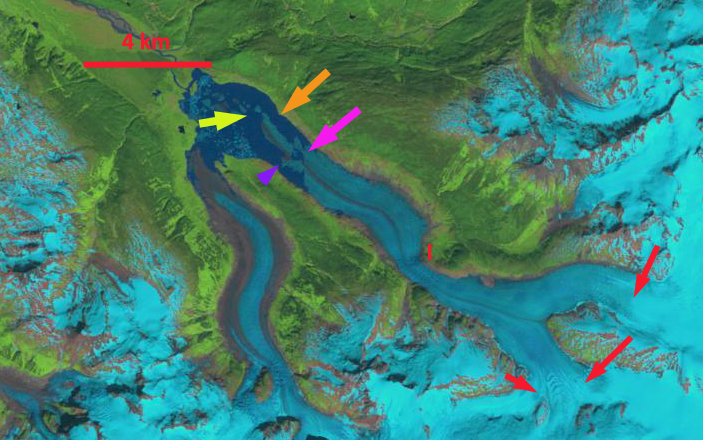
In 1988 a tongue of the glacier in the center of the lake reached to within 1.5 km of the far shore of the lake, red arrow (see below). The yellow arrow indicates the 2016 terminus position.  In 2015 the glacier had retreated 3.1 km from the 1988 location.  In 2015 there are two tongues of the glacier vulnerable to calving at Point A and B.  In 2016 Iceberg A has calved generating an immediate retreat of 1.7 km. In June of 2017 the iceberg size has been reduced 10-15%, with little change in position.  The iceberg is plugging smaller icebergs from moving down the lake. In August 2018 the iceberg because of its size has still drifted little and at 0.6 km2 has lost half of its area in the two years.  This has enabled smaller icebergs to move past the iceberg down the lake. In July of 2019 the iceberg has diminished further to 0.45 km2, but is enmeshed in a melange of other icebergs as well.  The glacier has continued to retreat from 2016 to 2019 as expected, ~500 m.  The glacier tongue at Point B has narrowed considerably from 2015 to 2019 and is poised to separate.  The narrowness and potentially shallower depth of this inlet may make it difficult for a single iceberg to emerge from the collapse of this glacier tongue that will occur in the next couple of years, I will be watching this summer. The snowline is already approaching a typical end of summer elevation in this image is from July 1, 2019.

In Antarctica it is not unusual to see an iceberg endure for many years.  In the northern hemisphere whether in a lake or in the ocean it is rare to see an iceberg last for three years as has occurred at Porcupine.  This is not due to slow melt, but simply due to the size and thickness of the iceberg, and the fact that this is a wave quiet environment. The retreat here mirrors that of other glacier to the south Klinaklini Glacier and Bridge Glacier  in BC and the north Excelsior Glacier and Yakutat Glacier in Alaska.

Porcupine Glacier in Landsat images from 1988, 2015 and 2017 .  Iceberg A and Ice tongue B are indicated in the latter two.  The yellow arrows mark the 2019 terminus location. The red arrow in 1988 marks its terminus location. The orange and purple arrows in 1988 indicate the margin where the terminus meets the lake shore.


Erasmo Glacier, Chile Terminus Collapse and Aquaculture

Erasmo Glacier retreat in Landsat image from 1987 and Sentinel image from 2018. Red arrow is 1987 terminus, orange arrow 2016 terminus and yellow arrow 2018 terminus. Points A-D mark areas of expanding bedrock exposure.

Cerro Erasmo at 46 degrees South latitude is a short distance north of the Northern Patagonia Icefield and is host to a number of glaciers the largest of which flows northwest from the mountain. This is referred to as Erasmo Glacier with an area of ~40 square kilometers.   Meltwater from this glacier enters Cupquelan Fjord, which is host to a large aquaculture project for Atlantic salmon, producing ~18,000 tons annually. This remote location allows Cooke Aquaculture to protect its farm from environmental contamination. Runoff from Erasmo Glacier is a key input to the fjord, while Rio Exploradores large inflow near the fjord mouth limits inflow from the south.  Davies and Glasser (2012) mapped the area of these glaciers and noted a 7% decline in glacier area from 1986-2011 of Cerro Erasmo. The recent retreat of the largest glacier in the Cerro Erasmo massif indicates this area retreat rate has increased since 2011. Meier et al (2018) note a 48% reduction in glacier area in the Cerro Erasmo and Cerro Hudson region, since 1870 with half of that occurring since 1986.

In 1987 Erasmo Glacier had a land based terminus at the end of a 6 km long low sloped valley tongue.  The snowline was at 1100 m.  In 1998 there is thinning, but limited retreat and the snowline is at 1250 m.  By 2013 a proglacial lake had formed and there are numerous icebergs visible in the lake, note Digital Globe image below.  The snowline is at 1200-1250 m in 2013 at the top of the main icefall. By 2016 a large lake had formed and the snowline is at 1200 m again at the top of the icefall.  By 2016 the terminus has retreated 2.9 km since 1987 generating a lake of the same length. The snowline in 2016 was at 1200 m at the top of the icefall  From 2016 to 2018 a further 0.9 km retreat occurred.  The 3.8 km retreat from 1998 to 2018 is a rate of ~200 m/year.  Thinning upglacier to the expanding ridge from Point A-D is evident. Thinning at Point C has eliminated the overflow into the distributary glacier that had existed. The collapse is ongoing as indicated by the number of icebergs in the lake in 2018.  there is an increased glacier surface slope 1 km behind the 2018 glacier front, suggesting the lake will not extend passed this point. The retreat is consistent with retreat documented at Reichert GlacierHornopirén Glacier and Cordillera Lago General Carrera Glacier. The impact on inflow to Cupquelan Fjord due to glacier retreat will be increased stream runoff during the wet winter season and reduced flow during the drier summer period December-February.  The summer season is still relatively wet.

Breakup of Erasmo Glacier terminus in Digital Globe image from 2013. Purple arrow indicates largest iceberg.

Erasmo Glacier retreat in Landsat image from 1998 and 2016. Red arrow is 1987 terminus, orange arrow 2016 terminus and yellow arrow 2018 terminus. 

Canadian Columbia River Basin Winter 2016-2017: A Late Rally

Guest Post by Ben Pelto, PhD Candidate, UNBC Geography, pelto@unbc.ca

As the summer ticks by and the fall glacier field season approaches, I’ve realized that I never put out a winter 2016-2017 synopsis, so, like the snowfall this year, it’s arrived late.

May 2017, Jesse Milner of the ACMG on the Nordic Glacier in front of the “meteor strike” a newly exposed rock face that spalls ice regularly. Photo by Ben Pelto.

Story of the winter

The winter began with an extremely warm November, featuring temperatures 2-5˚C above normal, with greater than average precipitation generally delivered via Pacific storm cycles. Arctic air masses moving south across BC dominated December, with a complete reversal of temperature to well below average temperatures (Figure 1), and drier conditions. By January 1st the BC River Forecast Center announced that the Columbia River Basin was at 80-88% of normal snowpack (Figure 2).

Figure 1. Maximum temperature anomaly for December 2016. Note Columbia Basin (SE BC) roughly 3˚C below normal (Pacific Climate Impacts Consortium).

Figure 2. January 1st snow survey data from the BC River Forecast Center. The Columbia River Basin is comprised of the Upper Columbia, East Kootenay, and West Kootenay Basins, which range from 80-88% of normal.

March and April brought cool and moist unstable conditions, leading to a significant increase in snowpack across southern BC, delaying the onset of the melt season by about two weeks. Snowpack measures for the basin were over 100% of normal for the first time of the winter; by May 1st, the Columbia Basin was at 115% of normal to the north and 135% in the south (Figure 3). By the first week of May, most regions had transitioned into the melt season, though at low to mid-elevations (below 1500 m) much of the snow had already melted.

Figure 3. May 1st snow survey data from the BC River Forecast Center. The Columbia River Basin is comprised of the Upper Columbia, East Kootenay, and West Kootenay Basins, which ranged from 115 to 137% of normal.

Questions of alpine snowpack conditions

A trend seen over the past few winters is minimal to no snow at lower elevations with significant snow remaining higher, and it’s a pattern expected to continue in an era of rising temperatures leading to both rain on snow, and melt events through the winter. Unfortunately, current measurements, including the network of 70 automatic snow weather stations (ASWS) across the province, are all located at or below 2000 m. This leaves the alpine largely un-sampled. Rising temperatures may well be increasing the balance gradient of winter snow accumulation; that is, there will be a greater rate of change (increase) in snowpack with elevation than previously experienced, though data for this shift is lacking.

Our glacier research program

This information gap of alpine snowpack across BC is being addressed within the context of our glacier mass balance network funded by the Columbia Basin Trust. Each year we have been studying a series of five glaciers across the Basin, which from north to south are the Zillmer Glacier (Valemount), Nordic Glacier (northern boundary of Glacier National Park), Illecillewaet Glacier (Parks Canada, Rodgers Pass, Glacier National Park), Conrad Glacier (Golden, northern boundary of Bugaboo Provincial Park), and the Kokanee Glacier (Nelson, Kokanee Glacier Provincial Park). For more background see previous posts here and here.

Our spring field season consists primarily of snow depth measurements and snow density measurements, used to determine the snow water equivalent (SWE) retained on each glacier at the winter’s end. We also conduct GPS surveys of the glacier height, which we use to account for any surface height change between field visits, and the subsequent airborne laser altimetry surveys (LiDAR)of each glacier and the surrounding area that we’re conducting every spring and fall for the five years of the project.

May 2017, Pulling the ground penetrating radar up the Kokanee Glacier to measure ice thickness. The Kokanee is 20-80 m thick, averaging around 30-40 m. Photo by Rachael Roussin.

Our LiDAR data allows us to calculate snow depth by comparing a fall LiDAR-derived digital elevation model (DEM) to our spring DEM. Off-glacier, the fall DEM represents bare earth, and on glacier, the glacier surface at the end of the melt season. The spring DEM thus captures the fall surface height plus the winter snowpack. The difference in height between the two is taken to be accumulated snow. While our manual snow depth and density surveys of the five study glaciers are incredibly valuable data, our LiDAR surveys cover roughly 10% of the Columbia Basin glacier area, a more than three-fold increase. This expanded footprint allows a better picture of alpine snowpack across the province at elevations largely un-sampled; highly important to downstream concerns such as spring flooding and  snow available for summer streamflow.

Fires and Floods

 Dramatic swings of weather patterns characterized the 2016-2017 winter, with snowpack well below average in February and early March for the province. By the end of April, snowpack across the Columbia Basin and southern half of the province had rebounded to average or record levels depending upon location with Vancouver and the lower mainland receiving significant snowfall to much fanfare. 

The late and cool spring saved the snow season, but also led to flooding across the province, particularly throughout the Okanogan and around Kelowna. As the wildfire season began in earnest, sandbags were still in place in Kelowna to protect properties against flooding from Okanogan Lake, which remained above full pool by 38 cms on July 10th. Wildfire crews had been tasked with fighting the flooding, and were removing many sandbags as lake levels began to fall before heading off to respond to escalating fires. The flooding began following a rapid warm-up combined with heavy rainfall that led to extreme avalanche risk and activity, with highway closures along the Trans-Canada and Icefields Parkway.

The record snowpack across the southern-most Columbia Basin such as around Nelson, BC, has long since disappeared, with Nelson implementing water restrictions to attempt to cut water usage by 50% in response to the rapidly diminishing snowpack which feed the town’s water supplies.

Forest fires have been raging over the province, burning an area larger than Prince Edward Island, in what is the worst fire season in BC since 1958. Forest fire impact on glaciers is largely unknown, as soot and ash from the fires may raise albedo, but smoke clouds reflect incoming solar radiation. One thing is for certain however, should the fires cloud the skies during our field season, spending 24 hours a day in fire smoke makes for a tough go.

Team members at the foot of a recent avalanche preparing to head up to the Nordic Glacier in the first week of May 2017. Photo by Alex Bevington

Outlook

With our fall field season (August 19-September 21) only a week away, it will be an interesting time to observe how our study glaciers across the Columbia Mountains fared over this roller coaster of a year. After a cold, dry start to the winter, a late rally in March and April delayed the start of the melt season and raised snowpack to well above average across the Columbia Basin. A hot, dry summer led to flooding in May, and now wildfires in June-August, which reversed snowpack levels to below-average at most elevations. Satellite images of the study glaciers show rapidly rising snow lines, as above-average snow packs are reduced to average to below-average across most glaciers, with only the Kokanee Glacier appearing set for a possible positive mass balance year.

How do you get out? Jesse Milner at the bottom of a 5.5 m deep snow pit, which we use for sampling snow density. Nordic Glacier. Photo by Alex Bevington.

The field research is funded by the Columbia Basin Trust, with BC Hydro providing funds for the LiDAR surveys, and addition research support from the Natural Sciences and Engineering Research Council of Canada and the Canada foundation for innovation. The author is a supported by a Pacific Institute for Climate Solutions Fellowship and a scholarship from the University of Northern British Columbia.
Swiftcurrent Glacier, British Columbia, Swiftly Retreating 1986-2015

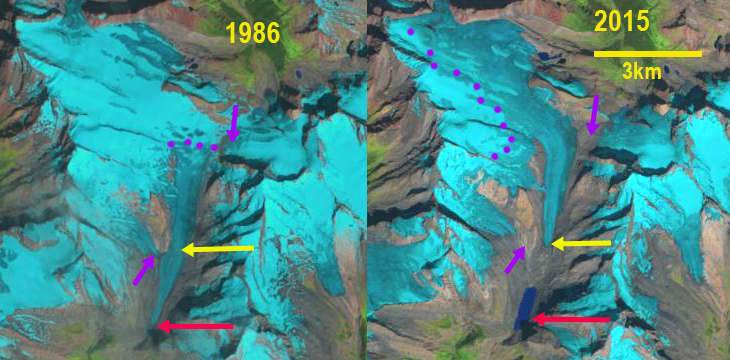
Swifttcurrent Glacier Comparison from 1986 and 2015 Landsat images.  Red arrow is the 1986 terminus, yellow arrow 2015 terminus, purple arrow significant tributaries in 1986, and purple dots the snowline.

Swiftcurrent Glacier drains the southeast side of Mount Longstaff 15 km NW of Mount Robson.  The glacier is near the headwaters of the Fraser River, and its retreat since 1986 has led to the formation of a new alpine lake. Here we examine glacier change from 1986 to 2015 in Landsat images.  Bolch et al (2010) found that from 1985-2005  BC glaciers lost 11% of their area.  Jiskoot et al (2009) examined the behavior of Clemenceau Icefield and found that from the mid 1980’s to 2001 the nearby Clemenceau Icefield glaciers had lost 42 square kilometers, or 14% of their area.  Tennant and Menounos (2012) examined changes of the Rocky Mountain glaciers in Alberta and BC finding that from 1919 to 2006 that glacier cover decreased by 590 square kilometers, 17 of 523 glaciers disappeared and 124 glaciers fragmented into multiple ice masses. 

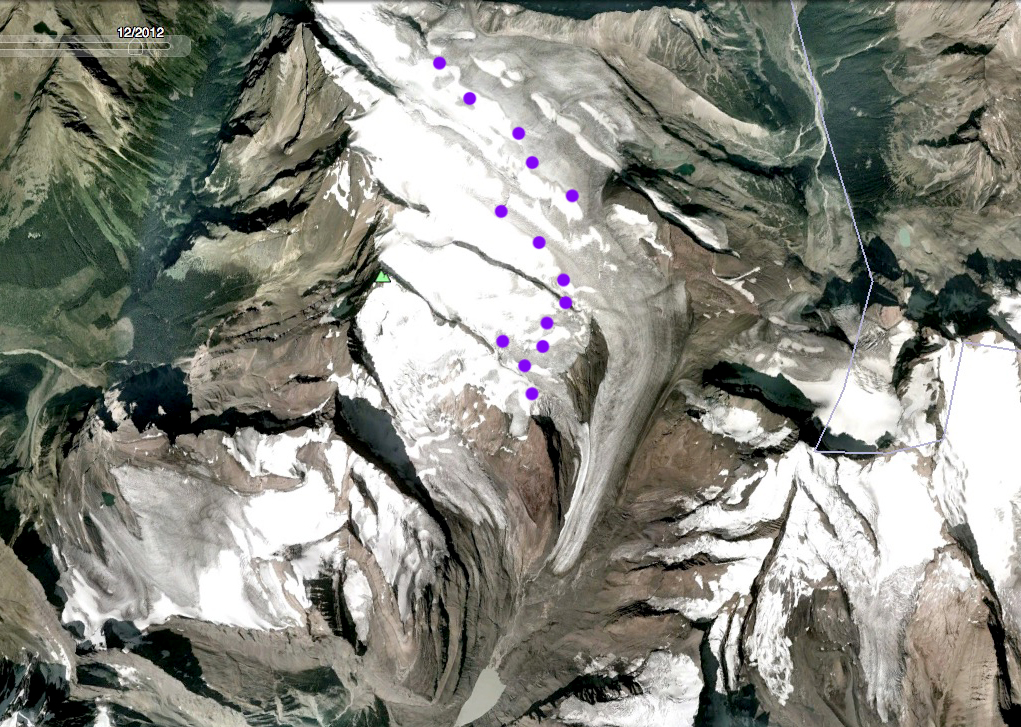
In 1986 Swiftcurrent Glacier terminated at 1715 m, red arrow and had a snowline of 2300 m.  There is not an alpine lake at the terminus or in the map of the region.  There are two prominent tributaries evident, purple arrows. In a Google Earth image from 2005, a new alpine lake had formed and the snowline was at 2500 m.  In the 2013 Landsat image only the eastern side of the glacier is seen, the snowline is above 2600 m. In 2015 the new alpine lake is 1100 m long, the glacier terminates at the yellow area at 2000 m.  This represents a 2.8 km retreat from 1986-2015.  The snowline in 2015 is at 2650-2700 m.  The two significant tributaries have separated from the glacier at the purple arrow. The high end of summer snowlines in recent decades indicate an expanded melt zone and mass loss.  This is and will continue to drive terminus retreat.  The retreat is similar to two other headwaters glaciers in the region; Kiwa Glacier and Robson Glacier.
 

Map of the Swiftcurrent Glacier  region  from GeoBC, this is a 1983 base map.

2005 Google Earth image of Swiftcurrent glacier, purple dots indicate snowline.

2013 Landsat image of Swiftcurrent Glacier.

Beautiful British Columbia Land of Many Mountains & Dwindling Glaciers

[ngg_images source=”galleries” container_ids=”4″ display_type=”photocrati-nextgen_basic_imagebrowser” ajax_pagination=”1″ template=”/nas/wp/www/sites/blogsorg/wp-content/plugins/nextgen-gallery/products/photocrati_nextgen/modules/ngglegacy/view/imagebrowser-caption.php” order_by=”sortorder” order_direction=”ASC” returns=”included” maximum_entity_count=”500″]

British Columbia is host to many mountain ranges; Purcell, Monashee, Bugaboo, Selkirk, Cariboo, Coat Range, Kootenay, Kwadacha are just some of the diverse mountain ranges  that host glaciers and span climate zone. A shared characteristic today regardless of climate zone or mountain range is dwindling glacier size and volume.  Bolch et al (2010) found that from 1985-2005 Alberta glaciers lost 25% of their area and BC glaciers 11% of their area.  Tennant and Menounos (2012) examined changes of the Rocky Mountain glaciers including Alberta finding that between 1919 and 2006 glacier cover decreased by 590 square kilometers, 17 of 523 glaciers disappeared and 124 glaciers fragmented into multiple ice masses.  Jiskoot et al (2009) examined the behavior of glaciers of the Clemenceau and Chaba Icefield and found that from the mid 1980’s to 2001 the Clemenceau Icefield glaciers had lost 42 square kilometers, or 14% of their area. Pelto (2016) reported on specific retreat of many of these BC glaciers. Below are links to 31 detailed post examining the changes in recent decades of British Columbia glaciers in response to climate change.
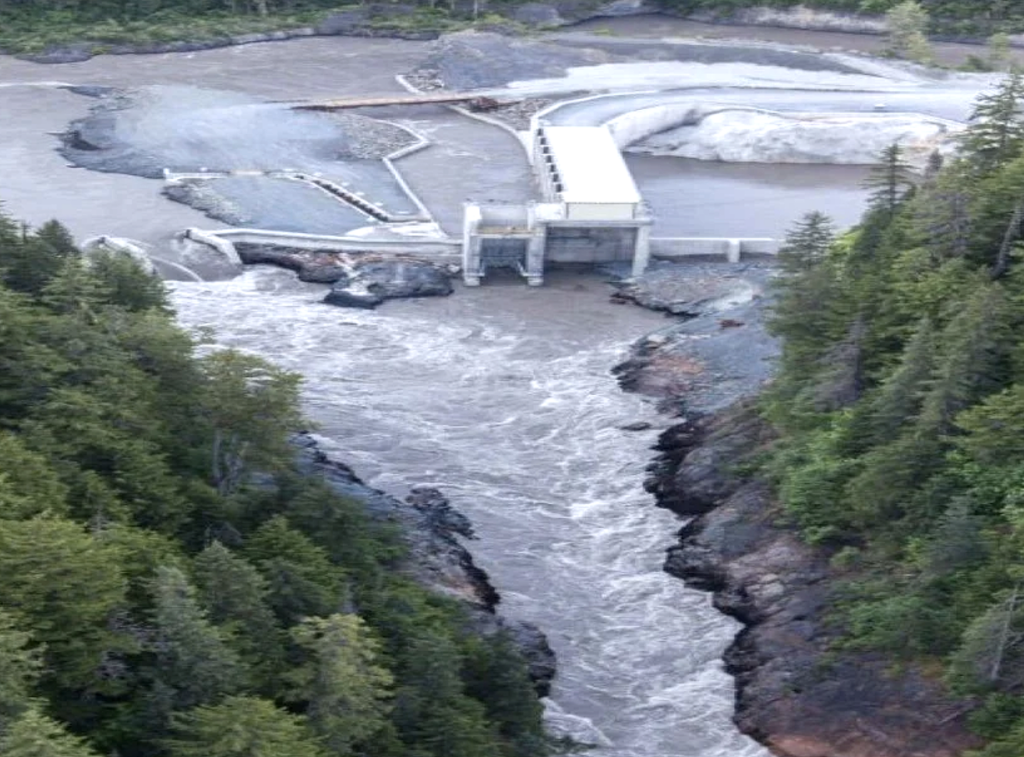
In the summer glaciers in many ranges are crucial water resources for aquatic life and hydropower.   In BC 92% of electricity is generated by hydropower mainly from large projects.  BC Hydro has 31 such large projects, including several heavily fed by glaciers: Bridge River, Mica, Cheakamus, Ruskin and Stave Falls. There are also run of river hydroprojects with a new one constructed by AltaGas, the 195 MW Forrest Kerr Project on Tahltan First Nation land on the Iskut River. The Iskut River like the Stikine River is heavily glacier fed. As spring begins glaciologists will be heading out to measure glacier mass balance a critical input to understanding current and future glacier runoff, such as the Columbia Basin Trust sponsored project overseen by Brian Menounos at UNBC, and field operation direct by Ben Pelto at UNBC.


Forrest Kerr Hydro is a run of river project relying on a weir instead of a dam to divert water into the intake.
There are also numerous salmon fed streams with critical glacier input, such as the Skeena River and Rivers Inlet. Stahl and Moore (2006) identified that discharge from glacierized and nonglacierized basins in British Columbia indicates the negative August streamflow trends illustrate that the initial phase of increase runoff causing by climate warming has passed and runoff is now declining. This is similar to further south in the North Cascades of Washington (Pelto, 2015).

Shatter and Shudder Glacier
Snowcap Creek Glacier
Stave Glacier
Helm Glacier
Warren Glacier
Galaxy Glacier
Icemantle Glacier
Big Bend Glacier
Kokanee Glacier
Toby Glacier
Conrad Glacier
Vowell Glacier
Bridge Glacier
Klippi Glacier
Yoho Glacier
Des Poilus Galcier
Haworth Glaciers

Apex Glacier
Kiwa Glacier
Dismal Glacier
Cummins Glacier
Coleman Glacier
Swiftcurrent Glacier
Bromley Glacier
Sittakanay Glacier
Nass Peak Glacier
Porcupine Glacier
Great Glacier
Hoboe Glacie
Tulsequah Glacier
Melbern Glacier

Bridge Glacier Terminus Collapse, BC, 4 km retreat 1985-2016

Bridge Glacier comparison in 1985 and 2016 Landsat Images.  Red arrow is the 1985 terminus, yellow arrow the 2016 terminus and purple arrows indicate locations where tributaries have separated between the two dates. 

Bridge Glacier is an 17 km long outlet glacier of the Lillooet Icefield in British Columbia. The glacier ends in a rapidly expanding glacial lake and had an observed retreat rate of 30 m per year from 1981-2005 by Allen and Smith (2007). They examined the dendrolchronology of Holocene advances of the glacier and found up to 2005 a 3.3 kilometer advance from the primary terminal moraine band, with the most extensive advances being early in the Little Ice Age.  Chernos (2016)  indicates that the glacier in 2013 is approaching the upglacier end of the lake, which will lead to reduced retreat rates.  Here we compare Landsat imagery from 1985 to 2016 to determine response.

In 1985 the proglacial lake was 2.5 km long and 3.5 km upglacier of the terminus a major tributary joins.  The transient snow line is 2100 m. By 1993 the glacier has retreated 200-300 m and the snowline was at 2150 m.  By 2004 the terminus in a Google Earth image the terminus had retreated 1100 m since 1985.  By 2004 the tributary from the north has separated from the north side of the glacier.There are also some evident areas where the proglacial lake is visible up to 800 m upglacier of the terminus.  This suggests imminent collapse of this section of the terminus, which is afloat.  Matt Chernos researching this glacier documents this well with images.  Chernos (2016) observed that calving due to greater water depth and terminus buoyancy was key to retreat, but that most volume loss stemmed from melting.   In 2016 the terminus has retreated beyond the former junction of the Bridge Glacier and the northern tributary.  The glacier terminus is now within 500 m of a slope increase, likely marking the end of the developing lake basin. The total retreat in 31 years has been 4.1 km, this is a rate of 130 m/year, much faster than before. The 3 km retreat from 2004 to 2016 indicates a retreat of 250 m/year.  The separation of the three tributaries, purple arrows are not impacted by calving and indicate melting alone is sufficient to drive significant retreat.  The enhanced melt is also the cause of the high snowlines,, in 2016 the snowline is at 2150 m. The retreat is faster than nearby Klippi and Jacobsen Glacier, but both of those are also retreating fast.

This continued retreat and area loss will lead to glacier runoff decline in summer. This is crucial to the large Bridge River Hydro complex. This complex managed by BC Hydro can produce 490 MW of power, which is 6-8% of Province demand. Stahl et al (2008) note in their modeling study of the glacier that ,”The model results revealed that Bridge Glacier is significantly out of equilibrium with the current climate, and even when a continuation of current climate is assumed, the glacier decreases in area by 20% over the next 50 to100 years. This retreat is accompanied by a similar decreasein summer streamflow.”   Lillooet News (2016) notes that BC Hydro has commissioned research on the glacier to investigate impact on runoff tiiming. This parallels our findings on the Skykomish River in the North Cascades, Washington Pelto (2011).  The change in timing and the hydropower also impact salmon with late summer runs of chinook and fall coho runs.

Bridge Glacier comparison in 1993 Landsat Image.  Red arrow is the 1985 terminus, yellow arrow the 2016 terminus.

2005 Google Earth image of Bridge Glacier, note tributary separation from the north.

Closeup of terminus indicating exposures of proglacial lake upglacier of the terminus.Bridge Glacier Retreat Acceleration, BC, Canada

Klippi Glacier Retreat Causes Separation, British Columbia

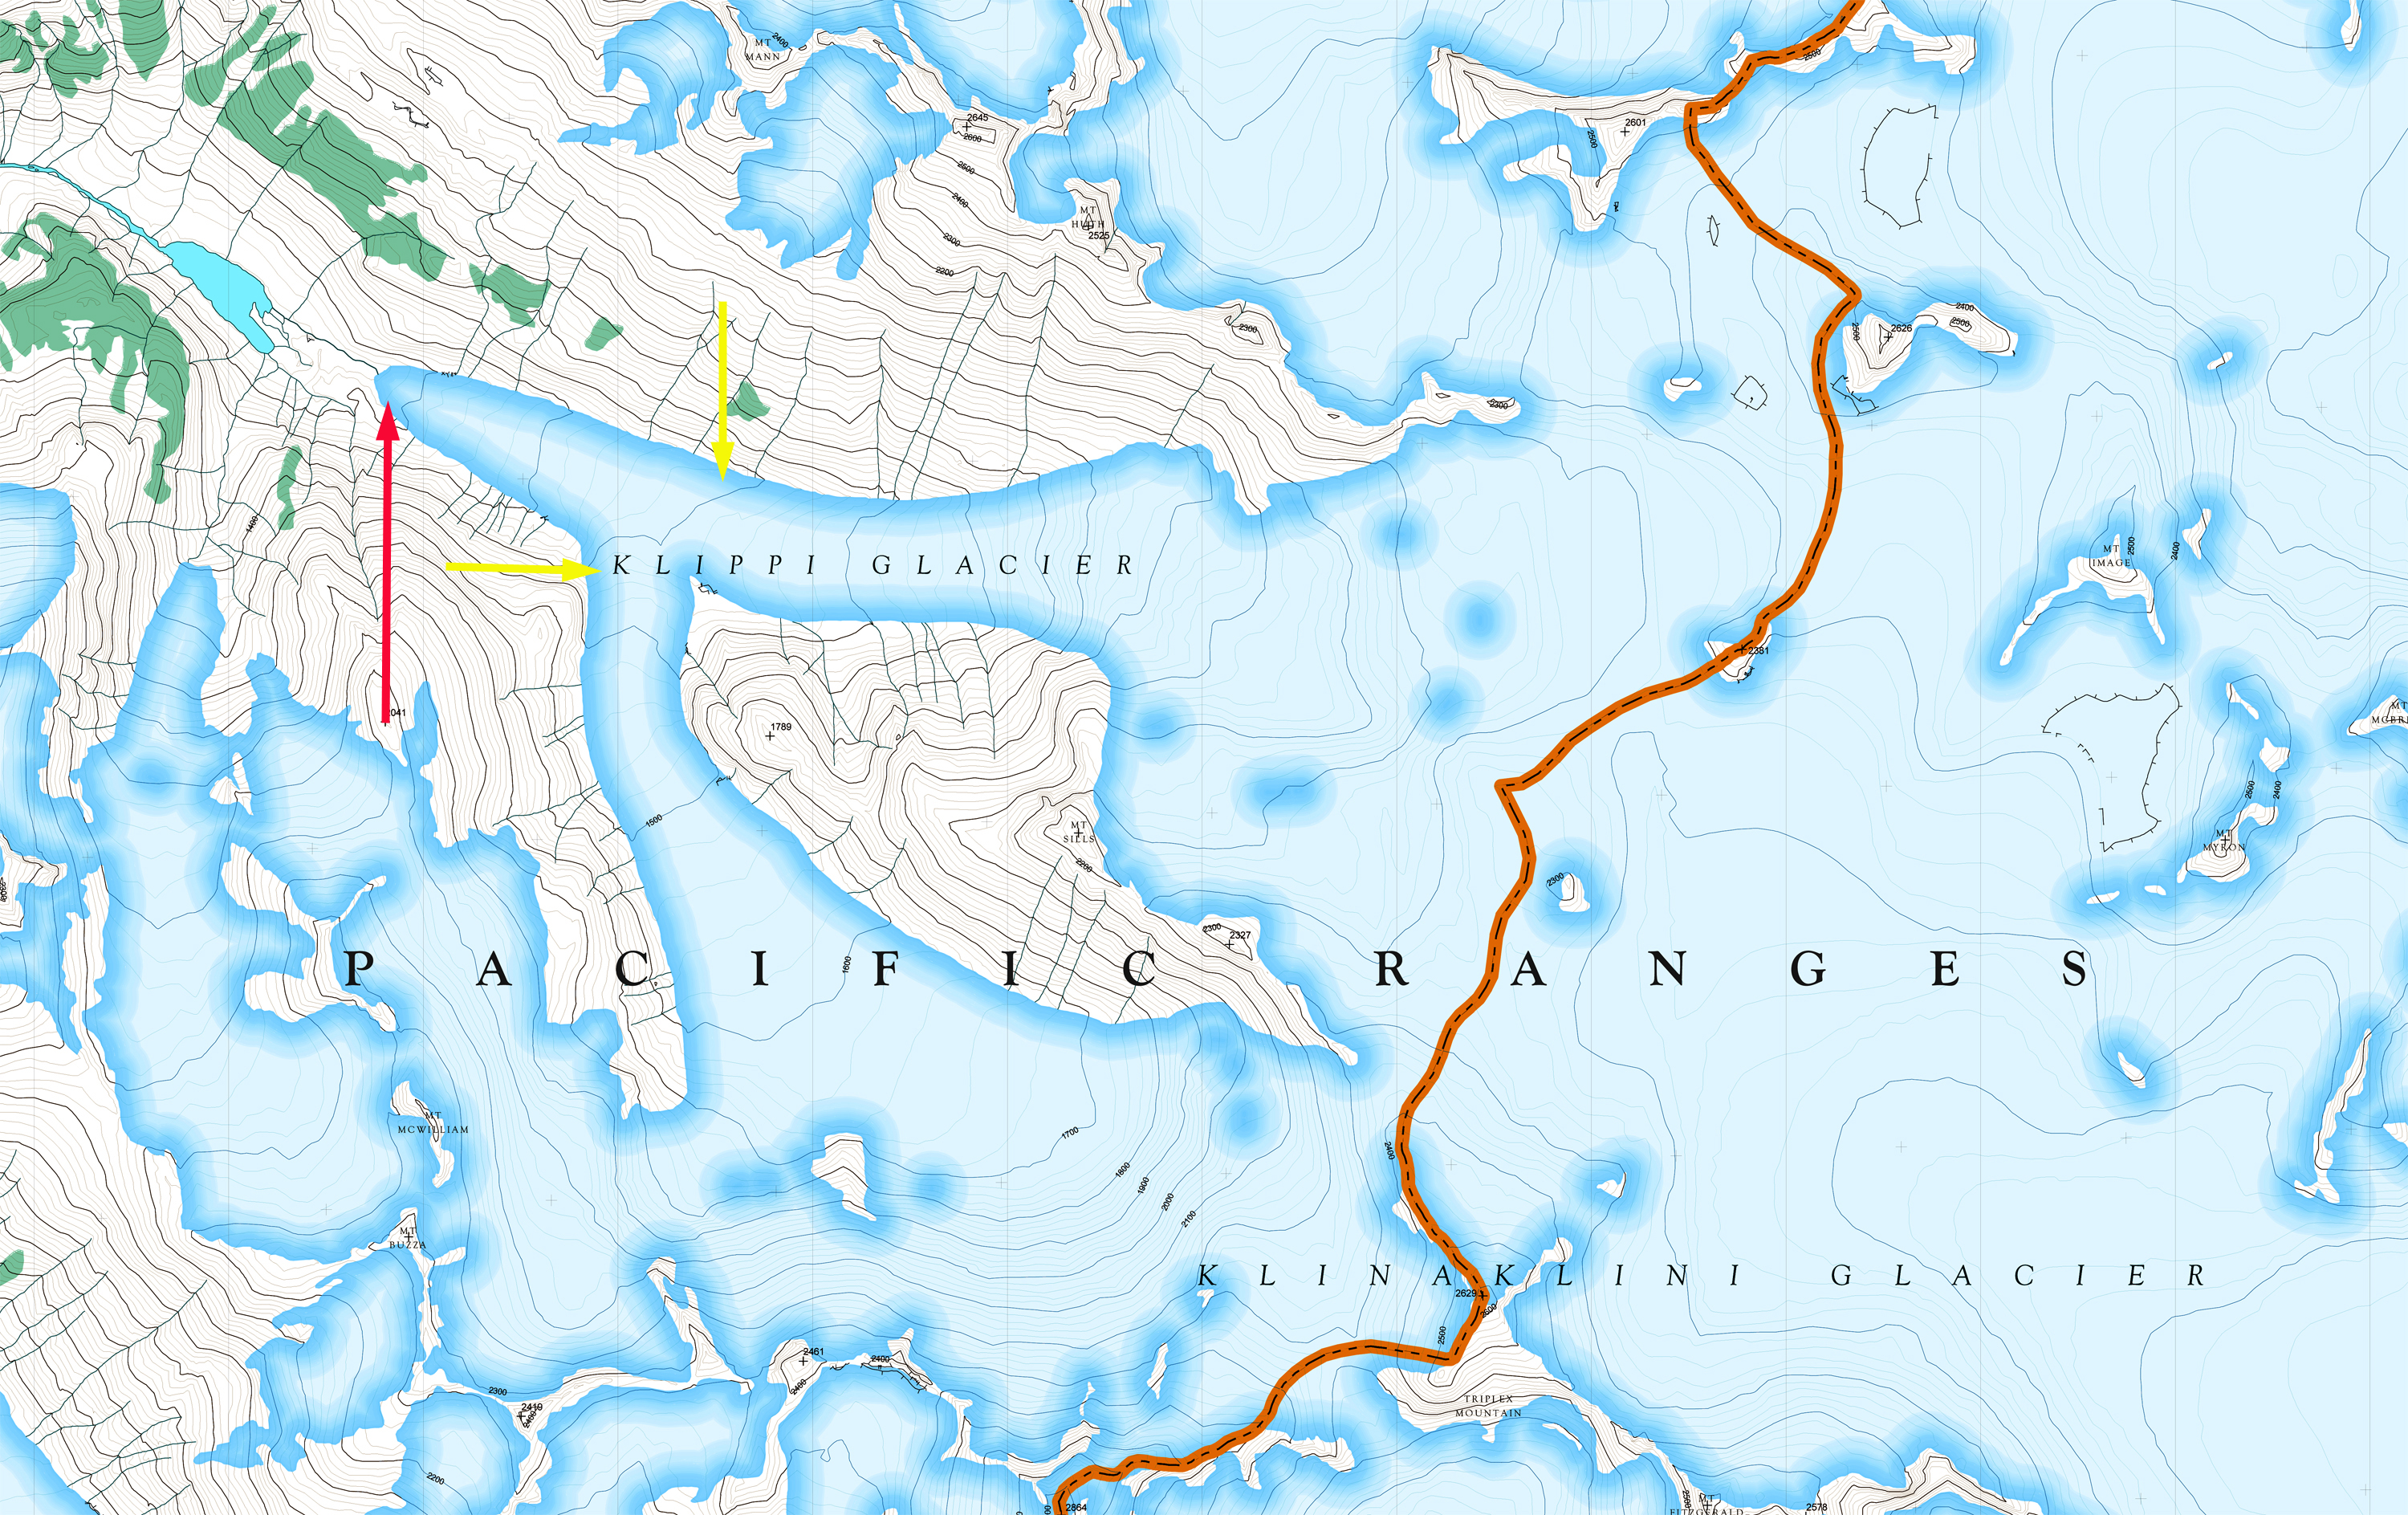
Klippi Glacier in Landsat images of 1987 to 2016. Red arrows indicate 1987 terminus, yellow arrows 2016 terminus and purple dots the transient snowline. 

The glacier beings at 2600 m sharing a divide with Klinaklini Glacier, flowing northwest from Silverthrone Mountain and terminating at  1040 m in 1987. Klippi Glacier drains into the Machmell River, Owikeno Lake and then River Inlet on the British Columbia Coast. The Machmell River is an important spawning area in its lowest 20 km, particularly for sockeye salmon, with chinook, coho, pink and chum salmon also present  The Machmell River is accessible to anadromous fish to the cascades just downstream of junction with Pashleth Creek, where runoff from the Pashleth Glacier enters (Hillaby, 1998).  The Rivers Inlet sockeye stock is the second largest in BC and has recently received much attention because of a dramatic decline in total abundance from the 1980s.  In the 1980’s Machmell River escapement numbers averaged 20,000, dropping to 5000 in the 1990’s  (Rutherford et al 1998).  This has led to an ecosystem study by UBC and SFU  of Rivers Inlet. Rivers Inlet in the 1970’s began to experience sockeye population  decline. Harvest rates were reduced in the 1980’s and the commercial fishery closed in 1996.  In 1999 the  stock reached a record low of ~ 3600 fish, just 0.1% of historic levels (Rivers Inlet Ecosystem Study). The commercial fishery has remained closed since 1996, with  a small amount of fishing permitted by the Wuikinuxv First Nation for cultural purposes, the stock has not recovered.

Here we examine the response of this glacier to climate change from 1987-2016 using Landsat imagery. In 1987 Klippi Glacier’s two main tributaries joined 1.8 km from the terminus, red arrow in each image.  The transient snow line was at 1800 m, purple dots.   By 1995 the glacier had retreated 750 m but still had a joined terminus. The transient snowline remained close to 1850 m.  In a 2012 Google Earth image the tributaries are still connected, but barely as a drainage stream has nearly isolated them.  The lower 800 m of both glaciers illustrate limited crevassing and significant downwasting. By 2016 the tributaries had separated with a retreat of  1400 m since 1987.  The transient snowline in 2016 was at 1900-1950 m. The glaciers will continue to retreat due to high snowlines in recent years with each of the last three years being above 1950 m by the end of the melt season.  The retreat here is similar to that of other valley glaciers in the region Jacobsen Glacier and Bridge Glacier.

Map of the Klippi Glacier region reflecting the 1980’s terminus position of the glacier. Red arrows indicate 1987 terminus, yellow arrows 2016 terminus

Klippi Glacier in Landsat image from 1995. Red arrows indicate 1987 terminus, yellow arrows 2016 terminus and purple dots the transient snowline. 

2012 Google Earth image of the terminus area of Klippi Glacier. Yellow arrow indicate 2016 terminus location. 

Shatter & Shudder Glacier Retreat, British Columbia Lakes Form

shattter-terminus-compare

Red arrow is the 1985 terminus location and yellow arrow the 2016 terminus location.  Note the formatiion of new lakes at end of both glaciers. Purple dots is the transient snowline in August of each year.

Shatter and Shudder Glacier are at the eastern end of the Spearhead Range in Garibaldi Provincial Park, British Columbia. Osborn et al (2007) mapped the Little Ice Age extent of the glaciers compared to the 1990’s margins indicating a retreat of 300 m for Shatter Glacier and 700 m for Shudder Glacier (see below).  Koch et al (2009) identified the recession in area from 1928 to 1987 noting a 6% loss in Shatter Glacier and 22% loss for Shudder Glacier.  Koch et al (2009) identify an 18% loss in area from 1987-2005, indicating considerable recent change in the Park. Here we use Landsat imagery from 1985-2016 to update glacier change.

In 1985 there are no lake at the terminus of either Shatter or Shudder Glacier.  In 2002 a lake has formed at the terminus of Shudder Glacier, but not Shatter Glacier.  In 2016 both glaciers have proglacial lakes that have formed, and the terminus of both glaciers have retreated from the lakes.  This marks a retreat of 325 m on Shudder Glacier and 275 m on Shatter Glacier since 1985. Shudder Glacier retreated more rapidly in the first half of this period, while Shatter Glacier has experienced most of the retreat since 2005.

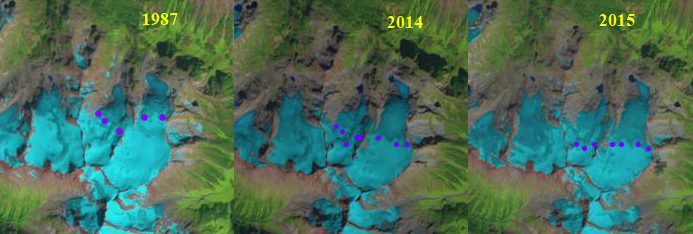
On Shatter and Shudder Glacier In 1987 the late August image indicates the snowline is at 2040 m, in mid-August 2015 the snowline is at 2250 m. In late August of 2014 the snowline was at 2120 m. In mid-August 2016 the snowline is at 2080 m. The higher snowlines are an indicator of mass loss for these glaciers that in turn drives retreat.  The region continues to experience significant loss in glacier area and development of many new alpine lakes with glacier retreat, five new lakes since 1987 just in this range with seven glaciers.  Spearhead and Decker Glacier are two other glaciers in the range that have developed new lakes since 1987. Nearby Helm Glacier is faring even worse.


shatter-tsl-compare

Landsat images from 1987, 2014 and 2015 indicating the transient snowline position at the purple dots on Shatter and Shudder Glacier.

spearhead-range-alpine-lakes-87-15

Pink Arrows indicate five new alpine lakes that have developed since 1987 as Spearhead Range glaciers have retreated

spearhead

Map of Spearhead Range glacier extent for LIA-Bold lines and 1987, light lines from Osborn et al (2007)

Porcupine Glacier, BC 1.2km2 Calving Event Marks Rapid Retreat

porcupine iceberg comparison

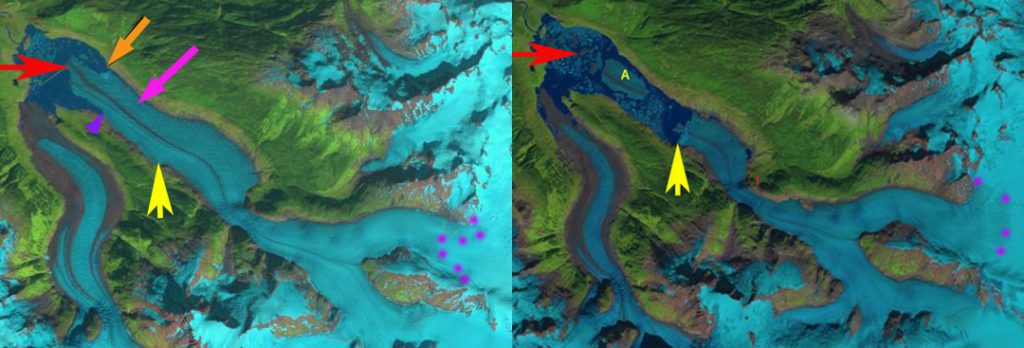
Landsat images from Sept. 2015 and Sept. 2016.  Red arrow is the 1988 terminus and the yellow arrow the 2016 terminus.  I marks an icefall location and point A marks the large iceberg. 

Porcupine Glacier is a 20 km long outlet glacier of an icefield in the Hoodoo Mountains of Northern British Columbia that terminates in an expanding proglacial lake. During 2016 the glacier had a 1.2 square kilometer iceberg break off, leading to a retreat of 1.7 km in one year. This is an unusually large iceberg to calve off in a proglacial lake, the largest I have ever seen in British Columbia or Alaska. NASA has generated better imagery to illustrate my observations. Bolch et al (2010) noted a reduction of 0.3% per year in glacier area in the Northern Coast Mountains of British Columbia from 1985 to 2005. Scheifer et al (2007) noted an annual thinning rate of 0.8 meters/year from 1985-1999. Here we examine the rapid  retreat of Porcupine Glacier and the expansion of the lake it ends in from 1988-2016 using Landsat images from 1988, 1999, 2011, 2015 and 2016. Below is a Google Earth view of the glacier with arrows indicating the flow paths of the Porcupine Glacier. The second images is a map of the region from 1980 indicates a small marginal lake at the terminus.porcupine long term compare

Landsat images from 1988 and 2016 comparing terminus locations and snowline. Red arrow is the 1985 terminus and the yellow arrow the 2016 terminus.  I marks an icefall location and point A marks the large iceberg. Purple dots indicate the snowline.

In 1988 a tongue of the glacier in the center of the lake reached to within 1.5 km of the far shore of the lake, red arrow. The yellow arrow indicates the 2016 terminus position.  By 1999 there was only a narrow tongue reaching into the wider proglacial lake formed by the juncture of two tributaries. In 2011 this tongue had collapsed. In 2015 the glacier had retreated 3.1 km from the 1988 location.  In the next 12 months Porcupine Glacier calved a 1.2 square kilometer iceberg and retreated 1.7 km, detailed view of iceberg below. The base of the icefall indicates the likely limit of this lake basin. At that point the retreat rate will decline.The number of icebergs in the lake at the terminus indicates the retreat is mainly due to calving icebergs. Glacier thinning of the glacier tongue has led to enhanced calving. The retreat of this glacier is similar to a number of other glaciers in the area Great Glacier, Chickamin GlacierSouth Sawyer Glacier and Bromley Glacier. The retreat is driven by an increase in snowline/equilibrium line elevations which in 2016 is at 1700 m, similar to that on South Sawyer Glacier in 2016.porcupine 82716

August 27, 2016 Sentinel 2 image of iceberg red dots calved from front of Porcupine Glacier. 

porcupine glacier-map

Canadian Toporama map of Porcupine Glacier terminus area in 1980.

porucpine glacierge

Google Earth view indicating flow of Porcupine glacier.

porcupine glacier 1999

1999 Landsat image above and 2011 Landsat image below indicating expansion of the lake.  Red arrows indicate the snowline.  Purple, orange and yellow arrows indicate the same location in each image.

porcupine glacier bc 2011

Kiwa Glacier Retreat, British Columbia 1986-2015

compare kiwa

Kiwa Glacier retreat from 1986 to 2015 in Landsat images.  Red arrow is 1986 terminus and yellow arrow 2015 terminus location. Purple arrow indicates upglacier thinning where more bedrock is exposed.  Purple dots indicate the transient snowline

Kiwa Glacier is the longest glacier, at 9 km, in the Cariboo Mountains of  British Columbia.  The glacier drains northwest from Mount Sir Wilfred Laurier and is near the headwaters of the Fraser River, where it terminates in an expanding lake at 1465 m. Here we examine glacier change from 1986 to 2015. In 1986 the glacier terminated in the 700-800 m long proglacial lake.  The glacier has two significant icefalls above the terminus at 2300 m and 1800 m.   The lower icefall generating a series of ogives that are generated annually due to seasonal velocity fluctuations.  The ogives indicate the glacier velocity below this icefall.  There are 20 ogives in the span of approximately 1 km indicating a velocity of 50 m/year.  In 2015 the glacier still terminates in the proglacial lake that is now 1400-1500 m long indicating a retreat of 700 m in the thirty years from 1986-2015.  The lower 300 m of the glacier is nearly flat suggesting the lake will extend at least that far, note 2010 image from Reiner Thoni, Canadian Mountaineer.  This is also the extent that will be lost relatively quickly via iceberg calving and continued surface melt.  Above this point flow remains vigorous and retreat could diminish. Upglacier thinning has expanded bedrock areas even separating sections of the glacier, purple arrows. The transient snowline in mid-August in the Landsat images is at 2550 m. Driving through the area last week, the snowline is at 1000 m, quite high for mid-March.

Beedle et al (2015) note that glaciers in the Cariboo Mountains were close to equilibrium from 1952 to 1985 : 9 glaciers advanced, 12 receded, and 11 did not change. After 1985 they noted that all glacier retreated in the Cariboo Mountains. The response time of the glaciers to climate change is the main cause for the differing response of individual glaciers in the region as has been noted in other Pacific Northwest regions (Pelto and Hedlund, 2001 & Tennant et al, 2012).  Response times are faster for glaciers with steeper slopes, higher velocity/length ratios and a higher ratio of accumulation-ablation/ ice thickness.  The decline of glaciers, warm weather and reduced snowpack combined in 2015 to place a stress of Fraser River salmon due to lower discharge and higher temperature.  This could be an issue in 2016 as well.

adamant 2004 ge copy

Kiwa Glacier in 2004 Google Earth image

kiwa glacier rt

2010 Image from Reiner Thoni.  Well defined trimlines above the lake.  Note flat lower section of the glacier. 

Dismal Glacier, British Columbia Prospects Match Name

dismal
Landsat image comparison from 1988 and 2015, red arrow indicates 1988 terminus and yellow arrows 2015 terminus. Purple arrows indicate thinning upglacier.

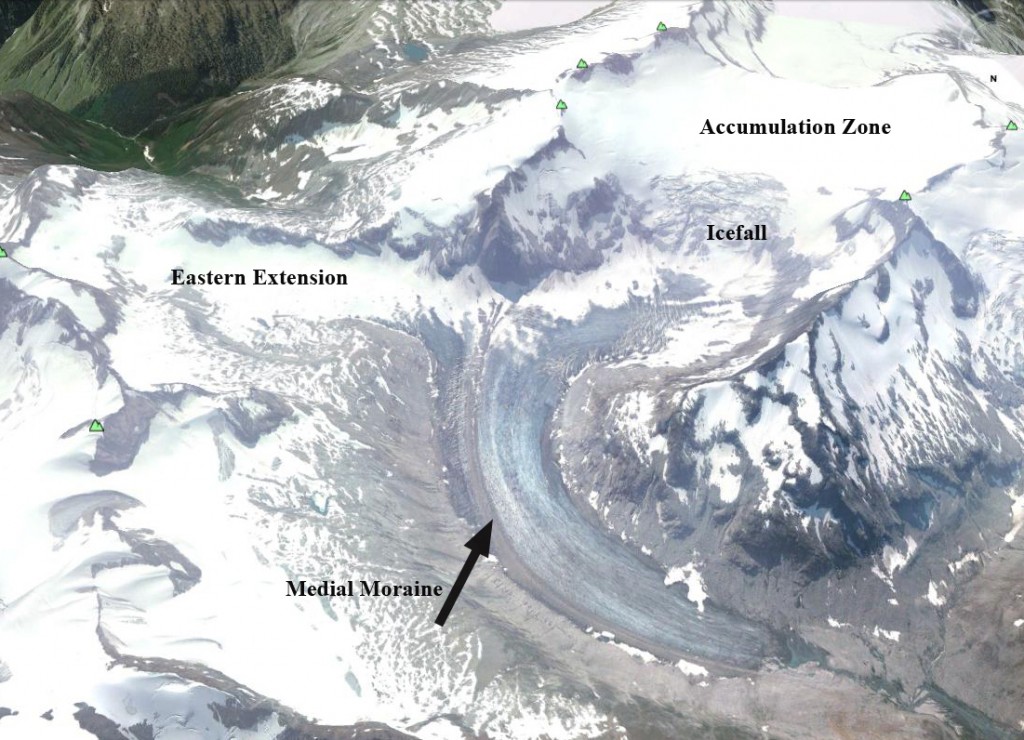
Dismal Glacier flows north from Mount Durrand in the Selkirk Range of British Columbia.  It drains from 2500 m to 1950 m and its runoff flows into Downie Creek that is a tributary to the Columbia River and Revelstoke Lake.  This lake is impounded by the BCHydro Revelstoke Dam which is 2480 MW facility.  Here we examine Landsat images from 1988 and 2015 to identify changes in this glacier.  The glacier snowline in the mid-August image of 2015 is at 2400  m just above a substantial icefall.  The glacier has retreated 640 m from 1988 to 2015.  The eastern extension at 2200 to 2300 m of the glacier noted by a purple arrow, has lost considerable area, indicating thinning even well above the terminus  elevation. Note thinning of this section of the glacier by 2015 after it joins the main glacier, it is separated by a medial moraine. The terminus in the 2009 Google Earth image has a low slope and is uncrevassed.  This indicates the terminus reach is relatively inactive, but does not appear stagnant.   Tennant and Menounos (2012) examined changes of the Rocky Mountain glaciers just east of this region and found between 1919 and 2006 that glacier cover decreased by 590 square kilometers, 17 of 523 glaciers disappeared and 124 glaciers fragmented into multiple ice masses. This will happen at Dimsal Glacier as it has at Cummins Glacier.  Bolch et al (2010)  observed a 15% area loss from 1985-2005 in this region.  The snowline has been above the icefall at 2400+ m in 2013, 2014 and 2015, indicative of negative mass balance that will lead to continued retreat.  The glaciers name is not due to its future prospects, but its future prospects are indeed dismal.
dismal glacier ge
revelstoke-dam-powerhouse-columbia-river-place
BCHydro image of Revelstoke Dam

dismal glacier
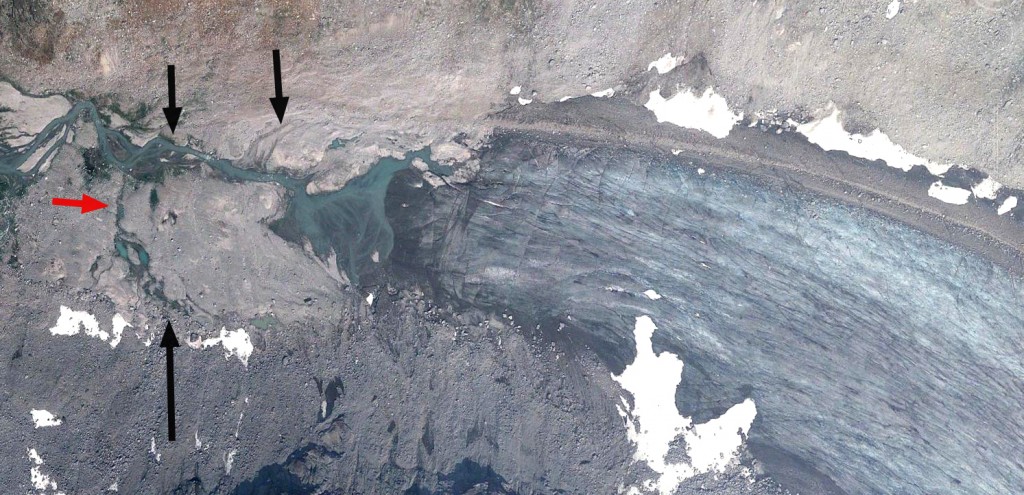
Google Earth image of Dismal Glacier terminus in 2009. Red arrow indicates 1988 terminus position, black arrows various recessional moraine features.