Brady Glacier, Alaska Nunatak Expansion and High Snowline 2018

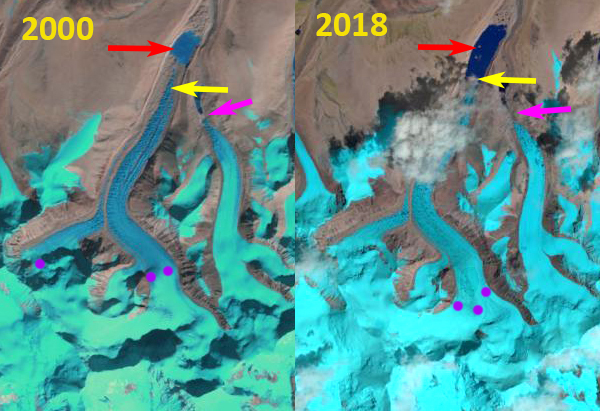
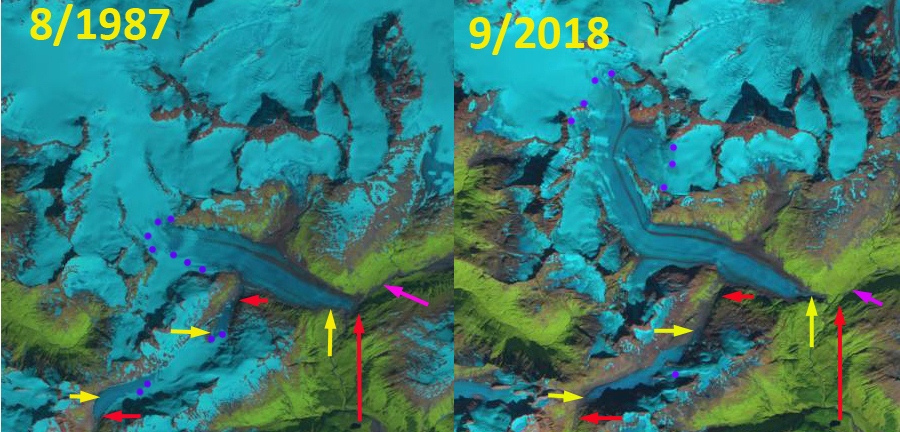
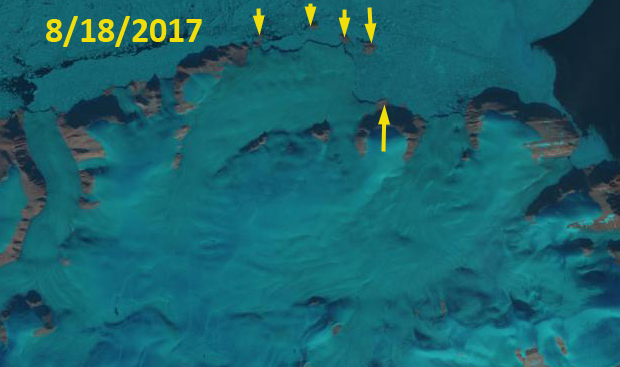
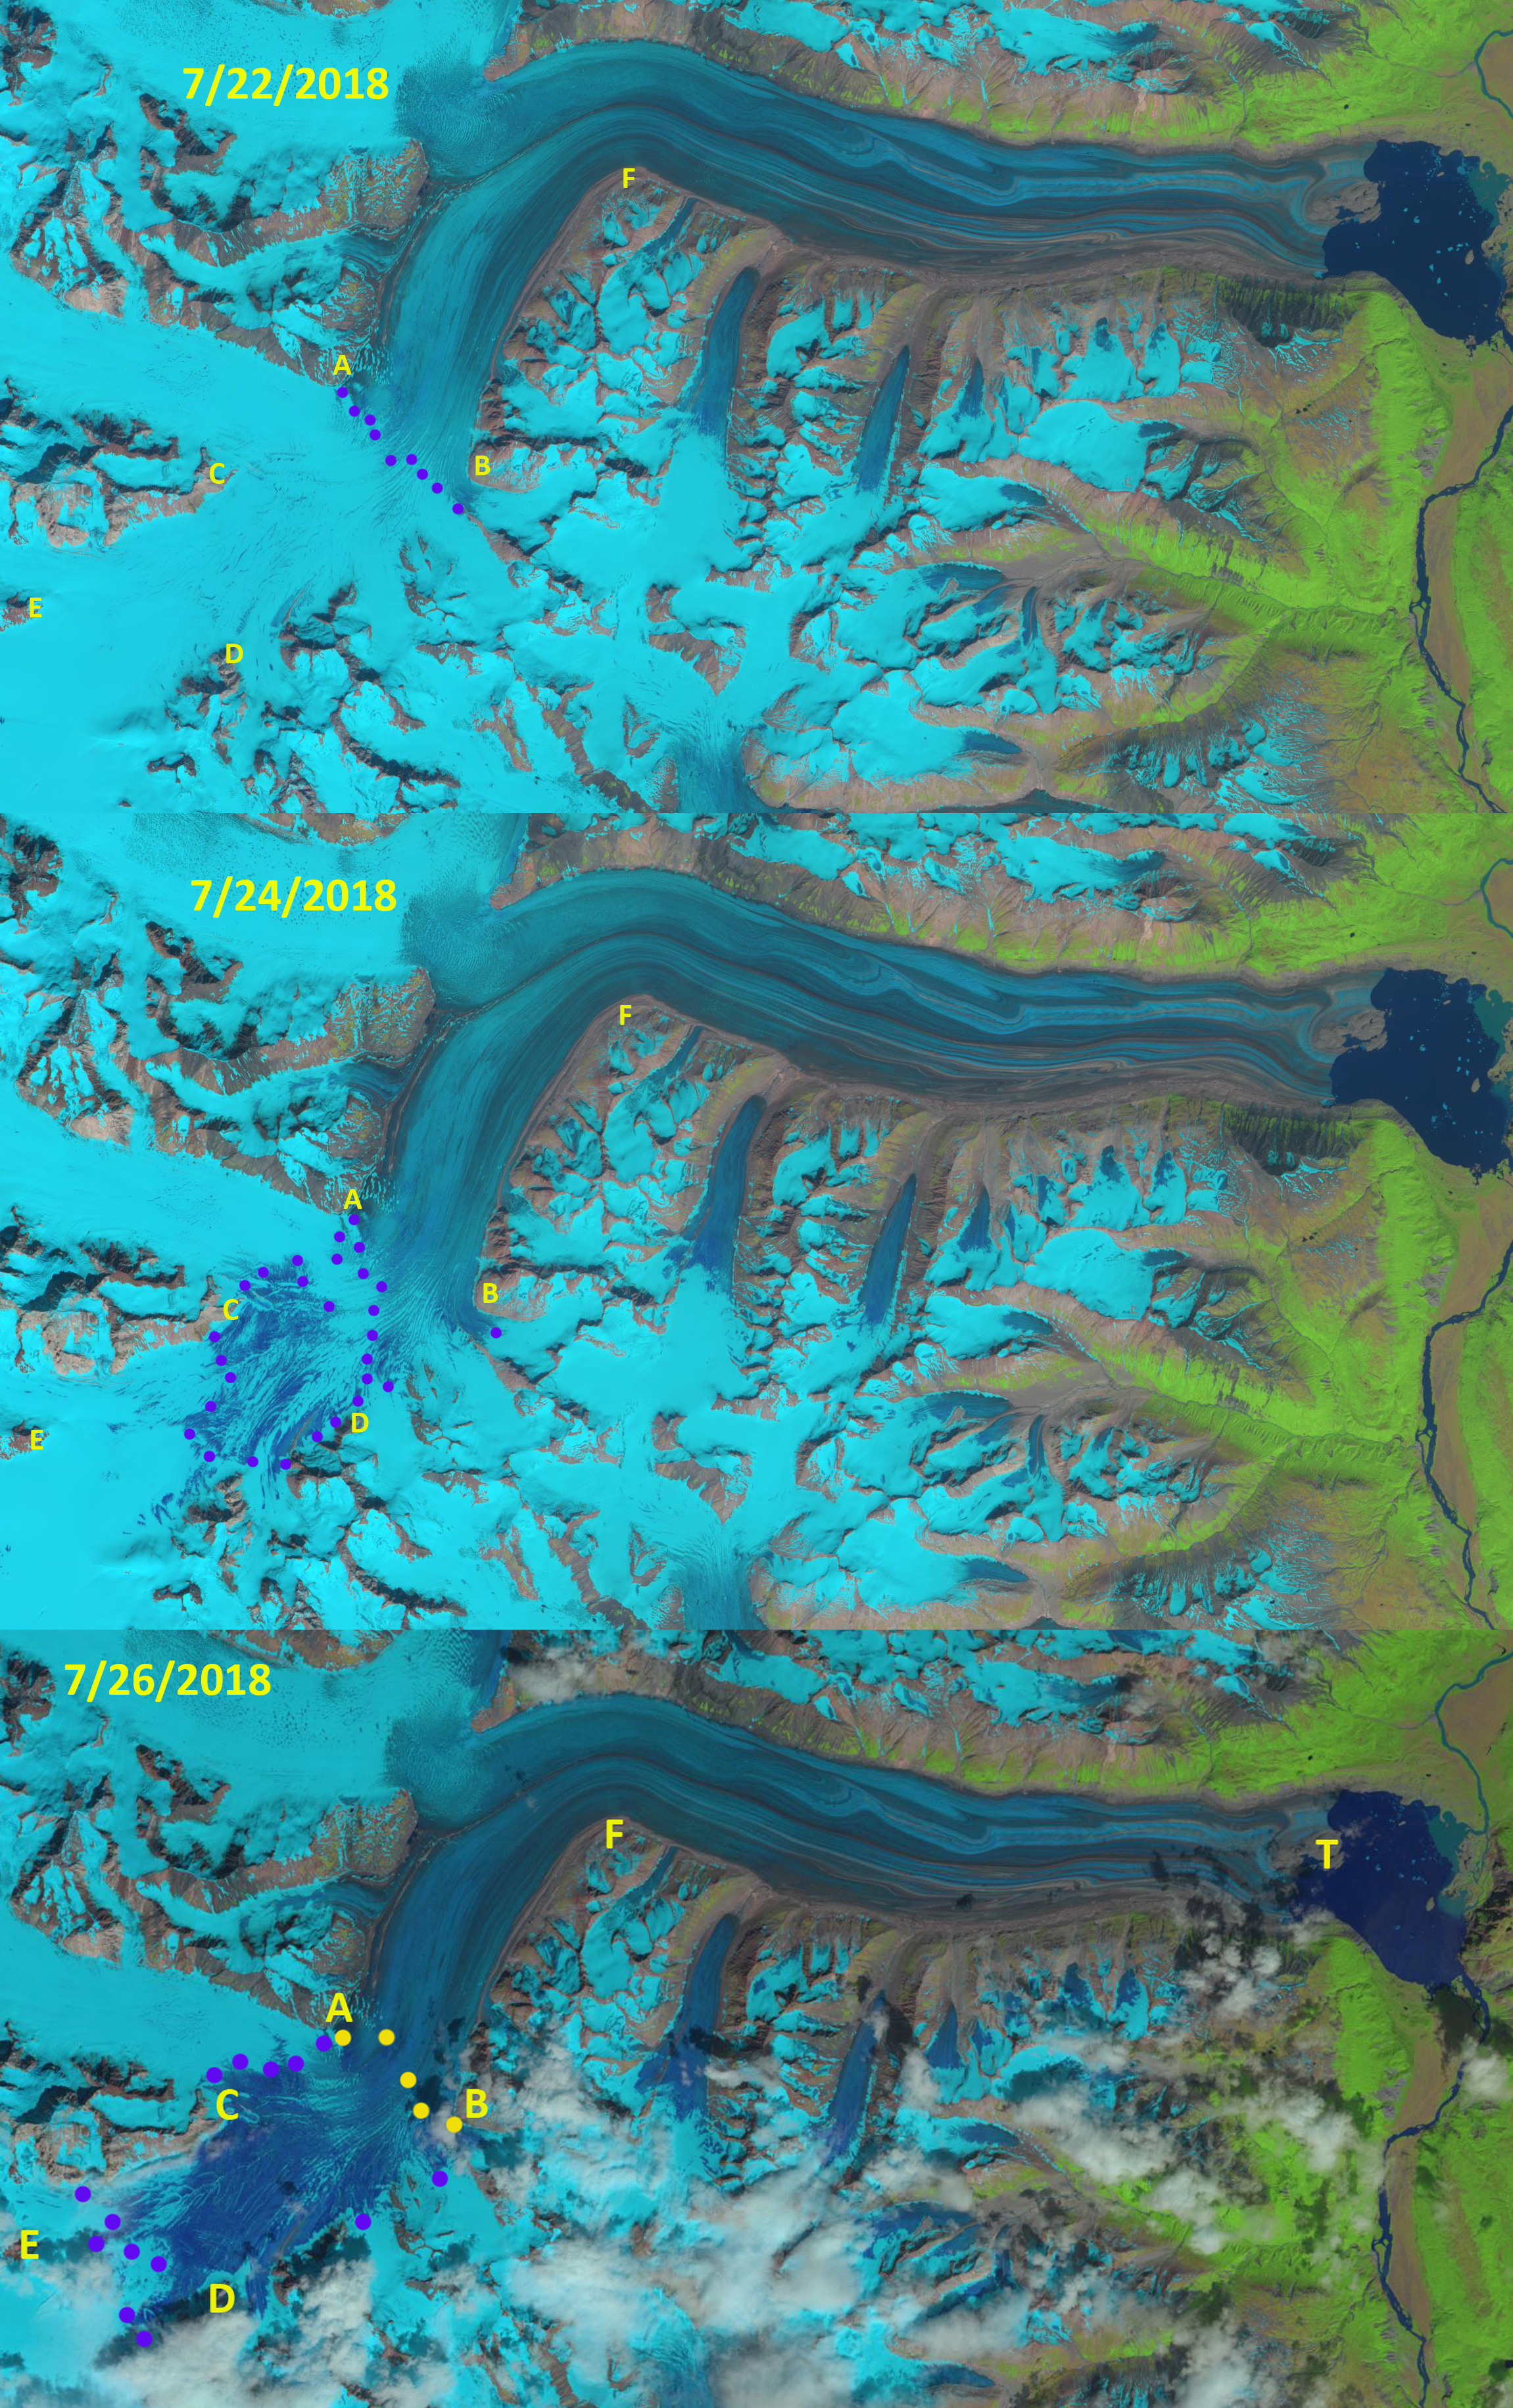
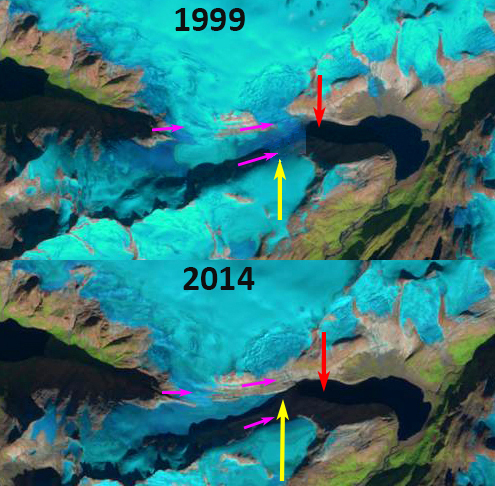
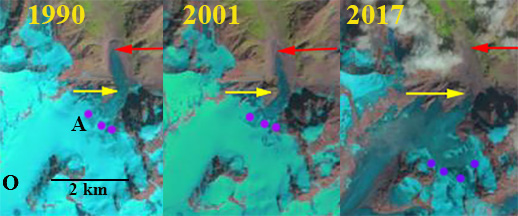
Emergence of Nunataks at Point A, B and C at 850 m on Brady Glacier from 1986 and 2018 Landsat Images.  Transient snowline on 9/21/2018 indicated by purple dots.

Brady Glacier,  is a large Alaskan tidewater glacier, in the Glacier Bay region that is beginning a period of substantial retreat Pelto et al (2013). Pelto et al (2013) noted that the end of season observed transient snowline averaged 725 m from 2003-2011, well above the 600 m that represents the equilibrium snowline elevation, for the glacier to sustain its current size. In 2015, 2016 and 2018 the snowline has been at 900-1000 m.  This is leading to thinning across of what was much of the accumulation zone.  Here we examine Landsat images from 1986 to 2018 to identify signs of this thinning.

In 1986 Point A and B have insignificant rock exposure, while C has a limited single rock nunatak.  By 2000, below there is bedrock exposed west of Point A and B, with two small nunataks near C.  By 2015 there is a 2 km long bedrock ridge at Point A and a ~1 km long bedrock ridge at Point B.  The snowline in 2015 is just above Point B and C at 900 m.  In 2016 on Oct. 1 2016 after the end of the typical melt season the snowline is at 900 m. In 2018 the snowline on Sept. 21 is at 1000 m.  At Point A the bedrock Ridge is now 2300 m long and up to 300 m wide.  At Point A the ridge is 1100 m long.  At Point C a third nunatak has emerged and the series of nunataks will soon merge into a single ridge.

The persistent high snowlines indicate the consistent accumulation zone is now above 900 m, below this point thinning will continue.  The mean elevation of the glacier is at 720 m and thinning is significant below 1000 m from 1995-2011(Johnson et al 2013).  That far less than 50% of the glacier is retaining snowpack and widespread thinning will drive further retreat of the distributary glacier termini in expanding lakes noted by Pelto et al (2013) and a the 2016 blog post.   Brady Glacier abuts the adjacent Lampugh Glacier that has and will be impacted by a large landslide.

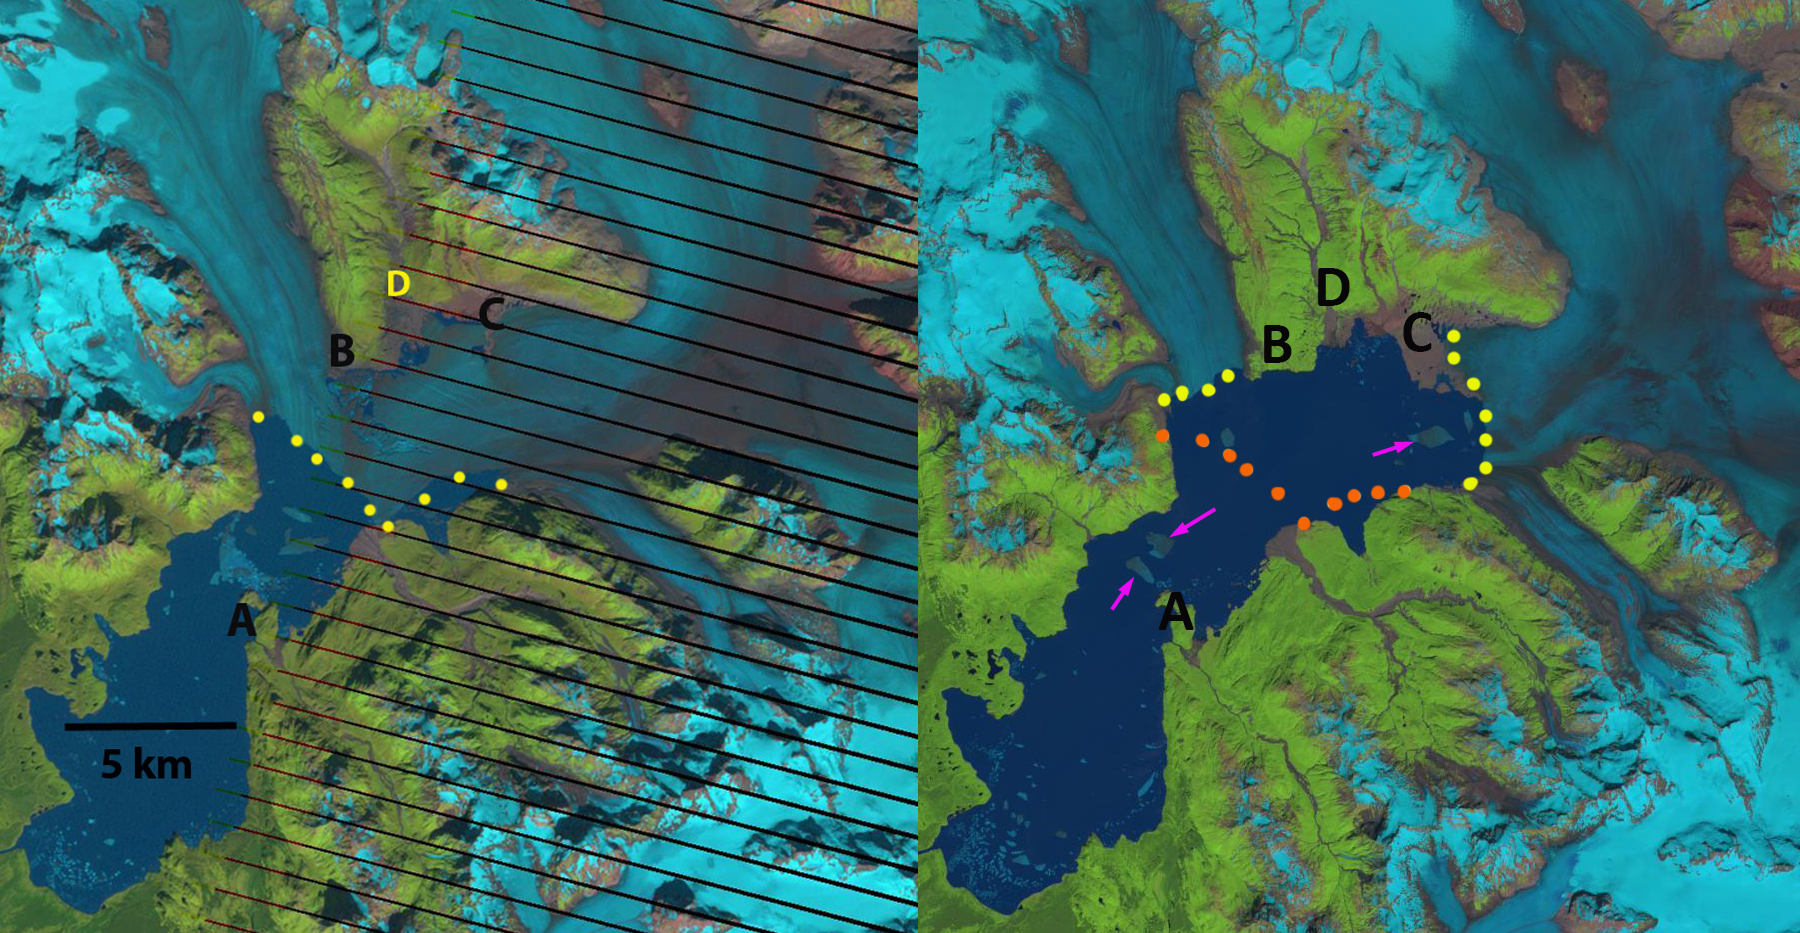
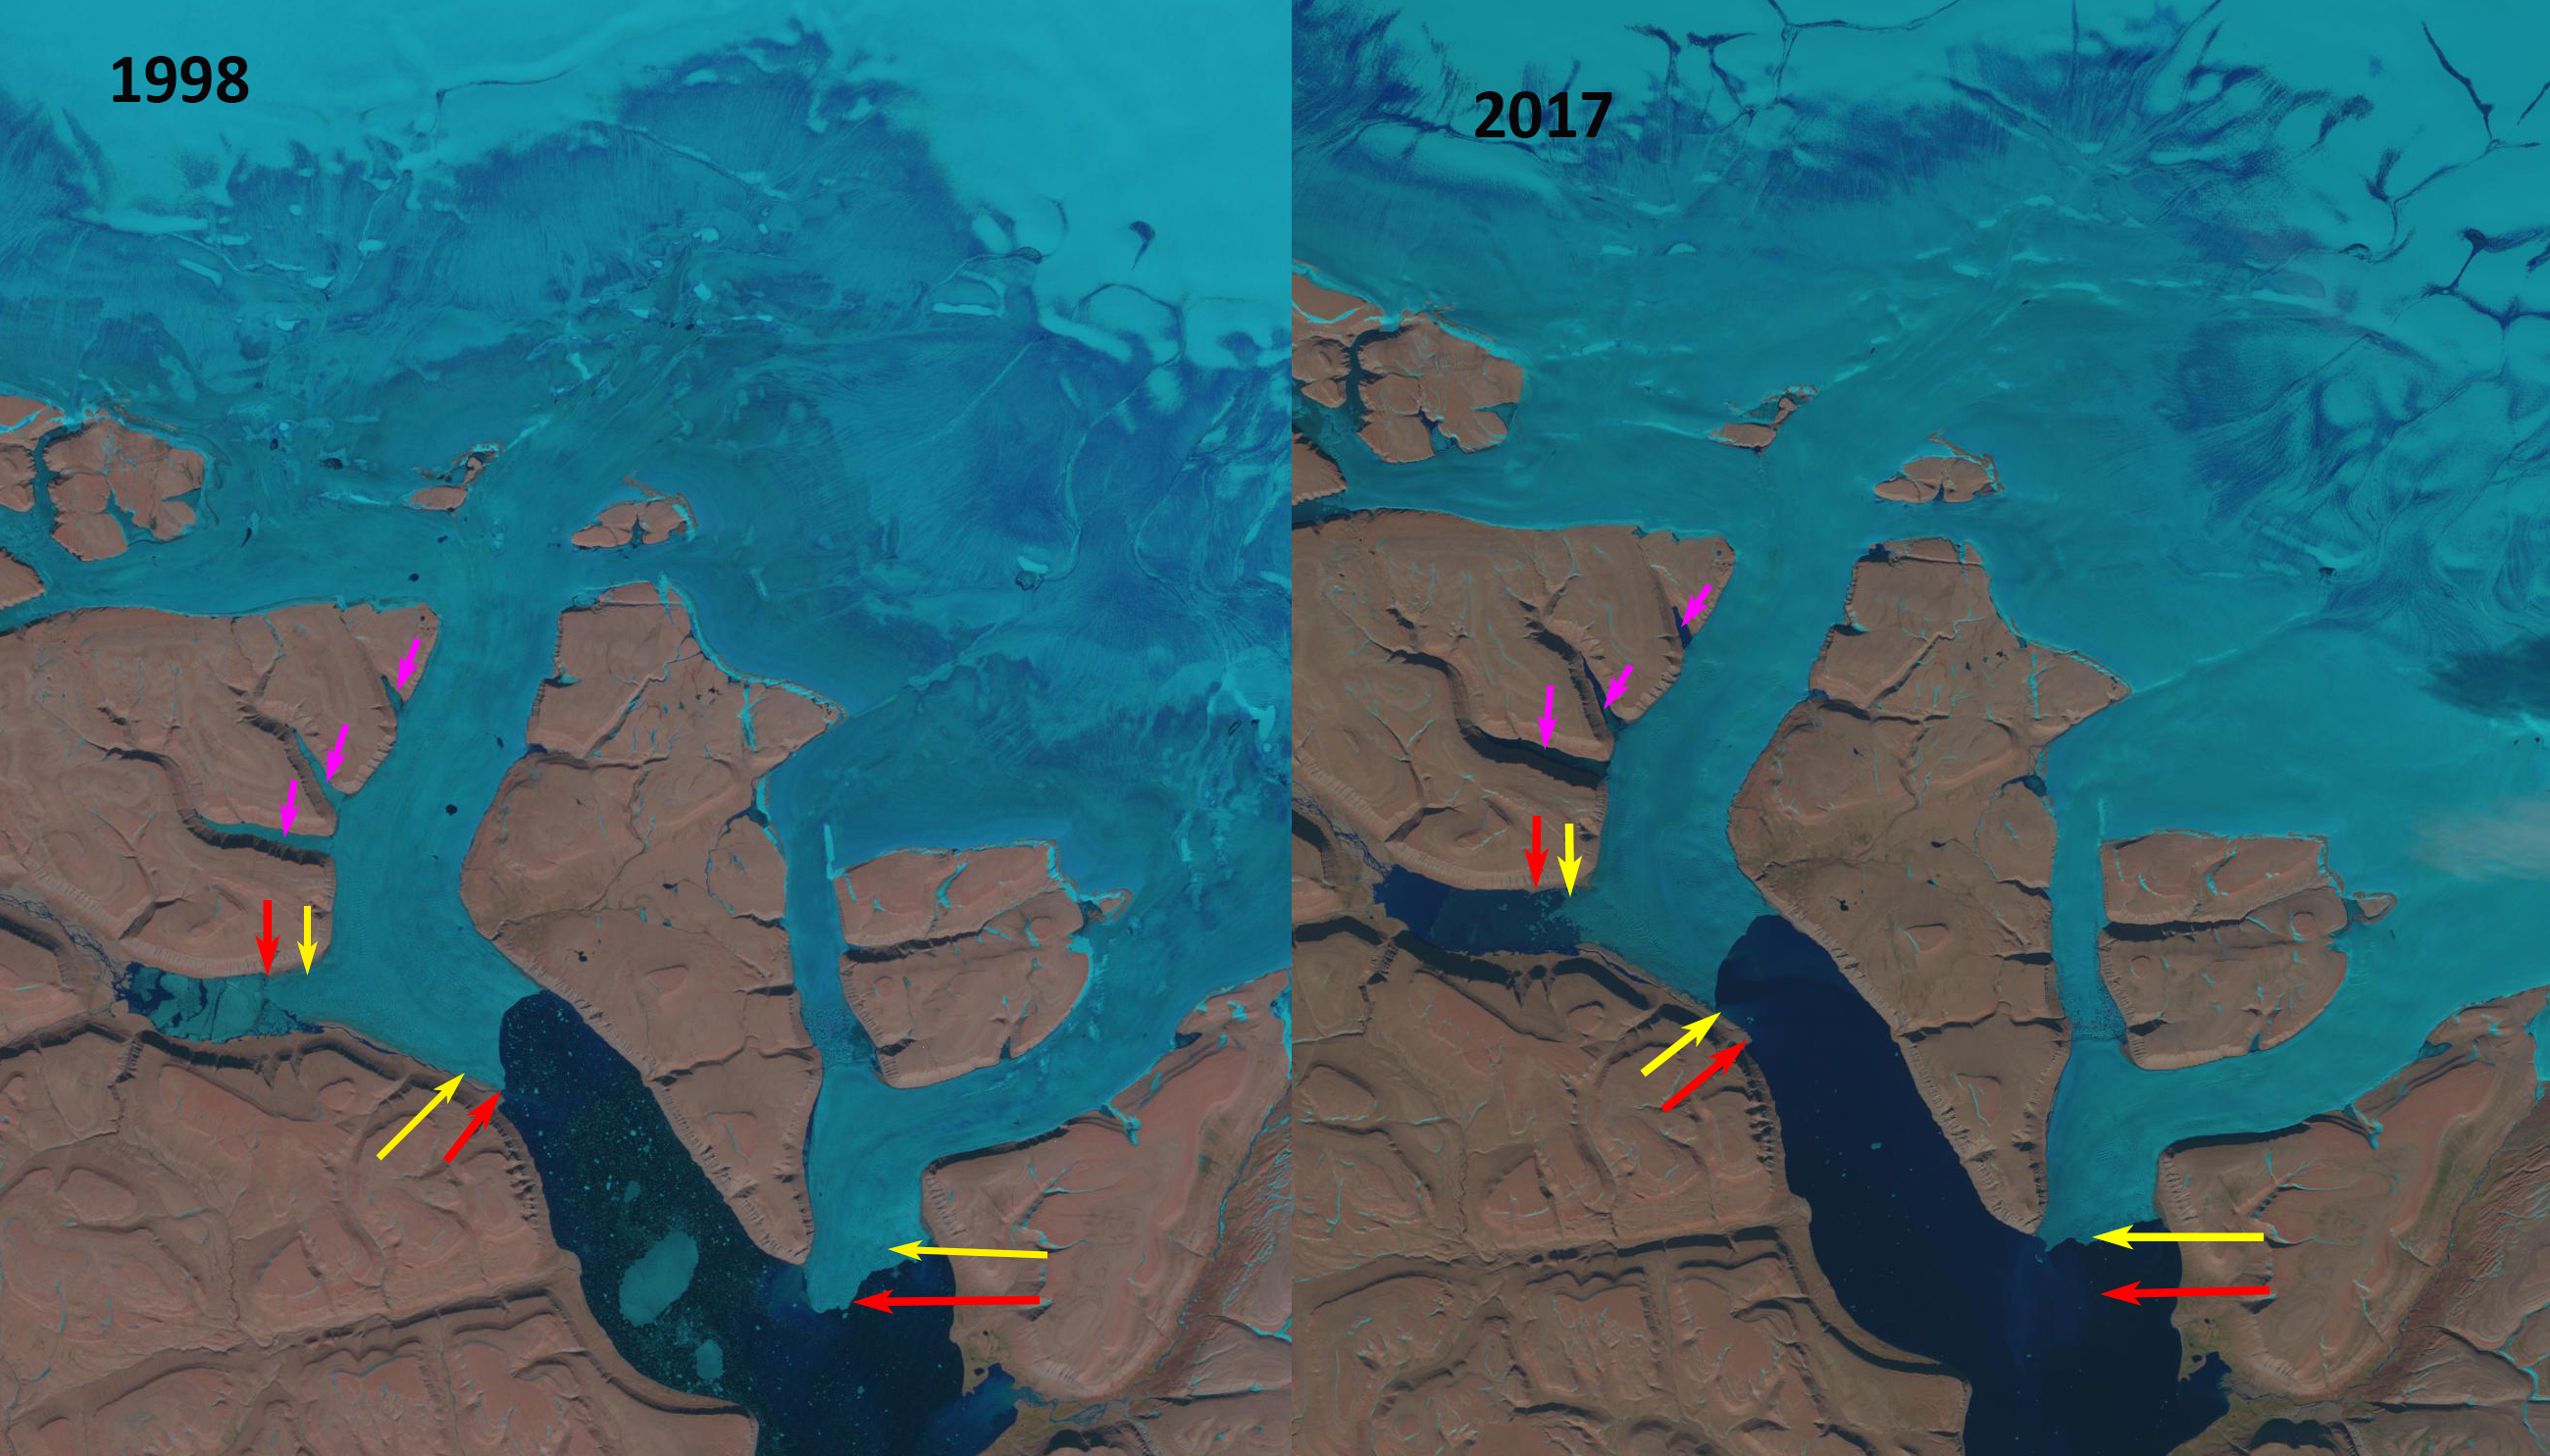
Trick Lakes: In 1986 North and South Trick Lake are proglacial lakes in contact with the glacier. By 2016 the two lakes are no longer in contact with the glacier, water levels have fallen and a third lake East Trick Lake has formed. The more recently developed East Trick Lake is the current proglacial Trick Lake, a large glacier river exits this lake and parallels the glacier to the main Brady Glacier terminus, going beneath the glacier for only several hundred meters.

North Deception Lake had a limited area in 1986 with no location more than 500 m long. By 2016 retreat has expanded the lake to a length over 2 km. The width of the glacier margin at North Deception Lake will not change in the short term, but the valley widens 2 km back from the current calving front, thus the lake may grow considerably in the future.

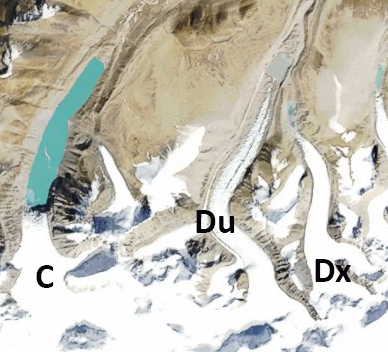
South Dixon Lake This new lake does not have an official name. It did not exist in 1986, 2004, 2007 or 2010. It is nearly circular today and 400 m in diameter.

Dixon Lake: It is likely that retreat toward the main valley of the Brady Glacier will lead to increased water depths at Dixon Lake, observations of depth of this lake do not exist. Retreat from 1986 to 2016 has been 600 m.

Bearhole LakeBearhole Lake is expanding up valley with glacier retreat, and there are no significant changes in the width of the valley that would suggest a significant increase in calving width could occur in the near future. Currently the lake is 75 m deep at the calving front and there has been a 1400 m retreat since 1986 Capps et. al. (2013).

Spur Lake:It is likely that retreat toward the main valley of the Brady Glacier will lead to increased water depths at Spur Lake. the depth has fallen as the surface level fell from 1986-2016 as the margin retreated 600 m, leaving a trimline evident in the 2016 imagery.

Oscar Lake has experienced rapid growth with the collapse of the terminus tongue. Depth measurements indicate much of the calving front which has increased by an order of magnitude since 1986 is over 100 m. The tongue as seen in 2014 Google Earth image will continue to collapse and water depth should increase as well. The central narrow tongue has retreated less than 200 m since 1986, but the majority of the glacier front has retreated more than 1 km since 1986.

Abyss Lake: Continued retreat will lead to calving width expansion> The retreat from 1986 to 2016 has been 400 m. The water depth has been above 150 m at the calving front for sometime and should remain high.

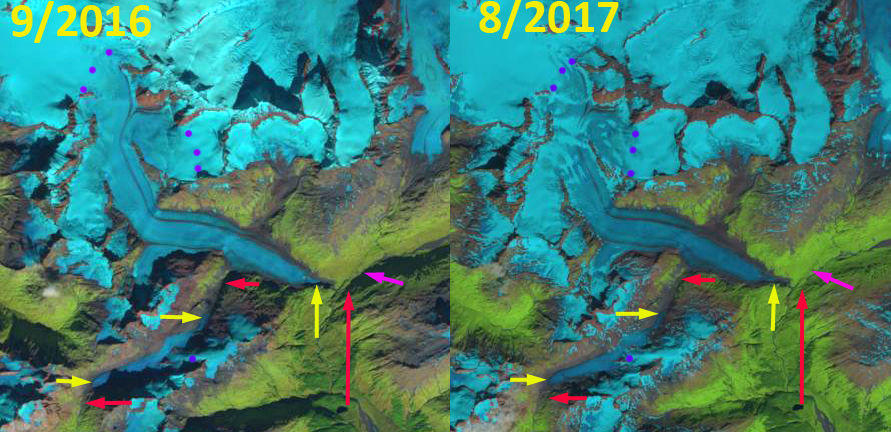
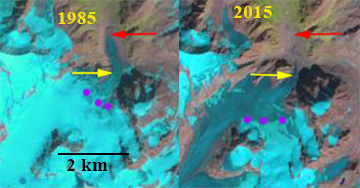
Emergence of Nunataks at Point A, B and C at 850 m on Brady Glacier from 2000 and 2015 Landsat Images.  Transient snowline on 9/21/2018 indicated by purple dots.

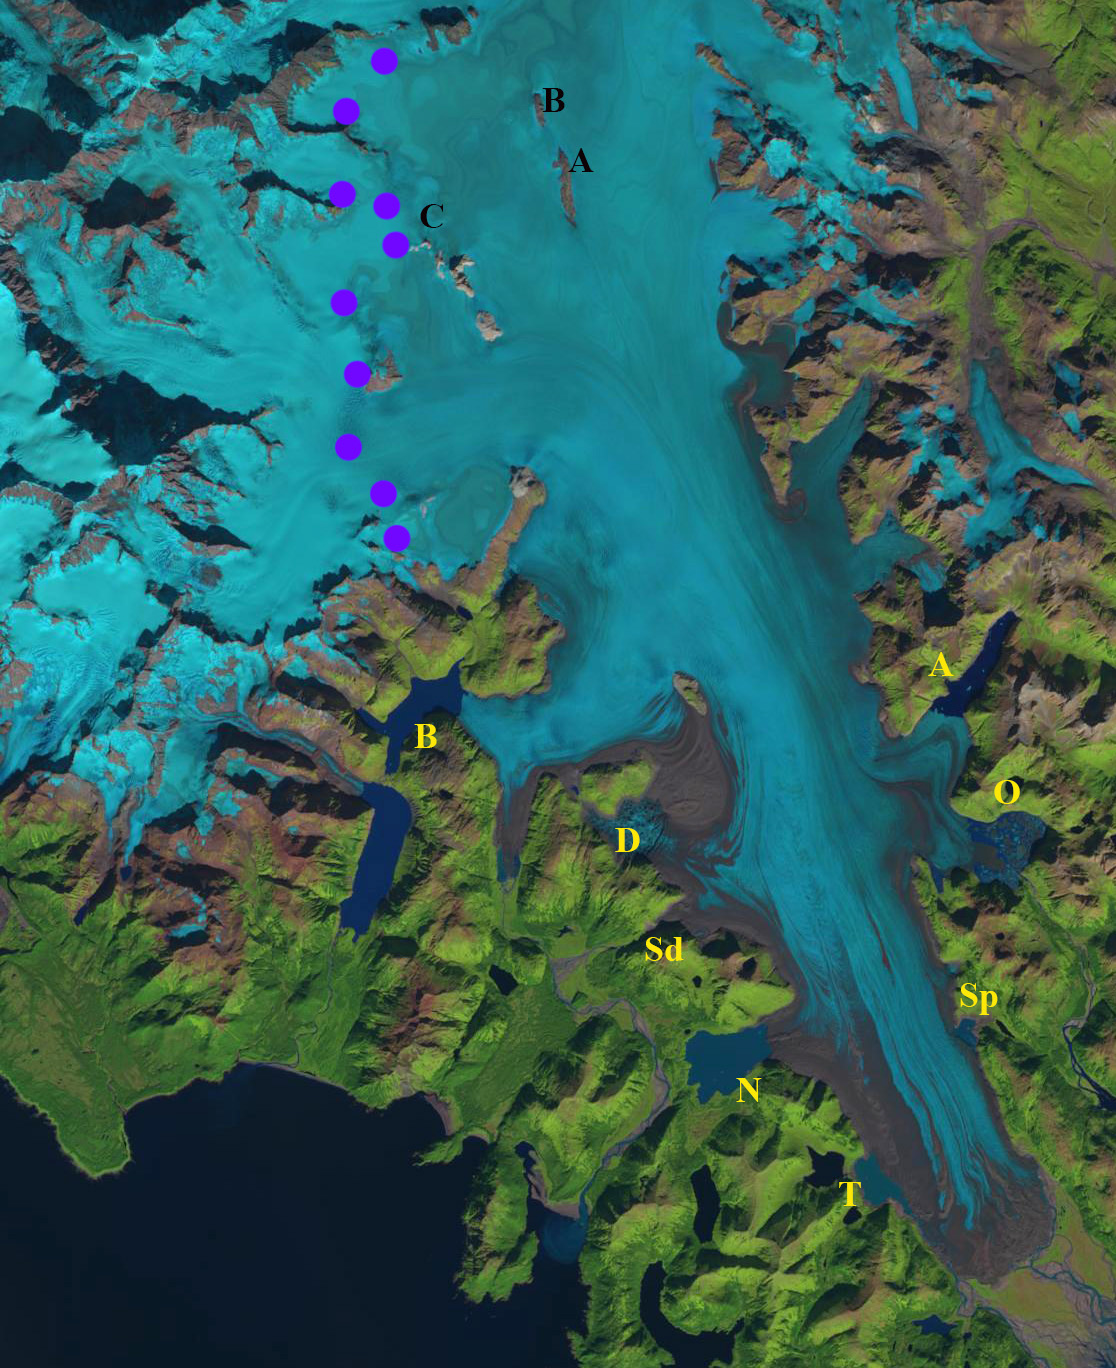
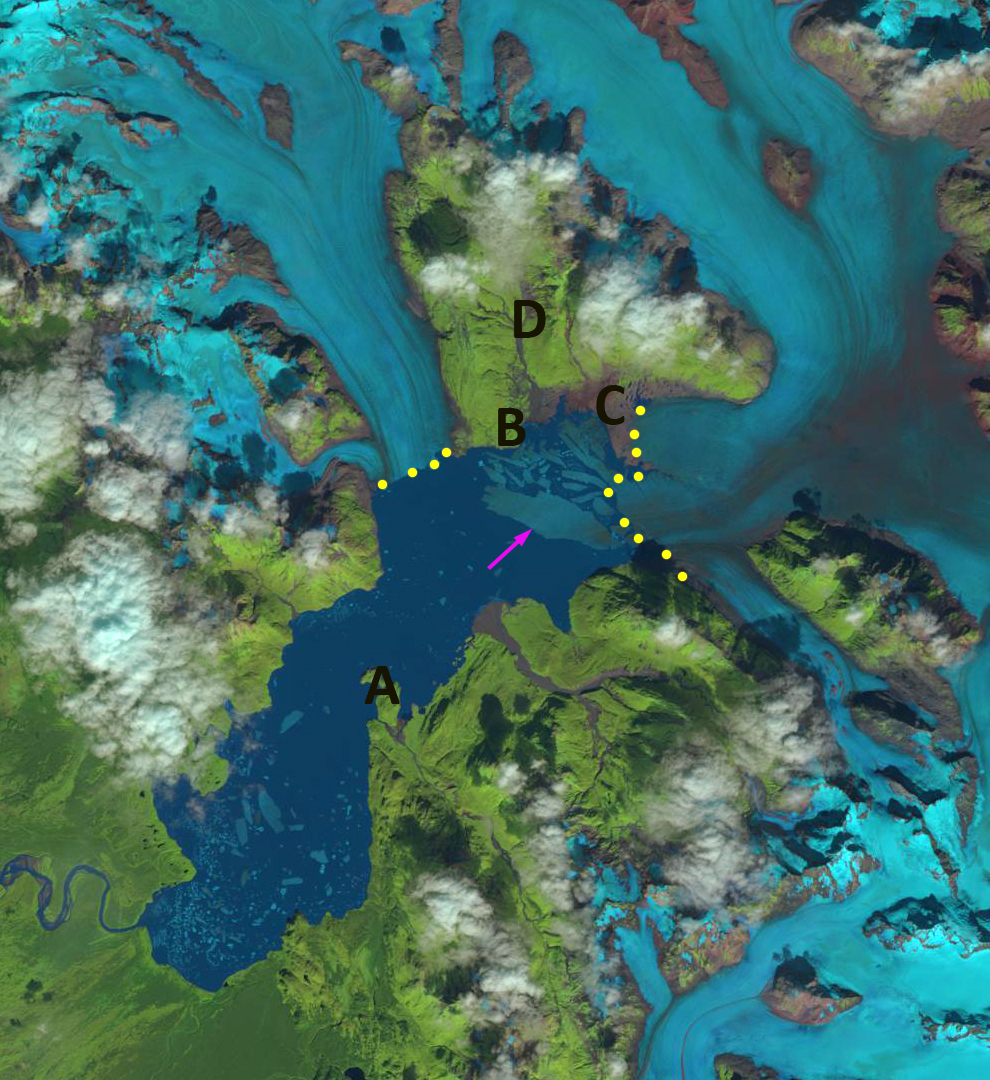
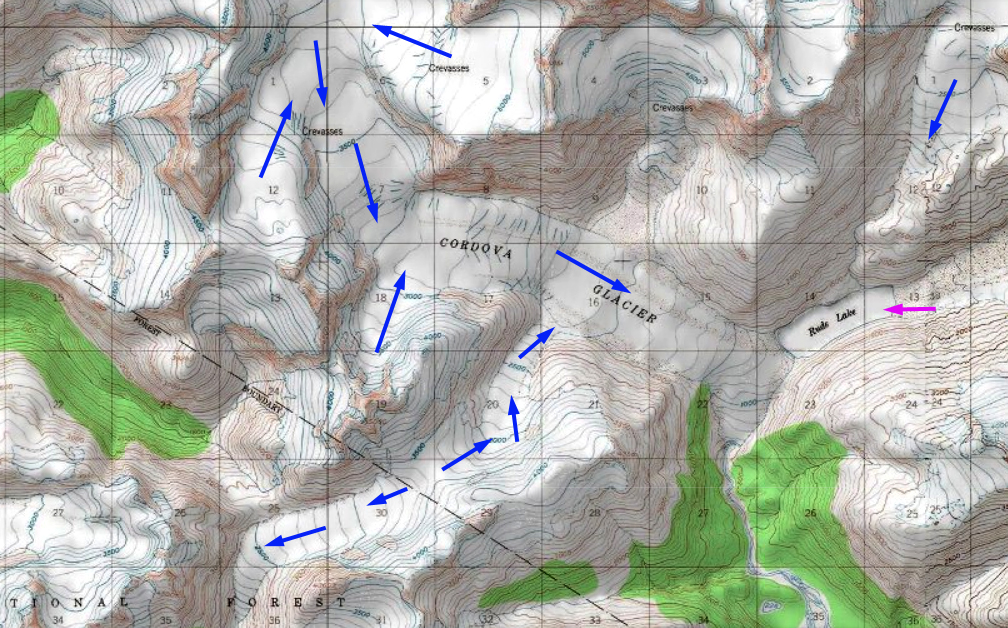
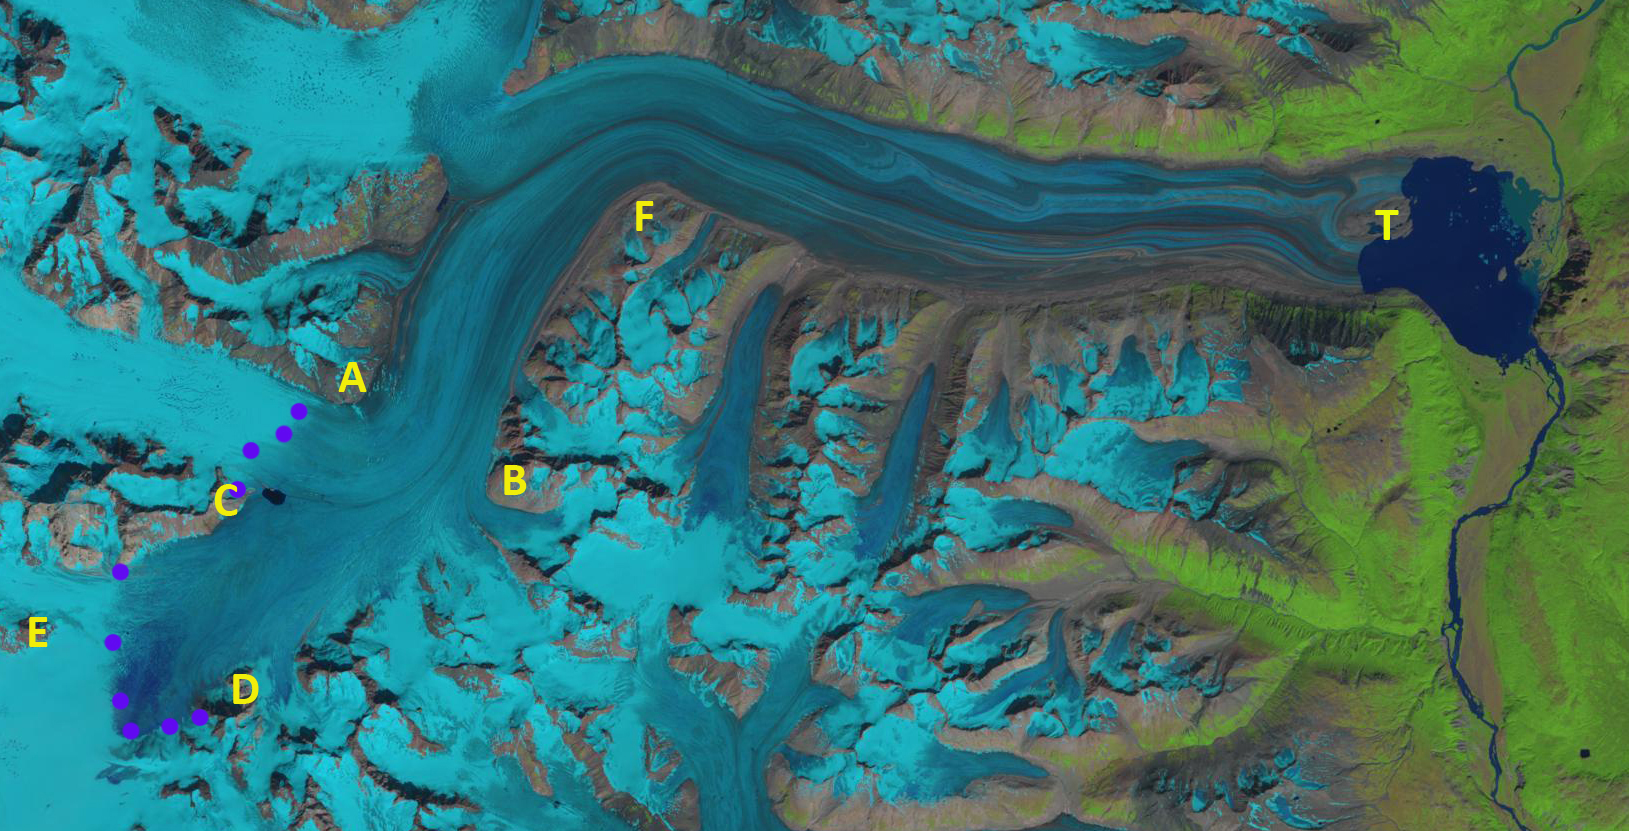
Landsat image of Brady Glacier on 9/21/2018 indicating the snowline (purple dots)  and the emerging nunataks at Point A-C. Lakes noted are: A=Abyss, B=Bearhole, D=Dixon, N=North Deception, O=Oscar, Sd=South Dixon, Sp=Spur, T=Trick.

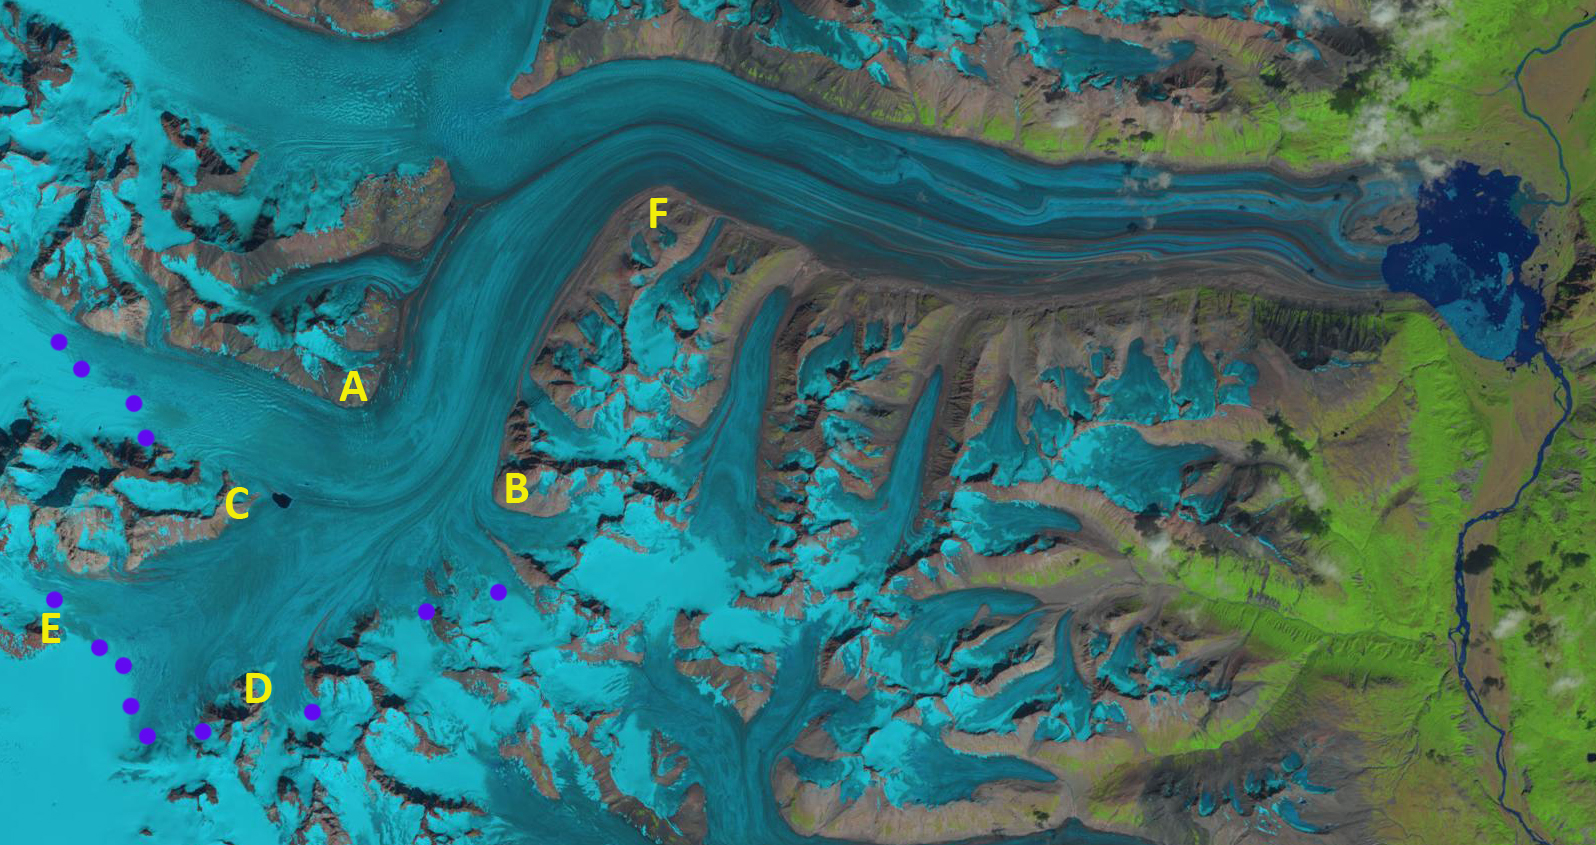
Landsat image of Brady Glacier on 10/1/2016 indicating the snowline (purple dots)  and the emerging nunataks at Point A-C.

Duiya Glacier, China Retreat Drives Lake Expansion

Duiya Glacier, China in 1990 and 2017 Landsat images.  Red arrow indicates 1990 terminus, yellow arrow the 2017 terminus, pink arrow the terminus area of Duosangpuxi purple dots the snowline

Duiya Glacier, China is in the Pumqu Basin northwest of Mount Everest.  The glacier terminates in an expanding lake.  King et al (2018) report the proglacial lake is dammed by a full moraine loop, and the glacier loses mass via calving as and surface melt.  Here we use Landsat imagery to identify changes from 1990-2018. The Pumqu River becomes the Arun River in Nepal , which has a proposed 900 MW hydropower plant under development .

In 1990 the glacier terminated in a small proglacial lake, 500 m across at 5500 m.  The snowline in 1990 was at 6000 m.  The Duosangpuxi Glacier to the east also terminates in a proglacial lake.  In 2000 the lake has expanded to 800 m in length due to retreat.  The glacier snowline is at 6000 m again.   The Duosangpuxi Glacier to the east has retreated from the lake it formerly terminated in.  By 2017 the glacier had retreated 1020 m a rate of 37 m/year. The lake is now over 1.5 km long.  The snowline in 2017 is at 6200 m.  In September 2018 the snowline has likely not reached its highest elevation but is just below 6200 m.  The terminus is obscured by clouds, but has not changed significantly from 2017.  There icebergs in the lake indicating calving continues.  The high snowline in recent years indicate continued mass loss that will drive further retreat.

King et al (2017) examined the mass balance of 32 glaciers in the Everest region for the 2000-2015 period including the Duiya and found a mass loss of ~0.5 m/year, with the loss of lake terminating glaciers at ~-0.7 m/year.  The retreat of this glacier is like that of Yanong Glacier and Chaxiqudong Glacier whereas Rongbuk Glacier has experienced supraglacial lake expansion, and thinning without as much retreat.

Duiya Glacier, China in 2000 and 2018 Landsat images.  Red arrow indicates 1990 terminus, yellow arrow the 2017 terminus, pink arrow the terminus area of Duosangpuxi purple dots the snowline.

Broader view of the Duiya Glacier (Du) and neighboring glaciers Cuolangma (C) and Duosangpuxi (Dx), each terminating in a lake in 1990. 

Yakutat Glacier Terminus Collapse Nears Completion, 45 km2 lost 2010-2018

Landsat images from 2010 and 2018 with terminus indicated by yellow dots in both, the orange dots indicate 2010 margin on 2018 image. Point A indicates the 1987 terminus location, pink arrows indicate icebergs. Main terminus now extends south near Point C. Northern terminus extends west from Point B.

Yakutat Glacier, Alaska has experienced a spectacular retreat in the last decade losing 45 km² from 2010-2018.  The Yakutat Glacier during the 1894-1895 Alaskan Boundary Survey ended near a terminal moraine on a flat coastal outwash plain. By 1906 the glacier had retreated from the moraine and a new lake was forming, Harlequin Lake.  From 1906-1948 the glacier retreated an additional 5 km. From 1948-1958 the glacier retreated 3.6 km. Here we examine Landsat imagery to quantify the retreat from 2010-2018. This is an update to a Yakutat Glacier 2016 post

In 2010 the glacier has just retreated from the peninsula at Point A, the valley at D was deglaciated, a small strip of bedrock-sediment was exposed at C from that had been beneath the glacier, and B was still well inland of the terminus. An aerial image of the glacier indicates significant rifting, blue arrows,  in 2010 that leads to the substantial 2013 breakup.  Rifts are not just crevasses, as they typically extend to the base of the glacier along part of the glacier.  They typically form in areas of a glacier that are near flotation.  In this case an area that has thinned until approximate flotation (Benn, Warren ann Mottram, 2007). In 2013 there is a large area of icebergs and melange in front of the terminus, yellow dots. By 2013 the northern arm of the glacier had retreated 6.4 km from the peninsula at A toward the peninsula at B. The central arm of the glacier toward C had retreated 7.5 km and the retreat on the southern edge of the glacier was 6.5 km.  In 2015 the snowline is quite high at 2200 m, leaving very little of the glacier in the accumulation zone. In 2015 a large iceberg detached pink arrow, that is 5 km by ~1 km. In 2016 the snowline is again around 2200 m. From 2013 to 2016 the glacier retreated from Point B to Point C on the northern side and to Point E on the southern side this is a distance of 10.2 km in thirty years since 1987 or 340 m/year. In 2016 the Peninsula extending across the lake from Point C is 2.5 km long. The terminus is resting on this and adjacent shoals across 50% of its width.  The iceberg has diminished to 2.5 km long and 700 m wide, pink arrow.  The northern terminus extending west from Point B has changed little from 2013-2016. The 2018 image compares the 2010 position (yellow dots) with 2018 (orange dots), indicating an area of 45 km² lost.  The main terminus retreated 7 km. There are some small icebergs in 2018.  The ability to produce icebergs as large as in 2015 has been lost as the calving front has been restricted by the Peninsula which is now 3 km long, leaving less than a 3 km wide calving front.   The narrower calving front and reduced water depth should in the short term reduce retreat. The northern terminus near Point B has experienced limited retreat since 2013.

The glacier has thinned by more 200 m on average according to the preliminary thickness change maps from a U. Alaska-Fairbanks project (Truessel et al 2013) and updated by Truessel et al (2015). The Yakutat Glacier does not have a high accumulation zone and the recent increase in the snowline elevation and thinning of the glacier have led to a substantial shrinking of the accumulation zone and thinning of the glacier in the accumulation (Truessel et al 2013). This glacier does not have a persistent significant accumulation zone in 2015, 2016 and 2018 and cannot survive (Pelto, 2010).  Truessel et al (2015) modelling indicates a reduced rate of retreat from 2020-2030, which supports the expected reduced calving.  Their model also indicates the glacier will disappear between 2070 and 2110 depending on the warming scenario.  For a calving glacier to be in equilibrium it needs to have more than 60 % of its area snowcovered at the end of the summer, this was not achieved in 2015, 2016 or 2018.. The glacier is in the midst of a large ongoing retreat. The retreat rate and calving mechanism is similar to that of Grand Plateau GlacierAlsek Glacier and Gilkey Glacier. However, unlike these Yakutat Glacier lacks an accumulation zone, a better analog is East Novatak Glacier, which also has a lower elevation accumulation zone.

2010 image of the Yakutat Glacier terminus reach with blue arrows indicating rifts.

Landsat images from 2013 with terminus indicated by yellow dots. Point A indicates the 1987 terminus location. Note large area of melange and icebergs.

Landsat images from 2015 with terminus indicated by yellow dots. Point A indicates the 1987 terminus location.  Main terminus now extends south near Point C. Northern terminus extends west from Point B. Note large iceberg that calved in 2015, pink arrow.

Landsat images from 2016 with terminus indicated by yellow dots. Point A indicates the 1987 terminus location. Main terminus now extends south near Point C. Northern terminus extends west from Point B.Note large iceberg that calved in 2015, pink arrow.

Cordova Glacier, Alaska Loses a Lake & a Tributary

Cordova Glacier retreat and glacier separation revealed by Landsat images from 1987 and 2018, red arrow is the 1987 terminus position of main glacier and tributaries, yellow arrow is the 2018 terminus location.  Purple dots indicate the snowline and the pink arrow the former location of Rude Lake. 

Cordova Glacier is located at the head of the western fork of the Rude River in the Chugach Mountains, Alaska. In USGS maps the glacier dams Rude Lake which is ~1.5 km long and 0.5 wide (see below).  Molnia (2008) noted the lake was gone in 2008 and the former bed was covered by vegetation indicating the lake had not recently drained for the last time. Here we examine changes in the glacier from 1987-2018 using Landsat imagery.

In the USGS map of the region from the 1950’s, Rude Lake is dammed by the terminus of Cordova Glacier, pink arrow.  There is a significant tributary entering from the southwest a short distance above the terminus. By 1987  Rude Lake has drained and much of the lake bottom has been occupied by vegetation.  The terminus does still extend to the bottom of the West Branch Rude River Valley. The tributary entering from the southwest has detached from Cordova Glacier.  The snowline is at 950 m in August 1987. In 9/2016 and 8/2017 the transient snowline is at 1400 m and 1350 m respectively. The former southwest tributary like the main glacier has limited retained snowcover that cannot maintain the glacier at it current size. In early September 2018 the snowline on Cordova Glacier is again at 1400 m.  The main terminus has retreated 800 m since 1987.  The southwest tributary has both a western and eastern terminus that have retreated 1100 m and 500 m respectively.  The total length of the southwest tributary declined from 6.1 km to 4.1 km in length the entire valley reach of the glacier has lost snowpack in 2016-2018.  That heralds that this section of the glacier will melt away.

The retreat of this glacier is less significant than many glaciers in the region including Alsek Glacier and Shoup Glacier.  The high snowline in 2018 indicative of high ablation, which was also noted on Lowell Glacier.

Alaska Topographic Map of Cordova Glacier indicating Rude Lake, pink arrow. 

Cordova Glacier terminus position and snowline revealed by Landsat images from 2016 and 2017, red arrow is the 1987 terminus position of main glacier and tributaries, yellow arrow is the 2018 terminus location.  Purple dots indicate the snowline and the pink arrow the former location of Rude Lake. 


Croker Bay Glacier, Nunavut Canada Poised for Further Retreat

Croker Bay Glacier, Devon Ice Cap, Nunavut in Landsat images from 1998 and 2017.  The red arrows indicate the 1998 terminus location, yellow arrows the 2017 terminus location.  The pink arrows indicate three inlet on the north glacier. 

Croker Bay Glacier drains the southwest quadrant of the Devon Ice Cap, Nunavut.  A study by Van Wychen et al (2012) focused on velocity changes of the Devon ice Cap. They identify that Croker Bay Glacier has two main termini, the south and north terminus and that the region of higher velocity +100 m/year for these glaciers penetrates further into the ice cap than other outlets.  This is on the opposite side of the ice cap from where three new islands have emerged due to retreat.

In 1998 the south terminus of Croker Glacier extends 1.2 km beyond the tip of the peninsula on its west margin. In 1998 the northern terminus has both an east and a west terminus. The west terminus extends up a side valley.  The pink arrows indicate three side channels into which the glacier flows into the southern two.  The transient snowline in 1998 is ~1100 m, with the crest of the ice cap at 1800 m.  In 2001 there is limited change and a recent snowfall has covered most of the glacier. By 2017 the southern terminus has retreated to approximately parallel with the western margin peninsula, a distance of 1700 m.  The northern terminus has retreated 1400 m on the eastern side and 1100 m on the western side. The result is a much thinner ice connection reaching the southern side of the Croker Bay fjord. The transient snowline is high at ~1100 m again.  The 2018 image is from 2018. The snowline has already begun to decline due to a late summer snow event. There are a number of small icebergs in Croker Bay, particularly trapped in front of the western most terminus indicating continued calving retreat.  The observations here are a local example resulting from the ongoing mass losses  found on Canadian Arctic ice caps that have been losing mass for decades and that mass loss accelerated in 1996,  Noel  et al (2018).  This has led to widespread area losses.  White and Copland (2018) quantify the change in the areal extent of 1773 glaciers on Northern Ellesmere Island from 1999 to 2015. They found regional glacier area decreased by ∼6%, with not a single glacier increasing in areal extent.

Croker Bay Glacier, Devon Ice Cap, Nunavut in a Landsat image from 2001 and a Sentinel image from 2018.  The red arrows indicate the 1998 terminus location, yellow arrows the 2017 terminus location.  The pink arrows indicate three inlet on the north glacier. 

Velocity Map of Devon Ice Cap, which is Figure 1 from Van Wychen et al (2012)

Three New Islands Released from Devon Ice Cap, Canada

The northern coast of the Devon Ice Cap with Lady Ann Strait at the top in a 2000 and 2017 Landsat image indicating the development of islands at Cape Caledon, at yellow arrows. See map below. 

The Devon Ice Cap on Devon Island in the Canadian Arctic ice cap’s area has an area of 15,000 km², with a volume of 3980 km³. The ice cap has been the focus of an ongoing research program led by the University of Alberta Arctic and Alpine Research Group. The mass balance from 1960-2009 was cumulatively -5.6 m, with nine of the eleven most negative years occurring since 1998.  Noel  et al (2018) update this observation noting that Canadian Arctic ice caps have been losing mass for decades and that mass loss accelerated in 1996. This followed a significant warming (+1.1∘C), which increased the production of meltwater. This has led to widespread area losses.  White and Copland (2018) quantify the change in the areal extent of 1773 glaciers on Northern Ellesmere Island from 1999 to 2015. They found regional glacier area decreased by ∼6%, with not a single glacier increasing in areal extent.

East of Belcher Glacier, a large retreating tidewater outlet of the Devon Ice Cap, maps indicate a glacier terminating at Cape Caledon, a series of rocky Points on the southern side of the Lady Ann Strait.  Today the Cape Caledon Glacier no longer reaches these rocky Points that have now become islands.  Here we examine Landsat images from 2000 to 2018 to illustrate the changes.

In 2000 the Cape Caledon Glacier terminates along its north side on three rocky points, yellow arrows, while the eastern margin is pinned on the northeastern most of the Points and extends nearly due south to another rocky Point, yellow arrow.  In 2002 little has changed on the northern or eastern margin.  By 2017 the glacier has separated from the three rocky Points on the northern margin, each is now a new island.  The mid-August 2017 image indicates that the snowline is particularly high, with none of the Cape Caledon Glacier in the accumulation zone.  This supports what has been observed in terms of significant changes in the nature of the firn due to increased meltwater infiltration in the region (Gascoin et al 2013). The eastern margin has retreated along most of its length, but remains attached to the rocky Point on the southern margin. In 2018 the islands remain separated from the glacier, but have some sea ice still around them.  The eastern margin that had terminated at the northeast most rocky Point has retreated from 500-700 m along nearly the entire front, except for the very southern margin. The generation of new islands is a process occurring across the Arctic as glaciers recede (Ziaja and Ostafin, 2018).

The northern coast of the Devon Ice Cap with Lady Ann Strait at the top in a 2002 and 2018 Landsat image indicating the development of islands at Cape Caledon, at yellow arrows. 

Map of Cape Caledon on the north coast of the Devon Ice Cap

The northern coast of the Devon Ice Cap with Lady Ann Strait at the top in a 2017 Landsat image indicating the development of islands at Cape Caledon, at yellow arrows, surrounded by some sea ice. 


Major Late July Meltdown on Lowell Glacier, Yukon

Lowell Glacier in Landsat images from 7/4, 7/26 and 8/11 with Sentinel images from 7/22 .  The snowline is shown with purple dots. Point A-F are fixed reference locations.  The snowline migrated upglacier 20 km and 300 m in elevation.  A significant snow swamp is between the yellow and purple dots on 7/26, that was not present on 7/22. 

The Lowell Glacier drains east from the St.Elias Range on the Yukon-Alaska border.  A sequence of images from July 4-Aug. 11 indicate the rapid snowline rise, with a particularly rapid transition from July 22-July 26.  During this period weather records from Haines Junction, Yukon indicate daily high temperatures of:  7/22=29.5 C, 7/23= 28.1, 7/24=26.8, 7/25=25.5, 7/26=25.1. This equates to project freezing levels above 4200 m each day.

(NASA Post follow up to this research)

On July 4th the transient snowline on Lowell Glacier was near Point F at 1240 m.  By July 22 the transient snowline had moved 9 km upglacier to 1400 m between Point A and B. Just two days later the region from 1400-1560 m an area of 40+square kilometers was under rapid transition with the snowline rising and an area of slush developing, saturated snowpack, really a “snow swamp”.  By July 26th the slush line was at 1520 to 1560 m, with the slush indicated by a royal blue color distinguishing it from the graying blue bare ice or old firn, and the white blue snow from the previous winter than was not fully saturated with water.  It is unusual to develop such a large “snow swamp” so quickly, this was accomplished by the rapid ablation due to the high temperatures. By Aug. 11th the transient snowline had shifted above this slush zone, with all of the saturated snow having ablated away, to Point E at 1560-1600 m.  The snowline in late summer of 2010, 2015 and 2017 also reached near Point E at an elevation of 1520-1600 m.  In 2015 and 2017 a supraglacial lake developed just east of Point C.  Another good example of a large snow swamp is in Svalbard on Hinlopenbreen. Taku Glacier, AK had the highest snowline in over 70 years of observation in 2018.

If a good image is acquired in September I will add to this post.  The consistently high late summer snowline, above 1500 m cannot sustain the Lowell Glacier, which will drive further retreat.  The retreat of this glacier be both enhanced and mitigated by surges, during the surge cylcle.  The glacier has surged five times since 1948 (Bevington and Copland, 2014).  The surge cycle has been getting shorter and will not offset the overall mass loss that will drive retreat, just as has occurred on Svalbard glaciers.

Sentinel from 7/22, 7/24 and Landsat from 7/26 indicating the change in snowline and snow swamp development, purple dots.  T indicates terminus of glacier.

Landsat image from 8/8/2017 indicating snowline near Point D and E at m on Lowell Glacier.

Landsat image from 8/3/2015 indicating snowline near Point D and E at m on Lowell Glacier.

Landsat image from 9/14/2010 indicating snowline near Point D and E at m on Lowell Glacier.


Flatisen Glacier, Norway Retreats from Lake & Separates

Flatisen Glacier in Landsat images from 1990 and 2018.  The glacier terminates in the proglacial lake in 1990 at the red arrow and in 2018 at the yellow arrow no longer terminating in the lake.  The pink arrows indicate three connections of the ice cap to the terminus tongue in 1990, with two lost by 2018. 

Flatisen is the primary outlet glacier on the southern side of the second largest ice cap in Norway the Western Svartisen. From 1945-2000 the glacier terminated in a proglacial lake that expanded from 1.5 km long in 1945, to 3 km in 1985 (Theakstone, 1990) to km in 2000.  Haug et al (2009)  indicate significant mass loss of the Western Svartisen Ice Cap from 1985-2000.

In 1990 the glacier terminated in the proglacial lake that was ~3.5 km long.  There were significant feeders from the ice cap both north and south of the terminus tongue, pink arrows. In 1999 the glacier has retreated several hundred meters, still terminates in the lake and is still connected to the ice cap at the three noted locations, pink arrows.  By 2014 the glacier has retreated out of the lake and has lost the two eastern connections from the ice cap to the terminus tongue.  There is not retained snowcover on the valley tongue of the glacier.  By 2018 the glacier has retreated 1400 m from the 1990 position, has only one narrow connection to the main ice cap to the north and has very limited retained snowpack even on 8/6/2018.  There will be continued large mass balance loss for this glacier in 2018 reflective of the warm melt season in Norway. Once the glacier connection entering from the northwest is lost the glacier will have a limited accumulation zone.  The retreat of this glacier is greater given the size of the glacier than at two other key glaciers of the ice cap, Engabreen and Storglombreen.


Flatisen Glacier in Landsat images from 1990 and 2018.  The glacier terminates in the proglacial lake in 1990 at the red arrow and in 2018 at the yellow arrow no longer terminating in the lake.  The pink arrows indicate three connections of the ice cap to the terminus tongue in 1990, with two lost by 2018.

Map of Flatisen Glacier from the Norway Glacier Atlas indicating the margin in 1990 dark green and 1999 light green.

35th Annual Field Season Monitoring North Cascade Glaciers Preliminary Assessment


We monitor the response of North Cascade glacier to climate change and the consequent impacts for water resources and the ecosystem, as illustrated here by Megan Pelto and Jill Pelto.

For the 35th consecutive year I headed to the North Cascade Range, Washington to monitor the response of glaciers to climate change. During the course of this study we  observed several of the glaciers we monitor disappear.  Two of the glaciers we monitor are now part of the 42 glaciers comprising the World Glacier Monitoring Service reference glacier network, where annual mass balance has been assessed for more than 30 years consecutively.

The 2018 winter season featured relatively normal snowpack despite a winter of wide temperature fluctuations, Feb freezing levels 400 m below the mean and December 500 m above the mean. Summer melt conditions featured a high freezing levels in May, normal freezing levels in June and high levels in July (NA Freezing Level tracker). The summer melt season through Aug. 20th has been exceptionally warm and dry, which has also helped foster forest fires. The melt rate during the August field season was 35% above normal.

We assessed the mass balance of eight glaciers.  All eight will have significant negative mass balances in 2018. Retreat was measured on six of the glaciers where the terminus was exposed, all had retreated since 2017.

Sholes Glacier Runoff Monitoring Location in early August 2018

This year the field team consisted of:

Mariama Dryak, UMaine graduate student quantifying iceberg melt rates and meltwater fluxes around the Antarctic Peninsula using satellite imagery.  She is the US national committee representative for the Association of Polar Early Career Scientists, co-chair of USAPECS and helps coordinate the USAPECS blog. Mariama is also the creator and editor of an environmental advocacy blog Let’s Do Something BIG., which highlights the need for effective science communication and the need for greater diversity in the earth sciences.

Erin McConnell, UMaine graduate student, who is studying ice core stable isotope records from the Eclipse Icefield, St. Elias Range, Yukon.She has written about the equal importance of communicating science and the science itself..

Jill Pelto, UMaine graduate student studying paleoclimate records recording past ice sheet changes in the Transantarctic Mountains and an artist, joining the field team for the 10th year. Her work has taken her to Antarctica, New Zealand and Falkland Islands and has been widely featured by Earth Issue,  The Smithsonian, and Edge Effects.

Mauri Pelto, Nichols College academic dean, World Glacier Monitoring Service Representative and director of the North Cascade Glacier Climate Project .  I am heading into the North Cascades for the 35th year. The results will from this year will be promptly published with the AGU From a Glaciers Perspective Blog and the North Cascade web site.  A video encapsulation of the field year will also be developed as in past years. Putting the long term record in perspective was the 2018 Water publication on the long term mass balance record.

Observing snowpack thickness retained in August on Rainbow Glacier

Mapping terminus of Lower Curtis Glacier

Terminus of Columbia Glacier with evident forest fire smoke haze.

Easton Glacier Icefall at 2500 m, indicating a typical 2.25 m thick accumulation layer.

Alpine Glacier-BAMS State of the Climate 2017

Global alpine glacier annual mass balance record of reference glaciers submitted to the World Glacier Monitoring Service, with 2017 continuing the trend of significant negative mass balance. 

The Bulletin of the American Meteorological Society: State of the Climate 2017 has been published.  Since 2008 I have written the chapter on alpine glaciers.

The World Glacier Monitoring Service (WGMS)record of mass balance and terminus behavior (WGMS 2017) provides a global index for alpine glacier behavior. Glacier mass balance is the difference between accumulation and ablation, reported here in mm of water equivalence. Mean annual glacier mass balance in 2016 was −847 mm for the 37 long-term reference glaciers and −761 mm for all 140 monitored glaciers. Of the reporting reference glaciers, only one had a positive mass balance. Preliminary data reported to the WGMS in 2017 from Austria, Canada, China, France, Italy, Kazakhstan, Norway, Russia, Switzerland, and United States indicate that 2017 will be the 38th consecutive year of negative annual balances with a mean loss of −1036 mm for 29 reporting reference glaciers, with three glacier reporting a positive mass balance (http://wgms.ch/latest-glacier-mass-balance-data/).

The ongoing global glacier retreat is currently affecting human society by raising sea levels, changing seasonal stream runoff, and increasing geohazards (Huss et al. 2017a). Huss and Hock (2018) indicate that approximately half of 56 glaciated watersheds globally have already passed peak glacier runoff. Rounce et al. (2017) identify the widespread expansion of glacier lakes due to retreat in Nepal from 2000 to 2015, which pose a glacier lake outburst flood hazard. Glacier retreat is a reflection of strongly negative mass balances over the last 30 years (Zemp et al. 2015). Marzeion et al. (2014) indicate that most of the recent mass loss, 1991–2010, is due to anthropogenic forcing.

The cumulative mass balance loss from 1980–2016 is −19.9 m, the equivalent of cutting a 22-m thick slice off the top of the average glacier .  The trend is remarkably consistent from region to region (WGMS 2017). WGMS mass balance based on 41 reference glaciers with a minimum of 30 years of record is not appreciably different from that of all glaciers at −19.1 m. The decadal mean annual mass balance was −228 mm in the 1980s, −443 mm in the 1990s, −676 mm for 2000s, and –896 mm for 2010–17 (WGMS 2017). The declining mass balance trend during a period of retreat indicates alpine glaciers are not approaching equilibrium and retreat will continue to be the dominant terminus response.

Exceptional glacier melt was noted across the European Alps, leading to high snowlines and contributing to large negative mass balance of glaciers on this continent (Swiss Academy of Sciences 2017). In the European Alps, annual mass balance has been reported for nine reference glaciers from Austria, France, Italy, and Switzerland. All had negative annual balances: exceeding −1000 m with a mean of −1664 mm. This continues the pattern of substantial negative balances in the Alps that continue to lead to terminus retreat. In 2016, in Switzerland 94 glaciers were observed: 82 retreated, 7 were stable, and 5 advanced (Huss et al. 2017b). In 2016, Austria observed 90 glaciers: 87 retreated, 2 were stable, and 1 advanced; the average retreat rate was 14 m (Fischer 2017).

In Norway and Svalbard, terminus fluctuation data from 36 glaciers with ongoing assessment, indicates that in 2016 32 retreated, 3 advanced, and 1 was stable. The average terminus change was −12.5 m (Kjøllmoen, 2017). Mass balance surveys with completed results are available for nine glaciers; seven of the nine had negative mass balances with an average loss of −80 mm w.e.

In western North America data have been submitted from eight reference glaciers in Alaska and Washington in the United States, and British Columbia in Canada. Seven of the eight glaciers reported negative mass balances with a mean loss of −1020 mm. Winter and spring 2017 had above-average snowfall, while ablation conditions were above average. In Alaska mass losses from 2002 to 2014 have been −52 ± 4 gigatons yr−1, as large as any alpine region in the world (Wahr et al. 2016).

In the high mountains of central Asia four glaciers reported data from China, Kazakhstan, and Nepal. All four were negative, with a mean of −674 mm. This is a continuation of regional mass losses, such as reported by King et al. (2017) who found for 2000–15 the mean annual mass balance of 32 glaciers in the Mount Everest region was −520 ± 220mm.


Landsat image from 8/19/2017 illustrating the snowline on Mont Blanc glaciers with one month left in the melt season (M=Mer de Glace, A=Argentière, S=Saleina, L=Le Tour, T=Trient)


Bas d’Arolla Glacier, Switzerland No Longer Reaches Valley

Bas d’Arolla Glacier in Landsat images from 1990, 2001 and 2017.  Red arrow is 1985 terminus, yellow arrow 2017 terminus location, purple dots annual snowline. A=Bas d’Arolla O=Otemma

Bas D’Arolla Glacier is one of the glaciers where the terminus is monitored annually by the Swiss Glacier Monitoring Network (SCNAT). Here we examine changes in this glacier from 1985 to 2017 including changes in the terminus, snowline elevation and tributary connection during this period using Landsat Imagery. SCNAT reports that the glacier advanced 136 m from 1972-1987, retreated at a rate of 17.6 m/year from 1987-2001, and  23 m/year from 2001-2017.  The main accumulation zone between Pigne d’Arolla and Mont Collon extends from 2900 m to 3400 m, with a saddle to Otemma Glacier at 3000 m. An icefall extends from 2400 m to 2900 m. In 1985 the glacier had a low elevation terminus tongue extending from the base of an icefall at 2400 m to just below 2200 m (see map below).

In 1985 the glacier terminates at the red arrow at an elevation of 2160 m and the snowline is at 2940 m.  In 1990 the terminus had advanced slightly up to 1987 and then retreated slightly with not significant overall change and the snowline is again at 2940 m.  By 2001 the glacier has retreated 220 m, and the snowline is at 2900 m.  In 2015 the snowline is at 3100 m with the saddle to Otemma Glacier not in the accumulation zone.  This saddle should always be snow-covered.  In 2017 the snowline is at 3200 m, the saddle with Otemma Glacier is again exposed and is in fact glacier ice, indicating that snow and firn has been lost and this is no longer part of the persistent accumulation zone.  The main terminus tongue in 1985 that occupied the valley floor and extended 500 m from 2400 m to the terminus is gone, with a total retreat of 600 m since 1985.  The glacier retreat is similar to that of neighboring Otemma Glacier and more substantial than Gietro Glacier, and reflects an annual snowline that is too high to maintain the glacier terminus tongue.  the Bas d’Arolla valley floor is now glacier free. The river discharges into the Rhone River Basin, which has substantial hydropower south of Lac Geneva.  Schaefli et al (2018) observe that of the 50% of Swiss power that comes from hydro, glacier mass loss alone has provided 3-4% of the total, not a sustainable model.  Bliss et al (2014) indicate that the Swiss Alps have passed peak glacier runoff.

Bas d’Arolla Glacier in Landsat images from 1985 and 2017.  Red arrow is 1985 terminus, yellow arrow 2017 terminus location, purple dots annual snowline. A=Bas d’Arolla O=Otemma

Map of the Bas d’Arolla Glacier and Mont Collon area, from Swisstopo

Google Earth image indicating flow, and the fact that the glacier now terminates in the icefall region, no longer reaching the valley floor.

Mount Tanggula Glaciers, China Thin and Separate

Changes in outlet glaciers of Tanggula Shan in Landsat images from 1993 and 2015. 

The Tanggula Shan is in the Qinghai-Tibet Plateau at the headwaters of the Yangtze River and host approximately 1000 square kilometers of glaciers. Ke et al (2017)  examined glaciers in the Dongkemadi Region of the Qinghai-Tibet Plateau revealed glacier thinning of 0.56 m/year from 2003-2008.  The area loss of  −0.31 km2/ year from 1976-2013, a 13% change int total area of the glaciers.  Chao et al (2017) examined glaciers in the Geladandong region of the Qinghai-Tibet Plateau and found thinning rates of 0.16 m/year from 2003-2009.  The thinning was a consequent of temperature increases. Inglis (2016)  reported on the ongoing retreats impact on water resources for the Yangtze River.

Here we examine Landsat imagery from 1993-2017 to identify changes at five locations around the Tanggula Icefield. In 1993 outlet glaciers merge at Point 1 and 2. At Point 2 there is a narrow separation between two outlet glaciers. At Point 4 and 5 there is considerable terminus recession of the stagnant hummocky ice (developed in a sublimating environment). Below is a Google Earth image of the glacier at Point #1 illustrating the hummocky nature, Inglis (2016)  also provide imagery of this hummocky ice. In 2015 the snowline is high at 5900 m,  in this early November image.  The terminus of most glaciers is at 5400 m and the head of the glaciers at 6100 m. In November of 2017 the snowline is at 5600 m.  The retreat has been significant, but not rapid in this area. This is similar to the retreat of the Suhai Hu Ice Cap in the Qilian Mountains.

Changes in outlet glaciers of Tanggula Shan in Landsat images from 1995 and 2017. 

Google Earth image of Tanggula Glacier outlet, Point #1.