Mozigou Glacier Meltwater Pays High Hydropower Dividend

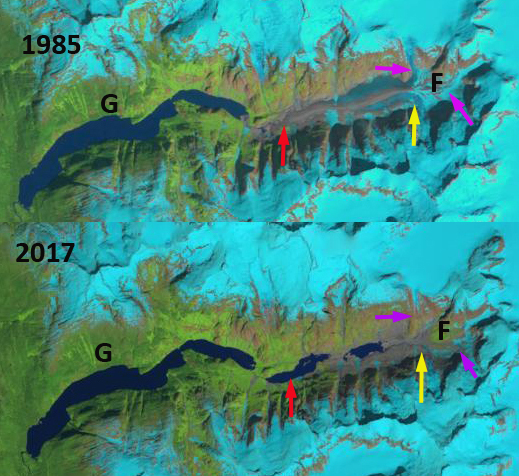
Mozigou Glacier is a valley glacier in the Gongga Mountains, Sichuan Province, China that drains into the Dadu River.  In the first 250 km after leaving the glacier this meltwater travels through seven hydropower projects that have a collective capacity of  over 9000 MW. Pan et al (2012) noted that the glaciers of the Gongga Shan have lost 11% of their area since 1966.  They further reported a 300 m retreat of Mozigou Glacier from 1994-2009. The glacier unlike its neighbor Hailuoguo Glacier does not have a debris covered terminus.  Liu et al (2010) report that the main change in the region affecting the glaciers is rising temperature.  The Gongga Shan glaciers are summer accumulation type with the majority of the accumulating snow occurring at the same time that ablation is at a peak lower on the glacier. They also report a steep precipitation gradient, which is key to glacier formation here. Here we examine Landsat imagery from 1994-2017 to indicate retreat of the glacier and Google Earth images of the hydropower projects to underscore the economic output of the runoff.

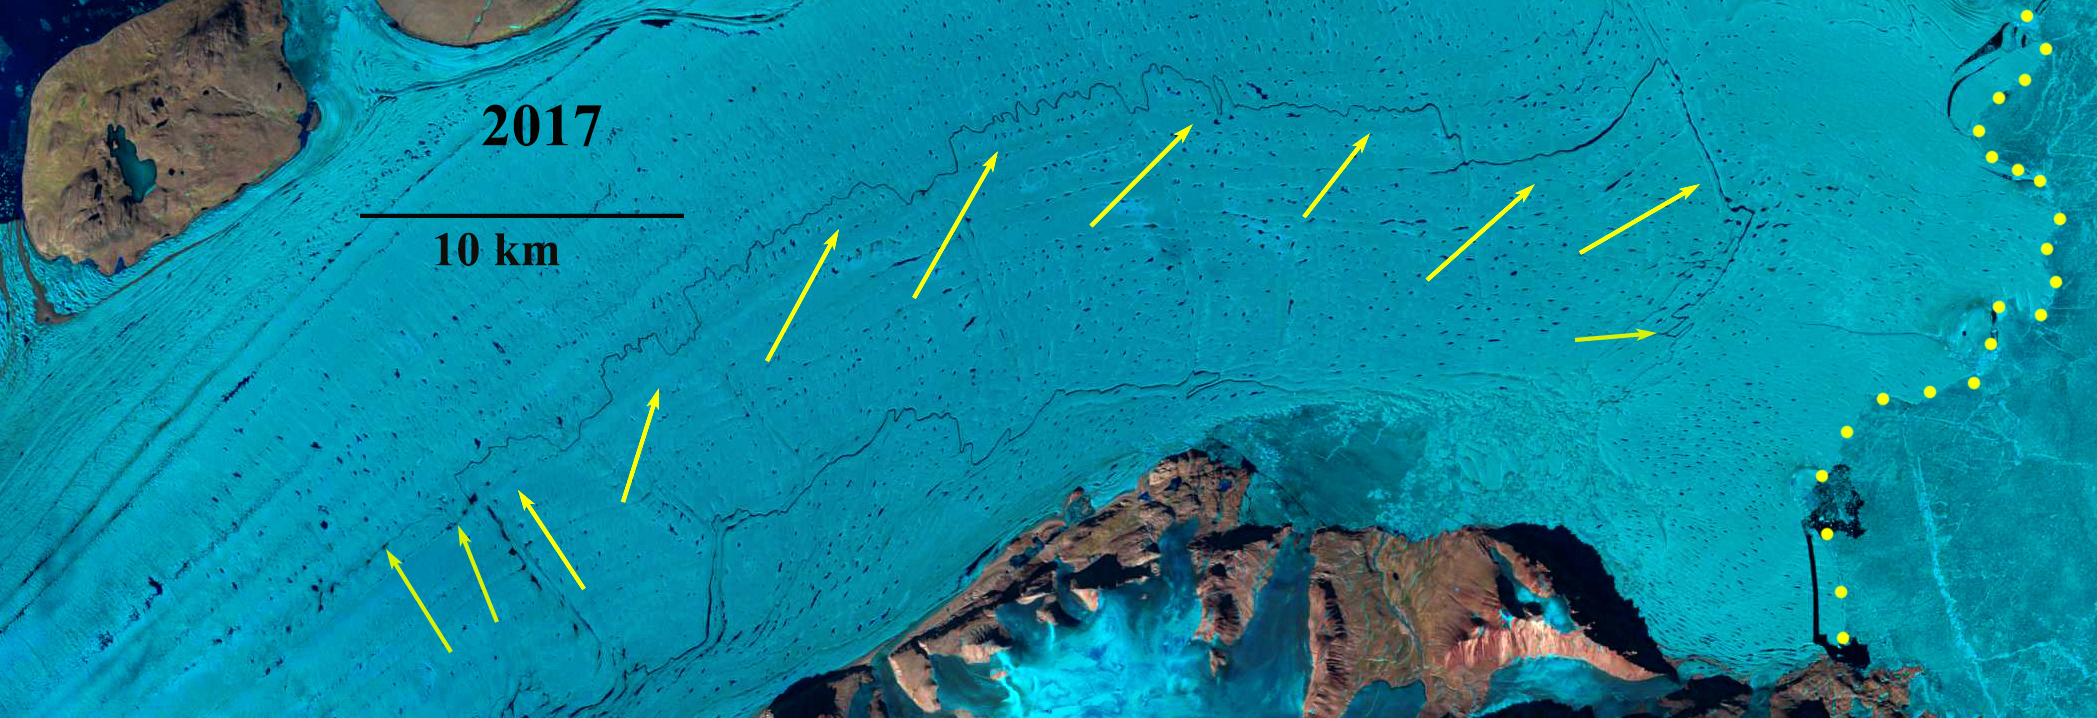
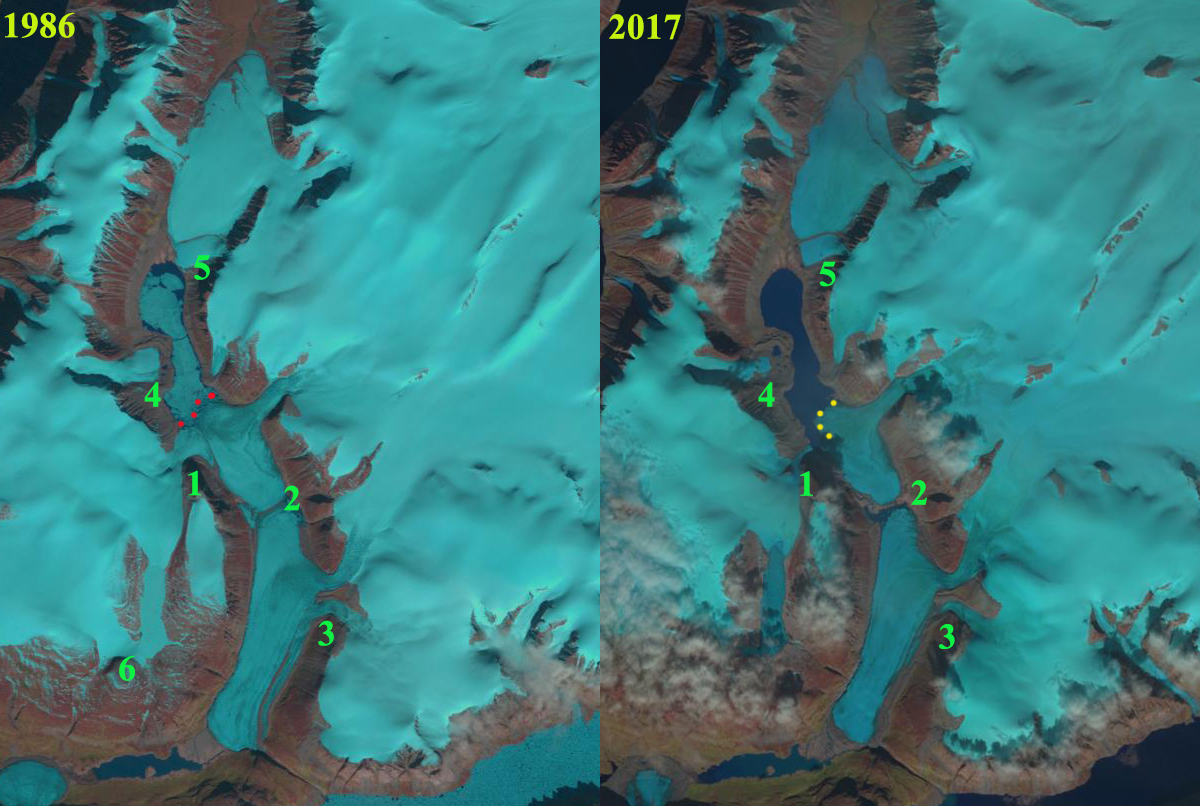
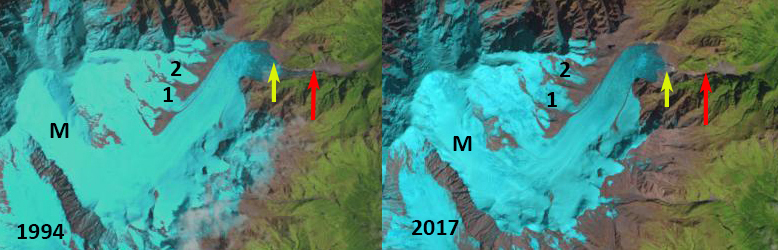
In 1994 the Mozigou Glacier had a thin terminus tongue extending downslope from the wide terminus area, red arrow.  The snowline is not far above the terminus. In 1995 the thin terminus tongue extending downvalley to the red arrow is still evident.  The snowline remains not far above the terminus.  By 2016 the thin 900 m long terminus tongue has melted away.  In 2017 the two lowest tributaries have been reduced in width. The  terminus is now on a lower sloped region and has extensive crevassing right to the terminus, see Google Earth image below. Both the reduced slope at the terminus and the rapid flow as indicated by the terminus suggest a glacier fed by high accumulation and one where retreat should diminish.

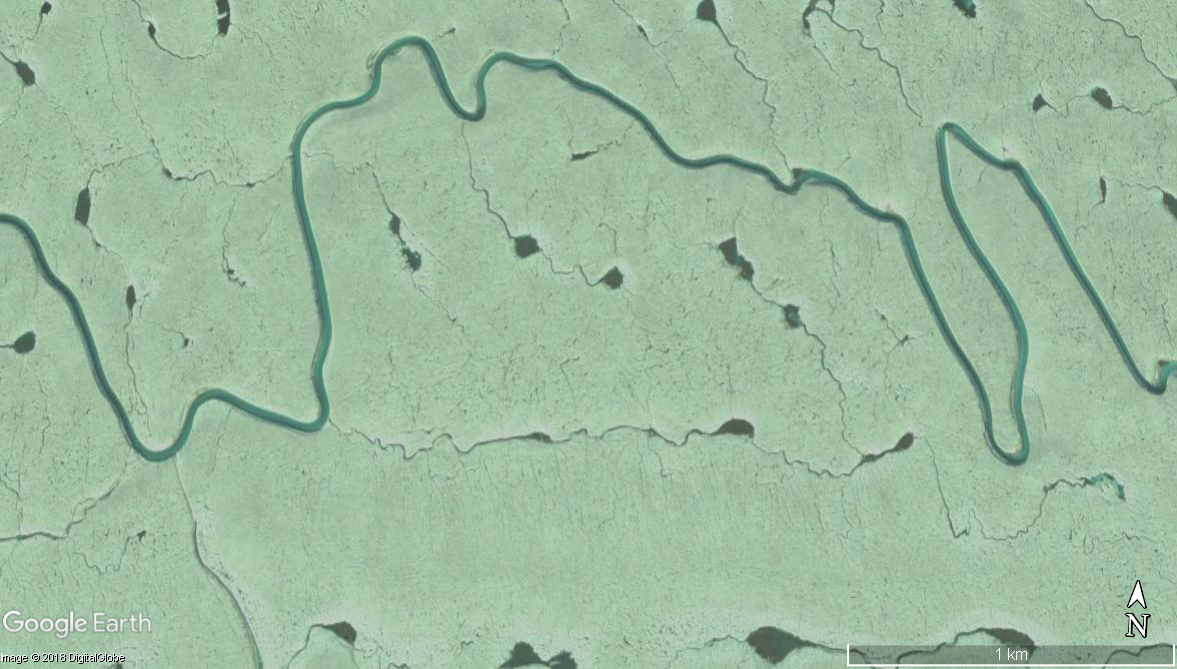
After a drop of water leaves the glacier it flows tinto the Dadu River where it pays dividends at the following: 35 km downstream is the Dagangshan Hydropower Station 2600 MW, 50 km downstream is the Longtoushi Hydorpower station is 700 MW, 115 km downstream is Pubugou Hydropower Station 3300 MW, 190 km downstream is  the Gongzui Hydropower Station 600 MW, 215 km downstream is the Tongjiezi Hydropower Station 700 MW,  225 km downstream is the  Shawan Hydropower station 480 MW and,  250 km downstream is the Angu Hydropower station 770 MW.

Glaciers Abandon Farragut River Valley, Alaska

The Farragut Glacier  (F) in Landsat images in 1985 and 2017.  The red arrow indicates the 1985 terminus location, the yellow arrow the 2017 terminus location and the purple arrow, two tributaries in 1985 that now no longer connect to the former valley glacier. The glacier now terminates well short of Glory Lake (G) and two new lakes have formed. 

The Farragut River drains into Frederick Sound in Southeast Alaska.  The headwaters of this river in 1985 was a valley glacier, Farragut Glacier, fed by seven glaciers descending from peaks on the south wall of the valley or flowing down from the Stikine Icefield. The river is known for significant Pink and chinook salmon runs as well.  This valley is just to the north of Baird Glacier that has begun to retreat.

In the USGS map from 1975 there are seven glaciers that drain into the valley bottom contributing to the Farragut Glacier, see map below. The glacier at this time terminated in Glory Lake.  By 1985 the glacier had retreated 1.2 km from Glory Lake and was 7.2 km long. There was a medial moraine that had expanded in width and height indicating the glacier tongue was thinning rapidly. The overflow tributaries from Dawes and North Baird Glacier, purple arrows, still connected to the valley glacier.  By 1993 thinning and retreat had led to formation of a new lake.  The overflow tributaries from Dawes and North Baird Glacier no longer reach Farragut Glacier.  By 2016 vegetation there are two new lakes where the Farragut Glacier used to be.  New vegetation has developed where the tributary from Dawes and North Baird Glacier formerly joined the Farragut Glacier.  By 2017 there is only a single tributary that contributes to the Farragut Glacier, which occupies only a small segment of the valley floor.  The distance from this tributary to the terminus is 3.1 km.  The glacier has lost most of its length, six of its former glacier connections and two lakes have developed in 32 years of retreat and thinning.  The Farragut River valley has largely been abandoned by glaciers in the last three decades. The thinning and retreat is larger here than at Baird Glacier and Patterson Glacier

The Farragut Glacier  (F) in Landsat images in 1993 and 2016.  The red arrow indicates the 1985 terminus location, the yellow arrow the 2017 terminus location and the purple arrow, two tributaries in 1985 that now no longer connect to the former valley glacier.

USGS map indicating the seven glaciers that connect to make the Farragut Glacier in 1948.

Google Earth Image indicating the two lakes and the one tributary that reaches the Farragut River valley floor. 

Harbardsbreen, Norway Margin Retreat and Separation

Harbardsbreen (H) the 13th largest ice cap in Norway in 1988 and 2014 Landsat images.  Red arrows indicate the main terminus on the east side that has separated since 1988. Point 1 is the sole nunatak in 1988 now there are more.  The Pink arrow is the location of the narrowing connection with the northern section of the icecap.  The east side of the ice cap feeds the hydropower system of Fivelmyr (F) and Illvatnet Reservoir (I).

Harbardsbreen (H) is the 13th largest ice cap in Norway in the Norwegian Glacier Inventory with an area of 24.8 square kilometers in 2006.  The ice cap is east of Jostedalsbreen. Here we examine Landsat imagery to indicate changes amidst and at the margin of this ice cap from 1988-2016. The east side of this ice cap drains into Fivelmyrane Reservoir (F) and its hydro power.  The Fivelmyr Power Plant was built in 1962 and has an 8 GWh annual capacity.  This water via pumped storage  is also part of the Herva Power Plant that produces 129 GWh annually.

In 1988 the main outlet of the ice cap was a tongue of ice fed from both north and south outlet glaciers on the east side of the ice cap, not red arrows.  There is a  connection to the northern end at the pink arrow is nearly 1 km wide.  At Point 1 there is a single nunatak amidst the ice cap.  Up to 1998 there is limited change in the icecap.  In 2014 the snowline is at 1700 m near the crest of the ice cap.  The eastern terminus of Harbardsbreen has separated at the red arrows.  A new lake has formed that is in contact with the southern terminus. The connection at the pink arrow to the northern segment is now just 200 m wide. There are now three new bedrock outcrops near Point 1 and the expanded former solitary nunatak. The expansion of the bedrock knobs indicate the impact of the rising snowline converting portions of the ice cap into an ablation zone that had been an accumulation zone. In 2016 the southeastern terminus of Harbardsbreen barely reaches the new lake that has formed. The glacier termini are now separated by 800 m from each other. The reduced size of the glacier means less area for melting, in this case the reduced natural ice storage can be replaced by the artificial pumped storage in Illvatnet.  This same story is being told at nearby Spørteggbreen and Tunsbergdalsbreen.

Harbardsbreen (H) the 13th largest ice cap in Norway in 1998 and 2016 Landsat images.  Red arrows indicate the main terminus on the east side that has separated since 1998. Point 1 is the sole nunatak in 1998 now there are more.  The Pink arrow is the location of the narrowing connection with the northern section of the icecap.  The east side of the ice cap feeds the hydropower system of Fivelmyr (F) and Illvatnet Reservoir (I).


Harbardsbreen in the NVE Atlas showing 2006 glacier margins


Nioghalvfjerdsbræ 70 km+ Long Supraglacial stream, Greenland’s Longest?

Landsat image of Nioghalvfjerdsbræ in 2017 with supraglacial stream indicated by arrows and calving front yellow dots. 

I first observed the impressive discharge and length of the supraglacial streams working on Jakobshavn Glacier more than 30 years ago.  The longest persistent supraglacial stream in Greenland at present that I am aware of is on Nioghalvfjerdsbræ (79 Glacier).  The longest streams will occur on glaciers with low slopes in the ablation zone and limited crevassing, suggesting an extended region of compressive flow. The compressive flow and low slope also would help suppress moulin formation. Rignot et al (1997) first noted that flux from glaciers in this region was 3.5x the iceberg production due primarily to ice loss from basal melt, Nioghalvfjerdsbræ has a 20 km wide ice shelf, and the bed remains below sea level over a distance of 150 km upstream from the grounding line, and 200 km inland of the calving front, as indicated Bamber (2013). The basal melt rate in this reach is comparatively low  less than 10 m per year maximum and ~5 m per year average seen in figure 2 from Wilson et al (2017) and.  The velocity declines from 1000 m/year near the start of the stream to less than a 100 m/year near the calving front.

Landsat image of Nioghalvfjerdsbræ in 2011 with supraglacial stream indicated by arrows. 

The supraglacial stream indicated in the 2011 and 2017 images along most of its length has the same path.  The streamflow directly to the ice front in 2011 with a length of 73 km without measuring secondary wiggles.  In 2017 the stream  turns south to reach southern margin with a length of 71 km.  Below are three images of the stream in 2014 Google Earth images.  The width of the stream remains relatively constant over most of the length ranging from 20-35 m.  You can also see how the stream drains numerous small supraglacial lakes.  This reduces the size of the lakes and on Petermann Glacier, was observed to reduce the destabilizing nature of the lakes on the floating tongue (Macdonald et al, 2018).  The smaller lakes are less likely to develop moulins or force fracture propagation. This stream survival depends on not encountering a moulin or crevasse.  In West Greenland the melt rates are higher and the surface slopes greater where the detailed observations of supraglacial streams and moulins have led to model development for stream discharge see the fantastically detailed work of Banwell et al (2012) and  (Smith et al., 2017)

Lower reach of supraglacial stream

Mid reach of supraglacial stream

Upper reach of supraglacial stream

Honeycomb Glacier Retreat, Washington New Lake Lost Nunatak

Honeycomb Glacier in Google Earth imagery from 1998 and 2016.  The dark orange line is the 1998 margin, we mapped the margin in the field in 1995 and in 2002.  The light orange line is the 2007 margin and the yellow line the 2016 margin. Note crevassing diminished as well. 

Honeycomb Glacier is one of the longest and largest glaciers in the North Cascades.   In 1979 it was 3.9 km long and had an area of 3.5 km2. By 2016 the area had declined to 2,6 km2 and it has retreated 2.6 kilometers since its Little Ice Age Maximum. The glacier was an imposing site to C.E. Rusk who recounted his early 20th century exploration (1924). Like all 47 glaciers observed by the North Cascade Glacier Climate Project it has retreated significantly since 1979. The glacier feeds the headwaters of the Suiattle River, which is also an important salmon stream, for chinook, coho, sockeye and pink salmon (WDFW,2018).

A 1960 photograph taken by Austin Post, USGS shows the glacier ending with no lake at its terminus. The terminus is gentle and has no crevasses, indicating it is relatively stagnant and poised to melt away. The glacier has retreated 1.3 km from its Little Ice Age moraines at this point. In 1967 another Austin Post image indicates a new small lake forming at the terminus.
honeycomb

In 1995 we mapped  the margin of the glacier ending in this lake, where the glacier ended in 1967 and took a photograph back to the glacier. As seen below retreat to this point was 400 m.

honeycomb 1995

A pair of images from Bill Arundell in 1973 and Lowell Skoog in 2006 indicate the scale of the retreat, these images do not show the actual terminus but do show the main nunatak-rock island and how much it has become exposed in the 33 years. This nunatak was hardly evident in 1960, and in a 1940 image of the glacier literally did not yet exist.honeycomb-glacier-1977-2006

The terminus had retreated 400 m from the 1967 position to 1995. In 1987 a new lake began to form at the terminus of the glacier at 1680 m. The glacier is shown ending in this lake in 2002 from both the far end of the lake and the nunatak above the lake, the glacier had retreated 210 m since 1995. In 2006 the glacier retreated from the end of this lake. This is a shallow lake that may eventually be filled in by glacier sediments. The terminus is flat and stagnant ending at 1680 m in the lake. Thus, the rapid retreat will continue, the glacier is still not close to acheiving a post LIA equilibrium. Glacier retreat from 1940-1967 averaged 9 m/year. Retreat was minor between 1967 and 1979. The retreat rate from 1979-1998 was greater at 16 m/year, with a total retreat of 300 m. The retreat than increased from 1998-2016 with the west branch retreating 800 m and the east branch 500 m. The nunatak in the middle of the glacier, which was beneath the ice in 1940 was 90 m above the ice in 2002 when we mapped it.  By 2009 it was no longer a nunatak as the glacier did not merge downstream of the this bedrock knob.

The retreat of this section of the glacier results in a reduced melt area of ~1 km2 in the last 40 years.  This in turn reduces summer glacier runoff as there is no longer snow/ice melting each day under the warm summer conditions. Flow in the Suiattle River in late summer and early fall has declined as a result. In 2002 during mapping of the glacier images from above and below the nunatak indicate the stagnant nature of the ice below the nunatak.

honeycomb new lakehoneycomb2002a


Coutts Ice Cap, Baffin Island Fragmentation

Coutts Ice Cap in  Landsat images from 1986 and 2017.  The terminus location of the main glacier terminating in the large lake is indicated by dots.  Tributary Glaciers 1-6 represent locations where glaciers have separated or a glacier has retreated from a lake. 

Coutts Ice Cap is on between Coutts Inlet to the west and Buchan Gulf to the east on the north shore of Baffin Island near its northeastern tip (see map below).  Here we are focused on a group of glacier that descend into a basin, that I refer to as Coutts Basin and Coutts Basin Lake. Gardner et al (2012) and Sharp et al (2011) both note that the first decade of the 21st century had the warmest temperatures of the last 50 years in the region, the period of record, and they identified that the mass loss had doubled in the last decade versus the previous four for Baffin Island. This led to surface lowering of up to 1 m/year on all ice masses on Baffin Island and Bylot Island between 1963 and 2006 (Gardner et al. 2012).

In 1986 the Tributary Glacier 1 (TG1), flows into the Coutts Lake basin joining with TG2.  TG3 feeds into the Coutts Basin glacier system.  TG4 has a significant piedomont lobe but terminates short of the Coutts Basin Lake. TG5 reaches the northern shore of Coutts Basin lake. TG6 drains into a secondary lake above the main Coutts Basin.  The main terminus of the Coutts Basin Glacier, red dots extends east to west across the lake. In 1999 the snowline is higher and there are minor changes, but retreat is limited and none of the glaciers have separated.  In 2016 the snowline is very high at 1500 m, leaving only a small part of the ice cap with snowcover. The high snowline in August 2016 have observed on Borden Ice Cap and Penny Ice Cap and have driven thinning and retreat there as well. TG1 no longer merges with TG2.  There is a separation of the glacier lobes at TG2.  TG3 no longer substantially feeds the Coutts Basin.  TG4 has thinned and retreated from near the short of Coutts Basin Lake. TG5 has receded from the lake shore.  TG6 has retreated from the upper lake. In 2017 the margin of the main Coutts Basin Glacier no longer extends across the lake, yellow dots. The snowline in August 2017 is at 1100 m lower than 2016.

Way (2015) noted that summer temperatures have warmed more than 1 C after 1990 on the Cumberland Peninsula at the south end of Baffin leading to a 18-22% decline of  Grinnell and Terra Nivea Ice Cap.

Coutts Ice Cap in  Landsat images from 1999 and 2016.  The terminus location of the main glacier terminating in the large lake is indicated by dots.  Locations 1-6 represent locations where glaciers have separated or a glacier has retreated from a lake. 

Map of the region indicating Cape Jameson (CJ), Coutts Inlet (CI), Buchan Gulf (BG), North Arm (NA), Coutts Basin Lake (CBL) and Coutts Ice Cap (CIC). 

Kokthang Glacier Retreat, Sikkim Himalaya, India Doubles Lake Size

Kokthang Glacier in 1988 and Feb. 2018 Landsat imagery. The red arrow indicates the 1988 terminus and the yellow arrow the upstream end of the lake beyond which the glacier has retreated in 2018.  The purple dots indicate the snowline. 

Kokthang Glacier drains south from the Kokthang Peak a satellite peak on the south side of the Kanchenjunga Massif, Sikkim in India, the next valley south of East Rathong Glacier. This glacier drains into the Rangit River, which hosts a 60 MW run of river Rangit Hydropower project.  Here we examine changes in the glacier from 1988 to 2018. Glaciers draining east from Kanchenjunga have generally experienced substantial retreat and lake expansion (Govindha Raj et al 2013): Lhonak Glacier, Changsang Glacier etc.  The exception being Zemu Glacier which has been thinning, but not retreating substantially. NASA Earth Observatory posted an article based on this blog post.

In 1988 the debris covered terminus was in a 800 m long proglacial lake, after the two main tributaries joined.  The snowline was at 5500 m. In 2000 the lake has expanded significantly and only the western tributary is actively reaching the lake.  The snowline in 2000 is at 5400 m.  By 2005 glacier retreat of the stagnant tongue had led to a lake expansion to a length of 1300 m, Google Earth image on left below.  The snowline in 2005 is at 5500 m.  The eastern tributary no longer descended to the lake. By 2017 the lake had further expanded to a length of 1600 m.  The glacier retreat over the 30 year period being greater than the 800 m that represent a doubling of the proglacial lake size.  The glacier has now effectively retreated from the lake and only minor expansion will occur with ice cored moraine meltout. The snowline in October 2017 was at 5600 m. The snowline remained high from October to mid-winter as it had in most recent years, with the February 2018 snowline at 5600 m still.  This illustrates that ablation albeit, at a slow rate, is occurring from October-mid winter.

The persistent high snowline through much of the year leads to continued thinning and retreat of the lower glacier. The high snowlines have been seen in the Mount Everest area and on Gangotri Glacier.  The upper glacier continues to retain snowcover indicating the glacier can survive current climate.


Kokthang Glacier in 2000 and 2017 Landsat imagery. The red arrow indicates the 1988 terminus and the yellow arrow the upstream end of the lake beyond which the glacier has retreated in 2018.  The purple dots indicate the snowline. 

Google Earth imagery from 2005 and 2014 of Kokthang Glacier. 


Warm Creek Glaciers, British Columbia Retreat Driven Separation

Warm Creek, (W) Norht Warm Creek (NW) and Bighorn (H) Glaciers in Northwest British Columbia in 1984 and 2017.  Red arrows are the 1984 terminus location, yellow arrows the 2017 terminus locations and purple arrows where glaciers have separated. 

In Northwestern British Columbia a group of unnamed glaciers drain into Tagish Lake via Warm Creek and Bighorn Creek.  Here we examine the profound changes in three glaciers from 1984 to 2017 using Landsat imagery. These glaciers are in the northeast sector of the Juneau Icefield, sharing a divide with the retreating Meade Glacier, Alaska.  The Juneau Icefield Research Program focuses on glaciers to the south of these including  the retreating Llewellyn Glacier.

In 1984 Bighorn Glacier (B) has two termini joined at 1500 m, with the northern terminus ending in two small proglacial lakes and the southern terminus extending down valley to the red arrow.  In 1984 Warm Creek Glacier terminates in a small proglacial lake, red arrow. The North Warm Creek Glacier (NW) has two tributaries joining at 1350 m, 1 km above the terminus.  In 1999 the snowline is at 1650 m on these glaciers leaving only 20% of Bighorn Glacier above the snowline.  North Warm Creek Glacier tributaries have separated due to glacier retreat.  Retreat has led to proglacial lake expansion at Warm Creek Glacier. In 2001 it is apparent that the retreat of the northern terminus of Bighorn Glacier has led to expansion of the proglacial lake.  The snowline is lower in this 2001 image at 1500 m.  By 2017 Bighorn Glacier has separated with nearly 1 km of bedrock separating the northern and southern sections. The southern terminus has retreated 1100 m and the northern terminus 500 m. The Warm Creek Glacier retreat from 1984-2017 is 1300 m, more than doubling the length of the lake. The North Warm Creek Glacier tributaries are now well separated. Retreat of the northern terminus has been 1000 m and 1200 m for the southern terminus. The snowline in 2017 is again at 1700 m, too high to sustain these glaciers. The retreat of these glaciers fit the pattern of other glaciers in Northwest British Columbia such as Llewellyn, Tulsequah and West Hoboe Glacier.  Bolch et al (2010) noted a 11% loss in glacier area in the province from 1985-2005 and an 8% loss in the Northern Coast Mountains.

Warm Creek, (W) Norht Warm Creek (NW) and Bighorn (H) Glaciers in Northwest British Columbia in 1999 and 2001.  Red arrows are the 1984 terminus location, yellow arrows the 2017 terminus locations and purple arrows where glaciers have separated. 

Toporama Map of the region showing flow directions from the 1980s’

Schlegies Glacier, Austria Response to Climate Change: Segmentation

Schlegies (S), Furtschagl (F), Hornkees (H) and Waxeggkees (W) in 1990 and 2017 Landsat images.  Red arrows indicate the 1990 terminus location and pink arrows indicate locations where the Schlegies (S) and Furtschagl (F) separated. Schlegies Reservoir (SC) near top. 

In August, 1990 you could have skied 5.5 km across the width of the Schlegies (S) and Furtschagl (F) Glaciers in the Zillertal Alps, Austria without taking your skis off. By August 2017 this traverse would have necessitated removing your skis three times as marginal retreat has led to glacier segmentation. These glaciers feed the Schlegeis Reservoir and hydropower system, and along with the adjacent Waxeggkees (W) and Hornkees (H) provide a good example of Austrian Glacier retreat and area loss that has led to glaciers separating into smaller segments. The Austrian Alpine Club conducts an annual survey of terminus change, supervised by Andrea Fischer, on nearly 100 glaciers. In 2016, 87 of the 90 glaciers surveyed retreated with the greatest retreat being 65 m at Hornkees (Fischer, 2017). In 2017, the survey examined 83 glacier, with 82 retreating (Fischer 2018).  The average retreat of 25.2 m was the largest since 1960 and was attributed to the snow poor winter of 2016/17 and warm summer of 2017 (Fischer 2018).  The second largest retreat was of Waxeggkees at 120 m.  The high rate of retreat of these two Zillertal glaciers indicates the significance of climate change on glaciers in this region.  Verbund the largest electricity generating company in Austria operates the Schlegies-Rosshag Hydropower pumped storage facility that can generate 231 MW.  Because it is pumped storage it is not as vulnerable as the run of river hydropower plants that Verbund operates.

In 1990 Hornkees and Waxeggkees have significant valley tongues extending from the upper accumulation zone.  Schlegies and Furtschagl is a 5.5 km wide continuous accumulation zone. By 1998 Schlegies, Furtschagl, Hornkees and Waxeggkees  have all retreated significantly.  By 2013 Waxeggkees has lost its terminus tongue and is now has a broad slope terminus. In 2017 Schlegies has separated into three parts and has not retained any snowpack from 2017.  Schlegeis has 500-650 m across its broad front from 1990 to 2017. Furtschagl has separated from Schlegeis as well.  Furtschagl has retreated 350 m from 1990-2017, m in 2017.  Hornkees main terminus has retreated 850 m from 1990-2017, 86 m from 2015-2017.  Waxeggkees main terminus has retreated 700 m from 1990 to 2017, including 152 m from 2015-2017. The mean thickness of Waxeggkees and Hornkees was 30 m and 28 m in 1999, (Fischer and Kuhn, 2013).  The thickness will have decline with area loss since, Fischer et al (2015) note that Austrian glacier have been losing area at a rate of 1.2% annually after 1998.

Schlegies (S), Furtschagl (F), Hornkees (H) and Waxeggkees (W) in 1998 and 2013 Landsat images.  Red arrows indicate the 1990 terminus location and yellow dots indicate the 2013 terminus.


Schlegies (S), Furtschagl (F), Hornkees (H) and Waxeggkees (W) In Google Earth image.

Sherman Glacier, Alaska Diminishing Protective Blanket=Mass Loss

Sherman Glacier, Alaska in Landsat images from 1987 and 2017.  Black arrows indicate tributaries on north side. Purple dots indicate the snowline. Point A indicates a depression formed from lateral recession. Also notice how the debris cover has with glacier flow been shifted downglacier. 

Sherman Glacier is in the Chugach Mountains of southern Alaska and is famous for the large landslide triggered by the magnitude 9.0 Good Friday earthquake in 1964 that spread across a substantial portion of the glacier below 450 m. This debris insulated the ablation zone of the glacier from melting leading to a glacier advance.  The landslide average 1.6 m in thickness and covered 8.25 km2 (McSaveney, 1978).  Marangunic (1972) notes the glacier was retreating 25 m/year and thinning by 2 m/year prior to the landslide. By 1966 he notes the glacier had begun to advance.  This advance continued up to 2009 (Reznichenko et al (2010).    Here we utilize Landsat imagery to indicate the changes from 1987 to 2017 on Sherman Glacier.

The terminus of Sherman Glacier remains buried by a portion of the landslide debris and its position change at present is hard to discern, upglacier the changes are striking.  In 1987 their are three tributaries entering the glacier from the north.  The snowline is at 450 m.  The glacier at Point A extends the the valley wall.  In 1999 the three north side tributaries are still connected and the glacier extends to the valley wall at Point A.  The snowline is at 600 m.  In 2015 the snowline is at 850 m with only 30% of the glacier in the accumulation zone.  At Point A a circular depression has formed as the glacier has receded from the valley wall.  In 2016 the snolwine is again at 850 m.  The lowest tributary on the north side has detached from the main glacier.  The middle tributary has lost most of its connection.  The highest tributary is now connected across just half of its former width with a bedrock rib extending across the other half.  In 2017 the snowline is at 725 m with a month left in the melt season.  This sequence of years of high snowlines is indicative of what is causing the detachment of tributaries.  The glacier is thinning significantly up to at least 800 m in elevation.  This represents a mass loss across most of the glacier, which is leading to retreat of tributaries and marginal retreat in much of the ablation zone.  The lateral recesssion at Point A since 1987 is 250 m.  This volume loss belies the minor recent terminus retreat of the debris buried terminus. This glacier due to the landslide has not retreated as much as its neighboring glaciers such as Valdez Glacier.

Sherman Glacier, Alaska in Landsat images from 1999, 2015 and 2016.  Black arrows indicate tributaries on north side. Purple dots indicate the snowline. Point A indicates a depression formed from lateral recession.

Sherman Glacier in the National Map viewer, indicating depression below Point A and lateral recession.


Sherman Glacier tributary detachment, 275 m of retreat from main glacier in the National Map Viewer image from several years ago. 

Figure 12 from (Reznichenko et al (2010)  The rock avalanche caused by the 1964 Great Alaska Earthquake covered part of the ablation zone of Sherman Glacier. (a) The rock-avalanche cover after its emplacement in 1967. (b) The rock avalanche reached the terminus of the glacier in 2008 (pictures from Mauri McSaveney).

Suhai Hu Ice Cap, China Outlet Glacier Retreat

Suhai Hu, Quilian Mountains Ice Cap in 1999 and 2016 Landsat image indicating five different outlet glacier termini that all ended in proglacial lakes in 1999 and all retreated significantly by 2016. 

Here we examine an unnamed icecap that I refer to as the “Suhai Hu” Ice Cap and five of its largest outlet glaciers in the Qilian Mountains in northwest China, with Landsat imagery from 1999-2016.  The northern outlet glaciers drain into the Suhai Hu and the southern outlet glaciers into Quidam Hu. Glaciers in the Gansu Province have shrunk by 36 square kilometers, a 4.2 percent loss, during the past decade Quiang (2016).  Tian et al (2014) report Qilian Mountain glacier area shrank by 30% from 1956 to 2010 and the shrinkage accelerated remarkably in the past two decades.  Yang et al (2015)  Results show that mountain glaciers in China are very vulnerable to climate change with 41% of glaciers having had a high vulnerability in the period 1961–2007.

In 1999 all five outlets, indicated by arrows terminate in proglacial lakes, with the northwest outlet comprise of two tributaries that join just above the terminus.  In 2001 the outlets still terminate in glacier lakes.  By 2015 two of the outlet glaciers at the orange and red arrow have retreated from the proglacial lakes they had terminated in.  The northwest outlet glacier, green arrow, the tributaries had separated.  From 1999 to 2016 the proglacial lake at the purple arrow has expanded from 600 m in length to 850 m.  The lake at the yellow arrow expanded from 450 m in length to 850 m in length from 1999-2016. each of the five outlet glaciers has retreated significantly from 1999-2016.  All 8 summer Landsat images examined indicate the ice cap always has substantial retained snowcover, and will not disappear with current climate. In a close up view of the terminus of the yellow outlet glacier there are prominent crevasses near the calving ice front, green arrow and supraglacial streams , blue arrows. The retreat here is similar to but less than that observed at Gangg’er Glacier in the Shule River Basin, Qilian Mountains. 

Suhai Hu, Quilian Mountains Ice Cap in 2001 and 2015 Landsat image indicating five different outlet glacier termini that all ended in proglacial lakes in 2001 and all retreated significantly by 2015.


Google Earth image at the yellow outlet glacier. Green arrow indicates crevassing near front and blue arrows supraglacial streams. 

Winter Season Ablation in 2018 Mount Everest Region, Himalaya

Landsat images from Nov. 17 2017 and Feb. 10 2018 indicate a rise in the snowline, purple dots, on glaciers east of Mount Everest, indicating ablation even in winter from the terminus to the snowline. Rongbuk Glacier=R, East Rongbuk Glacier=ER Far East Rongbuk Glacier=F, Kada Glacier=K,  Barun Glacier=B,  Imja Glacier=I and Kangshung Glacier=KX.

The Mount Everest region glaciers are summer accumulation type glaciers with 70% of the annual precipitation occurring during the summer monsoon. This coincides with the highest melt rates low on the glacier.  October has been considered the end of the melt season in the region. There is little precipitation early in the winter season (November-January). The limited snowpack with warmer winter temperatures have led to high snowlines during the first few months of the winter season in recent years. There is an expanded ablation season that extends beyond October into January or February. The melt rates do to solar radiation or sublimation are not rapid, but are significant on many glaciers. This has occurred with increasing air temperatures since the 1980’s. Mean annual air temperatures have increased by 0.62 °C per decade over the last 49 years; the greatest warming trend is observed in winter, the smallest in summer (Yang et al., 2011).    The winter season of 2017-18 has been warm in the region as indicated by global temperature anomalies from, NCDC/NOAA (at right). Here we examine Landsat images from Oct. 21 2017, Nov. 17 2018 and Feb. 10 2018  on the east side of Mount Everest to observe changes in the snowline during the winter period.  We observed the same phenomenon of high snowlines and winter ablation at Nup La on the west side of Mount Everest in January of 2016, On Chutenjima Glacier, China in 2016 and Gangotri Glacier, India in 2016 (see below).

At the end of the typical melt season on 10-21-2017, the snowline is at 5850 m on Rongbuk Glacier, 6250 m on East Rongbuk Glacier, 6300 m on Far East Rongbuk Glacier, 5900 m on Kada Glacier, 6050 m on Barun Glacier and ~6100 m on Imja Glacier.

A month later on 11-17-2017 the snowline has decreased to 5700 m on Rongbuk Glacier, 6200 m on East Rongbuk Glacier, 6200 m on Far East Rongbuk Glacier, 5820 m on Kada Glacier, 5950 m on Barun Glacier and still at ~6100 m on Imja Glacier.

Three months later on 2-10-2018 the snowline has risen indicating ablation from the terminus area up to the snowline.  The snowline is at 5900 m on Rongbuk Glacier, 6400 m on East Rongbuk Glacier, 6400 m on Far East Rongbuk Glacier, 5950 m on Kada Glacier, 6200 m on Barun Glacier and 6600 m on Imja Glacier. Notice on Far East Rongbuk Glacier the snowline reaches the glacier divide in February.  The mean rise in snowline from November 2017-February 2018 on the east side of Mount Everest is 200 m.

The ablation rates necessary to raise the snowline are not large on a daily basis, but cumulatively are significant as noted on Lirung Glacier by Chand et al (2015)

Kundu et al (2015) noted that from Sept. 2012 to January 2013 the snowline elevation on Gangotri Glacier varied little, with the highest elevation being 5174 m and the lowest 5080 m. Bolch et al (2011) observed strong thinning in the accumulation zone on Khumbu Glacier, though much less than the ablation zone. This can only happen with reduced retained snowpack particularly in winter.

Landsat image from Oct. 21 2017 indicate a rise in the snowline, purple dots, on glaciers east of Mount Everest, indicating ablation even in winter from the terminus to the snowline. Rongbuk Glacier=R, East Rongbuk Glacier=ER Far East Rongbuk Glacier=F, Kada Glacier=K,  Barun Glacier=B,  Imja Glacier=I and Kangshung Glacier=KX.


W

Purple dots indicate the transient snowline on Gangotri Glacier in the fall and early winter of 2016. Red arrow indicates the terminus of the glacier. Landsat 12-9-16

Landsat image from January 4, 2016 indicating the actual Nup La (N), west side of Mount Everest.  Purples dots is the snowline. Green arrows are expanding bedrock exposures and pink arrow a specific rock know amidst the glacier.