Benito Glacier, Chile Retreats 2km 1987-2015

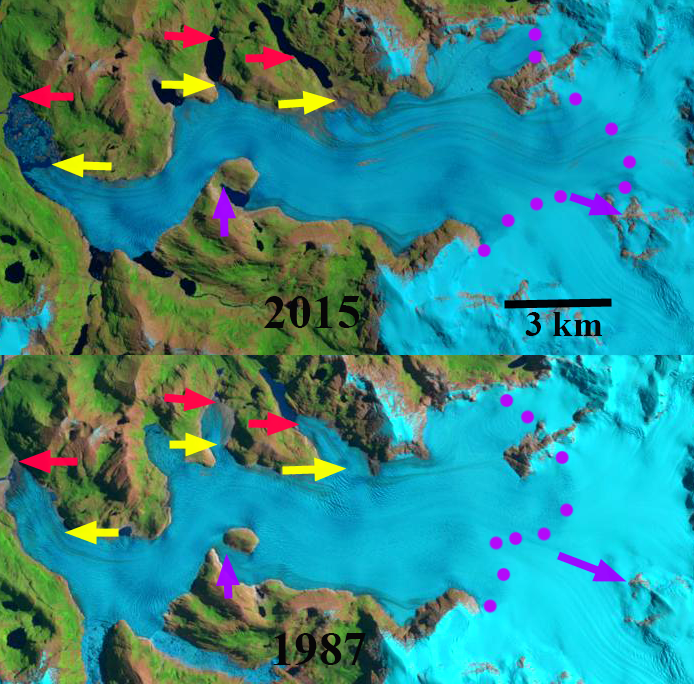
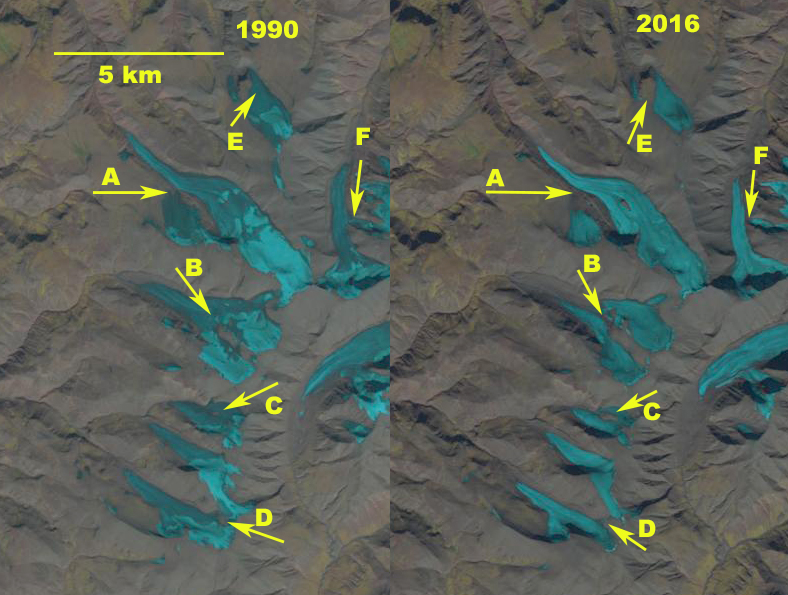
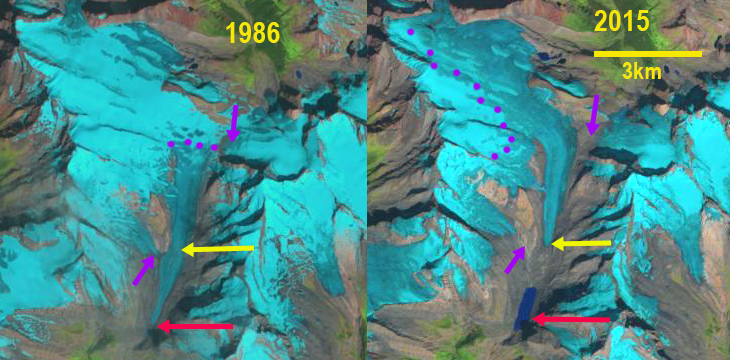
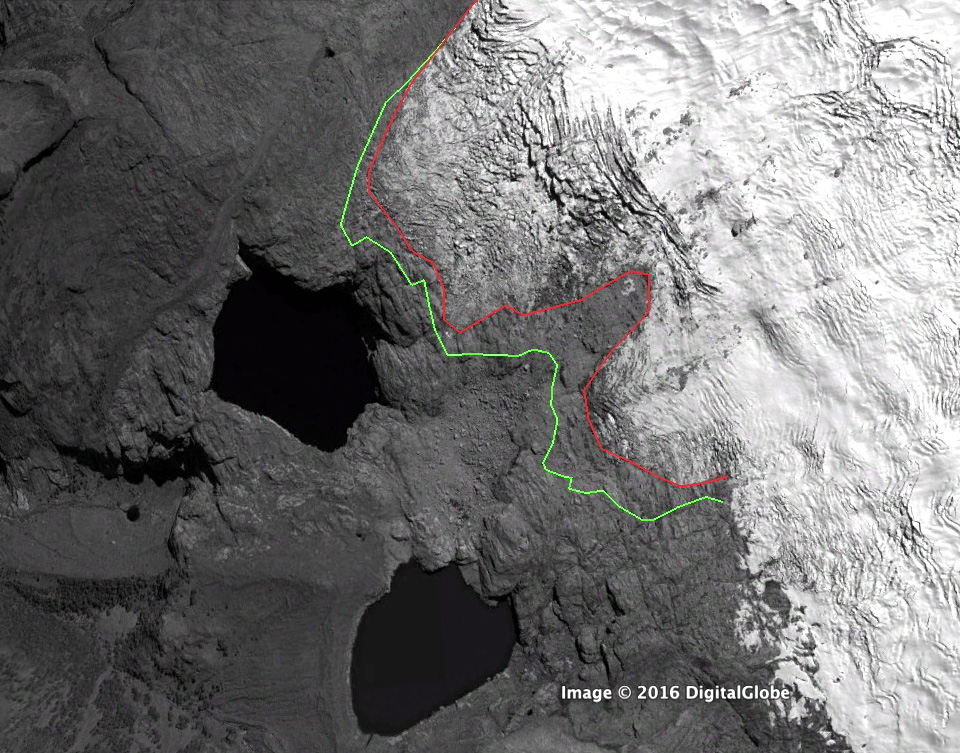
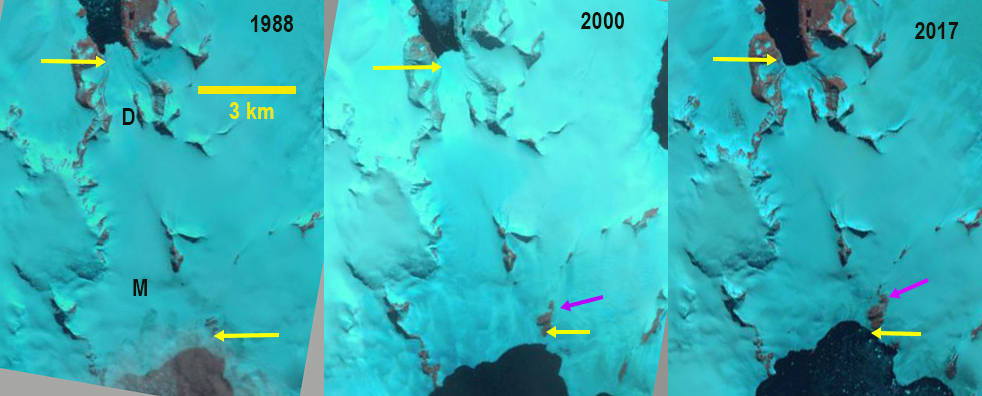
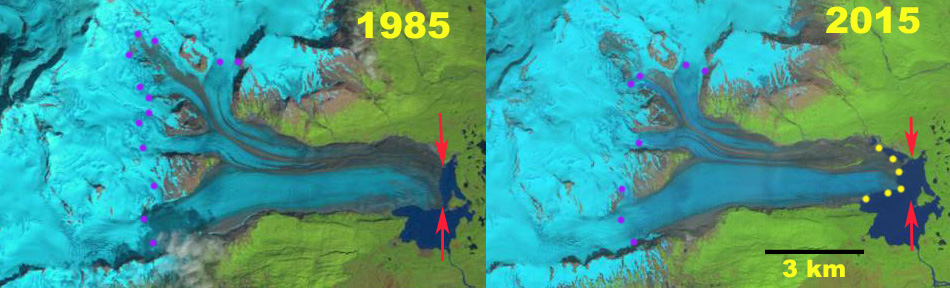
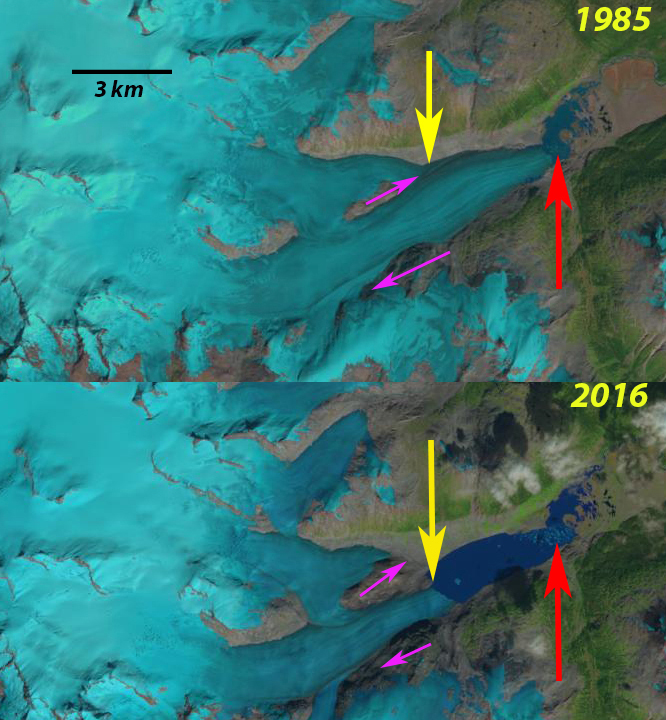
Benito Glacier comparison in 1987 and 2015 indicating the terminus position in 1987 red arrows, yellow arrows the 2015 terminus positions, purple arrows where glacier thinning is expanding bedrock areas, the snowline is indicated by purple dots. 

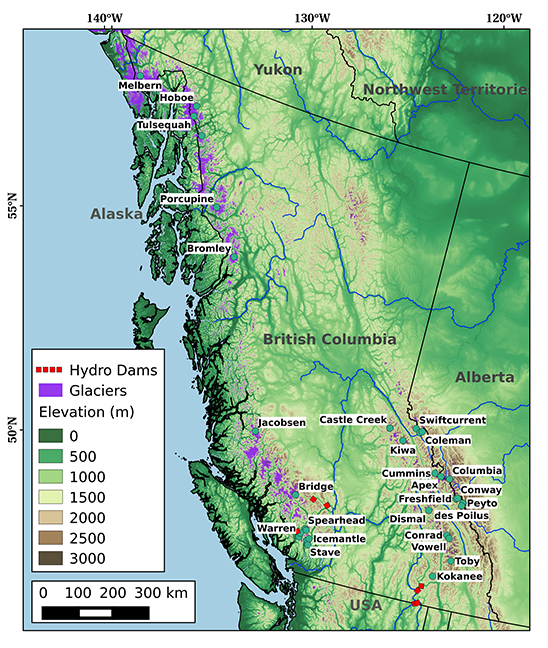
Glacier Benito is a temperate outlet glacier on the west side of the North Patagonian Icefield the glacier is south of  Fraenkel Glacier and north of Acodado GlacierLoriaux and Casassa (2013) examined the expansion of lakes of the Northern Patagonia Ice Cap. From 1945 to 2011 lake area expanded 65%, 66 square kilometers.  Willis et al (2012) noted a 2.0 m ice thickness loss per year from 2001-2011 in the ablation zone. Mouginot and Rignot (2015)  indicate that the velocity of Benito Glacier is between 200-500 m per year along the center line below the snowline.  Glasser et al (2016) note that this glacier has limited debris cover. In the last two years an expedition organized by Martin Sessions has been examining Benito Glacier and has been reporting from the field this month. 

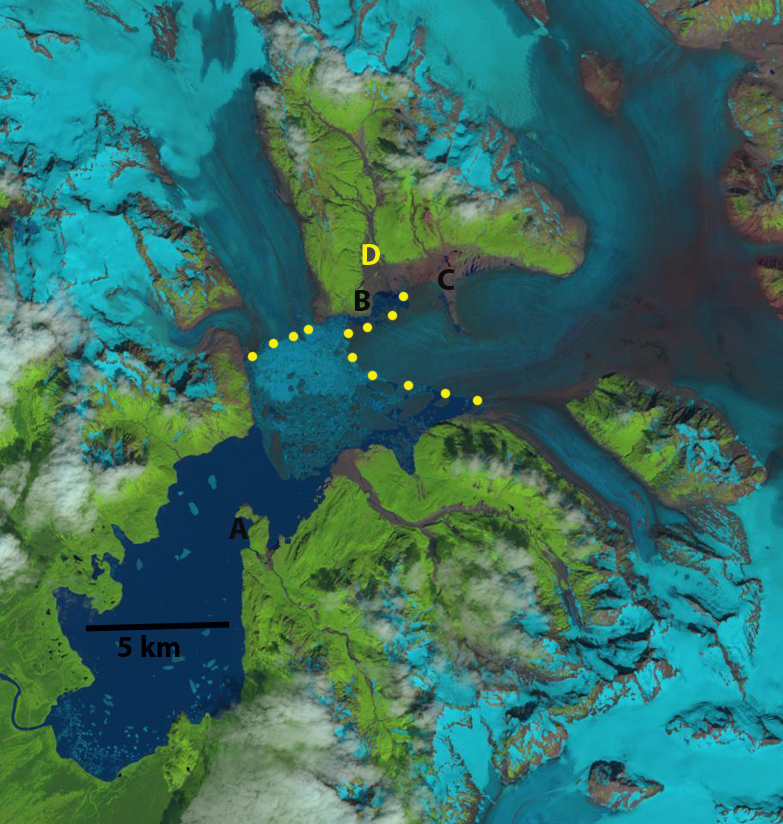
Benito Glacier in 1987 terminated on an outwash plain.  The glacier has five key distributary termini two of which have open proglacial lakes.  By 2015 there are six tributary termini, five ending in lakes, with one having retreated out of a lake basin. The two tributaries to the north indicated with arrows each retreat approximately 1 km from 1987 to 2015 and in both cases are no longer calving termini.  The main glacier terminus has retreated into a proglacial lake, with a retreat of 2 km from 1987 to 2015. The lowest 1.5 km  has a low slope and peripheral lakes suggesting the terminus lake will expand substantially as Benito Glacier retreat continues. The transient snowline in  the two images 2015 and 2016 is at  900 m. Glasser et al (2016) note that this glacier average transient snowline in 2013-2016 is at 1000 m.  Winchester  et al. (2013) identified thinning of 150 m in the lower ablation zone from 1973-2011, with the most rapid thinning from 2007-2011.

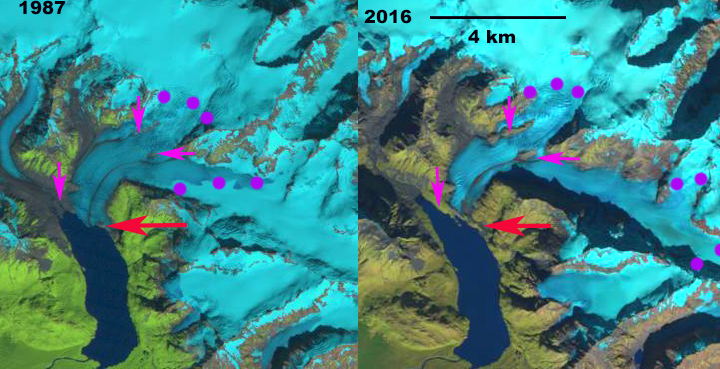
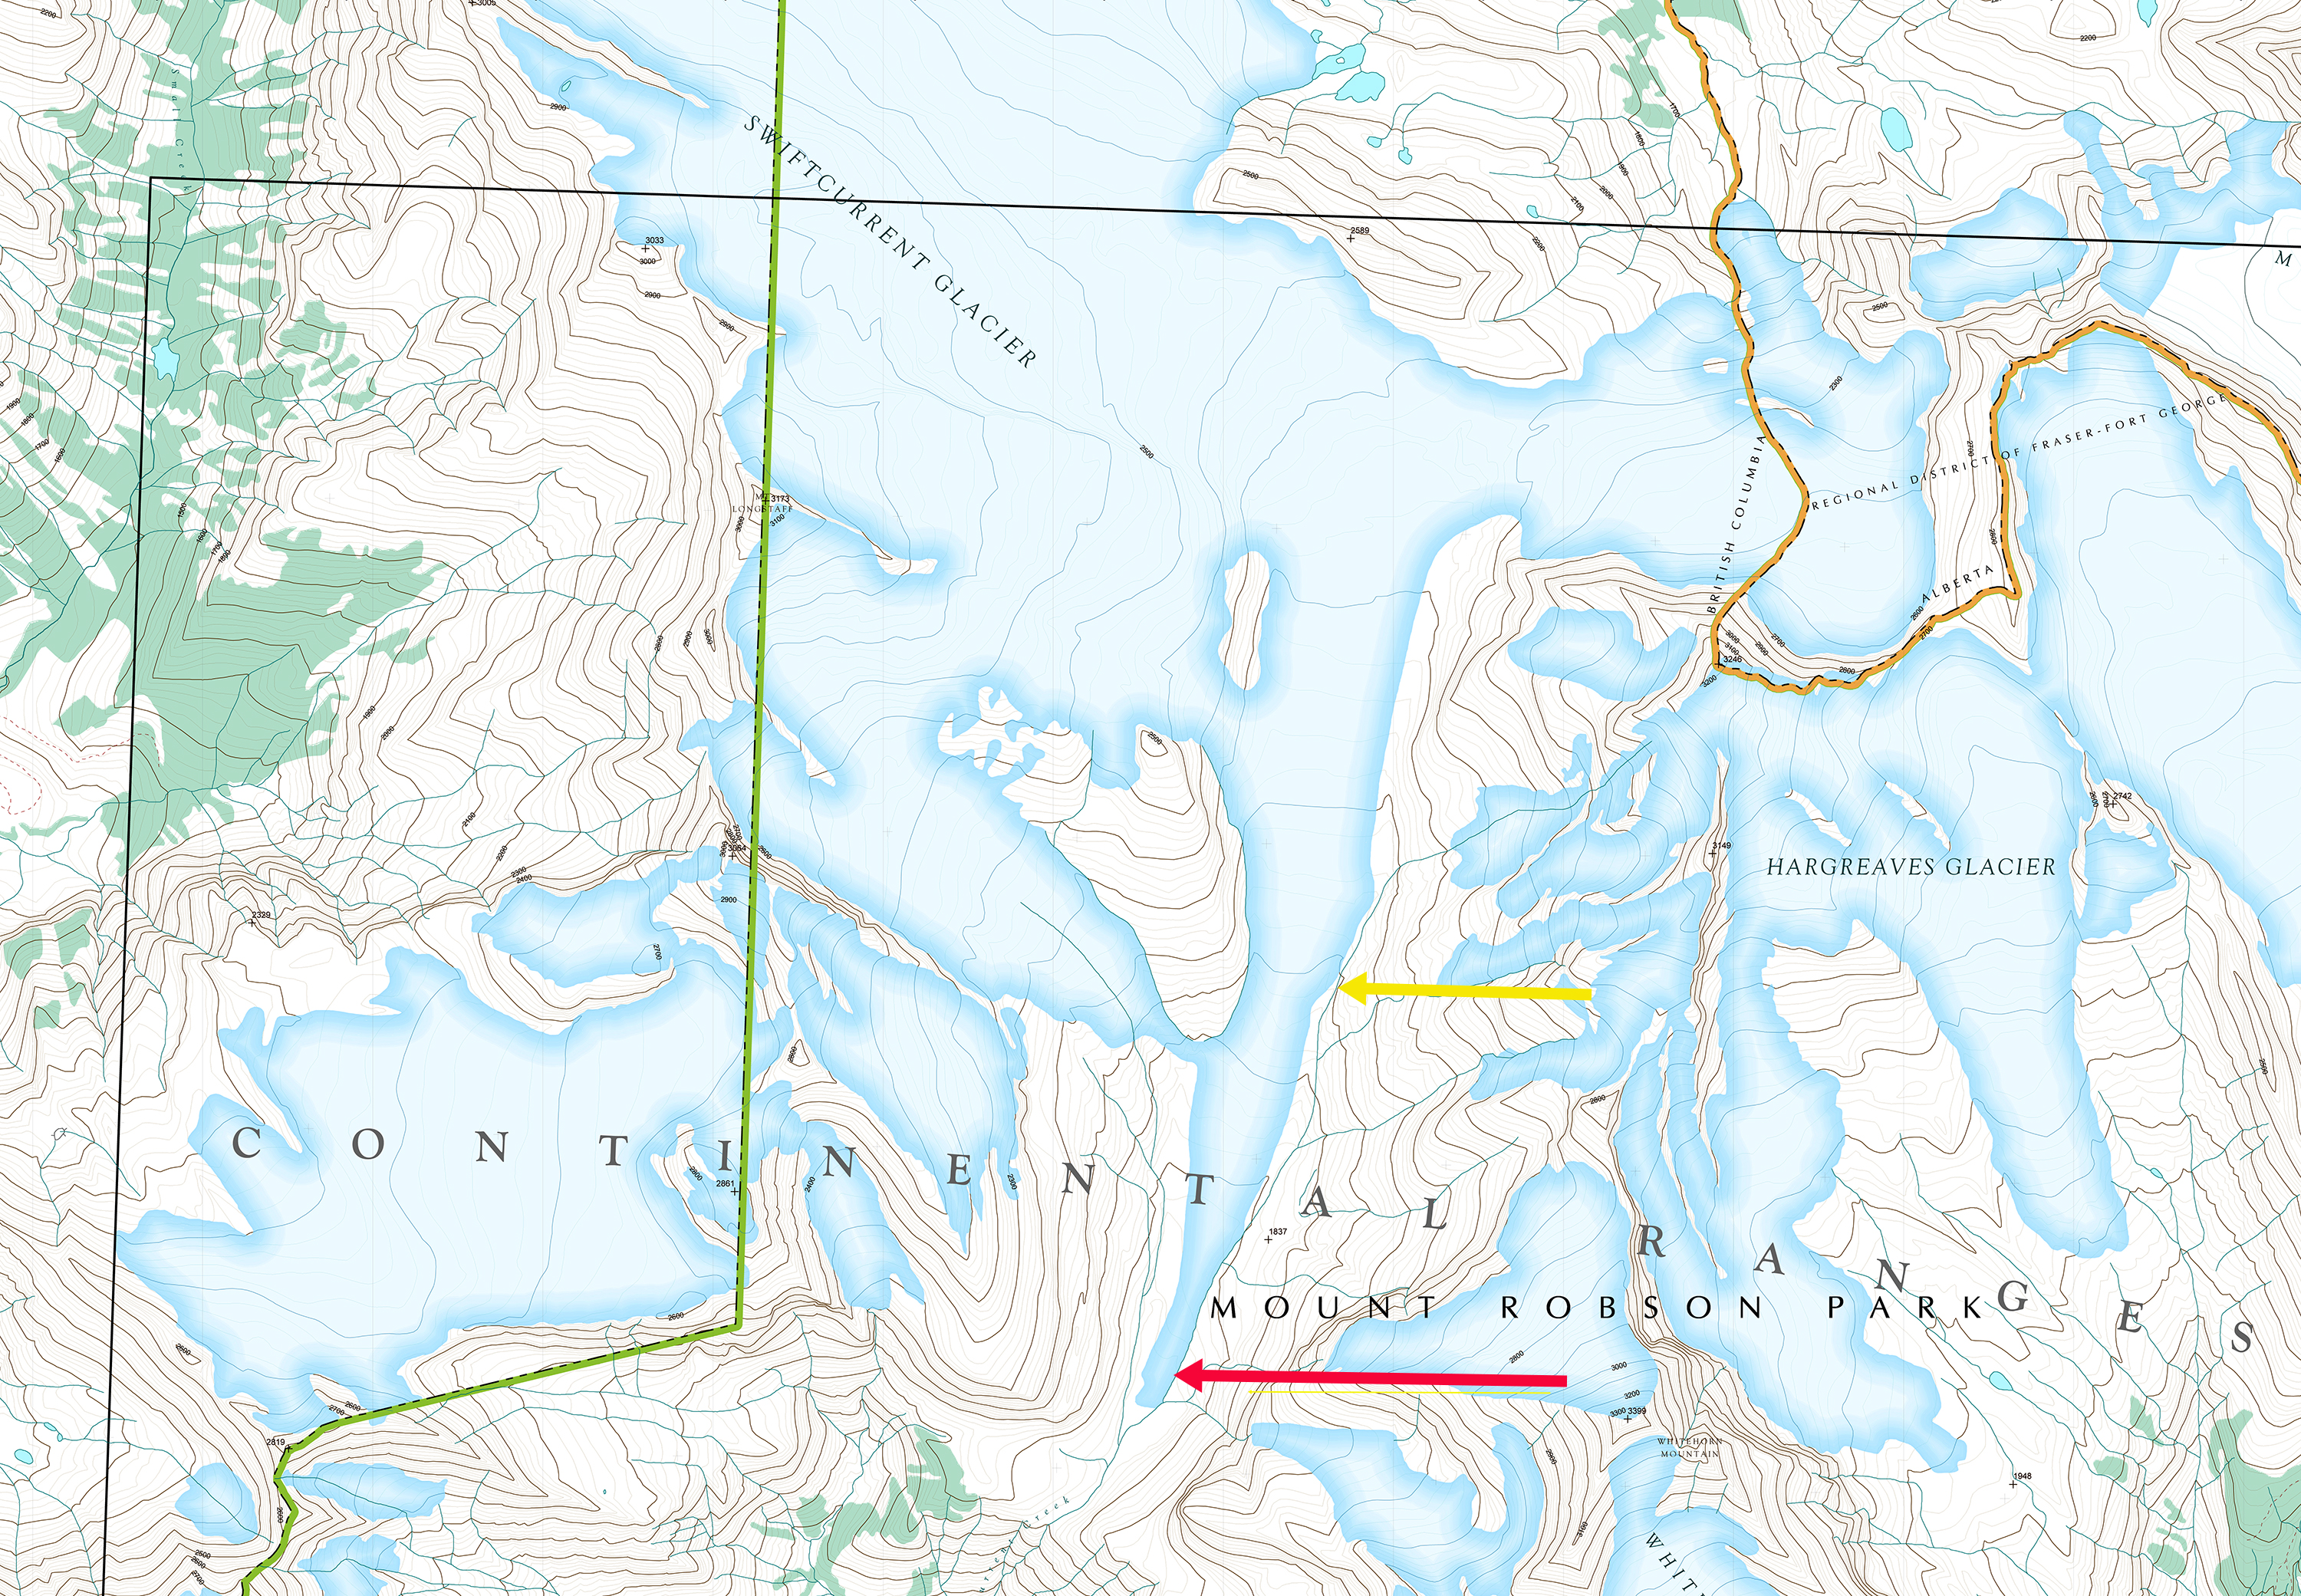
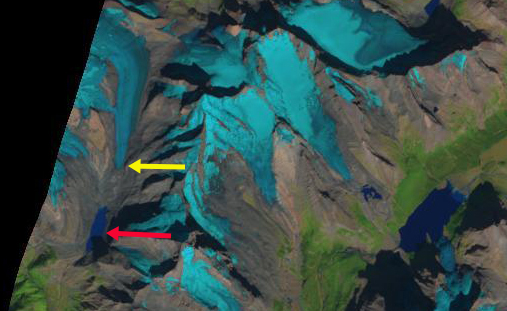
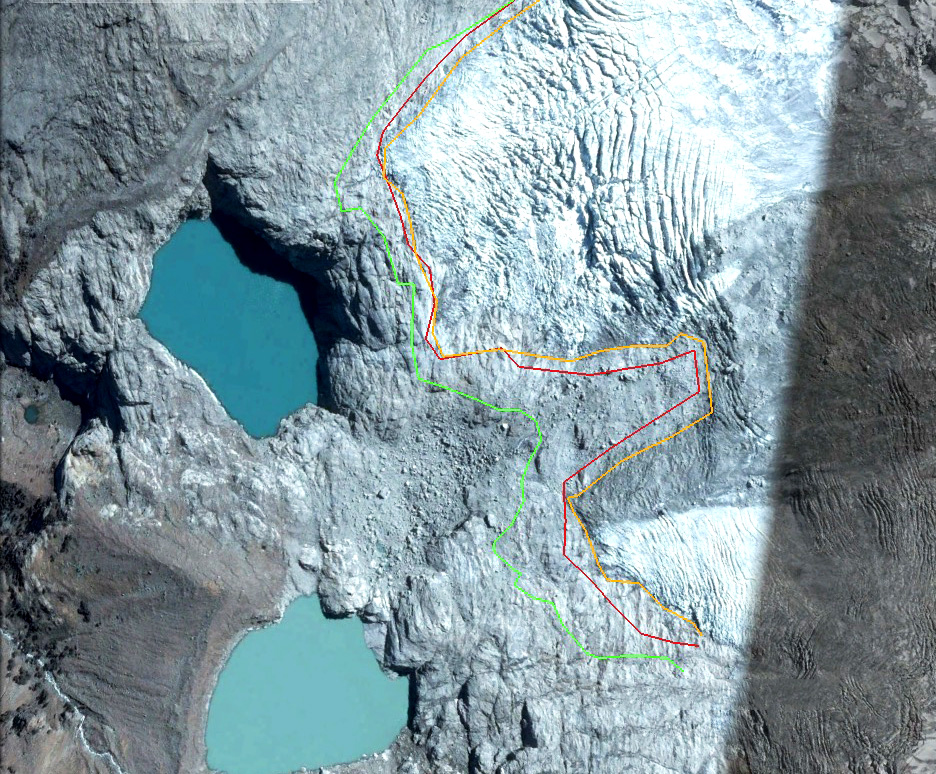
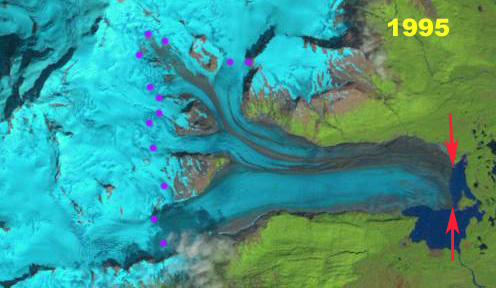
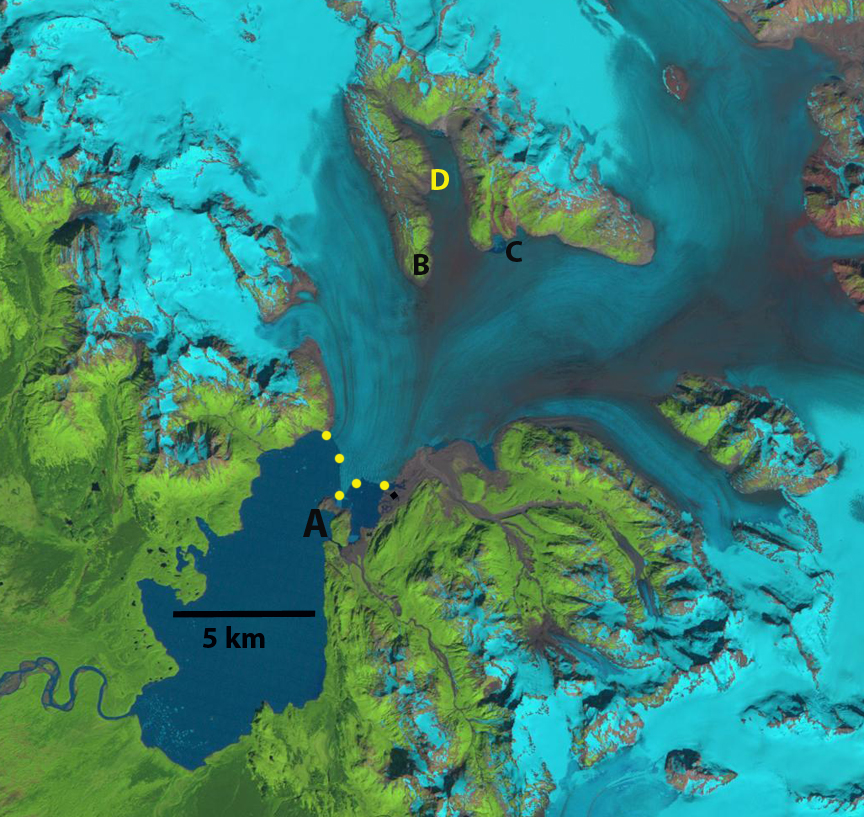
Benito Glacier comparison in 1987 and 2015 indicating the terminus position in 1987 red arrow, yellow arrow the 2015 terminus positions, and the snowline is indicated by purple dots. 

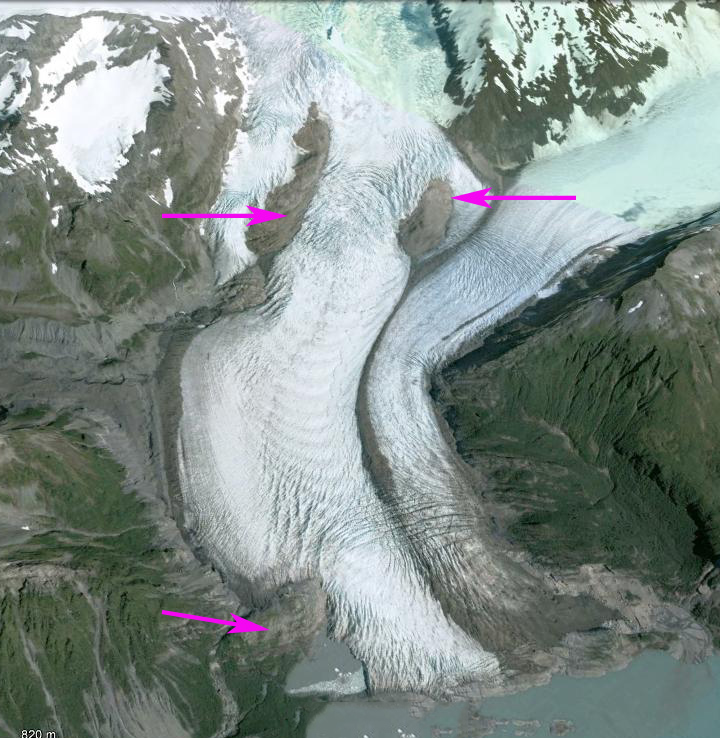
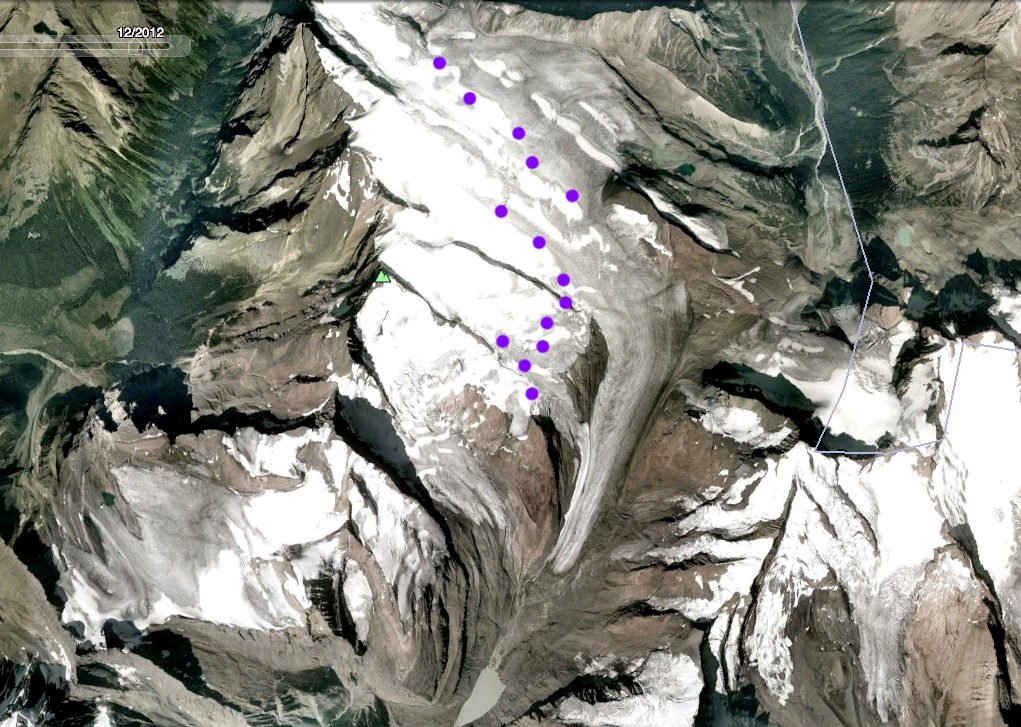
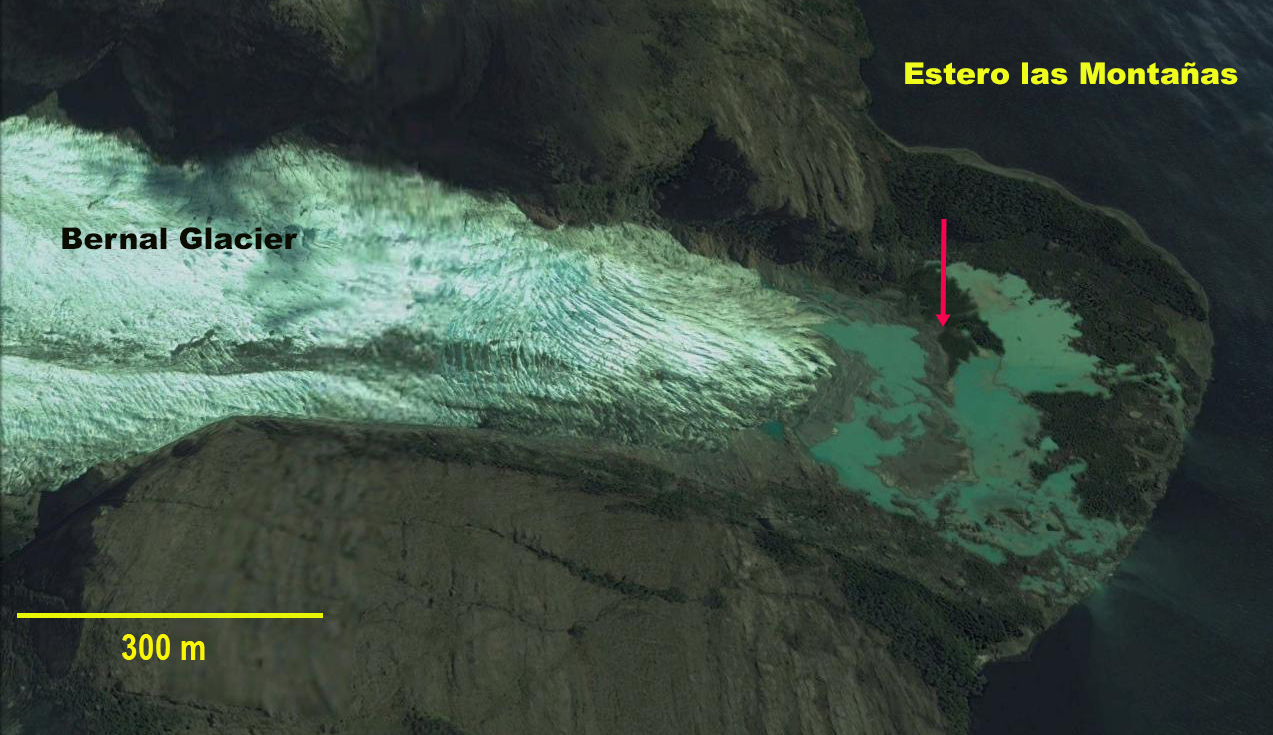
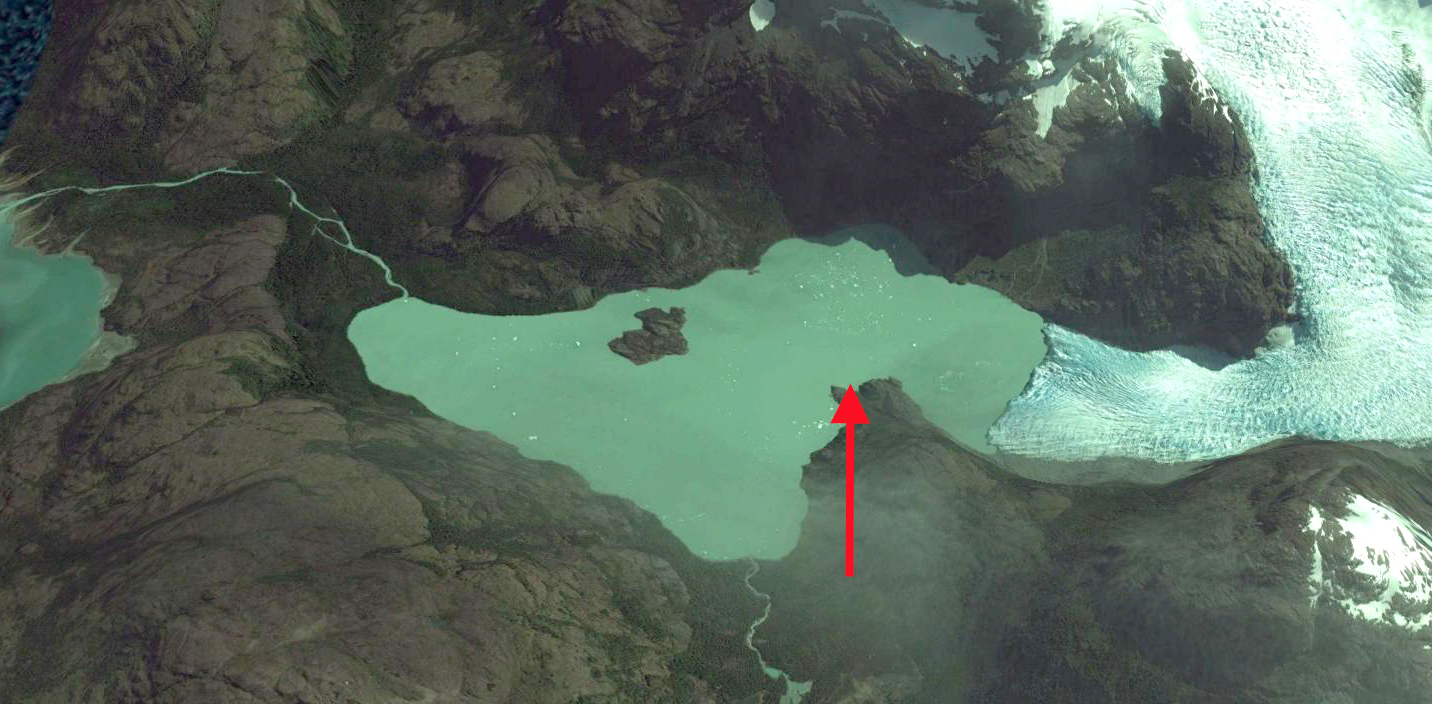
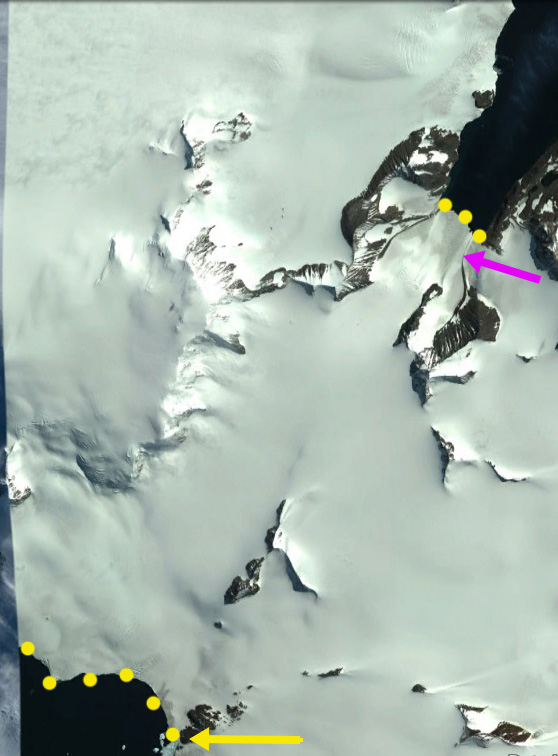
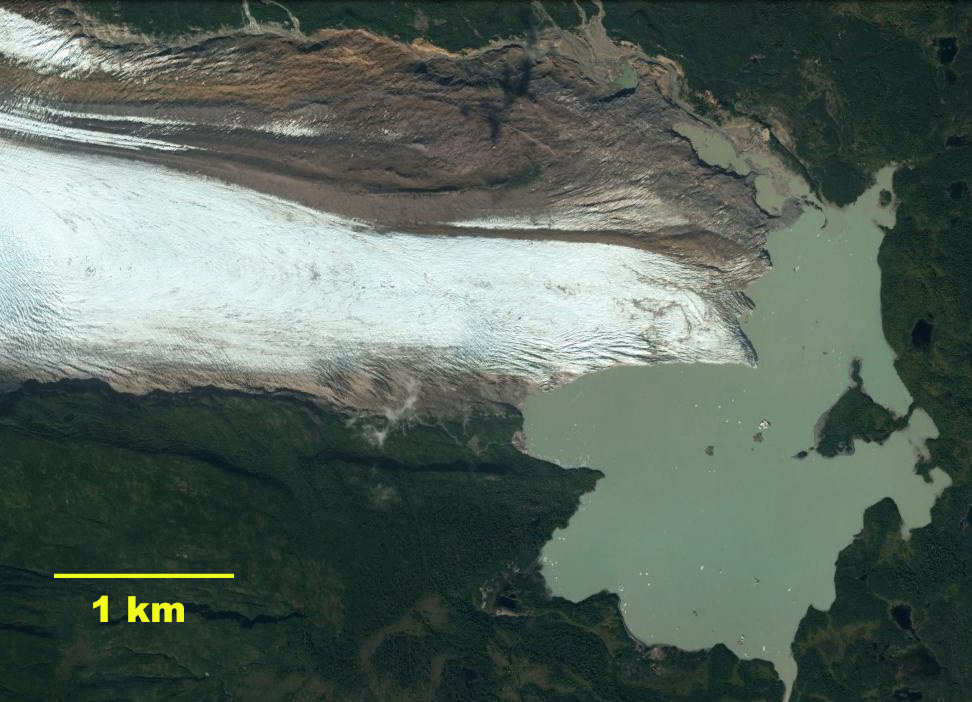
Google Earth image in 2012 of Benito Glacier indicating proglacial lake areas at the green arrows.  


Fasset Glacier, Alaska Retreats from Tanis Lake

Fasset Glacier in 1987 and 2016 Landsat images.  Red arrow indicates glacier front in 1987, pink arrows indicates areas where glacier retreat has exposed rock/bare ground and purple dots indicate snowline.

Fasset Glacier drains west from The Brabazon Range near Yakutat and had terminated in Tanis Lake for the entire 20th century.  (Truessel et al 2013) and Truessel et al (2015) note the rapid retreat and thinning of nearby Yakutat Glacier. Here we examine Landsat imagery that illustrates the retreat from 1987 to 2016. 

The glacier extended most the way to the southern end of the Tanis Lake in the 1951 Yakutat map.  In 1987 the glacier terminated on the northeast shore of Tanis Lake. The calving front in the lake was 800 m wide.  The snowline was at 600 m.  In mid-June of 2014 the snowline was already at 600 m, by the end of the melt season it was at 900 m. In 2016 the terminus of the glacier no longer reaches Tanis Lake. The eastern side of the terminus is stagnant and ends 200 m from the shore of the lake.  The western edge terminates in a new lake that is forming.  The average retreat has been 250 m for the glacier from 1987-2016. The larger changes are upglacier of the terminus where large areas of bedrock have been exposed due to retreat, and several segments of the glacier that used to be joined have separated. The snowline is at 850 m in 2016. There are three large areas of bedrock denoted in the 2014 Google Earth image below.  The two at 500 m well above the terminus appeared as medial moraines in 1987 and are now bedrock ridges 600 m and 1100 m long. There is a group of ogives extending below these two locations indicating the annual flow rate is 100 m/year in this reach of the glacier.  The new lake is also evident in the Google Earth image. 

Walker Glacier, Yakutat Glacier and East Novatak Glacier are nearby glaciers that have experienced greater recent retreat than Fasset Glacier.  Fasset Glacier is poised to continue a moderate rate of retreat. 

USGS Yakutat map from 1951

2014 Google Earth image, pink arrows indicate three areas of thinning. 

2014 Google Earth image.

2014 June Landsat image indicating snowline. 

Yakutat Glacier Terminus Collapse, 10 km retreat 1987-2016

Landsat images from 1987 and 2016 with terminus indicated by yellow dots. Point A indicates the 1987 terminus location and Point E the 2016 terminus location. 

The Yakutat Glacier during the 1894-1895 Alaskan Boundary Survey ended near a terminal moraine on a flat coastal outwash plain. By 1906 the glacier had retreated from the moraine and a new lake was forming. Harlequin Lake. Surveys of the terminus of the glacier indicated a retreat of 1 kilometer in that decade. From 1906-1948 the glacier retreated an additional 5 km. From 1948-1958 the glacier retreated 3.6 km. The retreat is evident in comparing the Yakutat B-3 quadrangle, from 1958 photography, and Landsat imagery from 1987, 2010, 2013 and 2016. Points A-E are the same in each image and the yellow dots are the terminus. In 1987 the terminus was just retreating from a peninsula marked A, the valley at D was filled with ice, there was no break in the surface at C and B was well inland of the terminus. By 2010 the glacier had retreated from A, the valley at D was deglaciated, a small strip of bedrock-sediment was exposed at C from what had been beneath the glacier, and B was still well inland of the terminus. By 2013 the northern arm of the glacier had retreated 6.4 km from the peninsula at A toward the peninsula at B. The central arm of the glacier toward C had retreated 7.5 km and the retreat on the southern edge of the glacier was 6.5 km. The glacier had retreated on average more than 6.6 km in 27 years, a rate of 240 m/year.  From 2013 to 2016 the glacier had retreated from Point B to Point C on the northern side and to Point E on the southern side this is a distance of 10.2 km in thirty years 340 m/year. 

Recently the glacier has been the focus of a study by the University of Alaska, Faribanks they have set up a time lapse camera to record frontal changes. The goal is to understand the controls on calving into Harlequin Lake of this glacier. More amazing than the retreat has been the observed thinning of the glacier. The glacier has thinned by more 200 m on average according to the preliminary thickness change maps from the UAF project (Truessel et al 2013) and updated by Truessel et al (2015). The Yakutat Glacier does not have a high accumulation zone and the recent increase in the snowline elevation and thinning of the glacier have led to a substantial shrinking of the accumulation zone and thinning of the glacier in the accumulation (Truessel et al 2013). This glacier does not have a persistent significant accumulation zone and cannot survive (Pelto, 2010), Truessel et al (2015). modelling suggests the glacier will disappear between 2070 and 2110 depending on the warming scenario.  For a calving glacier to be in equilibrium it needs to have at least 60 % of its area snowcovered at the end of the summer. The glacier is in the midst of a large ongoing retreat. The retreat rate and calving mechanism is similar to that of Grand Plateau Glacier, Bear Lake Glacier and Gilkey Glacier. However, unlike these Yakutat Glacier lacks an accumulation zone, a better analog is East Novatak Glacier, which also has a lower elevation accumulation zone.


Yakutat terminus map


2010 Landsat image with terminus indicated by yellow dots.


2013 Landsat image with terminus indicated by yellow dots.


Nuusuaq Peninsula West Greenland Glacier Disintegration

Comparison of alpine glaciers on Nuussuaq Peninsula in 1990 and 2016 Landsat images.  Each arrow is at a specific location in both images exhibiting glacier separation/disintegration. 

The Nuussuaq Peninsula is just north of Disko Island in West Greenland and is home to many alpine glaciers and small ice caps.  Here we examine the furthest west group of alpine glaciers on the peninsula.  This group is 125 km west of the ice sheet and is not influenced directly by the ice sheet, but instead is most sensitive to the conditions over the Davis Strait and Baffin Bay just 25 km away.  The glaciers are near Snokpulen Peak, 1928 m.  Smaller ice caps around the Greenland Ice Sheet have been losing mass. Citterio et al (2011) documented the existence of 1172 glacier in 2001 on Disko Island,  Nuussuaq Peninsula and Svartenhuk Peninsula. West Greenland.  Bolch et al (2013) using Landsat imagery and  ICESat altimetry data noted that peripheral ice caps and glacier provided a significant fraction,~14 or 20% of the reported overall mass loss of Greenland to sea level.  This is equivalent to 10% of the estimated contribution from the world’s alpine glaciers and ice caps to sea level rise.  Noël et al, (2017) observed that  in ~1997 a tipping point for the peripheral ice caps/alpine glaciers of Greenland occurred in terms of  mass balance. The onset of a rapid deterioration in the capacity of the glaciers firn to refreeze meltwater led to mass losses and consequent glacier runoff increased 65% faster than meltwater production. Mittivakkat Glacier is an example of this trend. 

Here we compare 1990-2016 Landsat images indicating the changes in the alpine glaciers near Snokpulen Peak.  At Point A,B,D and F there is a glacier connection between tributaries or adjacent glaciers. At Point C and E there is an area of limited bare ground amidst the glacier.  Also notice in 1990 there is retained snowpack on the glaciers.  In the 2002 image below there is also retained snowpack.  In 2016 there is not retained snowpack on the glaciers, indicating the lack of an accumulation zone.  Without an accumulation zone there is not firn for meltwater to percolate into and refreeze. Meltwater is then not recaptured and is lost as noted by Noël et al, (2017), to be a widespread occurrence. The adjacent glaciers at Point A, B, D and F are now separated.  The extent of bare ground near point C and E has expanded significantly.  The area loss here underscores the volume loss of the peripheral ice caps that Bolch et al (2013) observed. 

2002 Landsat image indicating some retained snowpack on the glaciers.

Topographic Map of the region on Nuussuaq Peninsula.

Google Earth image of region, indicating the separation/disintegration that is occurring. 

Swiftcurrent Glacier, British Columbia, Swiftly Retreating 1986-2015

Swifttcurrent Glacier Comparison from 1986 and 2015 Landsat images.  Red arrow is the 1986 terminus, yellow arrow 2015 terminus, purple arrow significant tributaries in 1986, and purple dots the snowline.

Swiftcurrent Glacier drains the southeast side of Mount Longstaff 15 km NW of Mount Robson.  The glacier is near the headwaters of the Fraser River, and its retreat since 1986 has led to the formation of a new alpine lake. Here we examine glacier change from 1986 to 2015 in Landsat images.  Bolch et al (2010) found that from 1985-2005  BC glaciers lost 11% of their area.  Jiskoot et al (2009) examined the behavior of Clemenceau Icefield and found that from the mid 1980’s to 2001 the nearby Clemenceau Icefield glaciers had lost 42 square kilometers, or 14% of their area.  Tennant and Menounos (2012) examined changes of the Rocky Mountain glaciers in Alberta and BC finding that from 1919 to 2006 that glacier cover decreased by 590 square kilometers, 17 of 523 glaciers disappeared and 124 glaciers fragmented into multiple ice masses. 

In 1986 Swiftcurrent Glacier terminated at 1715 m, red arrow and had a snowline of 2300 m.  There is not an alpine lake at the terminus or in the map of the region.  There are two prominent tributaries evident, purple arrows. In a Google Earth image from 2005, a new alpine lake had formed and the snowline was at 2500 m.  In the 2013 Landsat image only the eastern side of the glacier is seen, the snowline is above 2600 m. In 2015 the new alpine lake is 1100 m long, the glacier terminates at the yellow area at 2000 m.  This represents a 2.8 km retreat from 1986-2015.  The snowline in 2015 is at 2650-2700 m.  The two significant tributaries have separated from the glacier at the purple arrow. The high end of summer snowlines in recent decades indicate an expanded melt zone and mass loss.  This is and will continue to drive terminus retreat.  The retreat is similar to two other headwaters glaciers in the region; Kiwa Glacier and Robson Glacier.


Map of the Swiftcurrent Glacier  region  from GeoBC, this is a 1983 base map.

2005 Google Earth image of Swiftcurrent glacier, purple dots indicate snowline.

2013 Landsat image of Swiftcurrent Glacier.

Beautiful British Columbia Land of Many Mountains & Dwindling Glaciers

[ngg_images source=”galleries” container_ids=”4″ display_type=”photocrati-nextgen_basic_imagebrowser” ajax_pagination=”1″ template=”/nas/wp/www/sites/blogsorg/wp-content/plugins/nextgen-gallery/products/photocrati_nextgen/modules/ngglegacy/view/imagebrowser-caption.php” order_by=”sortorder” order_direction=”ASC” returns=”included” maximum_entity_count=”500″]

British Columbia is host to many mountain ranges; Purcell, Monashee, Bugaboo, Selkirk, Cariboo, Coat Range, Kootenay, Kwadacha are just some of the diverse mountain ranges  that host glaciers and span climate zone. A shared characteristic today regardless of climate zone or mountain range is dwindling glacier size and volume.  Bolch et al (2010) found that from 1985-2005 Alberta glaciers lost 25% of their area and BC glaciers 11% of their area.  Tennant and Menounos (2012) examined changes of the Rocky Mountain glaciers including Alberta finding that between 1919 and 2006 glacier cover decreased by 590 square kilometers, 17 of 523 glaciers disappeared and 124 glaciers fragmented into multiple ice masses.  Jiskoot et al (2009) examined the behavior of glaciers of the Clemenceau and Chaba Icefield and found that from the mid 1980’s to 2001 the Clemenceau Icefield glaciers had lost 42 square kilometers, or 14% of their area. Pelto (2016) reported on specific retreat of many of these BC glaciers. Below are links to 31 detailed post examining the changes in recent decades of British Columbia glaciers in response to climate change.

In the summer glaciers in many ranges are crucial water resources for aquatic life and hydropower.   In BC 92% of electricity is generated by hydropower mainly from large projects.  BC Hydro has 31 such large projects, including several heavily fed by glaciers: Bridge River, Mica, Cheakamus, Ruskin and Stave Falls. There are also run of river hydroprojects with a new one constructed by AltaGas, the 195 MW Forrest Kerr Project on Tahltan First Nation land on the Iskut River. The Iskut River like the Stikine River is heavily glacier fed. As spring begins glaciologists will be heading out to measure glacier mass balance a critical input to understanding current and future glacier runoff, such as the Columbia Basin Trust sponsored project overseen by Brian Menounos at UNBC, and field operation direct by Ben Pelto at UNBC.


Forrest Kerr Hydro is a run of river project relying on a weir instead of a dam to divert water into the intake.
There are also numerous salmon fed streams with critical glacier input, such as the Skeena River and Rivers Inlet. Stahl and Moore (2006) identified that discharge from glacierized and nonglacierized basins in British Columbia indicates the negative August streamflow trends illustrate that the initial phase of increase runoff causing by climate warming has passed and runoff is now declining. This is similar to further south in the North Cascades of Washington (Pelto, 2015).

Shatter and Shudder Glacier
Snowcap Creek Glacier
Stave Glacier
Helm Glacier
Warren Glacier
Galaxy Glacier
Icemantle Glacier
Big Bend Glacier
Kokanee Glacier
Toby Glacier
Conrad Glacier
Vowell Glacier
Bridge Glacier
Klippi Glacier
Yoho Glacier
Des Poilus Galcier
Haworth Glaciers

Apex Glacier
Kiwa Glacier
Dismal Glacier
Cummins Glacier
Coleman Glacier
Swiftcurrent Glacier
Bromley Glacier
Sittakanay Glacier
Nass Peak Glacier
Porcupine Glacier
Great Glacier
Hoboe Glacie
Tulsequah Glacier
Melbern Glacier

Bernal Glacier, Retreating from Chilean Fjord

Bernal Glacier terminus looking towards Estero las Montañas from Eñaut Izagirre and Camilo Rada.

Bernal Glacier drains east from the Sarmiento de Gamboa Range in Southern Patagonia terminating a short distance from the Estero las Montañas. The glacier is in the Alacalufes National Reserve and can be seen from boats traveling up the fjord. Davies and Glasser, (2012) indicate extensive recession of almost all glaciers in the range from 1870-2011. The fastest recession rate of recession of Bernal Glacier is from 2001-2011.  Melkonian et al (2013) observed that the Cordillera Darwin Icefield (to the south) had an average thinning rate of −1.5 m w.e/year from 2001-2011, while Willis et a (2012) quantify a rapid volume loss of the Southern Patagonia Icefield (SPI-to the north) from 2000-2012.  Incognita Patagonia has been exploring and mapping glaciers in the region since 2015 including a visit to Bernal Glacier in March 2017 that inspired this post Izagirre (2017)

In 1986 there is no proglacial lake evident at the terminus of the glacier, red arrow.  By 2013 the glacier has thinned and retreated enough to reveal a pair of proglacial lakes separated by a moraine where the glacier terminated in 1986, red arrow.  By 2017 the proglacial lake has further expanded and glacier thinning has revealed larger areas of bedrock at the purple arrows.  There is not significant calving in the shallow proglacial lake and the retreat is driven by surface melting. The revegetation of the proglacial outwash areas in 2017 is also apparent. The amount of retreat from 1986 to 2017 is best viewed in the Google Earth image below.  The vegetation trimline from the 1980’s is evident.  Total retreat from 1986 to 2017 is meters. It is The glacier drains the same ice field as the retreating Dama Blanca Glacier and Balmaceda Glacier.

Landsat comparison of Bernal Glacier in 1986, 2013 and 2017 with the red arrow indicating the 1986 terminus.  Purple arrows indicate two areas of bedrock that will be exposed.

Bernal Glacier in Google Earth image from 2015. Red arrow is the 1986 terminus, note the vegetation trimline at that point.

Looking at the Bernal Glacier  from the base camp Eñaut Izagirre and Camilo Rada.


Dama Blanca Glacier Retreat, Southern Chile

Dama Blanca Glacier in Landsat images from 1986 and 2017.  Red arrow is the 1986 terminus, yellow arrow the 2017 terminus, purple dots the snowline and purple arrows a bedrock ridge.

Dama Blanca Glacier drains west from Chile’s Sarmiento de Gamboa Range in Southern Patagonia. terminating in Lago Verde in the Alacalufes National Reserve. Alacalufes NR features kelp rich fjords, Northofagus coastal forests and glacier clad alpine zones. Davies and Glasser, (2012) indicated extensive recession of almost all glaciers in the range from 1870-2011. They indicate the fastest recession rate of  Dama Blanca is from 1986-2001. This range is between the Southern Patagonia Icefield to the north and the Cordillera Darwin Icefield to the south. Incognita Patagonia has been exploring and mapping glaciers in the region since 2015, and have provided a map shown below in coordination with Camilo Rada and Natalia Martinez of the UNCHARTED project . On Marinelli Glacier, in the Cordillera Darwin Icefield, Koppes et al (2009) indicated a retreat of 13 km from 1960 to 2005. More recently Marinellli Glacieri retreated ~3.75 km from 1998 to 2014. Melkonian et al (2013) observed that the Cordillera Darwin Icefield had an average thinning rate of −1.5 m w.e/year with more rapid losses north and west. This is a continuation of the trend noted by Holmund and Fuenzelida (1995) that glaciers on the northern side have a trend of receding fronts. On the southern side the present extent of some glaciers are similar to their 20th century maximum extents. The region is characterized by strong climatic gradients, with high rates of precipitation on the southwestern side of the range where glaciers are faring better and drier conditions on the northern side. Given that the Sarmiento de Gamboa Range is north of Cordillera Darwin it would be expected this area would have substantial recession.

Here we compare satellite images from 1986-2017 to determine the changes of Dama Blanca Glacier. In 1986, the glacier terminated at the end of a peninsula on the south side of Lago Verde, red arrow. The snowline was at 500m. In 2013 the terminus has retreated significantly from the peninsula and the snowline is at 650 m. By 2017 the terminus has retreated 700 m since 1986. The snowline is obscured by clouds in the Landsat image. In February 2017 the snowline is at 700 m. There is also expansion of a bedrock rib on the west side of the glacier that extends to 800 m, purple arrow. The glacier remains actively crevassed to the glacier front as illustrated by the Google Earth image. The glacier will continue to retreat as long as calving continues; however, there is an increase in slope 200-300 m from the current glacier front suggesting the limit for lake development. Izagirre (2017) and the UNCHARTED project explored a number of glaciers in the Sarmiento de Gamboa Range this spring, that will lead to a detailed current map. The retreat here is similar to that of Balmaceda Glacier.

Dama Blanca Glacier in Landsat imags from 2013 and Sentinel image from Dec. 2016  Red arrow is the 1986 terminus, yellow arrow the 2017 terminus, purple dots the snowline and purple arrows a bedrock ridge.

Map from the UNCHARTED Project indicating glaciers of the Sarmiento de Gamboa Range and exploration routes.

Google Earth image of Dama Blanca Glacier in 2013, with the 1986 terminus position at the red arrow.

Vallunaraju Glacier Retreat, Peru 1992-2016

Vallunaraju Glacier comparison in Landsat images from 1992, 1995 and 2016.  Red dots represent the 1992 margin and yellow dots the 2016 margin

The Cordillera Blanca, Peru has 27 peaks over 6,000m, over 600 glaciers and is the highest tropical mountain range in the world. Glaciers are a key water resource from May-September in the region (Carey, 2010).  Mark Carey describes the importance of glacier runoff to the Andean society in this region in his book”In the Shadow of Melting Glaciers: Climate Change and Andean Society“.  The loss of snow and consequent impacts is also beautifull illustrated by Ben Orlove and others in the book “Darkening Peaks : Glacier Retreat Sciecne and Society”. The glaciers in this range have been retreating extensively from 1970-2003, GLIMS identified a 22% reduction in glacier volume in the Cordillera Blanca. Vuille (2008) noted that the mean retreat rate has increased from 7-9 meters per year in the 1970’s to 20 meters per year since 1990. One of the glaciers that is receding  is Vallunaraju Glacier descending the west slopes of Vallunaraju. This glacier drains into the Rio Santa in Huarez, Peru. Baraer et al  (2012) notes the importance of glaciers to the Cordillera Blanca watersheds in the Huarez region, which receive at least 30% of their runoff from glaciers.  Rio Santa is undergoing a decline in dry-season flow that likely began in the 1970s and given the weak correlation between discharge and precipitation suggests the trend is driven by the glacier retreat. Bury et al (2013) examined glacier recession in the Cordillera Blanca, declining Santa River discharge, and alpine wetland contraction noting that water shortages already exist in the basin. Fraser (2012) reporting on recent NSF research project examining water from interdisciplinary perspectives throughout Peru’s Santa River watershed—from Cordillera Blanca glaciers to the Pacific Ocean.  That included Mark Carey, University of Oregon, Bryan Mark at Ohio State University, Jeffrey Bury at UC Santa Cruz,  Kenneth Young at the University Texas, Austin, and  Jeff McKenzie at McGill University.

In 1992 Vallunaraju Glacier extended to the cliffs immediately above the northern of two alpine lake adjacent to the glacier and within 400 m of the southern alpine lake, red dots in Landsat above.  By 2003 the glacier seen in Google Earth imagery had retreated from cliff top above the northern lake.  By 2011 the glacier had retreated 100-200 meters across the entire glacier front since 2003.  An area of bedrock between two terminus lobes had also begun to expand rapidly. This expansion continued up to 2016.  The retreat of the glacier from 2003-2016 averaged 180 m across the glacier front.  Retreat from 1992-2016 ranged from 200-300 m.  The glacier remains heavily crevassed indicating significant glacier flow resulting from substantial annual accumulation.  In every Landsat image analyzed there is a significant snowcovered area. The glacier though receding maintains a significant accumulation zone and can survive current climate.  The glacier is adjacent to the retreating Llaca Glacier.

2003 Google Earth image of Vallunaraju Glacier. Green line is the 2003 margin and red line the 2013 margin.
2011 Google Earth image of Vallunaraju Glacier. Green line is the 2003 margin and red line the 2013 margin.
2013 Google Earth image of Vallunaraju Glacier. Green line is the 2003 margin and red line the 2013 margin.
2016 Google Earth image of Vallunaraju Glacier. Green line is the 2003 margin and red line the 2013 margin. and orange line is the 2016 margin

Depot & Mondor Glacier Retreat, Antarctic Peninsula

Mondor and  (M) and Depot Glacier (D) at the tip of the Antarctic Peninsula in Landsat imagers from 1988, 2000 and 2017.  Yellow arrows indicates the 2017 terminus location of each.  The purple arrow indicates a bedrock ridge that has been expanding.

On the Trinity Peninsula,which is the region at the tip of the Antarctic Peninsula, are Depot and Mondor that flow north and south from the same accumulation zone emptying into Hope Bay and Duse Bay respectively. The Argentine Research Station, Esparanza is on Hope Bay. This region experienced some of the greatest warming on Earth from 1950-1990’s, but no additional warming since the 1990’s (Turner et al, 2016). This climate change has led to a rapid glaciological response, with 87% of glaciers around the Antarctic Peninsula now receding Davies et al (2012) . The most dramatic response has been the collapse of several ice shelves, Jones, Prince Gustav, Wordie, Larsen A and Larsen B. The Prince Gustav Ice Shelf connecting James Ross Island to the Trinity Peninsula collapsed after 1995 (Glasser et al 2011). There is limited surface melting on Antarctic glaciers, as a result almost all of the mass loss is from bottom melting under ice shelves and calving. These processes have led to and continue to drive dramatic retreat, thinning and acceleration of glaciers that feed ice shelves and the ice shelves, such as Rohss Bay and Coley Glacier Here we examine a glacier that is grounded, which limits the impact of enhanced melting from warmer ocean temperatures. Esparanza Base has a long term climate record with only December and January having a mean temperature above 0 C, at 0.4 and 0.5 C respectively. The record high temperature in Antarctica was recorded at Esparanza Base on March 24, 2015 at 17.5 C (Skansi et al, 2017). Specific anomalously warm days are when most mass balance losses occur. Barrand et al (2013) note a strong positive and significant trend in melt conditions in the region, driving the retreat.

In 1988 Depot Glacier terminus was north of a tributary entering on the west side of Depot Glacier. By 2000 the glacier terminus has receded and is adjacent to the northern side of this tributary.  By 2017 the terminus has retreated further and is nearly at the southern edge of the tributary glacier, a retreat of 500 m. Mondor Glacier in 1988 terminates south of bedrock ridge on the east margin of the glacier, yellow arrow. In 2000 the bedrock ridge has expanded and is closer to the terminus. By 2017 the bedrock rib has further extended north, purple arrow, indicating glacier thinning. The overall retreat of the terminus is 400 m from 1988 to 2017. The retreat rate increased after 2000, which is what Davies et al (2012) reported for the region. The rate of retreat is limited as the grounded glaciers have limited calving, and there is limited surface melt. The melt zone is not significant in any of the images on Mondor Glacier. On Depot Glacier there is a melt zone  below 200 m evident in both Goggle Earth images, purple arrows and the 2017 Landsat image. The limited changes of this glacier underscores that it is ocean warming that has been the key to date in glacier retreat in the region.  There has been a significant temperature rise, but it remains too cold for substantial surface melt.

Google Earth image from 2013 of Mondor Glacier terminus, black dots bottom and Depot Glacier black dots top.  Purple arrow indicates area of melting where snowpack has been lost. Yellow arrow a bedrock ridge on east side of Mondor Glacier.

Google Earth image from 2015 of Mondor Glacier terminus, black dots bottom and Depot Glacier black dots top.  Purple arrow indicates area of melting where snowpack has been lost. Yellow arrow a bedrock ridge on east side of Mondor Glacier.


Hallo Glacier Retreat, Katmai Alaska

Landsat images of Hallo Glacier in 1985 and 2015 indicating the 1985 terminus position red arrows and yellow dots indicate 2015/2016 terminus location.  Purple dots show the snowline

Hallo Glacier is one of the larger glaciers in Katmai National Park draining east from Mount Steller and ending in an expanding proglacial lake east of Hallo Bay.  Hallo Bay is well known as a good location for brown bear watching (NPS).  Arendt and Larsen (2012) assess the glacier changes in Alaska National Parks they provide a map of the change in glacier extent from 1956-2009, Figure 7.  This indicates a significant retreat but it is not quantified. They further note a 15% decrease in areal extent of Katmai Region glaciers from 1956-2009.  Giffen et al (2015) indicate the glacier retreated 900 m from 1951-1987 and then advanced 150 by 2000. Here we utilize Landsat imagery to examine retreat from 1985 to July 2016 to examine the glaciers response.

In 1985 the glacier terminated just off the western shore of a small island in the lake.  The terminus front in the lake measured 3000 m in length.  The snowline averaged 1050 m across the glacier. By 1995 little retreat had occurred, the snowline was averaged 1050 m. In 2000 the glacier terminus had changed little from 1985.  The average snowline was at 1100 m. In 2015 the terminus had retreated 600 m from the island and 800 m along the northern shore of the lake.  The snowline is at 2000 m.  In 2016 the snowline is averages 1150 m , the highest observed. The terminus front in the lake remains 3000 m long.  The rate of retreat increased after 2000, and the glacier is poised for additional retreat. A 2013 Google Earth image illustrates that the lower 3.5 km of the glacier has a low slope and limited crevassing, except for minor crevassing along southern calving front.  This indicates the lake is likely to expand at least to this point.  Further that the glacier is poised for continued significant retreat and lake expansion.  The retreat is less than, but similar to that of nearby  FourPeaked  and  Spotted Glacier.


1995 Landsat image of Hallo Glacier indicating the 1985 terminus position red arrows.  Purple dots show the snowline

2000 Landsat image of Hallo Glacier indicating the 1985 terminus position red arrows and yellow dots indicate 2015/2016 terminus location.  Purple dots show the snowline

2016 Landsat image of Hallo Glacier indicating the 1985 terminus position red arrows.  Purple dots show the snowline.

2013 Google Earth image of Hallo Glacier, note low uncrevassed terminus tongue in lower 3.5 km.


Bridge Glacier Terminus Collapse, BC, 4 km retreat 1985-2016

Bridge Glacier comparison in 1985 and 2016 Landsat Images.  Red arrow is the 1985 terminus, yellow arrow the 2016 terminus and purple arrows indicate locations where tributaries have separated between the two dates. 

Bridge Glacier is an 17 km long outlet glacier of the Lillooet Icefield in British Columbia. The glacier ends in a rapidly expanding glacial lake and had an observed retreat rate of 30 m per year from 1981-2005 by Allen and Smith (2007). They examined the dendrolchronology of Holocene advances of the glacier and found up to 2005 a 3.3 kilometer advance from the primary terminal moraine band, with the most extensive advances being early in the Little Ice Age.  Chernos (2016)  indicates that the glacier in 2013 is approaching the upglacier end of the lake, which will lead to reduced retreat rates.  Here we compare Landsat imagery from 1985 to 2016 to determine response.

In 1985 the proglacial lake was 2.5 km long and 3.5 km upglacier of the terminus a major tributary joins.  The transient snow line is 2100 m. By 1993 the glacier has retreated 200-300 m and the snowline was at 2150 m.  By 2004 the terminus in a Google Earth image the terminus had retreated 1100 m since 1985.  By 2004 the tributary from the north has separated from the north side of the glacier.There are also some evident areas where the proglacial lake is visible up to 800 m upglacier of the terminus.  This suggests imminent collapse of this section of the terminus, which is afloat.  Matt Chernos researching this glacier documents this well with images.  Chernos (2016) observed that calving due to greater water depth and terminus buoyancy was key to retreat, but that most volume loss stemmed from melting.   In 2016 the terminus has retreated beyond the former junction of the Bridge Glacier and the northern tributary.  The glacier terminus is now within 500 m of a slope increase, likely marking the end of the developing lake basin. The total retreat in 31 years has been 4.1 km, this is a rate of 130 m/year, much faster than before. The 3 km retreat from 2004 to 2016 indicates a retreat of 250 m/year.  The separation of the three tributaries, purple arrows are not impacted by calving and indicate melting alone is sufficient to drive significant retreat.  The enhanced melt is also the cause of the high snowlines,, in 2016 the snowline is at 2150 m. The retreat is faster than nearby Klippi and Jacobsen Glacier, but both of those are also retreating fast.

This continued retreat and area loss will lead to glacier runoff decline in summer. This is crucial to the large Bridge River Hydro complex. This complex managed by BC Hydro can produce 490 MW of power, which is 6-8% of Province demand. Stahl et al (2008) note in their modeling study of the glacier that ,”The model results revealed that Bridge Glacier is significantly out of equilibrium with the current climate, and even when a continuation of current climate is assumed, the glacier decreases in area by 20% over the next 50 to100 years. This retreat is accompanied by a similar decreasein summer streamflow.”   Lillooet News (2016) notes that BC Hydro has commissioned research on the glacier to investigate impact on runoff tiiming. This parallels our findings on the Skykomish River in the North Cascades, Washington Pelto (2011).  The change in timing and the hydropower also impact salmon with late summer runs of chinook and fall coho runs.

Bridge Glacier comparison in 1993 Landsat Image.  Red arrow is the 1985 terminus, yellow arrow the 2016 terminus.

2005 Google Earth image of Bridge Glacier, note tributary separation from the north.

Closeup of terminus indicating exposures of proglacial lake upglacier of the terminus.Bridge Glacier Retreat Acceleration, BC, Canada