
Samudra Tupa Glacier is one of the largest in the Chenab Basin, India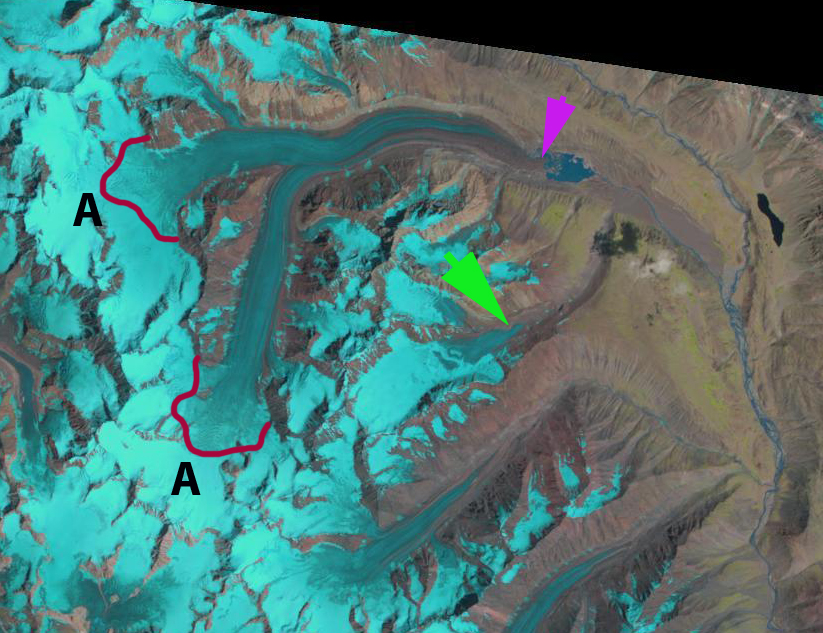 . Pink arrow indicates the terminus in a glacier lake and A mark the accumulation zone with the red line indicating the equilibrium line in 1998. In a glacier inventory in the basin by Kulkarni et al (2007) the 466 glaciers in the basin were observed to have lost 21% of their total area from 1962 to 2001. This program coordinated by the Space Applications Centre of the Indian Space Research Organization, has combined field observations of the glacier with remote sensing to observe the changes in area and length of the glaciers, immediately below is a 2006 picture of the glacier terminus and proglacial lake from Kulkarni.
  . The terminus ends in an expanding proglacial lake. The lower glacier is heavily debris covered, has a low slope and is essentially stagnant. These factors will lead to continued retreat. In this post we use 1998, 2002 and 2011 Landsat imagery to examine the terminus of this glacier. The glacier terminates at 4225 meters, the snowline in 1998 is 5200 meters and 2002 is 5300 meters, neither of the images is at the end of the ablation season. An ELA of 5200-5300 meters leaves an accumulation area insufficient to maintain the current glacier size. In 1970 the ELA was at 4900 meters Kulkarni et al (2007) .
 A close up view of the termini of Samudra Tupa-pink arrow and a nearby unnamed glacier-green arrow indicate the changes in 1998, 2002 and 2011 in that order. The green arrow points not to the terminus but to a prominent knob near the end of the glacier in each image, it is the control point. The last two images illustrate the changes from 2002 to 2011 in an image overlay. The last image is the 2011 termini of Samudra Tupa Glacier from (Kulkarni, 2009). The retreat is noted by Kulkarni, 2009 as 13 meters/year during the study period. From 2002 to 2011 the glacier retreated nearly 200 m, closer to 20 meters/year. The retreat of this glacier is less than that of other large glaciers nearby Sara Umaga and Gangotri. The loss in glaciated area in the basin of 21% is also similar to other areas in the Altai, Tibet, Nepal Himalaya, Khumbu Nepal and Tien Shan.

Author: mspelto
Professor of Environmental Science at Nichols College in Massachusetts since 1989. Glaciologist directing the North Cascade Glacier Climate Project since 1984. This project monitors the mass balance and behavior of more glaciers than any other in North America
Speel Glacier Retreat, Coast Range Alaska
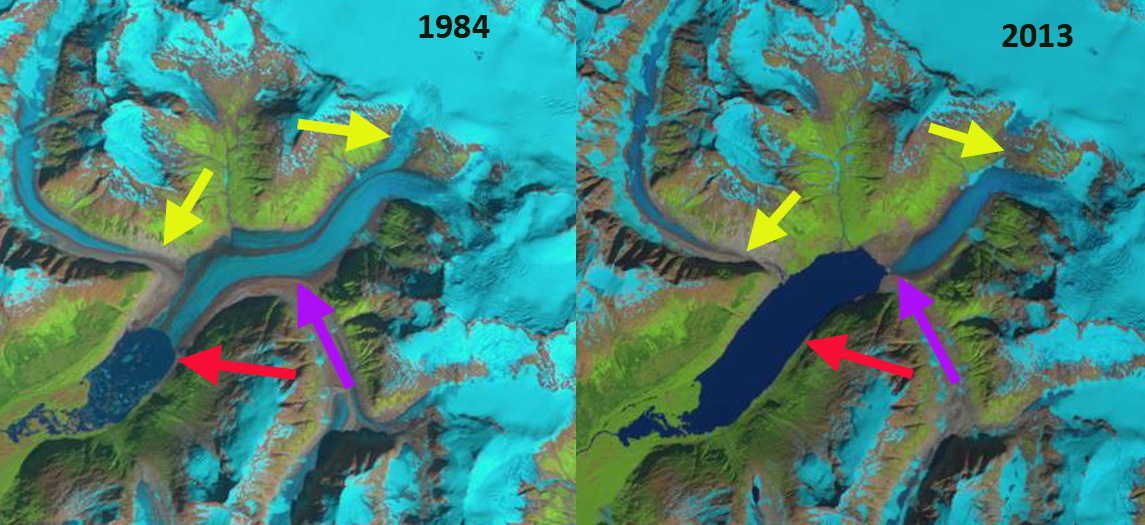
Speel Glacier a 3.2 km retreat from 1984-2013, lake expansion and tributary separation.
In 1984 I had a good chance to observe Speel Glacier while flying into Juneau, AK to work with the Juneau Icefield Research Program on the Juneau Icefield. Speel Glacier is south of the Taku Inelt east of Juneau, Alaska. Unlike the map on my lap, there was now a big lake at the terminus of the glacier. This post examines the retreat of this remote glacier and the expansion of the unnamed lake at its terminus. In 1948 Speel Glacier ended at the head of a braided outwash plain, generated by the Speel River. Upglacier in 1948 there was a lake impounded by the glacier, Speel Lake. 
 Today Speel Lake is gone and a much larger proglacial lake exists. The lower part of the glacier was heavily debris covered and stagnant in 1948. By 1968 the glacier had retreated 1 km just to the edge of the current lake. In 1984 the lake was 2.2 km long. In the images below Landsat 1984, Google Earth 2003, Landsat 2006, Landsat 2009 and 2013, the primary accumulation zone is marked ACC, secondary accumulation areas are indicated by black arrows, the 1984 terminus pink arrow, 2003 terminus blue arrow, 2006 terminus green arrow, 2009 terminus yellow. In the 1984 Landsat image the glacier had retreated 2 kilometers from the 1968 position and was fed by a shared accumulation zone with the Wright Glacier-black arrows in addition to the main accumulation area of the glacier above the main icefall on the east side of the glacier. By 2003 the glacier had retreated 1.9 km to where the lake bends east, and the main tributary from the north separated from the glacier. In the 2006 imagery the glacier has retreated an additional 1.8 km. The connections with the Wright Glacier accumulation area had been lost. The tributary from the north that has its own accumulation zone was now completely separated. The glacier was then solely dependent on a single accumulation zone, ACC. In 2009 the glacier had retreated 200 meters from 2006. By 2013 the glacier had retreated from the lake entirely a 6 km retreat since 1948. This should lead to a reduced rate of retreat.
The rapid retreat of this glacier has reduced its area at low elevation considerably. This is improving the glaciers accumulation area ratio, to be in equilibrium the glacier needs at least 60% of its area to be in the accumulation zone, in this region Pelto (1987) noted that no glaciers in the region were advancing that did not have an accumulation area ration above 67. In 1984 the accumulation area ratio was 48. In 2006 the AAR is 54, ablation area is being lost faster than accumulation area. The icefall marks the boundary between the ablation zone and the accumulation zone.The retreat of this glacier fits the pattern of other glaciers in the region Eagle, Field, Gilkey, and Chickamin. Today the lake averages nearly 1.5 km in width and is over 5 km long. 
Landsat imagery 1984

2003 Google Earth image
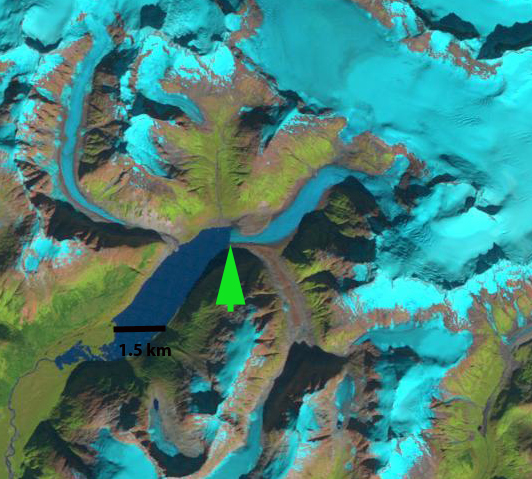
Landsat imagery 2006

2009 Landsat image

2013 Landsat image- Red arrow is 1984 terminus, purple the 2013 terminus and yellow arrows detached former tributaries.
Severnaya Zemlya Glacier Change, Russia
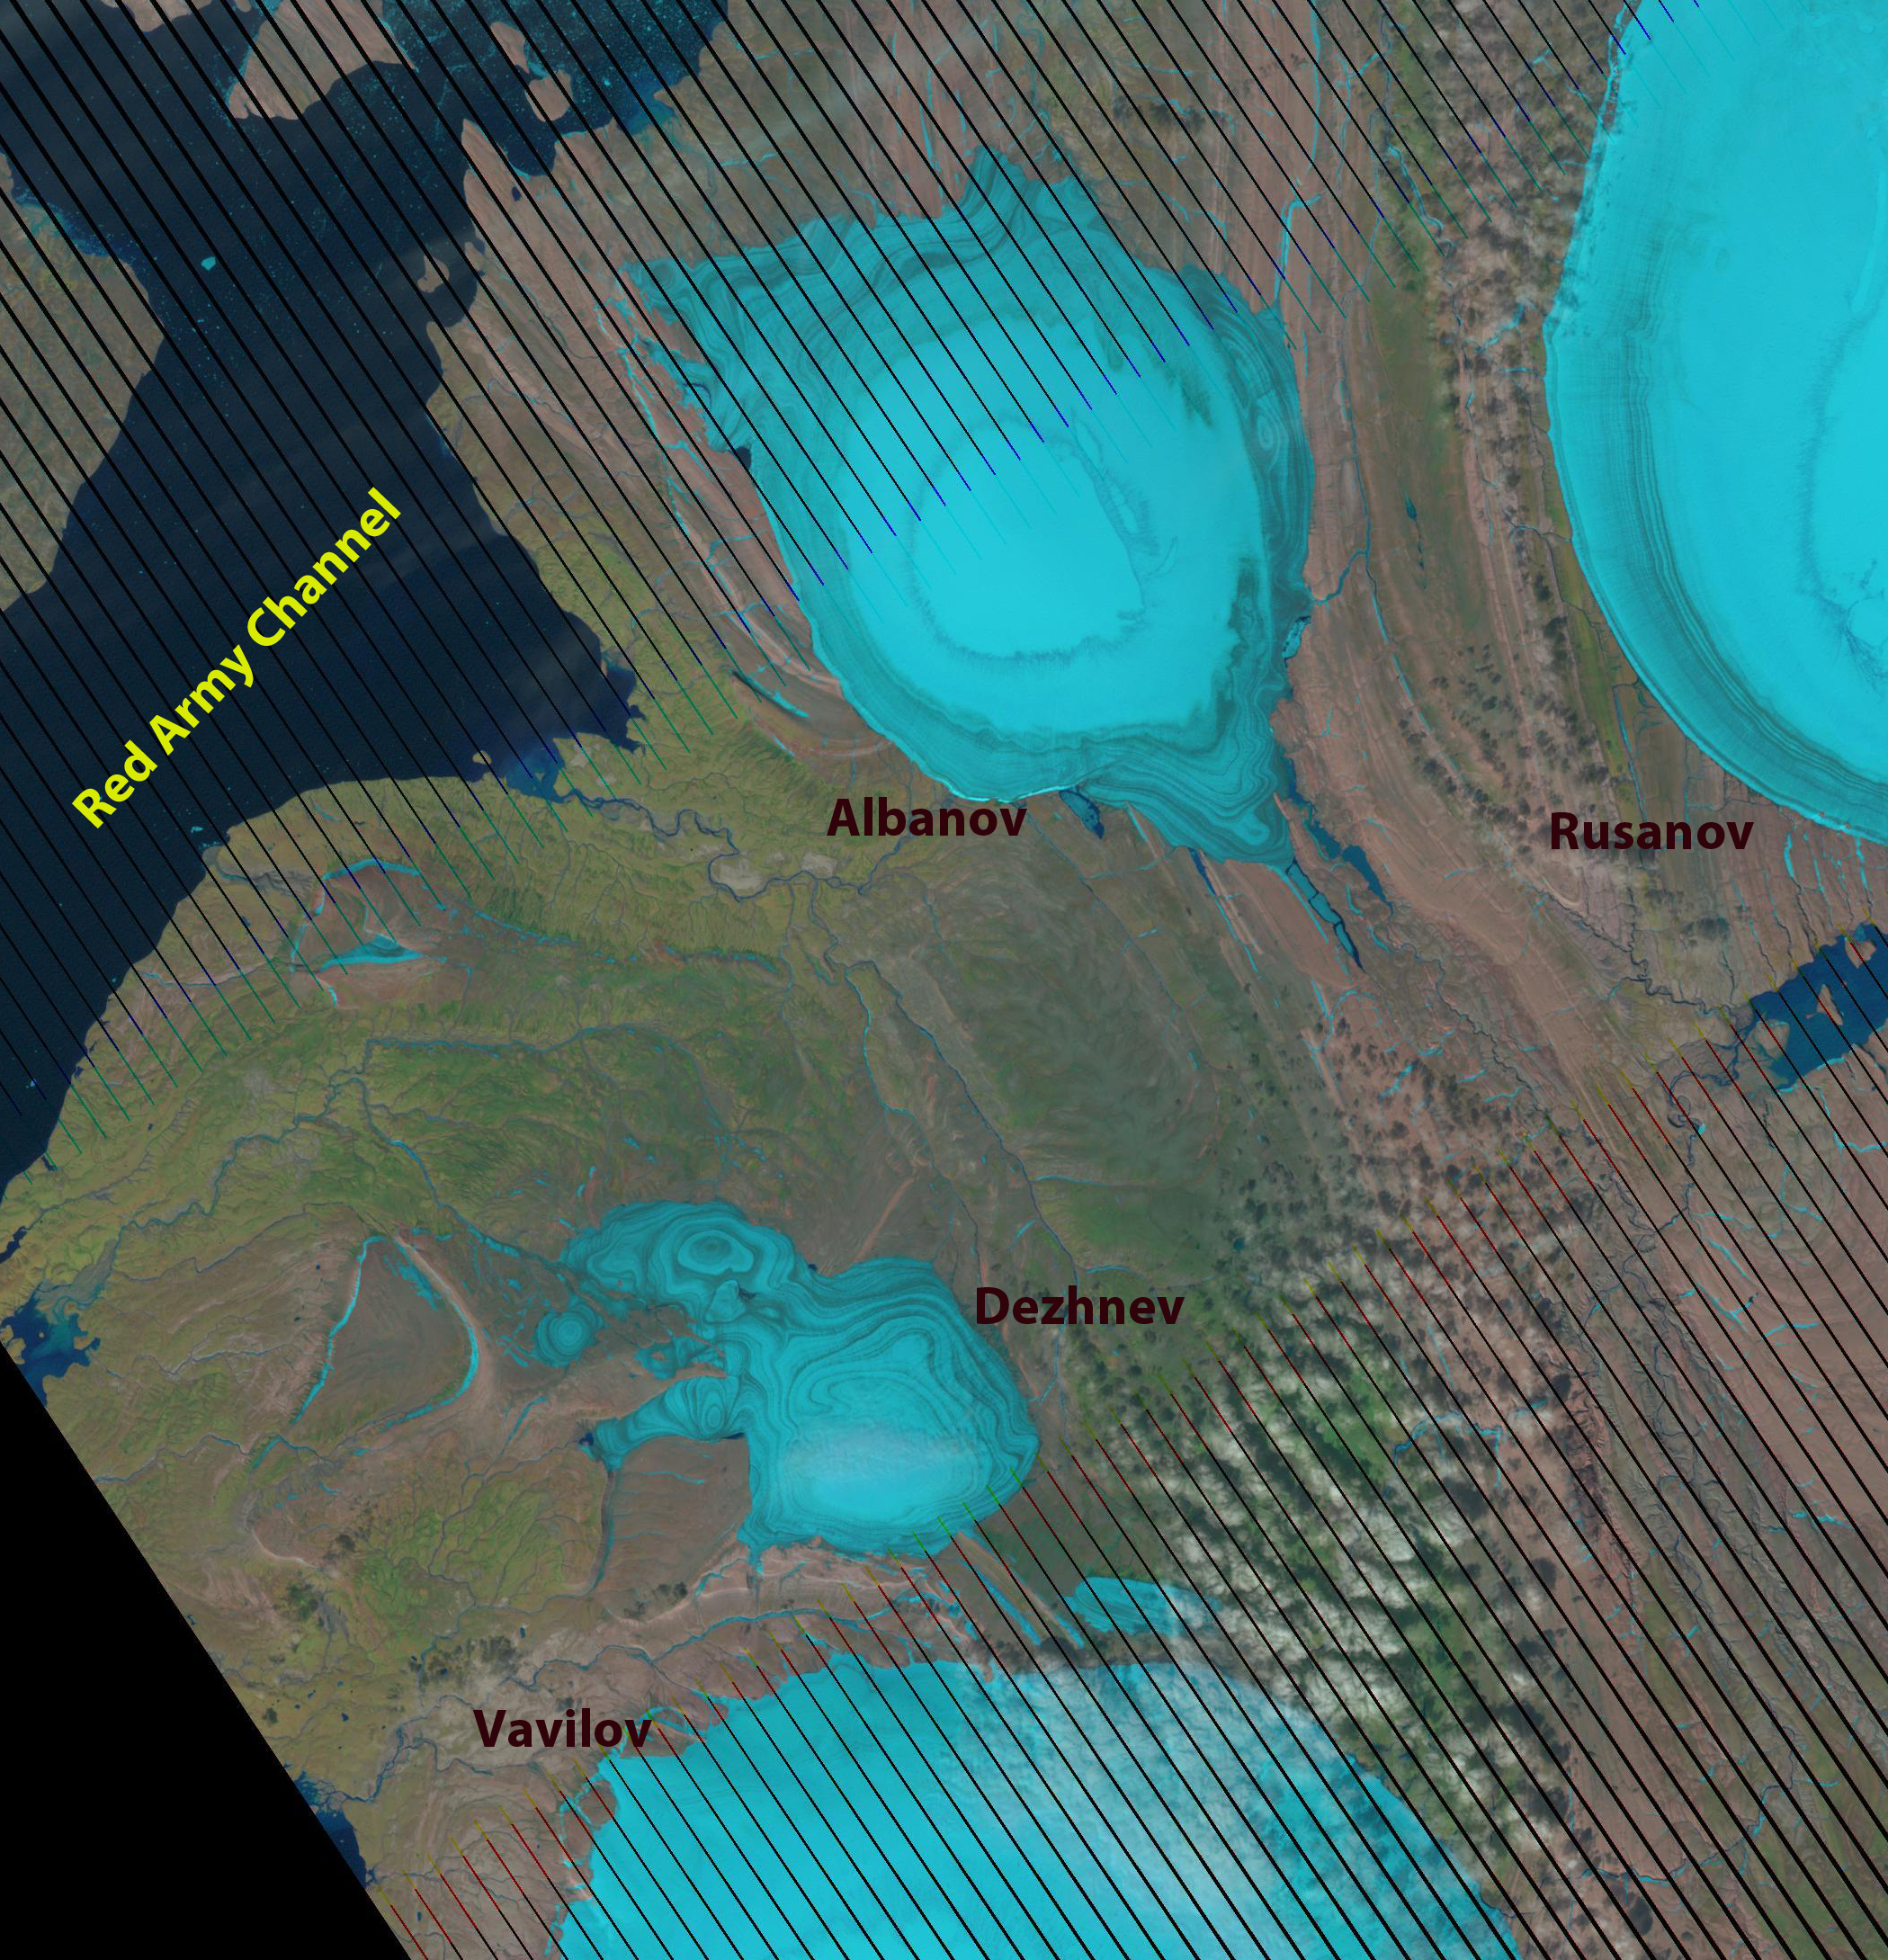
Severnaya Zemlya is a Russian Island group at the transition from the Kara Sea to the Laptev Sea. This island group is 50 % ice covered, with 18,000 square kilometers of glacier cover. Severnaya Zemlya has been the focus of a detailed remote sensing based study of glacier change by Sharov et al (2010) They observed a mean change in Severnaya glacier thickness of -7.8 m since the 1980’s. The annual rate of ice loss is 4.8 km³/a, a strongly negative net balance. They found that most ice caps have steepened since 1980, Albanov and Dezhnev have both gotten thicker in the center while retreating at the margin. Imagery from this region is scant. The glacier in this region have both small snow accumulation and small melting. Overall most of the ice caps are composed of superimposed ice, that is snow that melted and then refroze before exiting the ice cap.
  Several ice cores have been drilled through the ice sheets identifying the rate of accumulation through time Klementyev et al (1991) and Kotlyakov et al (2004) the last 8000 years on Vavilov Ice Cap.
First on the Dezhnev Ice Cap thickening of up to 13 m was noted at the top of the ice cap by Sharov et al (2010). In this post we examine a 2000 (top) and a 2010 (middle) Landsat image that shows all of the Dezhnev Ice Cap with the Albanov Ice Cap being half obscured by clouds in the 2000 image. In the Landsat comparison pay particular attention to the region just beneath Points A-C. At Point A we see an expansion of the small proglacial lake. At Point B and C we see exposure of new bare ground as areas of thin ice near the periphery of the ice cap have been lost. In 2010 there is no snow remaining on Dezhnev, however, this by itself does not indicate there was no accumulation that year, as superimposed formation cannot be distinguished from areas of bare ice that experienced ablation in the image. For Albanov Ice Cap there is a modest retreat from the locations noted with arrows that are linear-low spots often sometimes filled with meltwater. In the bottom image a closeup of Dezhneve, an arrow indicates a low spot in the midst of the ice cap that will be prone to melt out. In this image a melt pond has developed there. 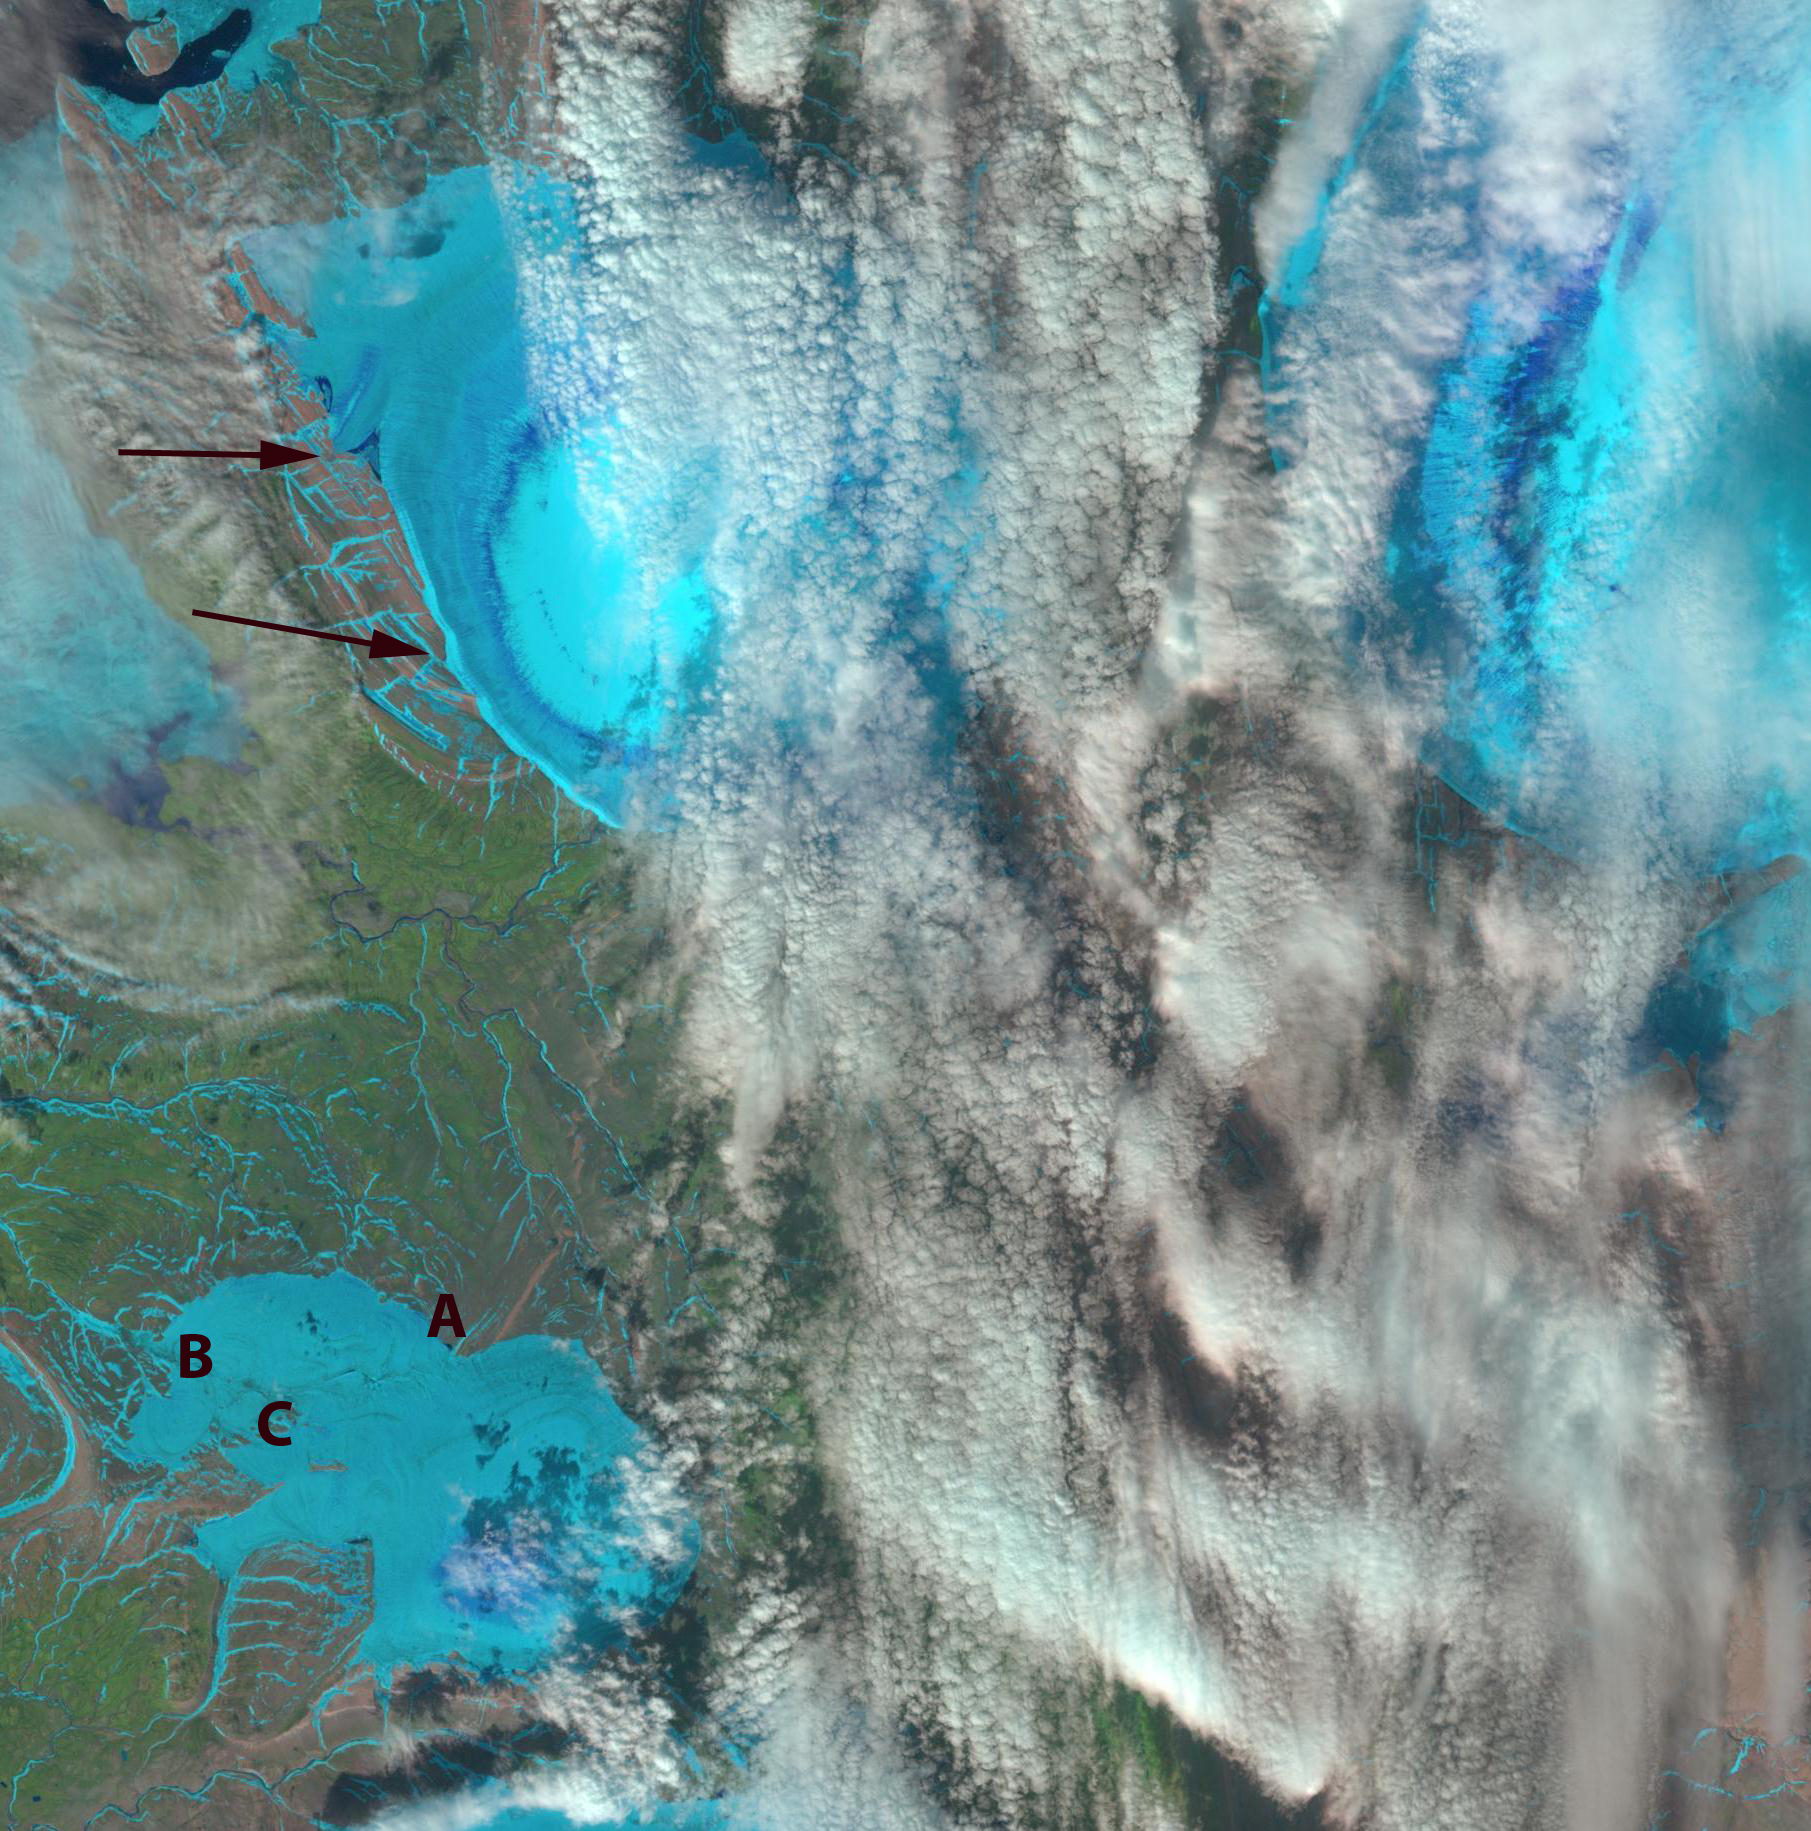

Icemantle Glacier Retreat, British Columbia
Icemantle Glacier is on the north side of Greenmantle Peak just north of Snowcap lake in southern British Columbia, viewed from the northeast in the Google Earth image below. 
 It is not an often visited area and the glacier has not been previously assessed for its response to climate change. Other glaciers in the area have, the outlet glaciers of Snowcap Icefield lost 17% of there area in from 1987-2007. Stave Glacier has retreated 840 meters from 1977-2002 (Koch et al, 2009) . Just to the north Freshfield Glacier has retreated since. The glacier was mapped in 1987 and at that time no lake existed close to the terminus. The lake in 2006 is 500 meters across. The glacier is 160 meters from the lake, indicating a retreat of 660 meters from 1987, blue line. In a 2009 Ikonos image the glacier has retreated an additional 75 meters. The last image in the sequence indicates the 1987 terminus position blue and 2009 terminus red.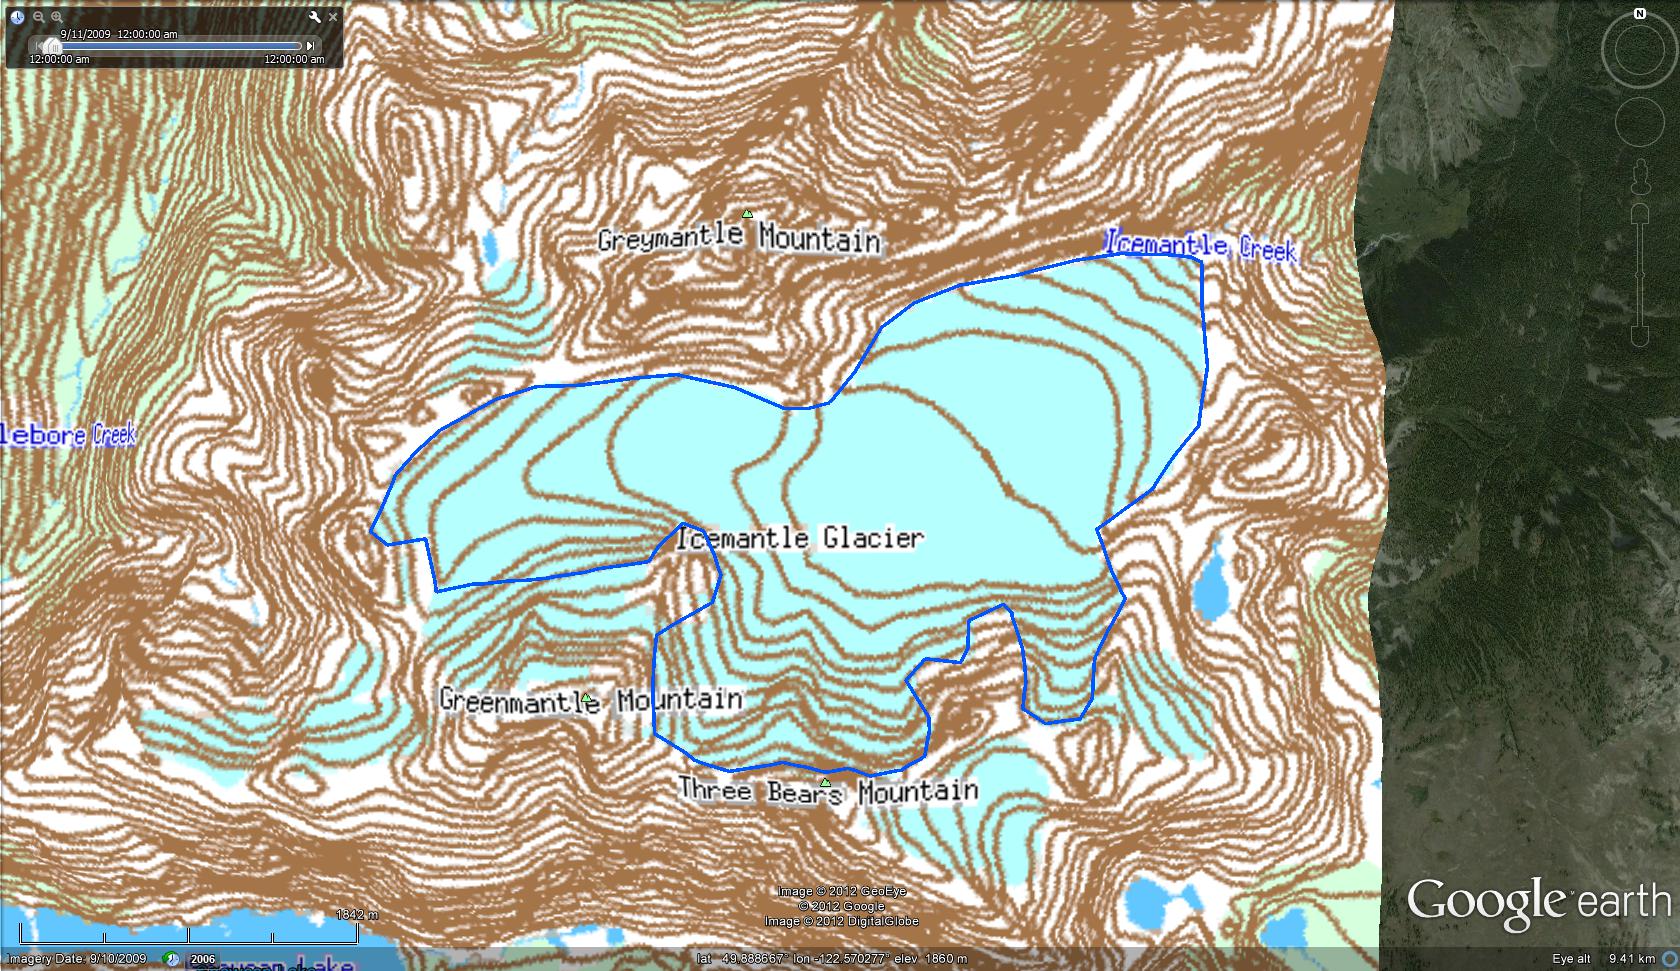
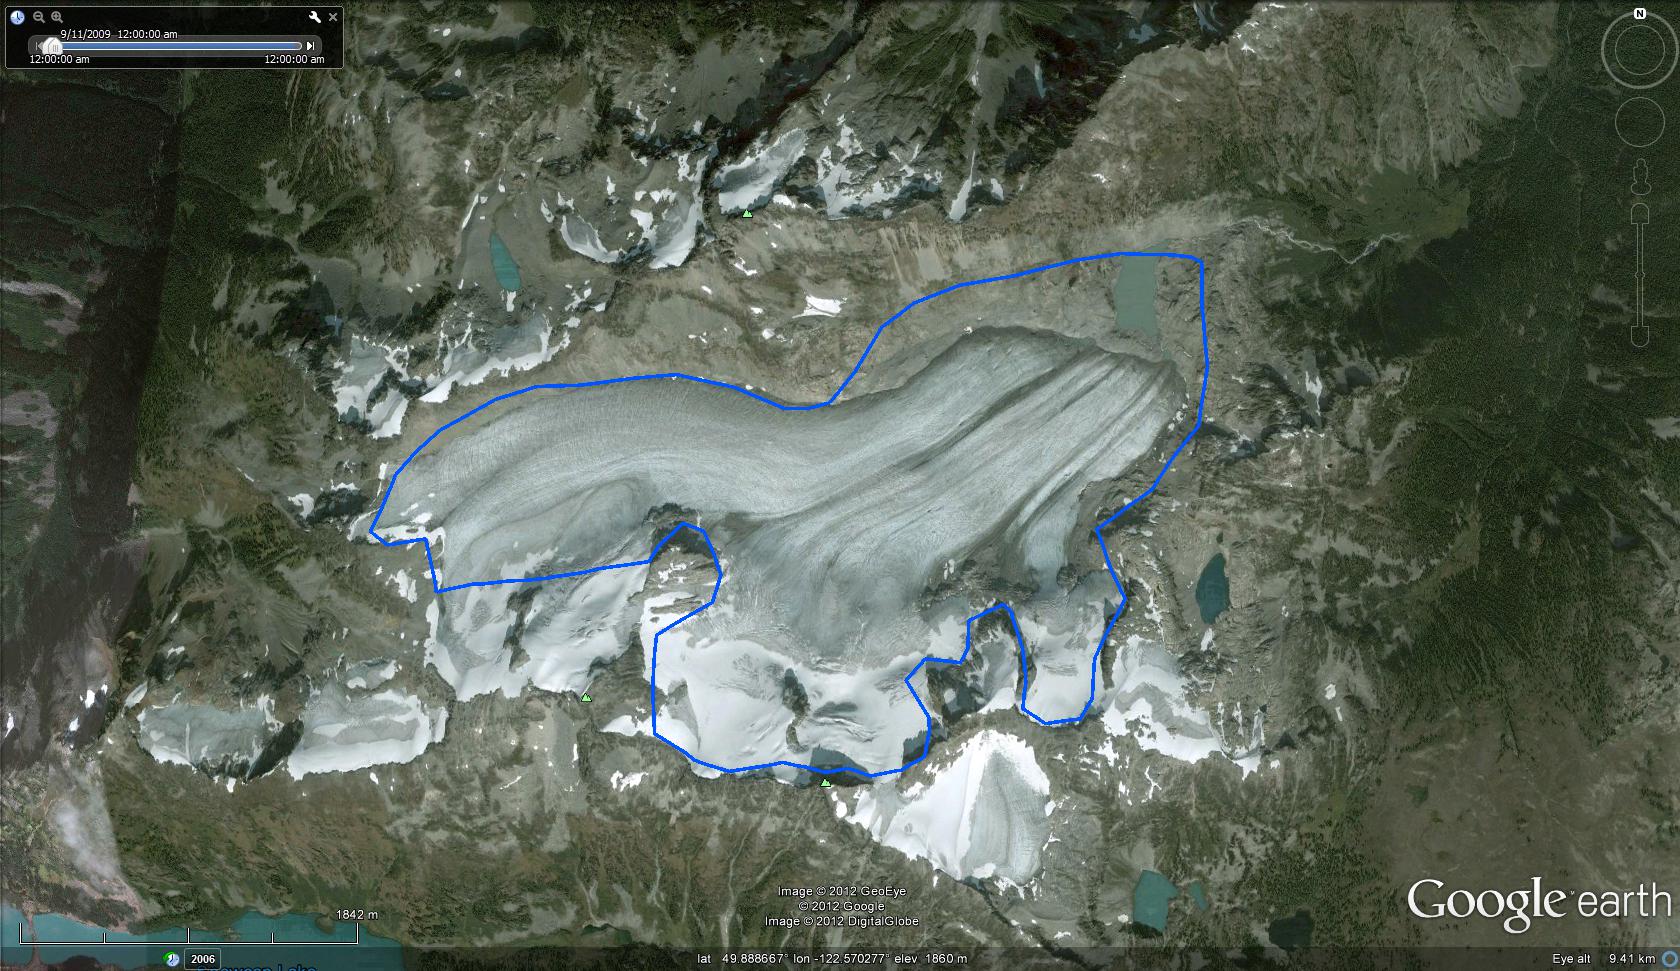
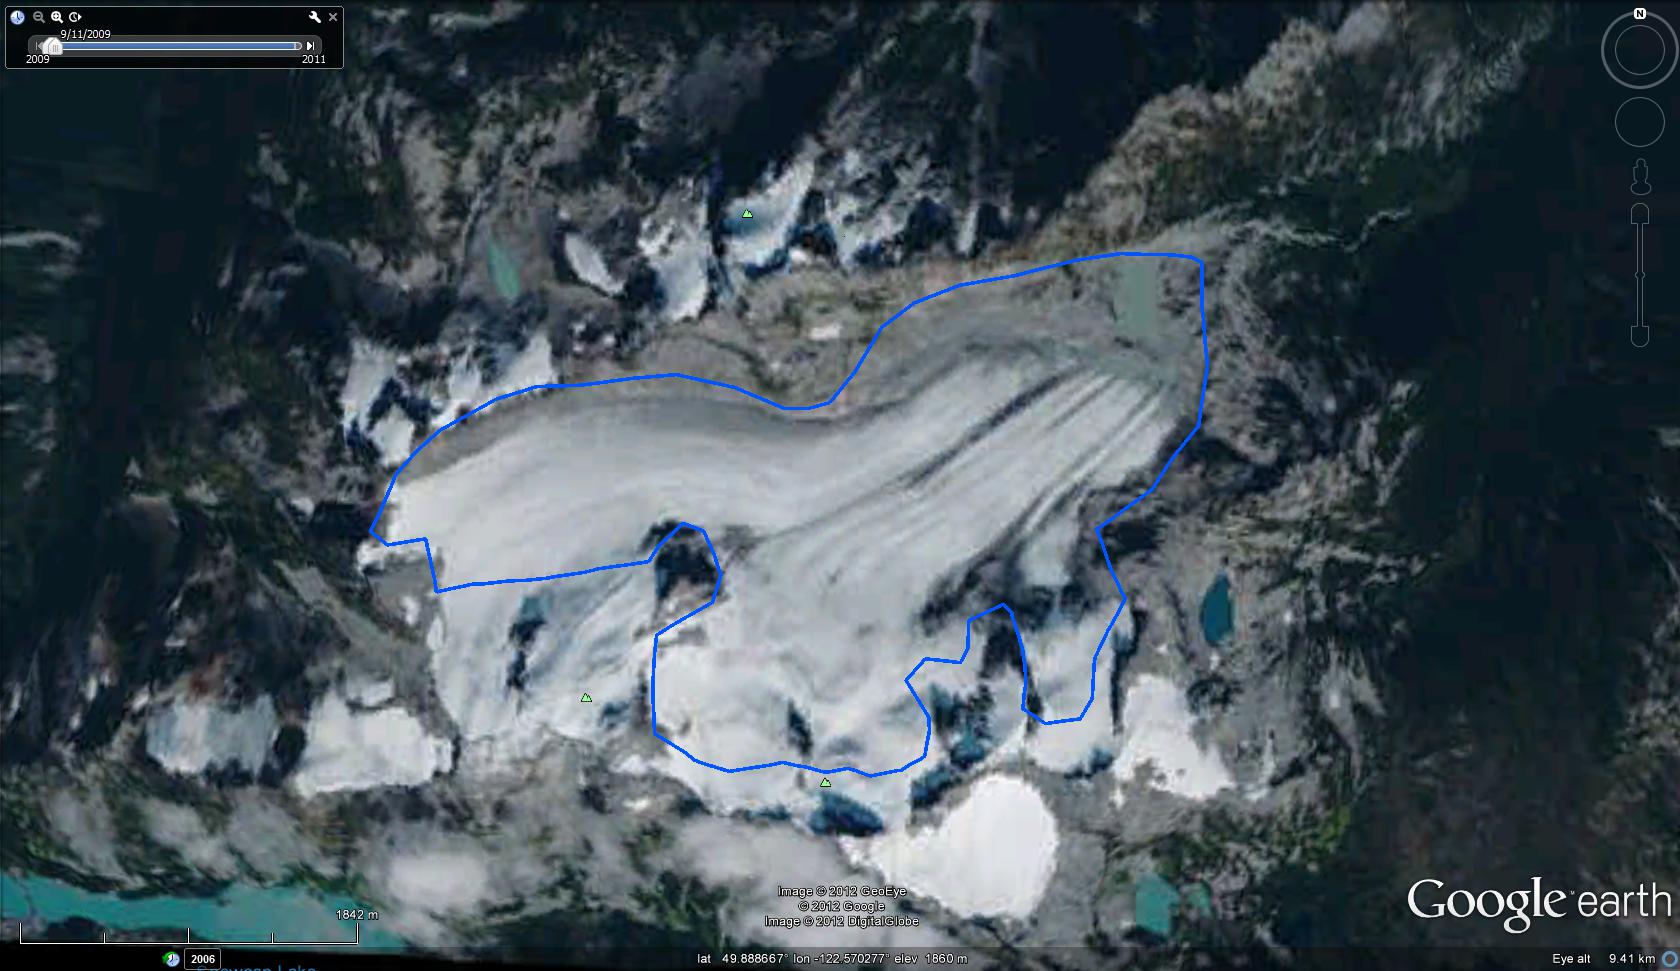
 The snowline on the glacier has been at least as high as 2000 meters in 2003-2006 and 2009. This leaves less than 35% of the glacier in the accumulation zone consistently. This is insufficient to maintain equilibrium and will drive continued retreat. The ongoing retreat is also evident from the thin nature of the current terminus, a small lake is also forming at the current terminus.
Hallstatter Glacier, Austria retreat
The Hallstatter Glacier (also sometimes called Dachstein Glacier along with the Gosau Glacier) is on the north slope of Dachstein an area of heavy recreational use. The result is good photographic records of glaciers change. This record combined with a recent cooperative project between University of Innsbruck, Blue Sky Weather Analysis and Energie AG Upper Austria provides a good snapshot of glacier change in northern Austria. The glacier begins at 2800 meters and descends to 2200 meters, image below from University of Innsbruck.  This project has compiled the annual terminus change of the glacier from 1950-2007, in the image below. The retreat from 1950-1975 averaged 8 meters per year. A period of minor readvance from 1977-1991 occurred, followed by increasingly rapid retreat from 1992-2007 averaging over 10 meters per year in the last decade. Total retreat has been 350 meters from 1950-2007.
  Over the last century the change is chronicled in the two images, 1900 and 2007, from the Dachstein Project and the 2009 margin is traced in a Google Earth Image, blue line. This project was undertaken because of the importance of the glacier runoff to hydropower production along the Traun and Gosau Watersheds in particular. The change in terminus via mapping from 1969-2002 is evident in the Innsbruck image (2002), the Google Earth image is from 2009. There is thinning particularly of the width of the two main terminus tongues.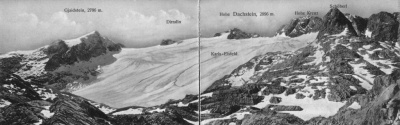

 The mass balance of the glacier has been measured since 2007, every year has had negative balances. In 2011 the snowline was again high, snowpack very limited at the end of the melt season which persisted into October. An Ikonos image from October 2, 2011 indicates that 30-35 percent of the glacier is snowcovered, this is the AAR and it needs to be at 60 for equilibrium.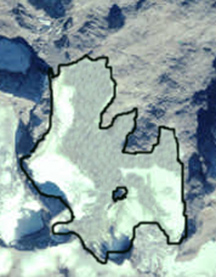
Index of posts 2009-Jan. 2012
Glacier Index List
Below is a list of the individual glacier posts examining our warming climates impact on each glacier. This represents the first 2.5 years of posts, 166 total posts, 152 different glaciers. I have worked directly on 39. The others are prompted by fine research that I had come across, cited in each post or inquiries from readers and other scientists. I then look at additional often more recent imagery to expand on that research. The imagery comes either from MODIS, Landsat, Geoeye or Google Earth.
North America
Columbia Glacier, Washington
Lyman Glacier, Washington
Boulder Glacier, Washington
Ptarmigan Ridge Glacier, Washington
Anderson Glacier, Washington
Milk Lake Glacier, Washington
Paradise Glacier, Washington
Easton Glacier, Washington
Redoubt Glacier, Washington
Honeycomb Glacier, Washington
Vista Glacier, Washington
Rainbow Glacier, Washington
Daniels Glacier, Washington
Colonial Glacier, Washington
Quien Sabe Glacier, Washington
Mazama Glacier
Fairchild Glacier, Washington
White Glacier, Washington
Banded Glacier, Washington
Borealis Glacier, Washington
Hinman Glacier, Washington
Lower Curtis Glacier
McAllister Glacier, Washington
Lewis Glacier, Washington
Kennedy Glacier, Washington
Bridge Glacier, British Columbia
Washmawapta Glacier, British Columbia
Bubagoo Glacier, British Columbia
Hector Glacier, Alberta
Helm Glacier, British Columbia
Melbern Glacier
Warren Glacier, British Columbia
Castle Creek Glacier, British Columbia
Hoboe Glacier, British Columbia
Tulsequah Glacier, British Columbia
Decker and Spearhead Glacier, British Columbia
Columbia Glacier, British Columbia
Freshfield Glacier, British Columbia
Apex Glacier, British Columbia
Devon Ice Cap, Nunavut
Penny ice Cap, Nunavut
Minor Glacier, Wyoming
Grasshopper Glacier, Wyoming
Fremont Glacier, Wyoming
Grasshopper Glacier, Montana
Harrison Glacier, Montana
Sperry Glacier, Montana
Hopper Glacier, Montana
Old Sun Glacier, Montana
Yakutat Glacier, Alaska
Grand Plateau Glacier, Alaska
Eagle Glacier, Alaska
Gilkey Glacier , Alaska
Gilkey Glacier ogives, Alaska
Lemon Creek Glacier, Alaska
Taku Glacier, Alaska
Bear Lake Glacier, Alaska
Chickamin Glacier, Alaska
Okpilak Glacier, Alaska
Sawyer Glacier, Alaska
Antler Glacier, Alaska
Field Glacier
East Taklanika Glacier, Alaska
Brady Glacier, Alaska
Brady Glacier Retreat lake expansion 2004-2010
Thiel Glacier, Alaska
New Zealand
Tasman Glacier
Murchison Glacier
Donne Glacier
Mueller Glacier, NZ
Gunn Glacier, NZ
Africa
Rwenzori Glaciers
Himalaya
Zemu Glacier, Sikkim
Theri Kang Glacier, Bhutan
Zemestan Glacier, Afghanistan
Khumbu Glacier, Nepal
Imja Glacier, Nepal
Gangotri Glacier, India
Milam Glacier, India
Satopanth Glacier, India
Kali Gandaki Headwaters, Nepal
Menlung Glacier, Tibet
Boshula Glaciers, Tibet
Urumquihe Glacier, Tibet
Sara Umaga Glacier, India
Dzhungharia Alatau, Kazakhstan
Petrov Glacier,Kyrgyzstan
Hailuogou Glacier, China
Europe
Mer de Glace, France
Dargentiere Glacier, France
Grand Motte and Pramort Glacier Tignes Ski area, France
Saint Sorlin, France
Sommelier Glacier
Obeeraar Glacier, Austria
Ochsentaler Glacier, Austria
Pitzal Glacier, Austria
Dosde Glacier, Italy
Maladeta Glacier, Spain
Presena Glacier, Italy
Triftgletscher, Switzerland
Rotmoosferner, Austria
Stubai Glacier, Austria
Ried Glacier, Switzerland
Cavagnoli Glacier, Switzerland
Chuebodengletscher and Ghiacciaio-del-Pizzo-Rotondo
Forni Glacier, Italy
Peridido Glacier, Spain
Engabreen, Norway
Midtdalsbreen, Norway
TungnaarJokull, Iceland
Gigjokull, Iceland
Skeidararjokull, Iceland
Kotlujokull, Iceland
Lednik Fytnargin, Russia
Rembesdalsskaka, Norway
Hansbreen, Svalbard
Nannbreen, Svalbard
Hornbreen and Hambergbreen, Svalbard
Roze and Sredniy Glacier, Novaya Zemyla
Irik Glacier, Mount Elbrus, Russia
Greenland
Mittivakkat Glacier
Ryder Glacier
Humboldt Glacier
Petermann Glacier
Kuussuup Sermia
Jakobshavn Isbrae
Umiamako Glacier
Kong Oscar, Glacier
Upernavik Glacier
Sortebrae Glacier, Greenland
South America
Colonia Glacier, Chile
Artesonraju Glacier, Peru
Nef Glacier, Chile
Tyndall Glacier, Chile
Zongo Glacier, Bolivia
Llaca Glacier, Peru
Seco Glacier, Argentina
Onelli Glacier, Argentina
Quelccaya Ice Cap, Peru
Glacier Gualas, Chile
Antarctica and Circum Antarctic Islands
Pine Island Glacier
Fleming Glacier
Hariot Glacier
Amsler Island
Stephenson Glacier, Heard Island
Neumayer, South Georgia
Ampere, Kerguelen
Nordenskjold Coast, Antarctic Peninsula
Prospect Glacier, Antarctic Peninsula
Ross Hindle Glacier, South Georgia
Vega Island Ice Cap
North Cascade Glacier Climate Project Reports
Forecasting Glacier Survival
North Cascade Glacier Mass Balance 2010
Columbia Glacier Annual Time Lapse
North Cascade Glacier Climate Project 2009 field season
28th Field Season Schedule of the North Cascade Glacier Climate Project
North Cascade Glacier Climate Project 2011 Field Season
BAMS 2010
2011 Glacier mass balance North Cascades and Juneau Icefield
Taku Glacier TSL Paper
Northwest Vega Island, Antarctica Glacier Retreat
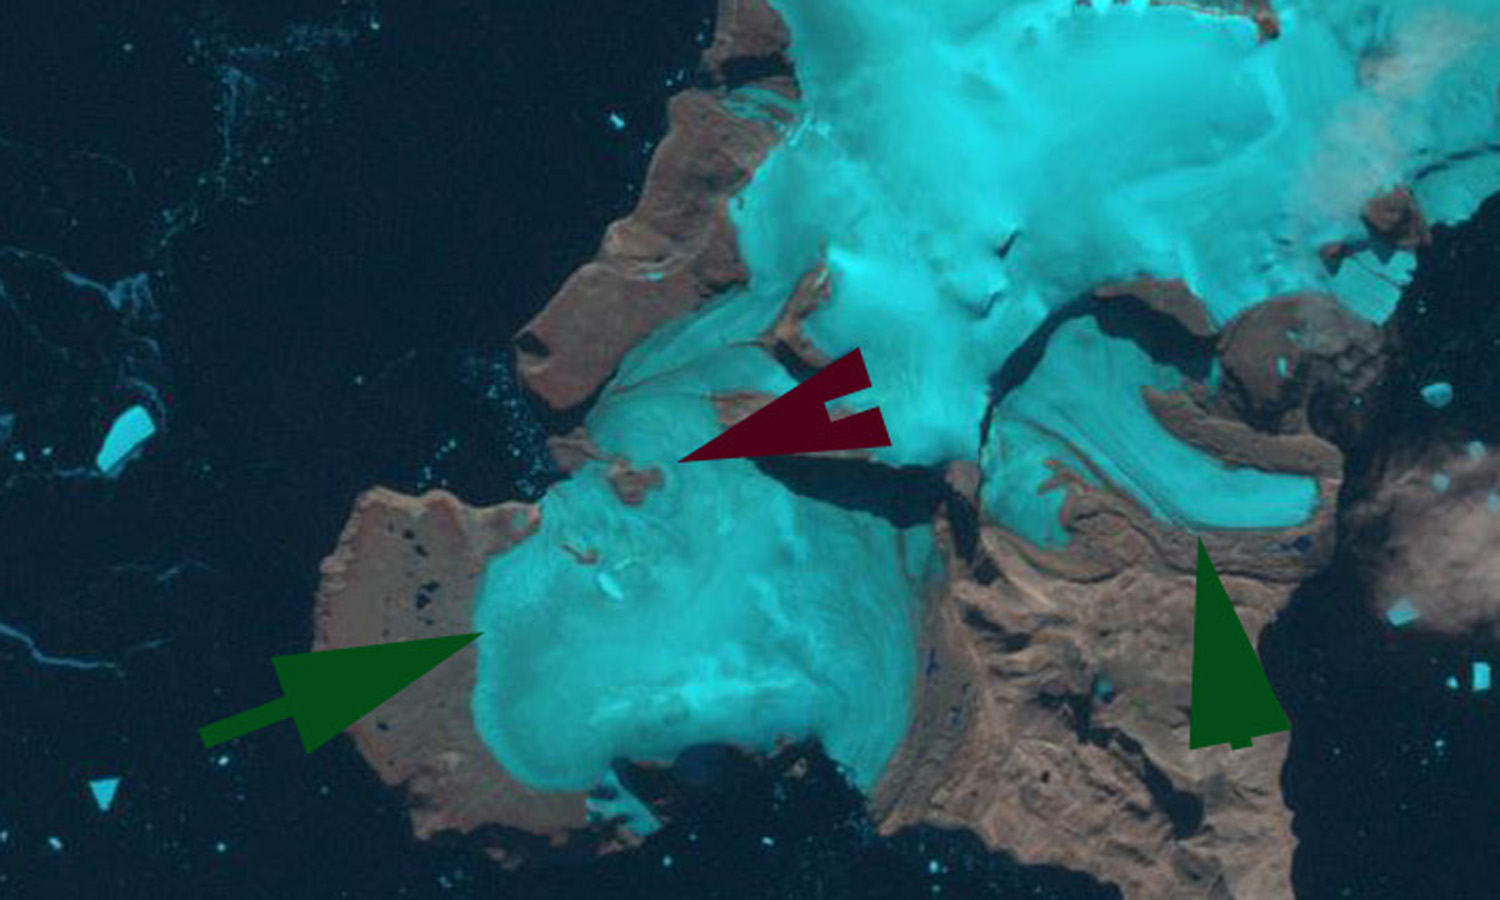
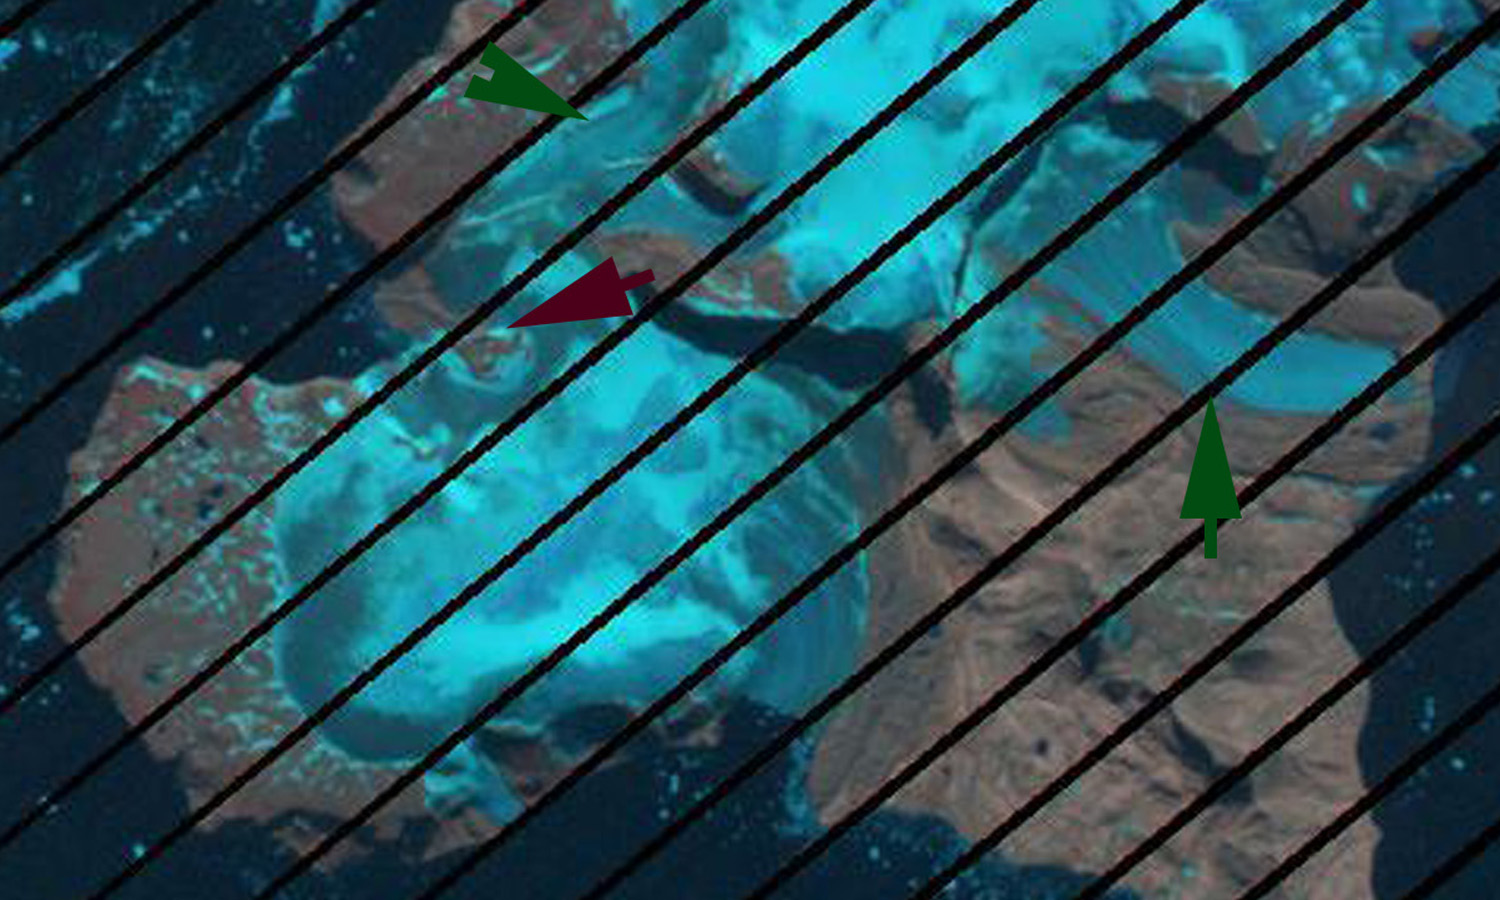
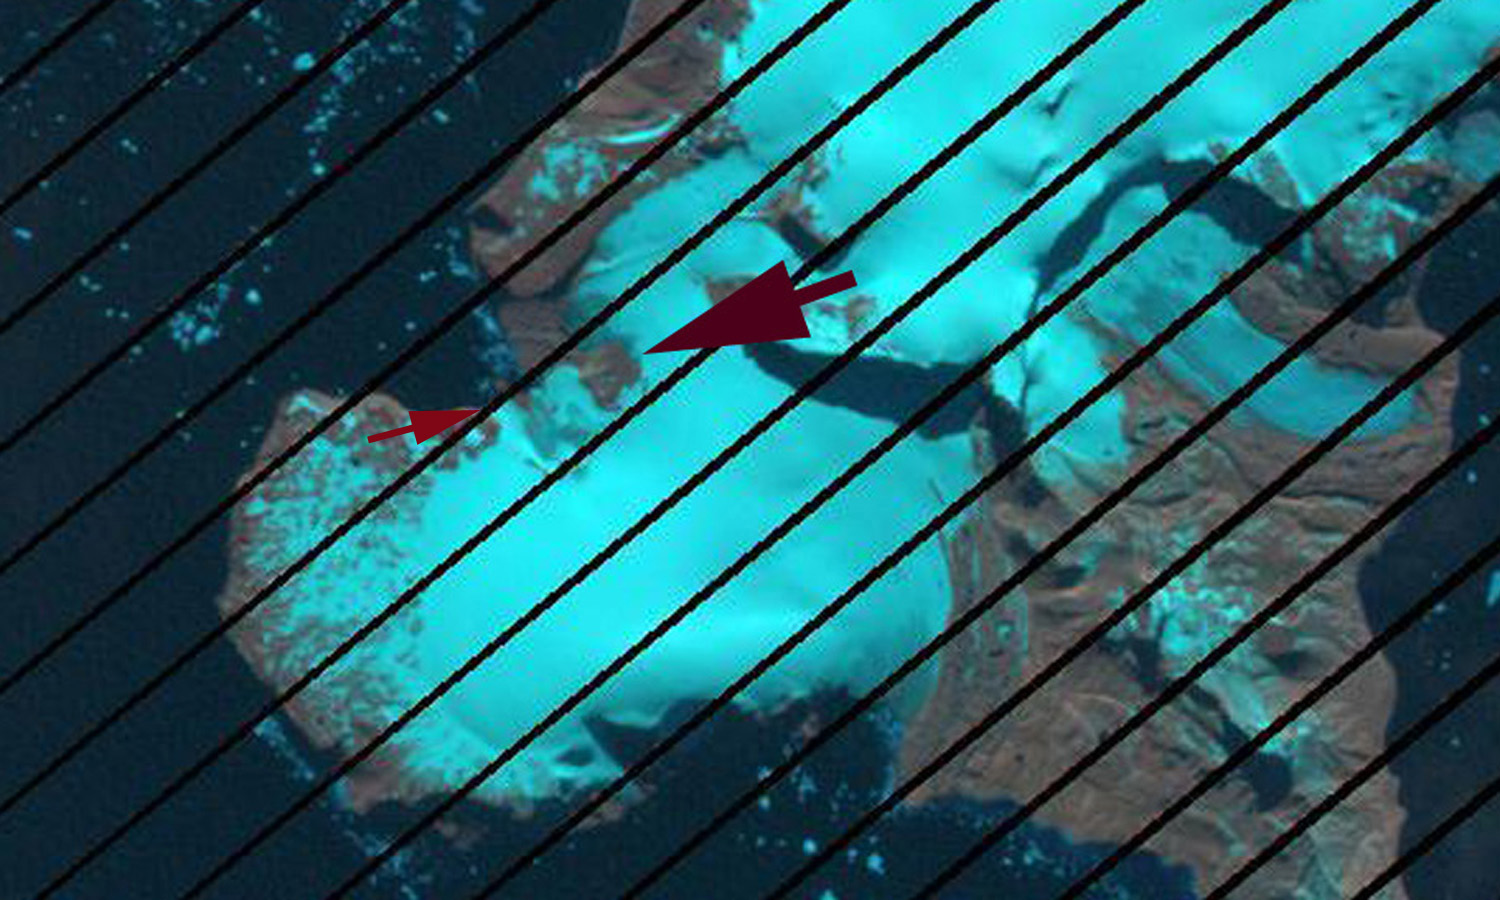
Vega Island is a heavily glaciated island just east of the northernmost section of the Antarctic Peninsula (map from Davies et al, 2010 Aberystwyth University). The mass balance of Bahia Del Diablo Glacier (BDD green arrow) located on this island has been monitored by an Argentina research group since 1999/2000 (Skvarca et al 2004 and WGMS, 2010). Nine of these ten years have seen negative mass balances, four substantial losses. The glacier begins at 600 meters and ends at 100 m, with an ELA of 425 meters on average, an image from Pedro Skvarca of Bahia Del Diablo indicates the ice cap nature of the glaciers on Vega Island. 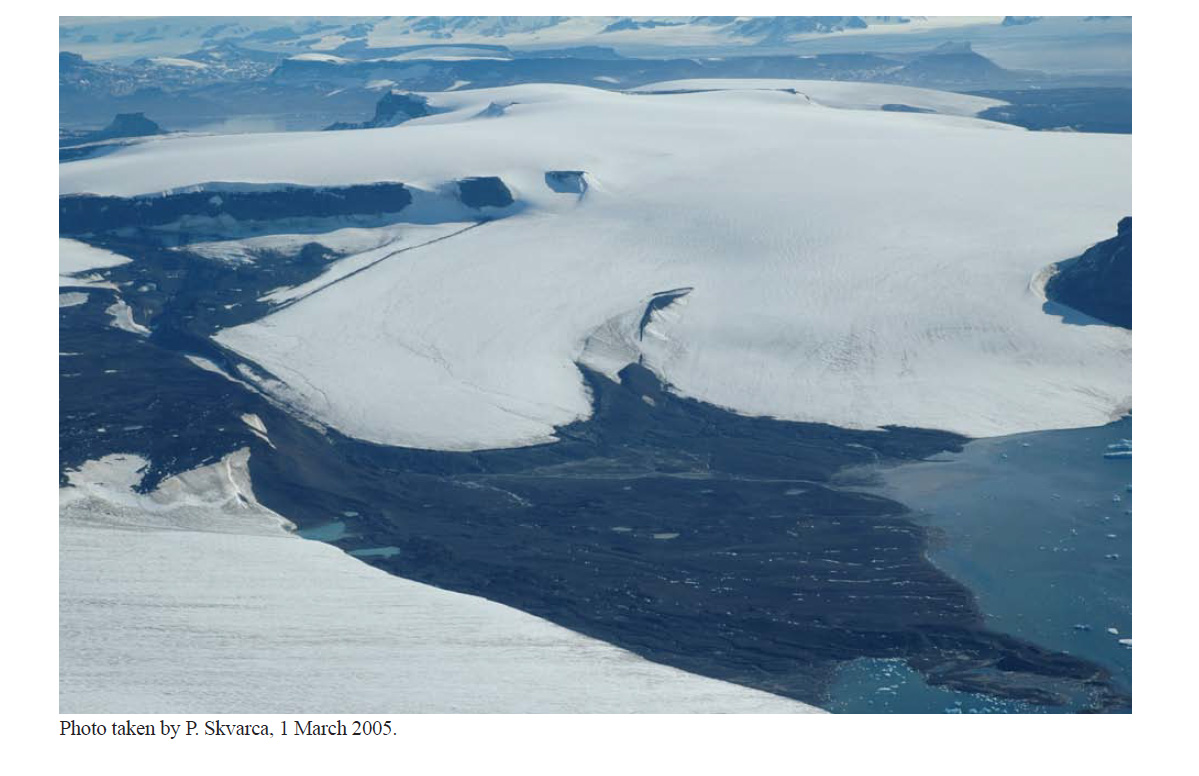 Eight kilometers west of Bahia Del Diablo is are three adjacent glaciers at the northwest corner of the island (NW: burgundy Arrow on Vega Map) that is the focus here. In the initial glacier inventory these were listed as glacier 02-04 on Vega Island (Rabassa et al, 1982) This glacier barely reaches to the ocean, but the amount of bare land exposed at the coast along the glacier front is increasing. Further during several recent years this glacier has lost all of its snowcover. This glacier has only a tiny bit of its total area above 400 meters, below the observed ELA of the last decade on Bahia del Diablo. This is an issue for a couple of adjacent glaciers as well. Note the 1999 Google Earth imagery and the Landsat imagery from 2000 that indicate the lack of snowcover, green arrows. In 1999 and 2000 the glacier reached the coast along a distance of 900 meters, red arrows in second image. Note the change in the size of the bedrock exposed near the terminus, burgundy arrow from 1999 to 2011. The glacier frontage by 2011 had been reduced to 250 meters, the bare brown red areas have nearly merged along the coast, soon this glacier will not be reaching the shoreline. The bare rock area between two lobes of the glacier has also expanded, from 1999-2011, burgundy arrows. In 2007 and 2008 there was very little if any snowpack left on this glacier by the end of the melt season. The issue for a glacier without a consistent accumulation zone, is that it will not survive (Pelto, 2010). These glaciers are more like ice caps are not thin and are not melting away quickly. The glacier volume loss is consistent with that observed all around the Antarctic Peninsula, Nordenskjold Coast

Northwest Vega Island, Antarctica Glacier Retreat
Vega Island is a heavily glaciated island just east of the northernmost section of the Antarctic Peninsula (map from Davies et al, 2010 Aberystwyth University). The mass balance of Bahia Del Diablo Glacier (BDD green arrow) located on this island has been monitored by an Argentina research group since 1999/2000 (Skvarca et al 2004 and WGMS, 2010). Nine of these ten years have seen negative mass balances, four substantial losses. The glacier begins at 600 meters and ends at 100 m, with an ELA of 425 meters on average, an image from Pedro Skvarca of Bahia Del Diablo indicates the ice cap nature of the glaciers on Vega Island. Eight kilometers west of Bahia Del Diablo is are three adjacent glaciers at the northwest corner of the island (NW: burgundy Arrow on Vega Map) that is the focus here. In the initial glacier inventory these were listed as glacier 02-04 on Vega Island (Rabassa et al, 1982) This glacier barely reaches to the ocean, but the amount of bare land exposed at the coast along the glacier front is increasing. Further during several recent years this glacier has lost all of its snowcover. This glacier has only a tiny bit of its total area above 400 meters, below the observed ELA of the last decade on Bahia del Diablo. This is an issue for a couple of adjacent glaciers as well. Note the 1999 Google Earth imagery and the Landsat imagery from 2000 that indicate the lack of snowcover, green arrows. In 1999 and 2000 the glacier reached the coast along a distance of 900 meters, red arrows in second image. Note the change in the size of the bedrock exposed near the terminus, burgundy arrow from 1999 to 2011. The glacier frontage by 2011 had been reduced to 250 meters, the bare brown red areas have nearly merged along the coast, soon this glacier will not be reaching the shoreline. The bare rock area between two lobes of the glacier has also expanded, from 1999-2011, burgundy arrows. In 2007 and 2008 there was very little if any snowpack left on this glacier by the end of the melt season. The issue for a glacier without a consistent accumulation zone, is that it will not survive (Pelto, 2010). These glaciers are more like ice caps are not thin and are not melting away quickly. The glacier volume loss is consistent with that observed all around the Antarctic Peninsula, Nordenskjold Coast
Sortebrae Retreat, East Greenland
The Sortebrae is a surge type tidewater calving glacier on the Geikie Peninsula of East Greenland. Surge type glaciers do not have a steady ice flow, they have non-steady ice flow where longer quiescent periods of slower flow are punctuated by short periods of faster flow. The glacier is comprised of a number of tributaries (A-D) some of which drain the main Greenland Ice Sheet (E).  Sortebrae surged in the 1950’s and 1992-95 (Jiskoot et al, 2001). A diagnostic feature of surging glaciers is the looped or distorted medial moraines (M) that results from the changing degree of contribution of the various tributaries of a surging glacier with time. Not all tributaries surge and if they do it is not necessarily synchronous
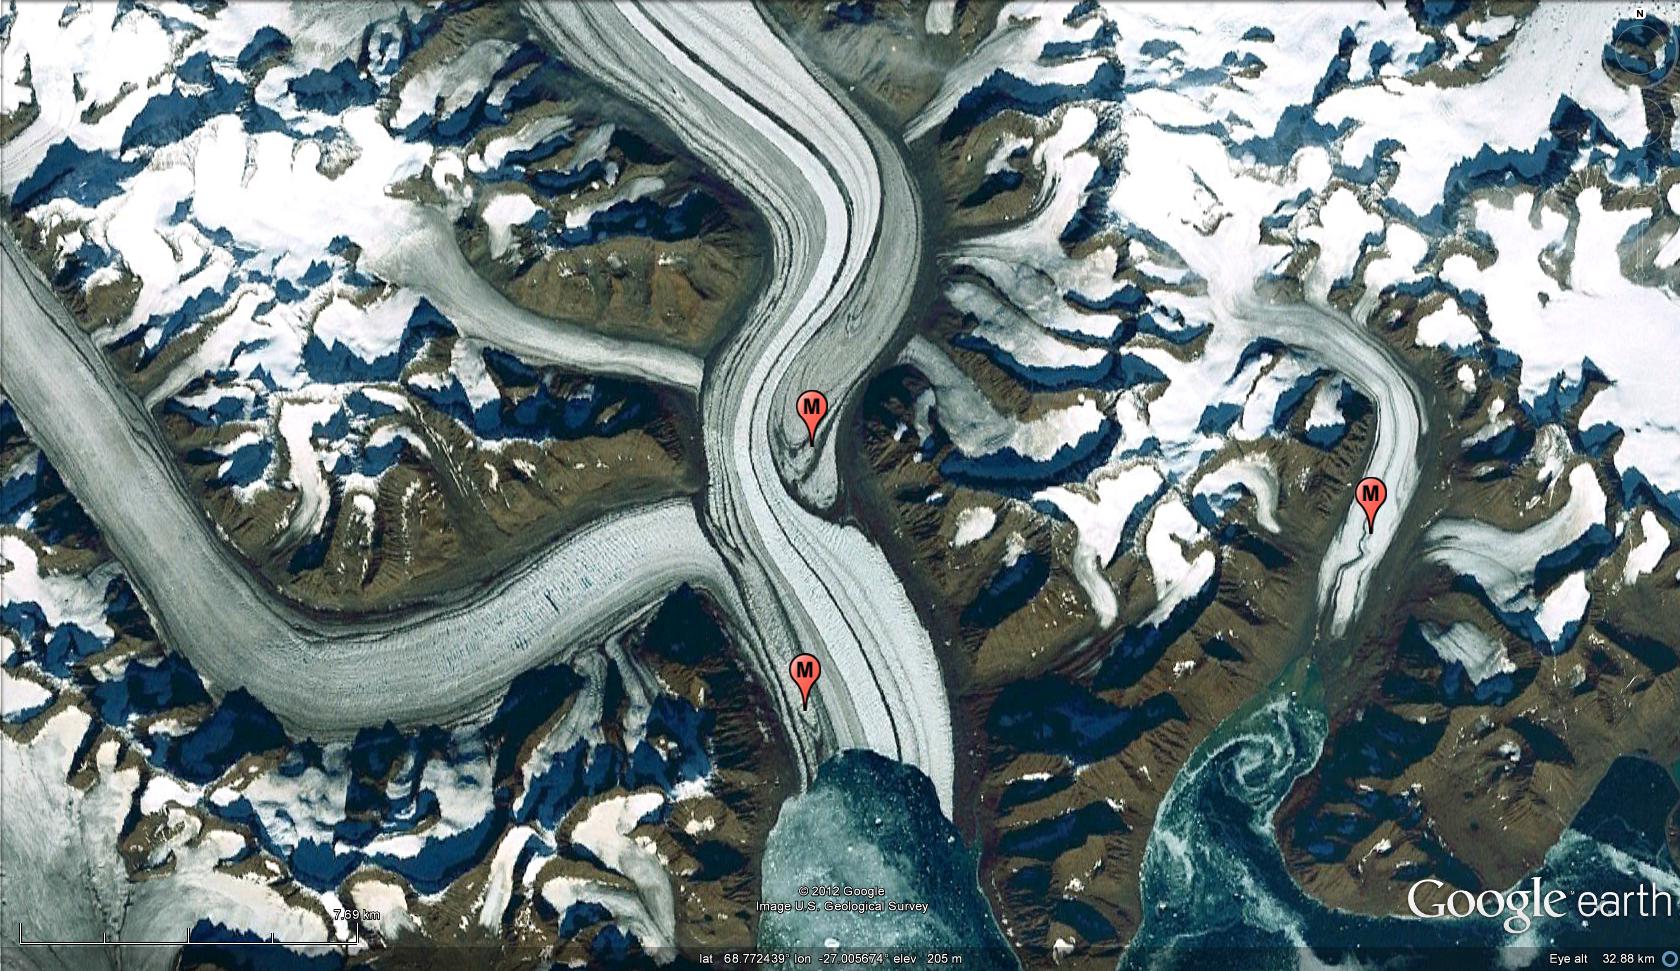 . The 1992-1995 period featured a 5 km advance, this suggests a periodicity to surging of 4–70 years (Jiskoot et al, 2001). From 2000-2005 the retreat rate was noted as 428 m/year by Jiskoot et al (2012). Comparsion of Landsat images from 2000 (green line) and 2010 (yellow line) indicate a retreat of 5 kilometers, approximately 500 meters/year. Surging glaciers are still sensitive to climate, the surge cycle is an additional factor affecting surface elevation and terminus change. In this region the recent extensive retreat of Sortebrae mirrors that of the other glaciers, Jiskoot et al (2012) identify that just one of 113 tidewater glaciers in the region advanced, and that was during a surge. Average margin retreat rate in terms of area lost increased from 2 square kilometers per year between 1980 and 2000, to 4-5 square kilometers per year from 2001 to 2005..
 Given the fact that the glacier is not due for a surge in the next couple decades, a continuation of this retreat for even one decade will lead to the separation of the terminus. With the termini entering from the southwest (red arrow) and the main termini (green arrow). The southwestern tributary does not exhibit strong surging features. It is also worth noting quite a few smaller glaciers near the coast here have very limited snowcover remaining (yellow arrow) near the end of the 2010 melt season. This is not a good sign as glacier that do not have consistent accumulation zone will not survive (Pelto, 2010). Given that 2011 also featured limited snowpack it seems to be a too frequent theme for the smaller glaciers in the region. The mass loss of smaller glacier in this region has has been particularly well observed on Mittivakkat Glacier by Mernild et al (2011).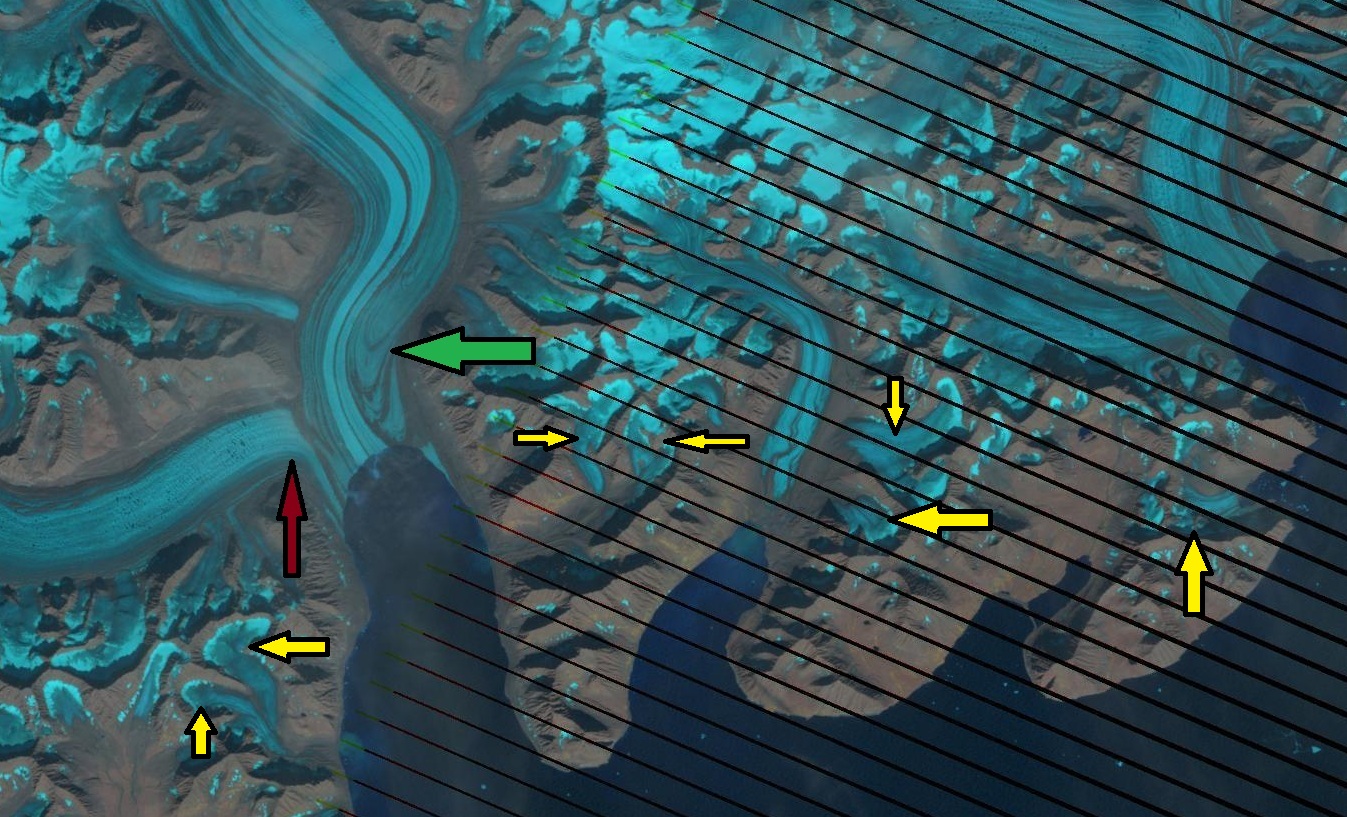
Kennedy Glacier Retreat, Glacier Peak Washington
At the turn of the century C.E. Rusk explored the glaciers around Glacier Peak that were retreating from their Little Ice Age maximum in the mid-19th century. The average retreat of Glacier Peak glaciers from the LIA to the 1958 map positions was 1640 m. From 1950-1955 Richard Hubley, University of Washington, completed the first aerial glacier surveys of North Cascade termini, noting the beginning of an advance on Glacier Peak that continued up through 1979. All ten glaciers on the slopes of Glacier Peak advanced ranged from 75 to 500 m and culminated in 1978. All 11 Glacier Peak glaciers that advanced during the 1950-1979 period emplaced identifiable maximum advance terminal moraines. A picture of the glacier from R.Luce during this advance shows a glacier with a strongly convex profile. 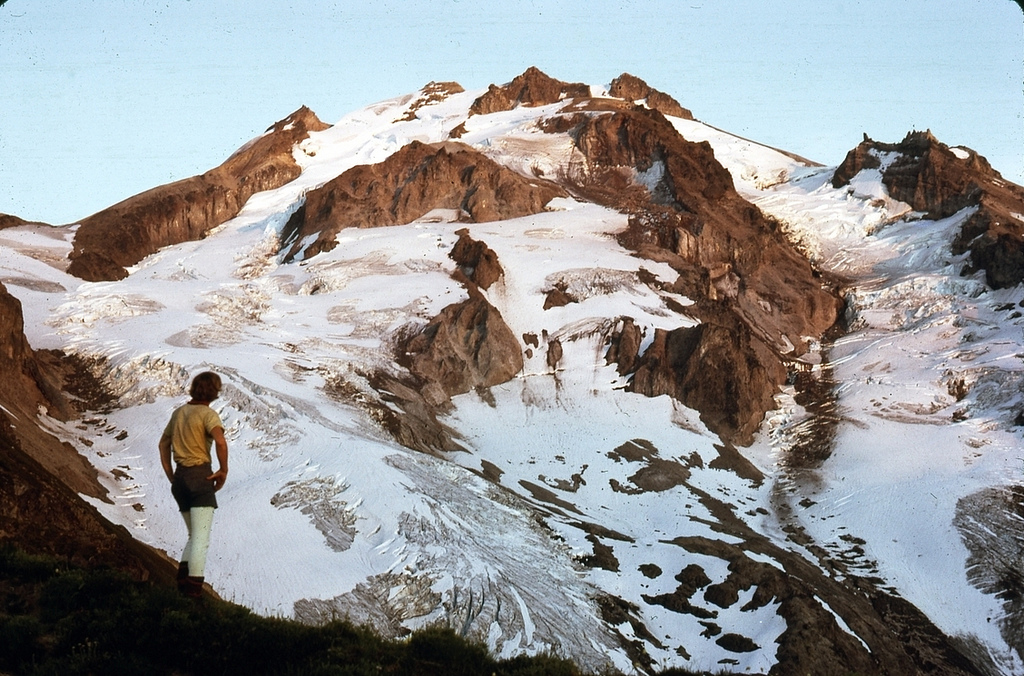 During the 1993-1997 period the North Cascade Glacier Climate Project (NCGCP) surveyed the glaciers around the peak each summer, one century after C.E. Rusk did (Pelto and Hedlund, 2001). By 1984, all the Glacier Peak glaciers were again retreating. This peak even in summer provided some tough weather, including a 1995 August snow storm.
 Two other glaciers that were a focus of this study around Glacier Peak were Milk Lake, Vista and Honeycomb Glacier.
This post focuses on Kennedy Glacier which is the main glacier draining the west side of the Peak, left glacier in image below. Kennedy and Scimitar Glacier were joined during the LIA descending the Kennedy Creek valley to an elevation of 1315 m. Retreat from the LIA maximum of 1000 m had occurred by the turn of the century. By 1946 the glacier had retreated an additional 700 m to an elevation of 1960 m. In 1952 the glacier was advancing rapidly, as indicated by the 1955 photograph from Richard Hubley of the glacier from 1955.
  This advance continued up until 1975, the terminus having extended downslope 320 m to terminate at an altitude of 1785 m. By 1984 the terminus had begun to retreat. In 1994 the terminus had retreated 95 m and by 1997 151 m. A view of the terminus in 1993 indicates an active, crevassed terminus tongue, top image. In 1994 (miidle) and 1997 (below) the terminus is a well established vegetation and sediment line marking the 1970’s advance, burgundy arrows.

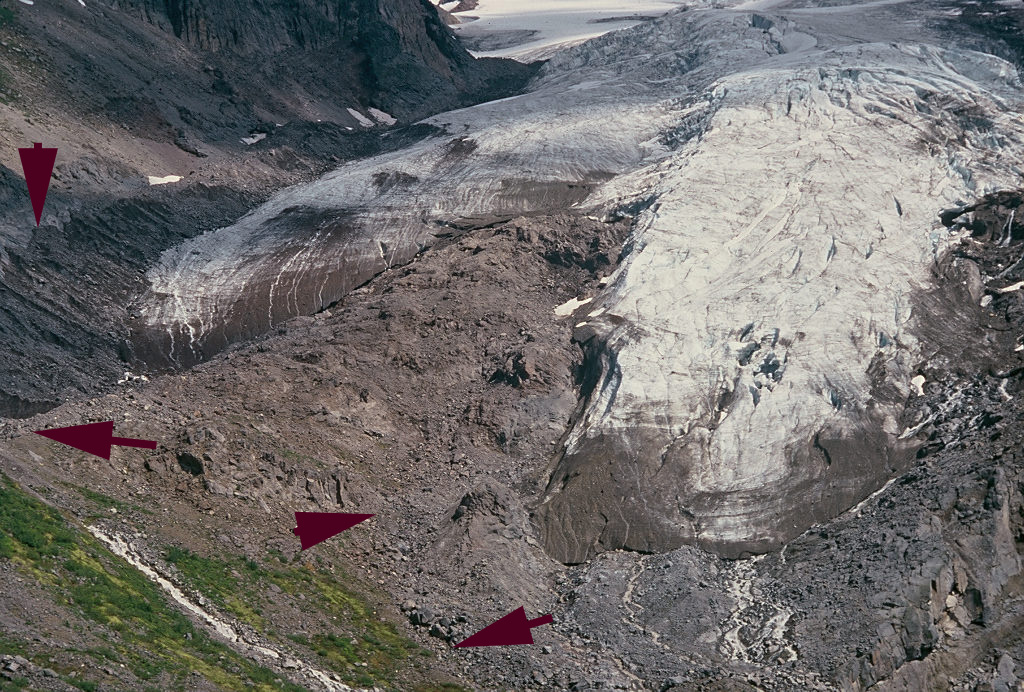 The glacier has continued to retreat, in the 2006 and 2009 Google Earth imagery the orange line is the 1978 terminus, green line 1994, blue line 2006 and red line 2009. The left hand glacier is Kennedy the right hand Scimitar.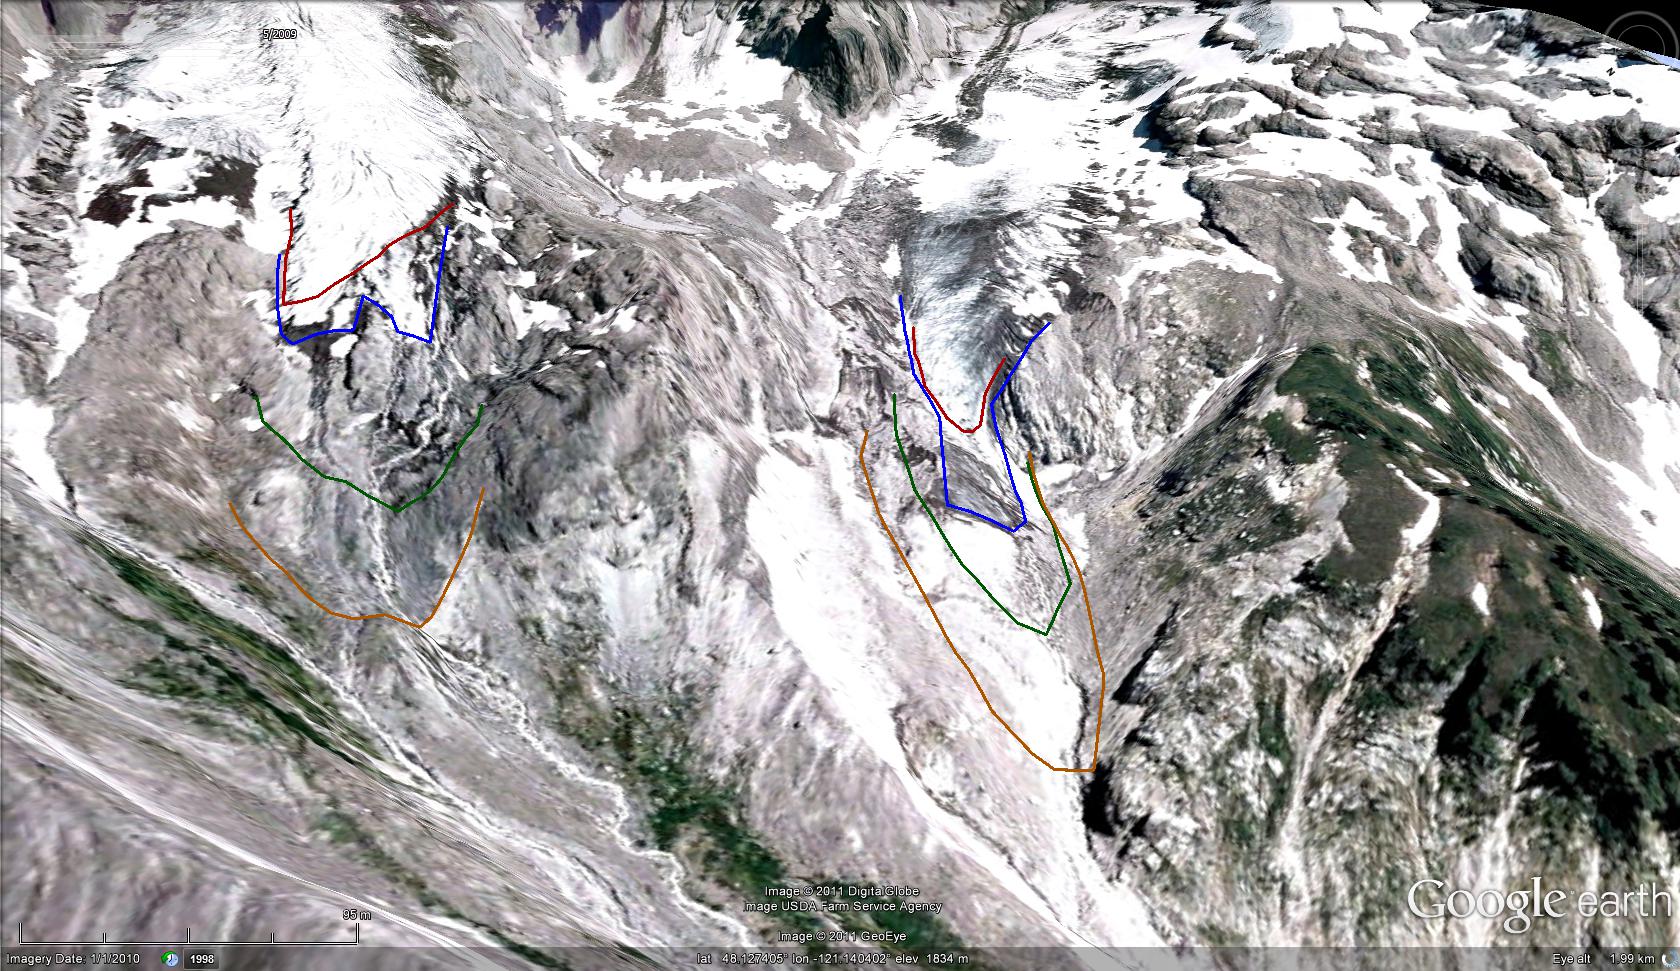
 . The glacier is continuing too retreat, but each summer retains significant accumulation, as evident in the crevasse measurements of snow depths on the upper Kennedy Glacier at 2800 meters. This indicates a glacier that can retreat to a new point of equilibrium with current climate.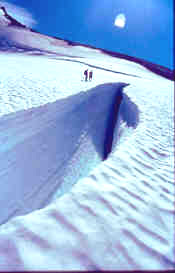
Washmawapta Glacier Retreat, British Columbia
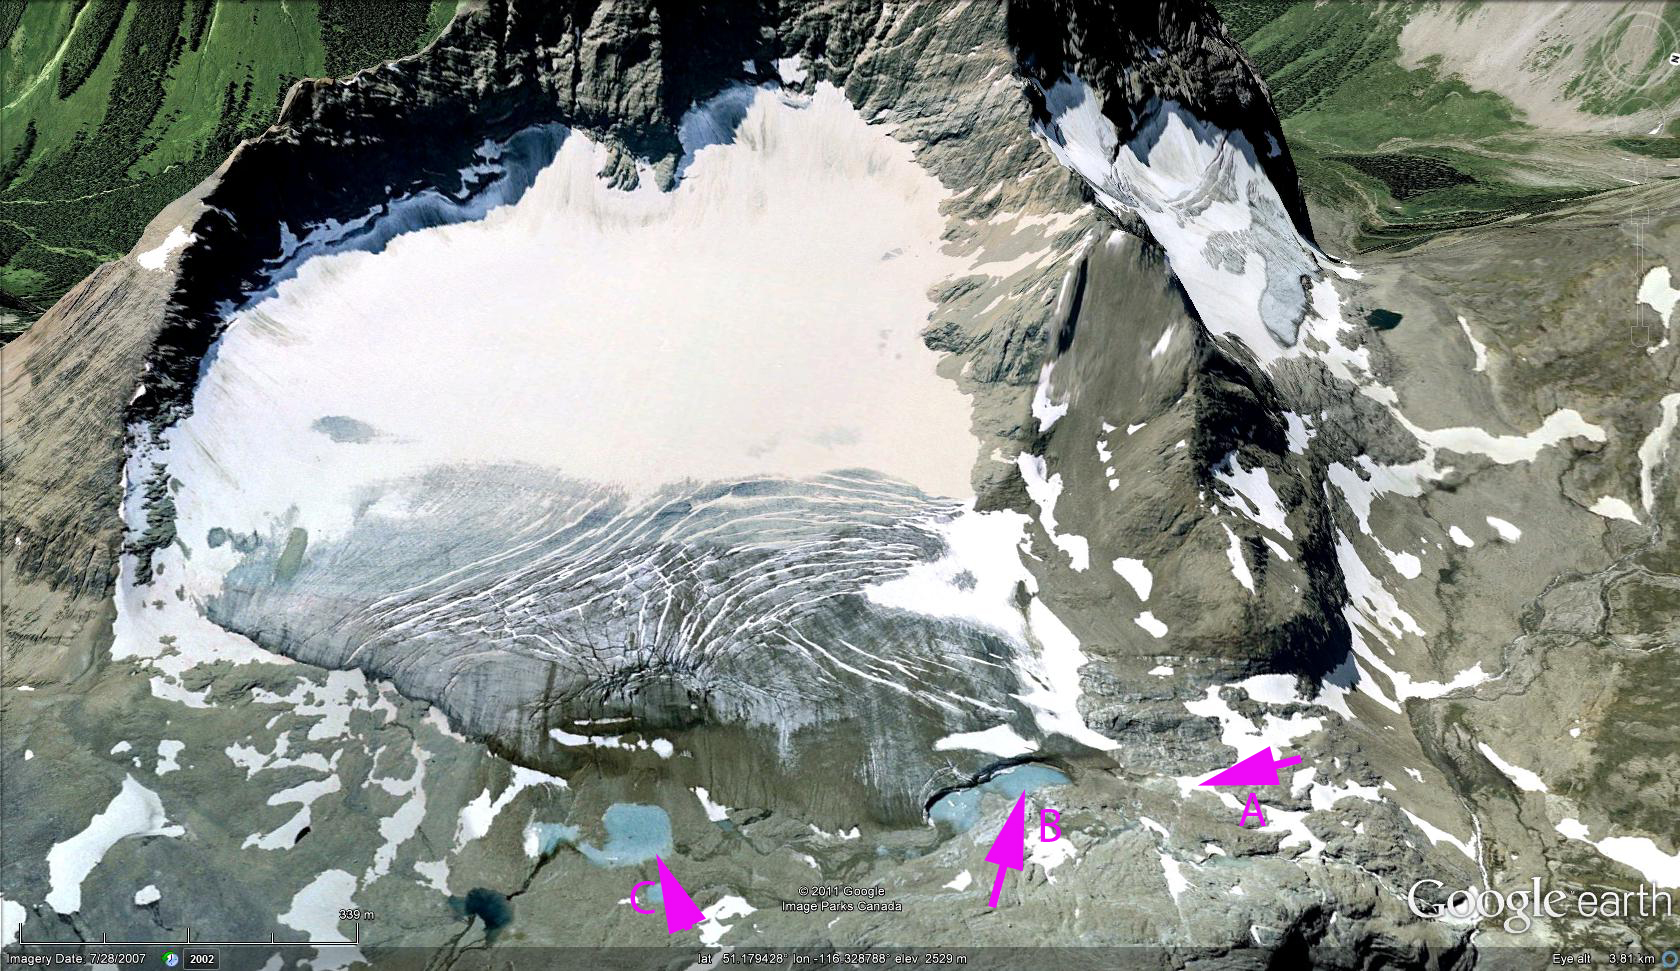
The West Washmawapta Glacier and Washmawapta Icefield are located in the Vermillon Range in British Columbia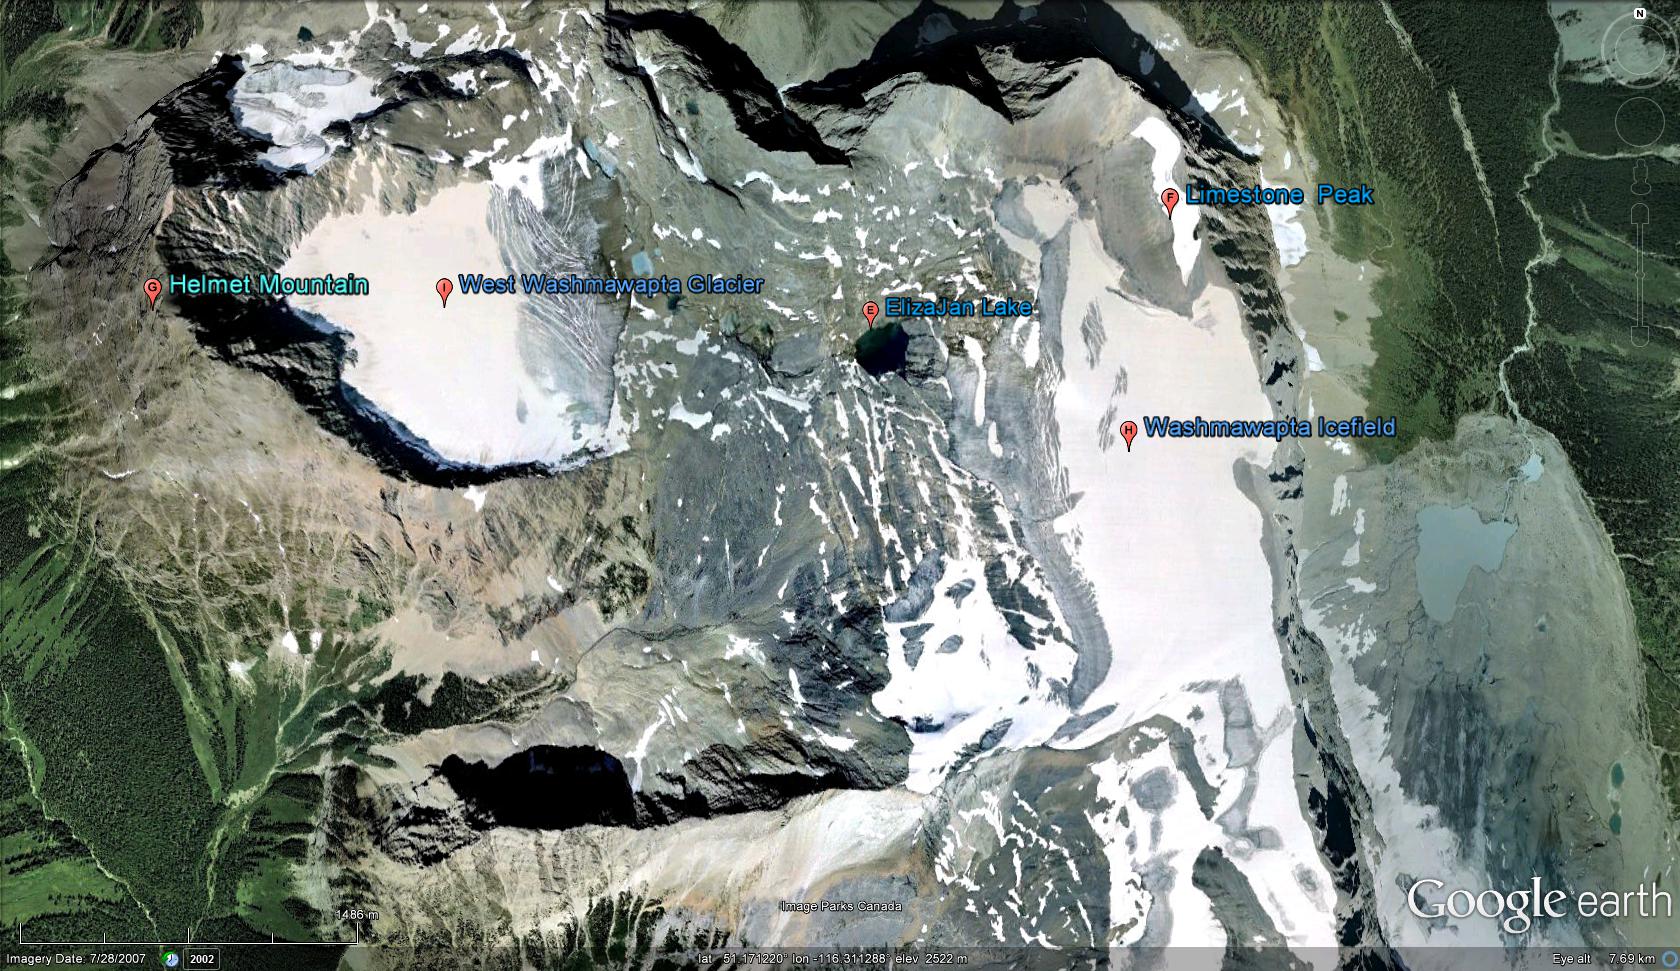 . They are in a basin between Limestone Peak and Helmet Peak. The West Washmawapta is a cirque glacier and has been the focus of detailed studies of its dynamics and runoff in recent years. The study of its dynamics (Sanders et al, 2010) measured velocities of 3-10 meters/year, pretty typical for a cirque glacier of this size, and had a maximum depth of 185 m, a bit deeper than usual. The runoff study (McGregor, 2007) and Dow et al (2011)examined streamflow below the glacier and found that peak flow was at 2100 hours, several hours after peak melting. They conclude that this indicates a well developed subglacial drainage system. Sanders et al (2010) noted that West Washmawapta Glacier lost 30% of its area from 1949-2007. A comparison of Google Earth imagery from 2002 (top) and 2007 (middle) and Landsat imagery from 2009(bottom) identifies changes in the two glacier in the last decade. For the West Washmawapta Glacier in 2002 the glacier ended in contact with two proglacial lakes (Point A-C) and a lake that is just forming at Point B. The retreat is from 30-50 meters in this five year span. In the 2009 Landsat the Lake at Point C is well separated from the glacier.
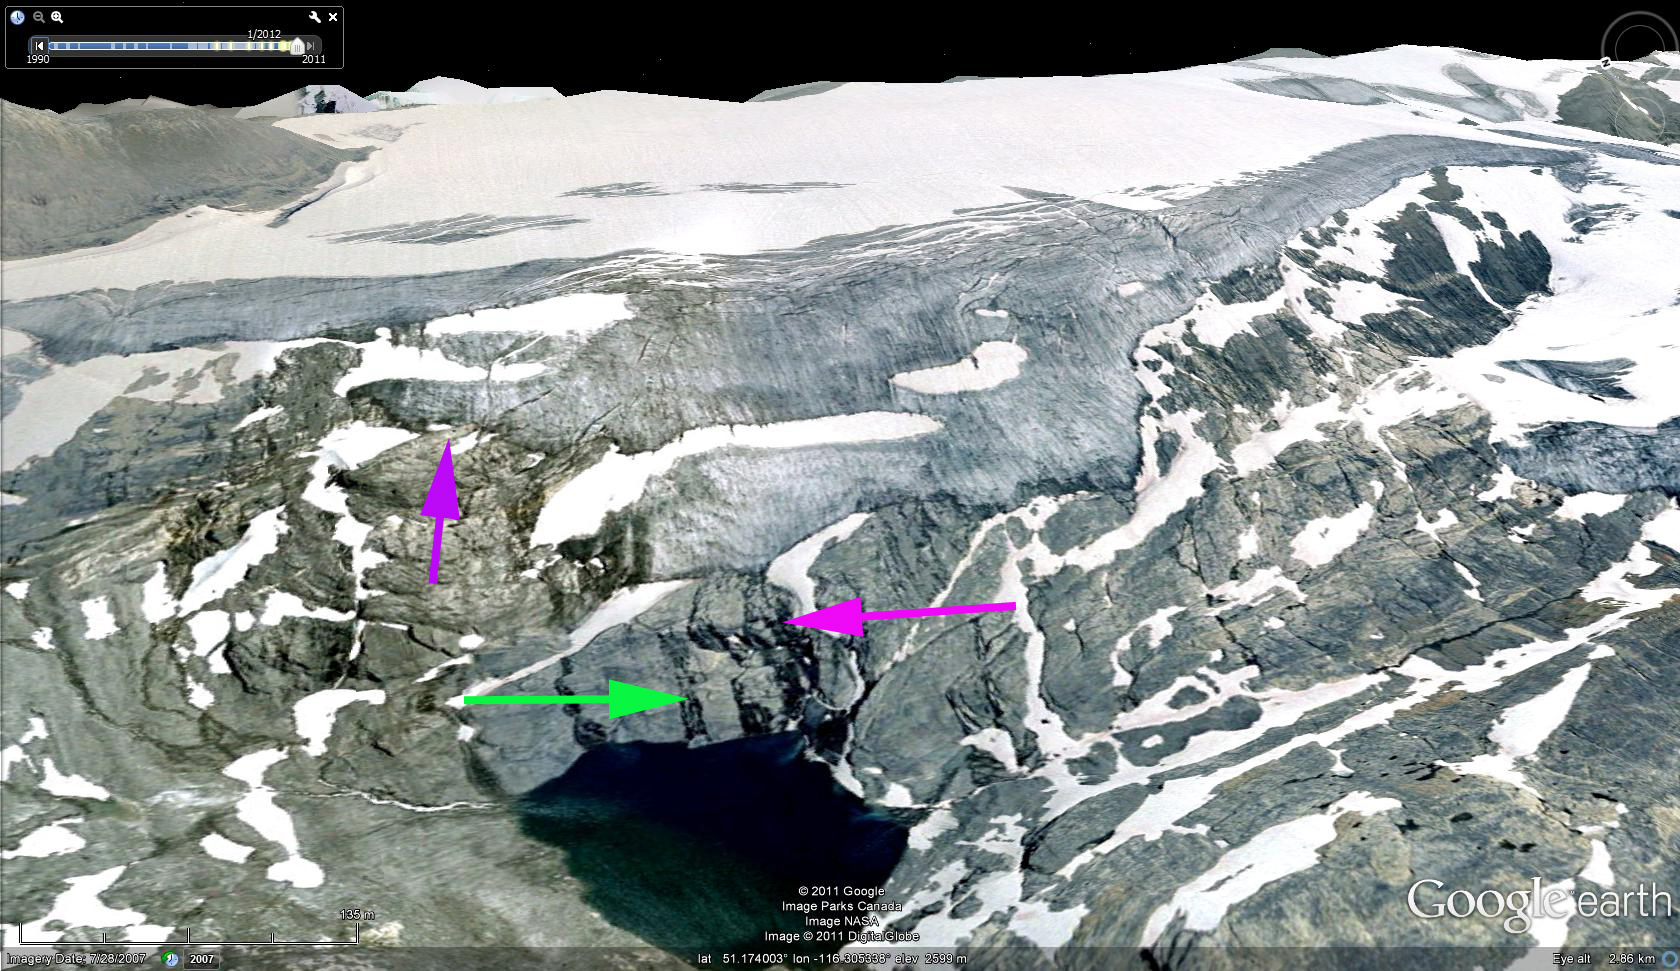
 For Washmawapta Icefield, does not really deserve the icefield title, has lost a lower former glacier section that was in contact with Elizajan Lake, green arrow. The purple areas point to two prominent bedrock features that indicate retreat of 30 meters over the five year time span. The problem for both glacier is the insufficient size of the accumulation area. In 2009 the image is from August 20th, a month left in the melt season and only 40% of the glaciers are snowcovered. An alpine glacier like these needs at least 55% snowcover to be in equilibrium. The 2007 imagery in from July and the accumulation area is at 65%, by September of 2007 the extent was down to 35%.
 Now if you are still not sated, the video on the West Washmawapta Glacier project illustrates the amount of hard work and good humor that is essential to complete such a field project is quite a treat.
Dzhungharia Alatau, Kazakhstan Glacier Retreat
Dzhungharia Alatau range of Kazakhstan is host to over 500 square kilometers of glacier ice. 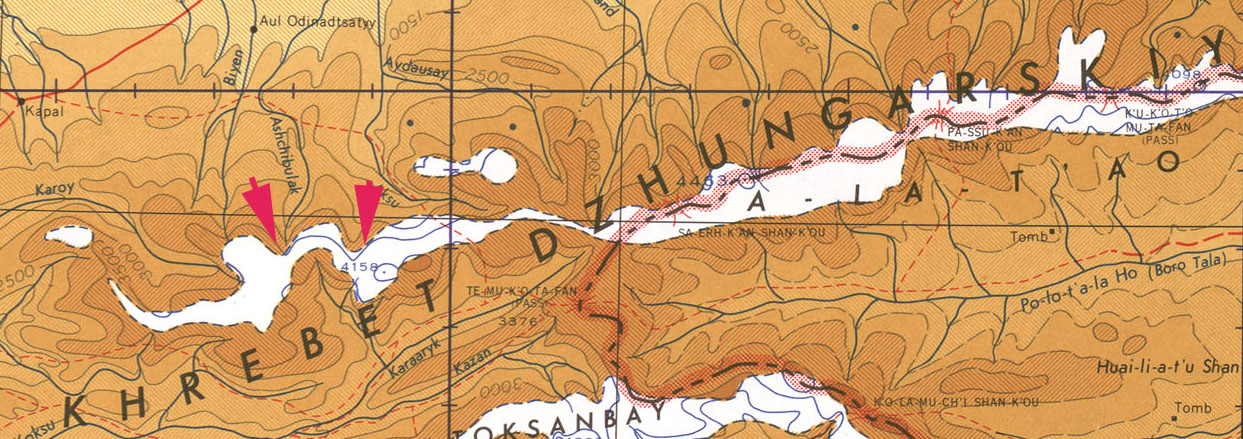 This amount of glacier ice declined by 1% per year from 1956 to 1990, (Severskiy, 2009: 103). This reduction in glacier area parellels that of changes in the Zailiyskiy and Kungey Alatau further south in Kazakhstan and Kyrgyzstan (Bolch, 2006). The Aksu River flows north from the Dzhungharia Alatau into Lake Balkhash.
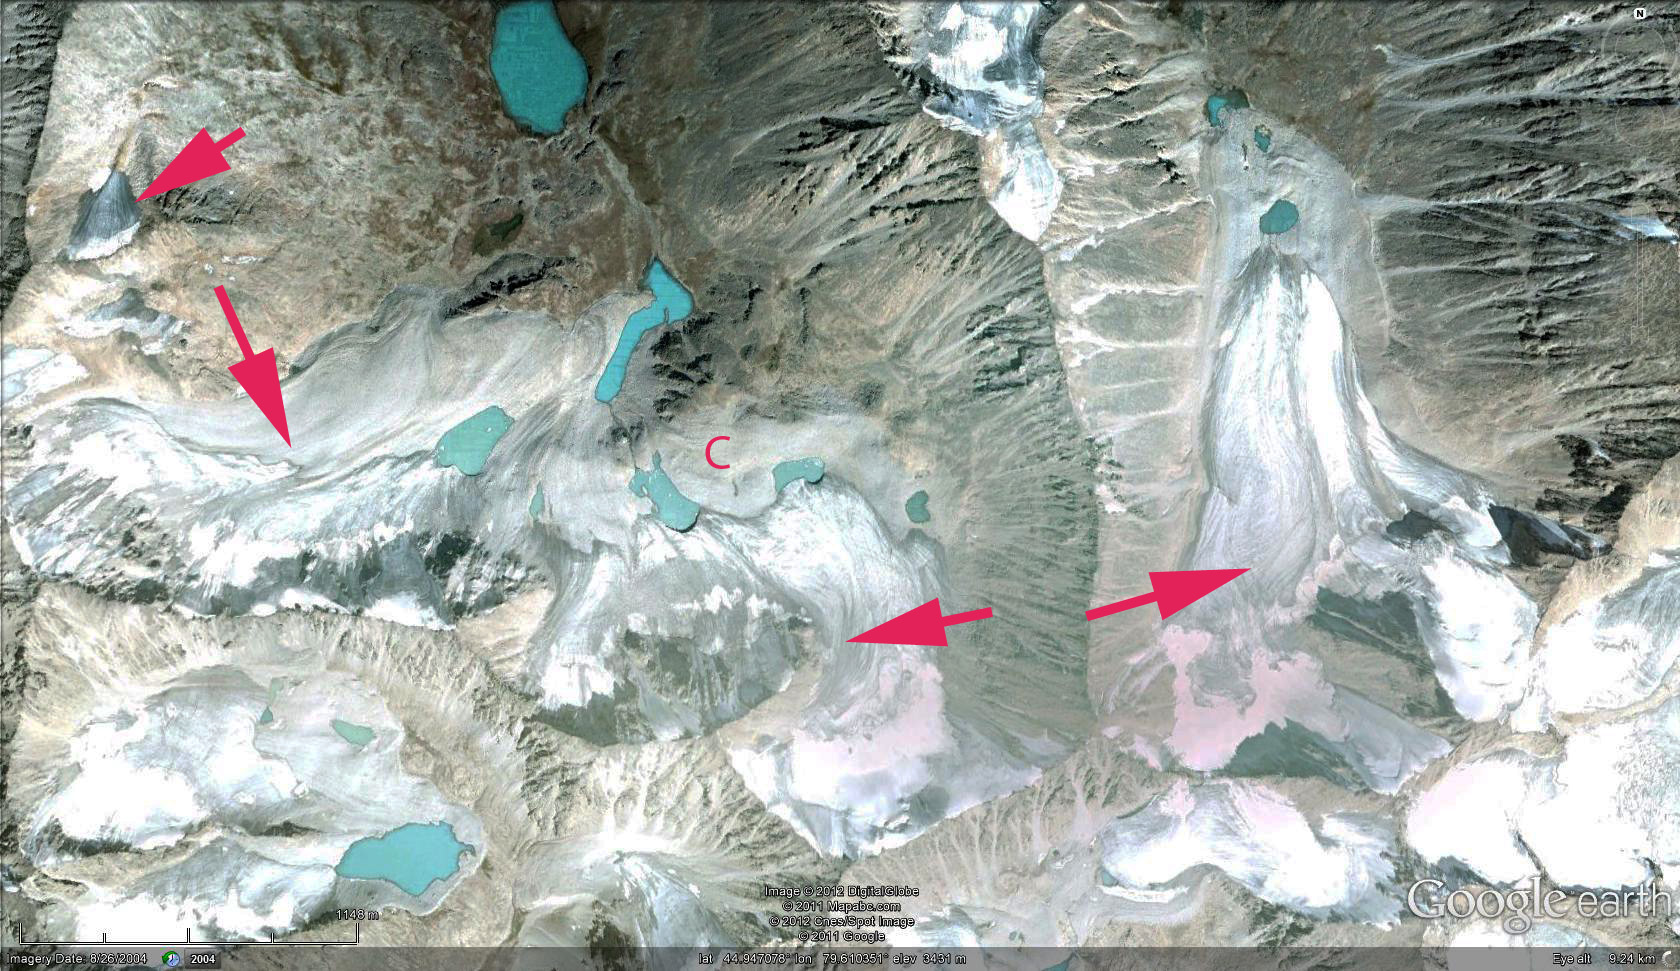
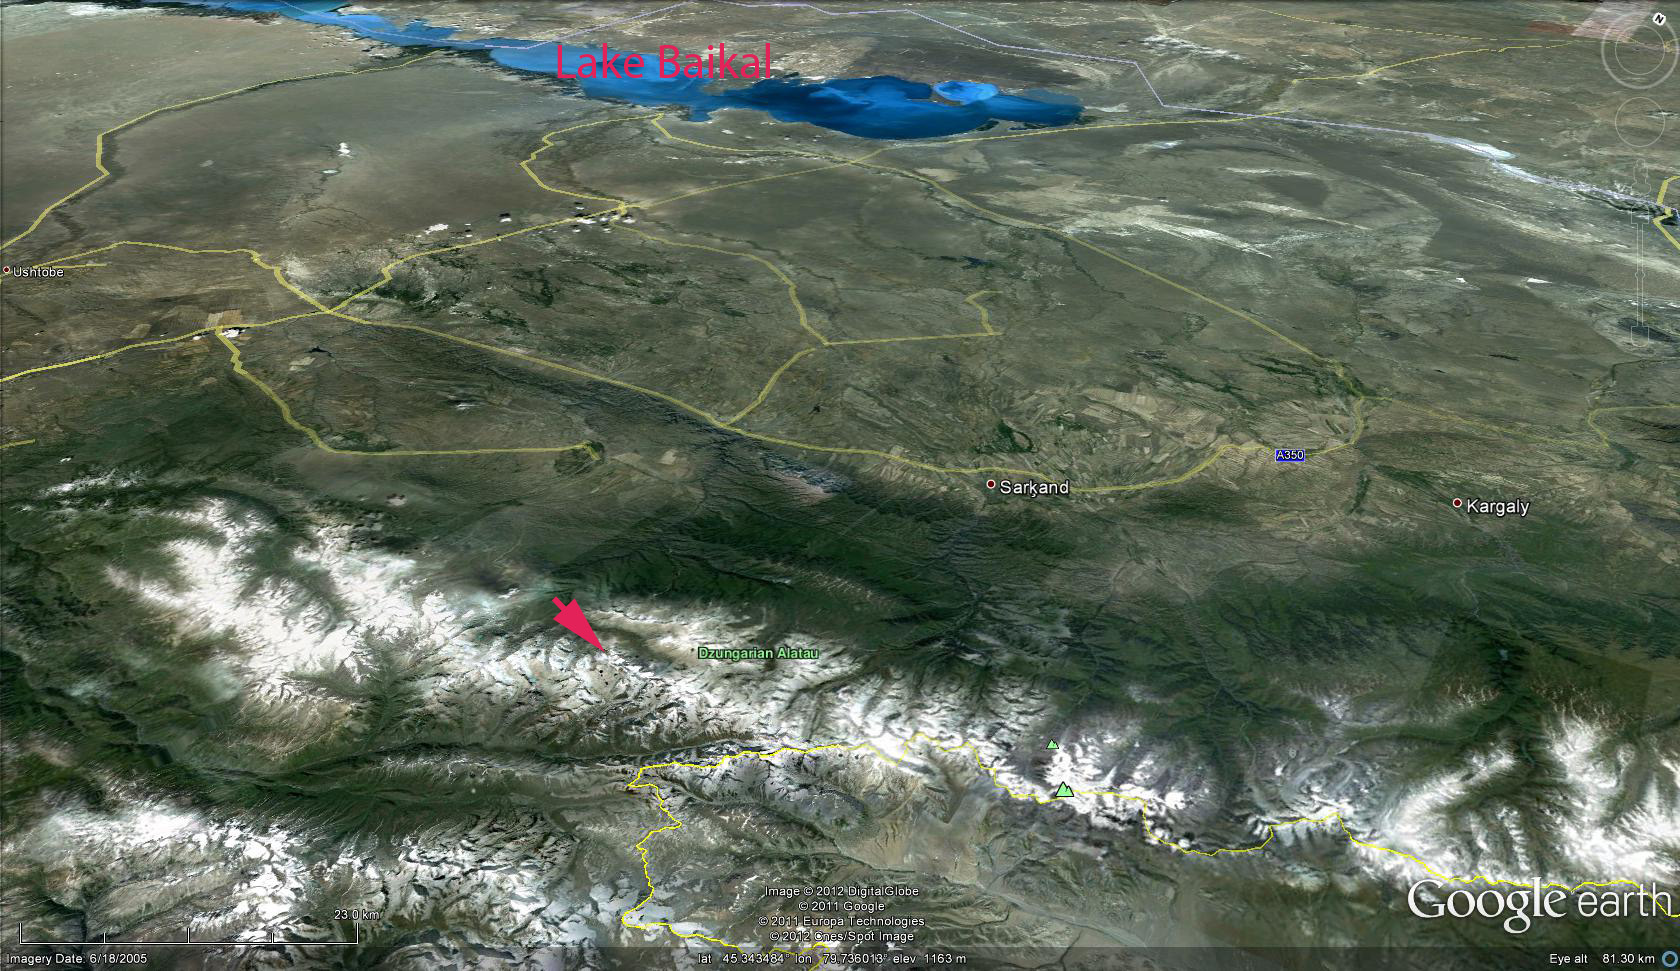 This post focuses on several glaciers in the Aksu River Basin, Eskeldi District, Almaty Province, Kazakhstan. A 2004 Google Earth image highlights the terminus position of several glaciers (A-E) that end in small lakes that are expanding as the glaciers retreat. It is also evident in this image that the snowcovered extent is low. For a glacier to be in equilibrium 55-65% of the glacier needs to be snowcovered at the end of the melt season. In this case the percentage is below 30%. The lakes at point A and C have expanded, and the glacier at point E is no longer in contact with the glacier, in the 2009 Geoeye imagery. The 2009 imagery is after a summer snow storm, that blanketed the glaciers with a thin snowcover.
 . The amount of retreat of for the 2004-2009 period is close to 140 meters at Point A, 100 meters at Point C and E. A closeup view of the glacier ending at Point A indicates the terminus position green arrow and the outcrops of rock in upper glacier that indicate thinning of the accumulation zone. A glacier with a thinning accumulation zone will not survive (Pelto, 2010). The second image is of the glacier that ends at point C and D and indicates the lack of snowcover on the small glaciers.
 . Some on the ground photographs of the glaciers in the region from Tsvetik

