
Update for 2/22/2011-the Tasman Glacier’s thin and weak terminus area, see in the GE image below, in Tasman Lake shed some large icebergs due to the earthquake generating some substantial waves in the lake. The post earthquake image with numerous fresh icebergs is the second below and is from the EPA. 
 No word on the Hooker Glacier in the next valley west, which also calves into an expanding lake or Murchison Glacier in the next valley east. There is a Tasman Glacier update in 2013.
 . The New Zealand National Institute of Water and Atmospheric Research has been examining the changes in volume and snowline on New Zealand Glaciers since 1977. This survey has concluded for 2009 they same observation as for 2007 and 2008, the glaciers are shrinking. An examination of the recent volume changes on the glacier indicate that the volume has been particularly negative since 1998.
 . This followed a period of relatively positive mass balance from 1990-1997, which made the New Zealand glaciers the least rapidly retreating glaciers in the world. For Tasman Glacier the retreat has been ongoing, the NWIA has noted a retreat of 180 m per year on average since the 1990’s. The proglacial lake at the terminus continues to expand as the glacier retreats upvalley. The lake is deep with most of the lake exceeding 100 metes in depth, and the valley has little gradient, thus the retreat will continue. It has been noted by researchers at Massey University that it is just to warm for the terminus area at 730 m to endure. Imagery of Tasman Glacier indicates the future it faces. There was no lake in 1973 and now it is more than 7 km long. The glacier appears quite rotten along the ice margin and poised for further retreat. The glacier drains a valley just east of the highest mountains in the range Mount Cook and Mount Tasman.
  . The image above has a blue line up the center of the glacier from the former terminus at the end of the lake too the head of the glacier. The upper image is from 2007 and the lower image from 2009. In the latter image the lake has expanded considerably. The disconnected lakes and debris covered ice on the left side-west side of the glacier has been replaced by all lake. Icebergs are afloat in this lake, they do not survive very long. The debris cover itself insulates the glacier ice from melting, slowing the process. However, the process due to the warmth and increased melting of the last decade has been increasing.


In the image below is a closeup of the section of ice that has now disintegrated, before it did. You can see the crevasses in some of the icebergs too. This is a rapidly changing environment due to the ongoing climate warming.
Author: mspelto
Professor of Environmental Science at Nichols College in Massachusetts since 1989. Glaciologist directing the North Cascade Glacier Climate Project since 1984. This project monitors the mass balance and behavior of more glaciers than any other in North America
Grasshopper Glacier, Montana-nearly gone
Grasshopper Glacier, the largest is located about 19 km. north of Cook, Montana within Custer National Forest. The glacier on Iceberg Peak occupies a north facing cirque at nearly 3300 m. (11,000 ft.). In 1940, it was about 1.6 km. wide and on its northwest side terminated in a 15-m. cliff. In 1966, seen below, the glacier had an area of 0.42 square kilometers.  The name of the glacier is derived from the myriads of grasshoppers that were embedded in the ice. These grasshoppers either were downed by sudden storms or were carried over the glacier by strong air currents, where the cold forced them onto the ice surface. The grasshoppers are an extinct type of Rocky Mountain grasshoppper Melanoplus spretus. They perished here, were buried by new snow and preserved. At the time the glacier ended in a small lake. Progressively the glacier has retreated. By 1966 it was 0.6 km long, in 1994, seen below, 0.36 km long and in 2006 0.27 km long.
In 2005 this glacier has ceased to exist as an active glacier, there are a few remnant perennial snow and ice patches the largest with an area of 0.05 km2. In the majority of recent summers the glacier has lost all of its snowcover. Glacier survival is dependent on consistent accumulation retained on the glacier each summer, this glacier will not survive. The glacier has continued its rapid recession and the further segmentation into small disconnected segments, heralds the end of an active glacier. We do have a gorgeous new alpine lake in its place. Notice the basin is still largely devoid of plant life and the surface still has the color of newly exposed-deposited sediments. 

Grasshopper Glacier in 2001 with a few crevasses near the ice front (A.Lussier Image).
Hinman Glacier, North Cascades disappears
In the USGS map for Mount Daniels-Mount Hinman in the North Cascades, Washington based on 1958 aerial photographs, overlain in Google Earth. Hinman Glacier is the largest glacier in the North Cascades south of Glacier Peak. Today it is nearly gone. Hinman Lake, unofficial name, has taken the place of the former glacier, which still has a couple of separated relict ice masses. From 1984-2007 all 47 glaciers observed by the North Cascade Glacier Climate Project receded. Hinman Glacier has had one of the more dramatic retreats. Immediately below is the 1965 Mount Daniels Quadrangle USGS map of the glacier. The glacier extends from the top of Mount Hinman at 7600 feet to the bottom of the valley at 5000 feet. The next image is of Hinman Glacier from the west in 1988,the Hinman Glacier is now a group of four separated ice masses, three are significant in size still. The third image in the sequence is the 1998 aerial image of the glacier a few areas of blue ice are seen, the glacier is 20% of its mapped size. There are still three sections of remanant blue glacier ice. The next picture in the chain is the glacier in 2006, from a Google Earth image,at this point the glacier is no longer detectable under the snowcover, note the map outline and the gorgeous new unnamed Lake Hinman. The new lake 0.6 miles (one kilometer long). Lastly is a 2009 view from the far end, north end of Lake Hinman up the valley and mountain side that was covered by the Hinman Glacier, now 90% gone. Each of the two larger ice masses from 1998 is now divided into at least two smaller portions. This is no longer a glacier and is just a few relict pieces of ice, the largest has an area of 0.05 square kilometers. 


Pine Island Glacier Grounding Line Updated 2012
The Pine Island Glacier is a principal outlet glacier of the West Antarctic Ice Sheet draining into the Amundsen Sea. The ice stream is 40 km wide as it reaches the sea. Recent retreat, thinning and acceleration have focussed attention on this glacier. This is a brief note in support of a RealClimate article. The grounding line is of principal concern here. This is where the glacier goes afloat. The grounding line is where the bottom of the glacier comes in contact with the ground, in this case the sea bottom. The grounding line is an anchoring point for the outlet glaciers. The length of the glacier that is grounded is being both slowed and stabilized by the basal friction. Beyond the grounding line toward the margin the floating ice shelf is susceptible to a rapid calving retreat and as the grounding line retreats, so would the calving front. Note in the image below that the current grounding line is on relatively high terrain, but is close to a deep basin. The annotated image below is from a British Antarctic Survey image, taken from their autosub program exploring beneath the ice shelf of the Pine Island Glacier combined with data from radar altimeter data flown by NASA. The second image below is a profile of depth under Pine Island Glacier from (Shepard et al, 2001)that indicates that beyond the grounding line the depth remains more than 1000 meters below sea level for approximately 200 km. 
 Grounding line retreat could lead to the glacier retreating into this basin, not a stable situation. Basal melting is of particular concern, has been calculated to exceed 15 m/year. In addition the formation of basal crevasses which are much wider than surface crevasses may be critical in the rifting process. The British Antarctic Survey, NASA and several universities in particular have been focusing on this glacier. The second image shows the grounding line in the surface. This is an annotated satellite image from NASA. Just above the grounding line you can note that the surface of the glacier has some large scale roughness which indicates the impact of the sub-glacier topography.
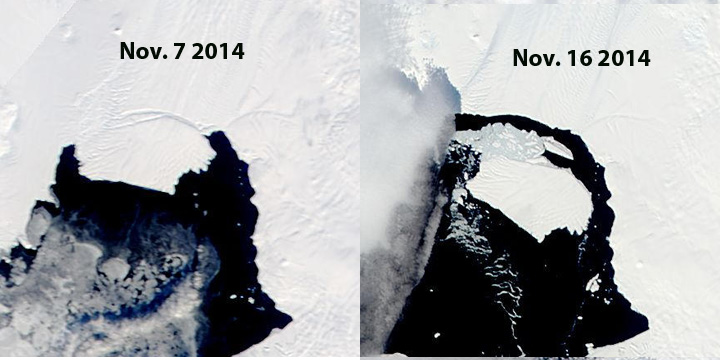
  This topography acts to slow and buttress the glacier. This area is above the topographic rise from the deep basin to the higher terrain of the current grounding line. The ongoing focus on the Pine Island Glacier will be fascinating to watch. In particular the emphasis on the oceanographic aspects beneath the ice shelf. The melt rates beneath the ice shelf are significant, on the order of 15 m/year. This is an aspect that has received less attention and will certainly yield interesting results, considerable technologic frustrations and innovations. The nearby Smith Glacier has experienced a similar inland spread of rifting and retreat. In 2011 an additional rift has formed that is 20-25 km inland of the calving front, first noted by NASA’a Operation Icebridge. November 3, 2011 MODIS imagery is seen below. The rifts in both 2001 and 2011 have begun on the east edge of the ice stream an propogated westward. The propagation is more likely as an exploitation of basal crevasses then surface crevasses. The rift from 2011 led to iceberg formation in the fall of 2013 as seen in MODIS images.
  On October 5, 2011 MODIS imagery indicates no rift. By Sept. 17, 2012 a second rift parallel to the first had developed.

Denali National Park, East Taklanika Glacier retreat
The glaciers of Denali National Park are shrinking. The National Park Service has been chronicling the retreat with repeat photographs of glaciers from locations where historic photographs exist. The program has been a cooperation between glaciologist Guy Adema and photographer Ron Karpillo. One example is East Taklanika Glacier. This glacier drains north from the east ridge of Mount Scott. The glacier is currently 5.1 km long, the lower 2.2 km of the glacier is nearly completely debris covered. That ice is beneath the debris is clear from the lack of a the glacier melt fed river in the valley bottom and the color of the sediments which is darker, largely because the debris is wet from the ice melt underneath. The glacier in the center of the Google Earth satellite view below is East Taklanika Glacier.  The glacier has retreated 1100 m between 1916 and 2004 in the phtographs of Ron Karpillo and Stephen Capps. There is a lateral moraine in the foreground of the 2004 Ron Karpillo image. This marks the former surface elevation of the glacier during the Little Ice Age. Since that time the lower section of the glacier has lost over 100 m of ice thickness.
 The retreat is ongoing. Medial moraines are bands of debris on the surface of a glacier that separate tributaries of a glacier. The moraines represent material eroded from the edge of the tributaries before they join. This material does not appear at the surface until you reach the ablation zone where melting dominates. In the accumulation zone such debris bands would be buried. On East Taklanika Glacier the debris bands extend to within 1 kilometer of the head of the glacier. For a glacier to be in equilibrium a glacier needs to have at least 50 % of its area in the accumulation zone at the end of the summer. Based on the satellite image hear showing 10% of its area in the accumulation zone and the extent of the medial moraine indicating no more than 25% of the glacier area above the moraine. This glacier needs to lose the lower 2-3 kilometers to be in equilibrium. This may not be enough. A glance at the glaciers around East Taklanika, indicate the same story, very little retained snowpack. Some of these glaciers have an accumulation area ratio (% of glacier snow covered at the end of the summer), of zero. This is like having no income, and plenty of expenditures and the result for your bank account, net loss and without some change eventual bankruptcy. The story of retreat is the same though the snowpack extent greater on the Juneau Icefield. The retreat of East Taklanika is slowed considerably by the debris cover which protects the ice underneath from melting as fast. This glacier is a long way from completing its retreat to adjust to current climate.
Gilkey Glacier Retreat, Juneau Icefield
 Above is a paired Landsat image from 1984 left and 2013 right indicaing the 3200 m retreat during this period of Gilkey Glacier.The Juneau Icefield Research Program has long monitored the mass balance of the Lemon Creek and Taku Glacier on the Juneau Icefield. This program begun by Maynard Miller in 1946 and continuing through today has also monitored the terminus behavior of the icefields outlet glaciers. Of the 17 significant outlet glaciers 5 have retreated more than 500 m since 1948, 11 more than 1000 m, and one glacier the Taku has advanced. I have a chance to visit the glaciers during a number of summers over the last 25 years as part of this ongoing annual program. The Gilkey Glacier is a 32 km long 245 km2 outlet glacier flowing west from the Juneau Icefield. In 1948 it terminate at the head of a braided outwash plain. At that time it was joined 5 km above the terminus by the Battle and Thiel Glaciers from the south.
  All three of these glaciers drain from the Juneau Iceifeld accumulation zone between 1500 and 2000 m, which maintain consistent snow cover. From 1948 to 1967 the Gilkey Glacier retreated 600 m and in 1961 a proglacial lake began to form. By 2005 Gilkey Glacier had retreated another 3200 m , generating a proglacial lake that is now 3.9 kilometers long, which is approximately the amount of retreat in the last 60 years as well.
  The lake is partly filled with large icebergs from disintegration of the, note below in an image from Scott McGee of JIRP,Gilkey terminus. The lake is currently terminating in this still growing lake. Approximately half of this retreat occurred after a 1991 satellite image indicated the lake was close to half its current size. The retreat has been resulted from calving icebergs into the new lake as well as thinning from melting in the lower reach of the glacier. The extensive debris cover and lack of crevassing in the lower 1500 meters of the glacier indicates that this section is stagnant and will break up soon.
Gilkey Glacier was in 1955 joined by the tributary glaciers Battle and Thiel Glacier. A visit to the Battle Glacier in 1982 indicated that it had separated from the Gilkey Glacier and the Thiel Glacier, but the Thiel Glacier was still connected. By 1991 the Thiel Glacier had separated. Today these glaciers terminate 3200 m and 1700 m up their respective valleys from Gilkey Glacier. Thiel has retreated 1700 m from the Gilkey Glacier. A retreat of 3200 m has created a glacier 70 % its former length. The vast bare valley beyond the terminus is in stark contrast to the map above. Thiel Glacier has extensive lateral moraines extending above the glacier terminus indicating the ongoing retreat. The lower 3 kilometers of this glacier are flat and are downwasting, indicating a substantial retreat is still underway. A view up the valley from the Gilkey toward the terminus of Battle Glacier indicates that most of the area deglaciated was a flat low elevation valley. Now that the glacier is retreating up a steeper slope, the retreat rate of Battle Glacier should slow.
Mass Balance of the Easton Glacier 2009
Immediately below is Easton Glacier on Mt. Baker in the North Cascades in late May 2009. The glacier is still completely snow covered. The bench where the small gray cloud shadows are at 6000 feet averages 20 feet of snow remaining.
") Easton Glacier extends from the terminus at 5600 feet to the slopes near Sherman Crater at 9000 feet. Each summer since 1990 NCGCP has measured the mass balance of this glacier. View Youtube for a pictorial review of the full 2009 field season . The glacier has retreated 300 m since 1990. During this same period the glacier has lost a cumulative mean of 13 m of thickness. Given a thickness in 1990 between 60 and 75 m, this is about 20 % of the total glacier volume. The image below shows the terminus in 2009(green=2009, 2006=brown, red=2003, purple=1993 and yellow=1984).
Easton Glacier extends from the terminus at 5600 feet to the slopes near Sherman Crater at 9000 feet. Each summer since 1990 NCGCP has measured the mass balance of this glacier. View Youtube for a pictorial review of the full 2009 field season . The glacier has retreated 300 m since 1990. During this same period the glacier has lost a cumulative mean of 13 m of thickness. Given a thickness in 1990 between 60 and 75 m, this is about 20 % of the total glacier volume. The image below shows the terminus in 2009(green=2009, 2006=brown, red=2003, purple=1993 and yellow=1984).  Measuring mass balance requires assessing snowpack depth and areal extent at the end of the summer melt season and the amount of melting in areas where blue ice or firn (snow more than a year old) is exposed. Below is measuring crevasse stratigraphy and below that emplacing a stake to measure ablation with weather instruments on it.

Mass Balance = residual snow accumulation – ice-firn melting.
The melt season began a bit late just when the May picture was taken Winter snowpack was between 75and 90% of normal in the area as of April 1. The melt season had been late to begin and snowpack by late May was near normal. Record heat was experienced at the end of May and the start of June, quickly causing snowpack to fall below normal.Each year we measure the snow depth via probing and crevasse stratigraphy at more than 200 locations. These depth measurements allow the completion of a map of snow distribution. This map is completed in early August and updated, based on a smaller number of observation in late September. The amount of melting is assessed from stakes emplaced in the glacier and the recession of the snowline in areas where snow pack depth has been assessed. below are images from early and then mid-August indicating the rise of the snowline. 

A warm June and July caused exceptional snow pack melt and by early August when we began assessing snow pack depth retained, the snowcover had receded to the 6400 foot level, 300-400 feet higher than normal. Snowpack remained below normal all the way to the 8600 foot level. the snowpack since early July had been rising nearly 100 feet per week. By mid-August at right the snow line on the glacier averaged 6800 feet. By mid and Late September the snowline had risen to 7400 feet a rate of rise of 150 feet per week since mid-August. Below is an image from mid-September 2009.  The amount of melting on the glacier in July was the highest we have measured totaling, 2.1 m. This led to the exposure of a couple of new bedrock knobs evident in the picture at right near the 2100 meters, black arrows. Overall the mass balance of the glacier in 2009 was a negative 2.06 m. This glacier averages 55-70 m in thickness and this mass balance loss represents a 3% volume loss in a single year for the glacier.
Sperry Glacier Recession
In 1900 Sperry Glacier had an area of 3.39 km2. By 1938 it had diminished to 1.58 km2 and by 1946 it was only 1.34 km2 in area. The estimated loss in volume between 1938 and 1946 was a 23 meter reduction in the level of the surface of the lower half of the glacier during that period. Recession proceeded at an annual rate of 15.3 m. be¬tween 1938 and 1945; 11.9 m. from 1945 to 1947; 10.5 m. from 1947 to 1948; and 12.9 m. from 1948 to 1949 (Dyson, 1950).
Recession of Sperry Glacier continued from about 1950-1970 and has been accompanied by loss of volume of the lower part of the glacier. Sperry Glacier has been examined in reconnaissance (Johnson, 1958, 1960, 1964). Comparison of longitudinal and transverse profiles shows that since 1947 the upper part of the glacier has increased in vol¬ume during some years and remained constant during others, whereas the lower part has decreased in volume. Throughout this time span slow terminal recession has been continuous. Surface ice velocities on Sperry Glacier average about 3 m./year.
Sperry Glacier retreated at a slower rate of 5 m/a, from 1950-1979 (Cararra and McGrimsey, 1981). The retreat has ranged from 3-5 m/a from the 1979-1993 period (Key, Fagre and Menicke, 2002).
In 1993 0.87 square kilometers remained. This glacier still has crevasses and is not merely stagnant and melting away. A comparison of imagery from 1991 top (orange line for terminus), 2003 middle (green line) and 2005 bottom (blue line) indicate the marginal changes during this 14 year interval. These images are all from Google Earth using the historic imagery function. 
 Marginal recession averages 95 meters in this period ranging from 20-200 meters. The glacier was 1200 meters long in 1990 so this is close to a 10% loss in length. The current rate of retreat is slightly higher than the 3-5 m/a average fro the 1979-1993 period. The image in 1991 is from Aug. 25th, the glacier still has 70% of its area covered with snow from the previous winter. This is called the accumulation area ratio and in general must be above 60 at the end of the summer for the glacier to not lose mass. In 2003 the accumulation area ratio is about 30 and this is on Sept. 25th at the end of the melt season. In 2005 the accumulation area ratio is 30 at the most. Both years this limited a snowcover would lead to a significant negative mass balance, volume loss. The thinning in the upper portion of the glacier appears limited. There is not an evident change in the upper margin of the glacier. The crevassing which is indicative of movement has also not decreased much suggesting limited changes in the dynamics of the upper glacier. The comparatively slow changes in the accumulation zone, suggests a glacier that still has a consistent accumulation zone and is not likely to melt away rapidly, within the next 30 years, given the current climate. The glacier is showing no signs that it is approaching equilibrium, and that it can survive the current climate. This is in contrast to nearby Harrison Glacier which is receding quite slowly. There are new outcrops appearing at points A and B in the 2005 image indicating thinning and retreat is continuing. Annual layers are evident at point c in the 2005 image. Crevassing in the same area at point D is evident in each image.
The USGS and the NPS have made Sperry Glacier a focus of field study beginning in 2005. The long term record of glacier area and glacier retreat makes it a good candidate. To date no mass balance data has been completed or reported. This data is essential to understand future terminus and volume responses. This project has been particular good at acquiring historic images to compare to current images 1913 and 2008. Bob Sihler captured the lack of snow remaining on Sperry Glacier in 2009., with a month still left in the melt season.
Snowmaking for Alpine glaciers; where there are enough skiers there is a way.
Snowmaking on glacier’s, sounds like an oxymoron. However, several ski resorts in the Alps have begun doing just that to trying to offset the increased melting of glaciers that occupy a portion of their resorts. This is a more practical application than the insulating blanket that has been used at the Pitzal resort.
On the Pitzal Glacier, Austria they have begun using the IDE All Weather Snowmaker, which can produce snow in above-zero temperatures without chemical additives. This system, which produces snow directly on the slope at any temperature and without chemical additives, was installed in the Pitztal for the first time in Europe and at the same time as in Zermatt (Switzerland). The artificial snow cover forms a buffer layer on top of the glacier and prevents glacial melting. This also covers the glacier ice with a skiable surface. The high temperatures in recent years on the Pitztal Glacier were often not right in early autumn for producing normal snowfall so Dr. Hans Rubatscher, Manager of the Pitztal Glacier Railway, is employing a new way. In the future, the Snowmaker will be used alongside the existing snowmaking equipment, in particular at the start of the season in autumn and in late spring. This brings numerous benefits to the Pitztal Glacier optimizing ski run conditions, earlier opening of the slope section by the base station of the Pitz-Panorama Railway. The potential is emphasized by the interest of several ski teams who have expressed great interest in this special facility at the Pitztal Glacier. The 15m high production tower for the snow has been set up in its own building at an altitude of 2,840m right by the base station of the Pitz Panorama Railway. Below is the output of the snow with the glacier in the background
 The snow produced here can be channeled directly onto the slopes below by the Gletschersee chair lift. The water for this innovative snow production system will be extracted using a vacuum system from the existing storage pools on the Pitztal Glacier. These pools are filled exclusively with melted glacier water, thus forming an ecological cycle on the glacier, returning its own meltwater as snow. After gaining experience, concrete attempts will be made to use the snow created by the Snowmaker to preserve the substance of the glacier in Austria’s highest glacier ski area. The glacier seen below has in most years been bare by late summer, not a skiable condition. The net volume loss of the glacier has also been notable.
In Zermatt’s case the snow is being used to make a path between the bottom of its high altitude glacier and the cable car station from where skiers and boarders can get back up the slopes to access the year round ski area. In years gone by the glacier did reach this lift station anyway, but over the past two decades it has melted away and in summer and autumn there may be no snow cover at all.
The IDE snowmaking system was developed by an Israeli company best known for its water desalination products. It created cooling systems for mines, which to their surprise produced snow as a by-product even under the scorching sun. The “Snowmaker system” can produce approximately 1900 cubic meters of snow in 24 hours whatever the outside temperature, humidity, and wind speed, and is highly energy-efficient. With traditional snowmaking systems, the temperature has to be at least minus 6 degrees Celsius and the humidity no more than 60 percent. With the IDE Snowmaker, these factors don’t come into the equation.
Currently 15% of the Tignes French ski area is covered by snow making canons and it is not just low lying areas. Tignes has equipped the bottom of the runs of the Glacier du Grande Motte with snow making to extend the summer ski season at 3000 meters and Val d’Isère is doing the same on the Glacier du Pisaillas to assure the summer skiing. The lift tower on Glacier Pissaillas is on the right of the image, the bare ice is not good ski conditions. Snow cannon shown at Tignes. 


Columbia Glacier year by year
The following pictures give a year by year view of Columbia Glacier within one day of August 1. The best year was 1999, the worst, 2005.The snowy peaks of the Monte Cristo region can be seen from the Everett area. With 30 glaciers many at low altitudes, this region may receive more snow than any other region in the North Cascades. The largest and lowest is Columbia Glacier occupying a deep cirque above Blanca Lake and ranging in altitude from 4600 to 5700 feet. Kyes, Monte Cristo and Columbia Peak surround the glacier with summits over 2000 feet above the glacier. The Monte Cristo range is the first major rise that weather systems coming off the ocean encounter on the way east to the Cascade Crest. As a result precipitation is heavy. During the summer if it is raining anywhere in the North Cascades it will be in the Monte Cristo region. The glacier is the beneficiary of heavy orographic lifting over the surrounding peaks, and heavy avalanching off the same peaks. We measure the mass balance of this glacier each year and report the data to the World Glacier Monitoring Service. The location is gorgeous as seen in this painting by Jill Pelto 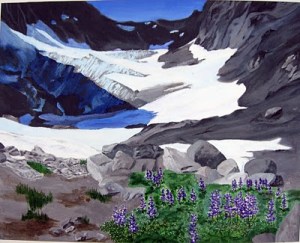 Despite the advantages of snow accumulation the glaciers mass balance since 1984 has average -0.5 m a year for a cumulative loss of 13 m. For a glacier that averages 60 m in thickness this is over 20% of its volume. Details of the mass balance research and methods are at
Columbia Glacier has retreated 134 m since 1984. Lateral reduction in glacier width of 95 m in the lower section of the glacier and the reduction in glacier thickness are even more substantial as a percentage. The major issue is that the glacier is thinning as appreciably in the accumulation zone in the upper cirque basin as at the terminus. This indicates a glaciers that is in disequilibrium with current climate and will melt away with a continuation of the current warm conditions. The glacier has lost 17 m in thickness since 1984, but still remains a thick glacier, over 75 meters in the upper basin and will not disappear quickly.
A lateral moraine deposited during the Little Ice Age, is visible at the western edge of the glacier, descending below the glacier to 4250 feet. This moraine has little vegetation on the inside, but is vegetated on the outside. Just in front of the terminus are two terminal moraines deposited during retreat in the last 20 years. Facing southeast Columbia Glacier is protected from any afternoon sun except during the summer. During the winters storm winds sweep from the west across Monte Cristo Pass dropping snow in the lee on Columbia Glacier. Avalanches spilling from the mountains above descend onto and spread across Columbia Glacier. The avalanche fans created by the settled avalanche snows are 20 feet deep even late in the summer. Nearly a third of the glacier is covered by avalanche fans, but no summer avalanches have been observed. Avalanches, shading from the sum provided by the high peaks, and wind drift snow deposition permits Columbia Glacier to exist at such a low altitude.
Devon Ice Cap
Two recent papers have examined the changes in flow, mass balance and volume of the Devon Ice Cap(Shepherd et al., 2007) (Dowdeswell, 2004). The Devon Ice Cap on Devon Island in the Canadian Arctic ice cap’s area has an area of 14,000 km2, with a volume of 3980 km3 . The ice cap area decreased by 332 km2 (2.4%) between 1960 and 2000.
The mass balance of the glacier has been assessed since 1960, the total mass loss due to surface melting and runoff between has been about 59 km3. Between 1960 and 1999 about 21 km3 of ice was lost from the ice cap by calving of icebergs, contributing 0.21 ± 0.02 mm to global sea level over this time. The long term mean net surface mass balance was 0.13 m from 1960-2000. From 1998-2007 the mean annual balance has been -0.23 m year, a substantial increase.  The Belcher Glacier above is the principal outlet glacier calving up to 30% of the total iceberg volume from the ice cap.
Devon Ice Cap’s negative balance has been due to warming and greater ablation, as the upper part of the glacier has seen some increase in accumulation, which has been more than offset by increased melting.  In this case the mass balance record indicates a dramatic worsening after 1995. It will be interesting to see the ablation results from the summer of 2008, when record melting was noted both in northern Greenland and northern Ellesmere Island. The glacier is not alone in its behavior, the Prince of Wales Icefield has had a negative mass balance over the last forty years of -80 km3, equivalent to a mean-specific mass balance across the ice field of -0.1 m w.e. a-1, contributes 0.20 mm to global eustatic sea level rise (Mair et at., 2008).
Photographs of the fieldwork coordinated by the University of Alberta
Stubai Glacier’s Protective Blanket
The north facing side of the Stubai Glacier, also referred to as the Schaufel Ferner, that comprises the biggest ski area in the area is open all summer down to the Eisgrat lift station. There are two main lifts that traverse up the glacier, some of the towers for the ski lifts are set right on the glacier. The linear features extending down glacier in this satellite view of the glacier are the ski lifts and the ski runs.  The Stubai Glacier has been retreating and thinning significantly as have most all glaciers in the Alps. Austria has a long term program monitoring the terminus position of over 100 glaciers. From 2000-2005 of the 115 glaciers observed and reported to the World Glacier Monitoring Service, all 115 experienced net retreat. The mass balance of Austrian glaciers, which represents volume loss, reported to the WGMS has been averaging a loss of more than 0.5 m per year since 1998. The loss of 5 m of ice in a decade on glaciers like the Stubai represents about 10% of their volume lost this decade. Stubai Glacier has experiences a 33% loss in its area since 1969 shrinking from 1.72 to 1.15 square kilometers (Aberman and others, 2009). This ongoing ice loss prompted the ski area in 2003 to begin to explore means to preserve the glacier and maintain there ski season. They turned to the University of Innsbruck’s Andrea Fischer and Marc Olefs, who explored three means to reduce the summer melting. Olefs and Fisher (2007) Innsbruck University.The first was injecting water during the winter into the cold snowpack to make it denser. This did add mass, but did not reduce the melt rate. The second methods was to pack down the snow periodically in the winter, again making it denser. Likewise this did not reduce ablation. This is not surprising given that ablation rates on dense ice and less dense snow are very similar on glaciers. The third method was to cover the glacier with a blanket, they used both felt and plastic. The plastic was more reflective, thinner and easier to deploy and as seen in the next two photographs blends in well with the glacier surface. The top image is from Ineedsnow.com.
 This technique reduced ablation by 60%. Is snow making now being employed a better answer? The problem is that even one small glacier ski slope is still a large area to cover. Because of this success in 2005, the ski resort continues to employ these white polyethylene sheets to reduce melting in strategic areas on the glacier. They are typically spread out in May. The sheets can be seen emplaced around the lift towers in particular. The bare ice of the main section of the glacier is an area of 400,000 square meters (4,300,000 square feet) tough to cover with material, even if it is a low cost per square meter. This type of geoengineering applied to just part of one small glacier maybe practical, but it is not practical at a significant scale. The severity of the climate change we are experiencing is emphasized by the extent to which the ski area is being forced to adapt to try and maintain its summer ski area. In the pictures below, the problem is illustrated by the extent of bare glacier ice late in summer. The ski lifts are apparent as are the square snow patches around the lift towers in the upper image. In the lower image the view from the gondola shows a glacier with very little snow remaining, this is a sign of a glacier that is quickly losing mass.

