The Hardangerjøkulen Ice Cap is situated in southern Norway,150 km from the western coast. This elliptical shaped ice cap covers 73 square kilometers and ranges in altitude from 1020 to 1865 meters. It rises above the community of Finse offering access to snow year around. Norway has the most comprehensive glacier monitoring program in the world, mainly due to the heavy reliance on hydropower, for which glacier runoff is a key input. The Rembesdalsskaka drains west from the ice cap, the left side feeding the Rembesdalsvatnet Reservoir.  The research is led by the The Norwegian Water Resources and Energy Directorate (NVE). Statkraft runs the Sima power station that is fed from Rembesdalsvatnet Reservoir and the larger Sysenvatn fed by the southern glaciers of Hardanger. This system produces 620 Mw of hydropower. The largest glacier draining the western side of the ice cap is the Rembesdalsskaka with an area of 17 square kilometers. Since the LIA maximum Rembesdalsskaka has retreated almost two kilometres, The ice cap decreased in volume from the Little ice Age until 1917, followed by an increase in ice cap volume and glacial advance until 1928, . After this a period with high negative mass balances cause a rapid retreat of Hardangerjøkulen until 1950. Retreat continued until 1961, but the rate declined. From 1961 to 1995 mass balances increased, with the highest balances in the late 1980’s and early 1990’s. This resulted in an advance of Rembesdalsskaka. Since the early 1990’s mass balance has been negative, with exceptionally negative years in. This has led to the retreat of the Rembesdalsskaka each year from 2000-2009 a total of 307 meters.
  The retreat is measured each year from a benchmark painted on rock beyond the terminus, reported to the NVE and then to the World Glacier Monitoring Service. In 2009 the NVE reported 19 glaciers retreated, 3 were stationary and one advanced.
Author: mspelto
Professor of Environmental Science at Nichols College in Massachusetts since 1989. Glaciologist directing the North Cascade Glacier Climate Project since 1984. This project monitors the mass balance and behavior of more glaciers than any other in North America
Anderson Glacier Retreat, Middle section exposed
Anderson Glacier is the headwaters of the Quinault River in the Olympic Mountains of Washington. A century ago the glacier was 2 km long, and a half kilometer wide. Retreat of this glacier in the first half of the 20th century exposed a new alpine lake, as the glacier retreated 1 kilometer. From 1950-1980 the glacier diminished slowly. From 1959 to 1990 the glacier thinned and retreated from the lake trapped behind the Little Ice Age moraine. The picture below was given to me by Austin Post. 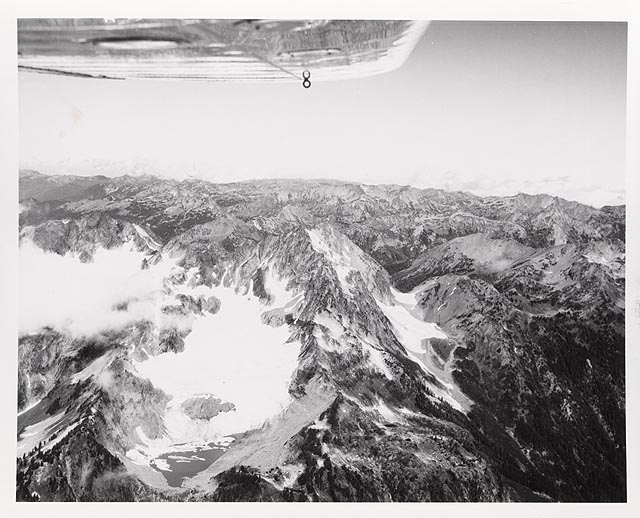 Since 1990 the glacier has begun to shrink rapidly. The USGS aerial photograph of the glacier is from 1990, Anderson Glacier is on the right, West Glacier is to the left.
 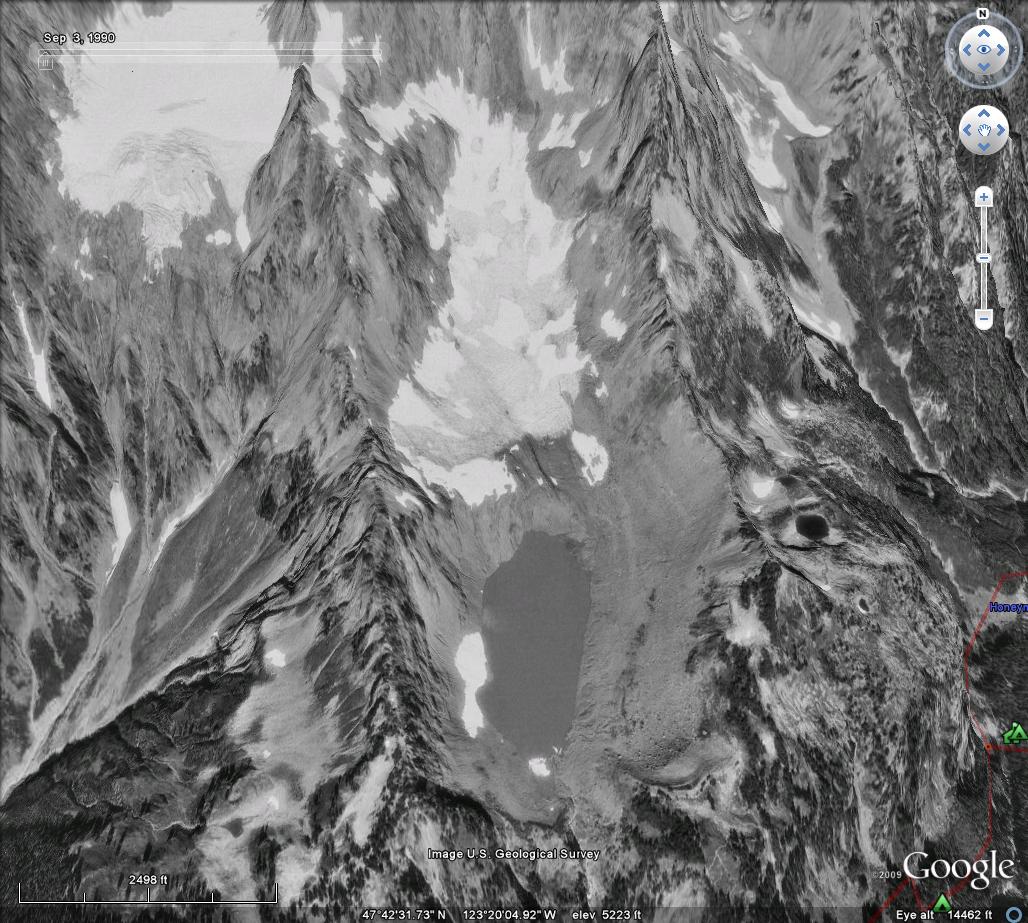 Investigating this glacier in 1992 we measured its area at 0.38 square kilometers, down from 1.15 square kilometers a century before. Ten years later the glacier had diminished to 0.30 square kilometers, but had thinned even more, leaving it poised for a spectacular change, over the next five years. Large outcrops of rock have appeared beginning in 2003 and further exposed in 2005 and 2009 in the middle of the glacier. Note the outcrops in this 2007 image from Kathy Chrestensen
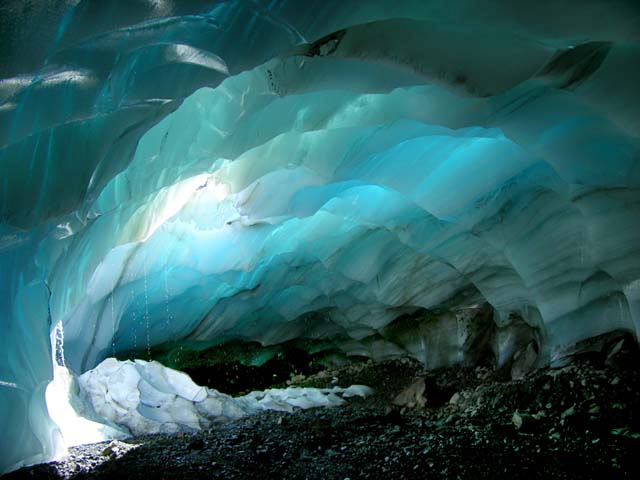
  The end of the glacier is an avalanche runout area and is thinning slower than most of the lower reach of the glacier. This glacier has become a series of small disconnected relict glacier ice patches. There are some large ice caves that have developed under the glacier. This is an indication of limited flow, and stagnant melting ice.
  Anderson Glacier is not the only glacier feeding the Quinault River, all the others are retreating as well. The result of glacier retreat is reduced late summer and early fall streamflow, impacting salmon runs at that time of the year. This is primarily the fall Coho, Chum and Chinook salmon and Steelhead summer run. During the spring and early summer runoff increases as snowmelt still occurs, but is not retained in the glacier system.
Zemestan Glacier, Afghanistan Retreats
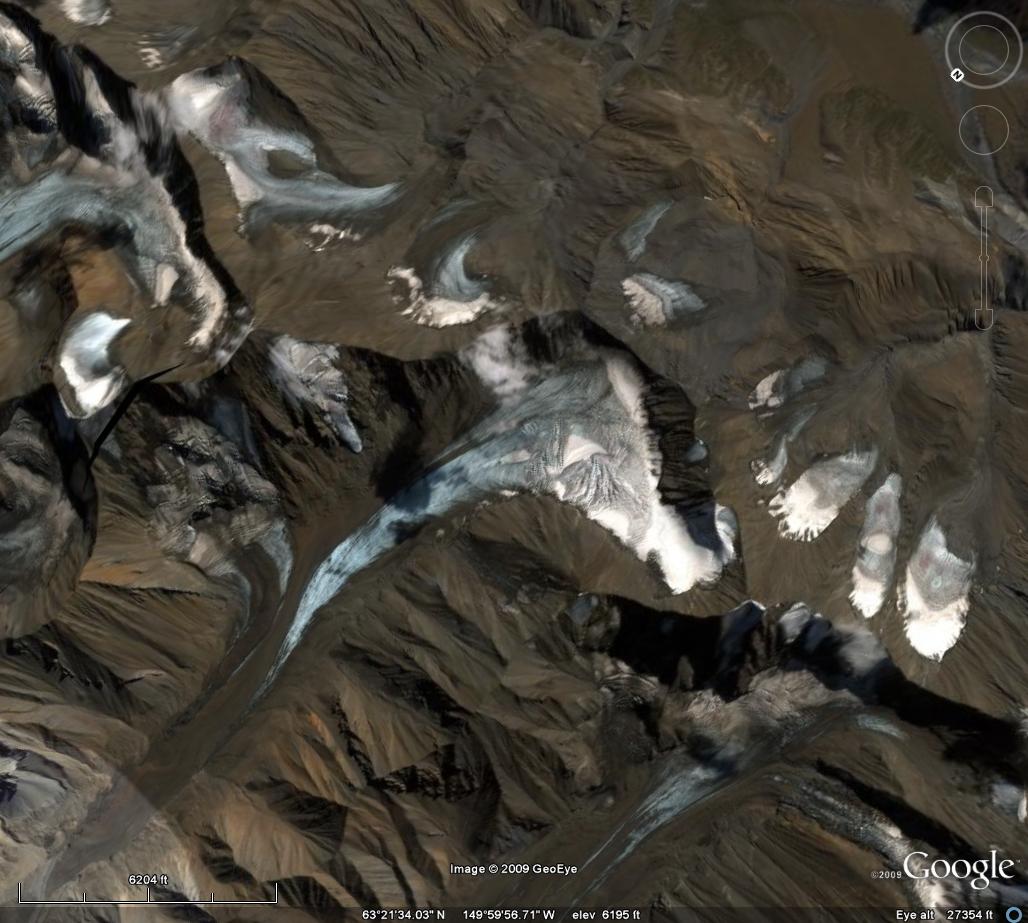
The Wakhan Corridor in Afghanistan is not easy to get to, as a result field study of its glaciers are quite limited. This is where the Global land ice Monitoring System (GLIMS) comes in. GLIMS acquires satellite imagery of glaciated areas, making these images available to researchers and processing them to an extent for inventory purposes. GLIMS is led by Jeff Kargel at the University of Arizona. In the Wakhan Corridor a group of glaciers was examined by Umesh Haritashya and others (2009). This recent GLIMS project examined ASTER and Landsat MSS data 1976–2003, in the Wakhan Corridor of Afghanistan. Of the 30 alpine glaciers of varying type, size and orientation examined 28 glacier-terminus positions have retreated, two have been stationary. 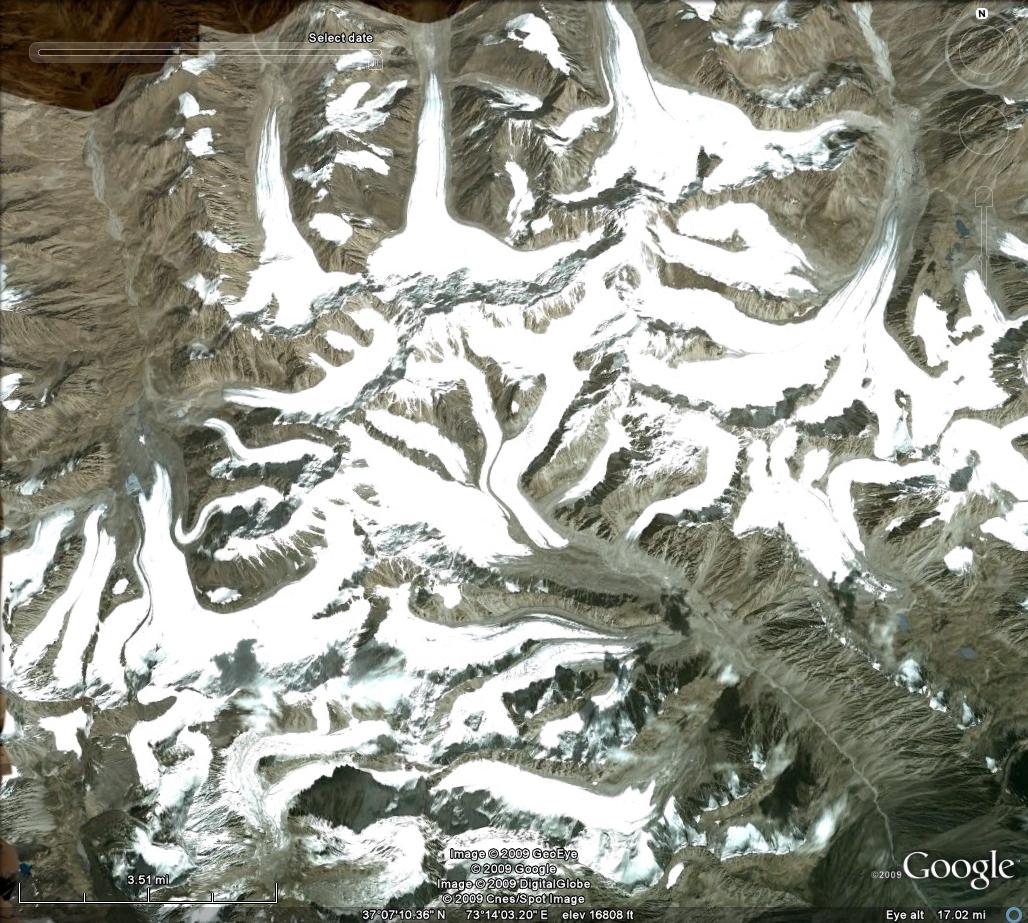 The largest average retreat rate was 36 m per year, and the average retreat was 11 m per year. The retreat is evident in a comparison of 1998 Landsat and 2010 Landsat images, note the orange arrow in both. The width and length of the terminus tongue has changed. One of the glacier examined was the Zemestan Glacier. This glacier is 5.3 kilometers long, has an area of 5.2 square kilometers, begins at 5640 meters and terminates at 4800 meters. It is one of many glacier in the Central area of the Wakhan Corridor. Zemestan Glacier has retreated at a rate of 17 meters per year over the study period, a total retreat of 460 meters, 9% of its total length. A comparison of 1998 and 2010 Landsat imagery indicates the retreat of the terminus tongue in width and length at the orange arrows.
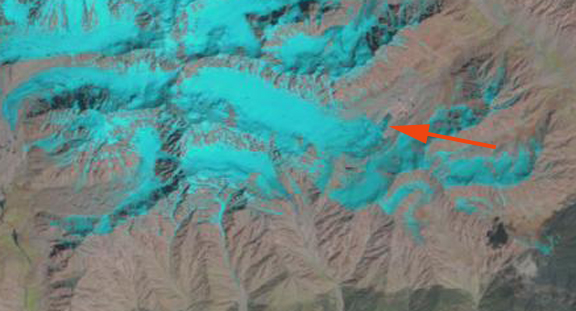 The glacier has remained snowcovered at its higher elevations at the end of the summer in recent satellite images.
  This indicates that with current climate the glacier does have a significant accumulation zone and can survive current climate. Continued warming will increase the retreat rate and could threaten its survival. The glacier feeds the Pamir River which in turn drains into the Panj River, to the Amu Darya River and then the Aral Sea. The terminus is on a shallow slope lacks a steep slope and is not extensively crevassed. All of these factors indicate retreat will continue. The glacier has little debris cover unlike many glaciers in the Karakoram-Himalaya-Pamir Ranges such as the Khumbu Glacier or the Zemu Glacier
Helm Glacier Melting Away-2014 Video Update
It is clear that the business model for glaciers in our current climate is not working. The Helm Glacier in the Coast Mountains of southwest British Columbia is an example of this. Helm Glacier has been the focus of annual mass balance surveys since 1967. During the 1984-2013 period its mass balance losses have been the greatest of any of the 16 glaciers monitored in North America. The mass balance loss has been about 32 m of water equivalent, about 35 m of ice thickness lost. This is less than losses on other nearby glaciers like Spearhead Glacier but more than others such as Warren Glacier. The regional volume loss has impacted even the large glaciers Bridge Glacier and small glaciers. The loss is more than 30% of the Helm lost in just 25 years, and the trend mirrors that of all glaciers in the Pacific Northwest. Helm Glacier also fits into the pattern of glacier retreat across Canada, Canadian Glacier Retreat index.  The glacier had an area of 4.3 square kilometers in 1928. Today the area has declined by 78% to 0.92 square kilometers. In 1928 the glacier is not too distant from its Little Ice Age moraines. The trimlines of recently deglaciated terrain are clear. The glacier has two termini, one draining north and the other west. Today in the picture from Johannes Koch, there is a vast expanse of newly deglaciated terrain that as yet lacks significant vegetation. The western terminus is gone.
Remainder of post and updates moved to
Helm Glacier
Zongo Glacier retreat
Zongo Glacier, Bolivia extends 2.9 km down the south side of Huayna Potosi from 6000 m to 4900 m. Zongo Glacier is a small valley glacier located north-east of La Paz, and its runoff is directed to an important hydraulic power station which supplies La Paz. Note Laguna Zongo in foreground of the first image. The dam is visible as is the power station to the right and below the lake. The glacier has considerable snowcover on its upper section and crevassing. This indicates a persistent accumulation zone.  In 1991 a glaciological research program (page 46) was established on Zongo Glacier to monitor mass balance, understand its hydrology and energy balance. The long term director of this research Bernard Francou has been called the glacier guardian. The typical Alpine glaciers undergoes a long accumulation period in winter and a short ablation season in summer. The glaciers of the tropical Andes experience snow accumulation during the wet season, austral summer on their upper regions and maximum ablation during the same season low on the glacier. In the dry season winter there is a period of low ablation over the whole glacier. Mean annual air temperature at the long term snowline at 5250 m is -1.5 °C. Mean precipitation is about 0.9 m/year.
Since 1991 the glacier has lost more than 5 m of thickness and has retreated significantly. The mass balance loss has been most pronounced during El Nino periods, thus 2009 should not be a good year for Zongo Glacier. La Nina’s are associated with positive or only slightly negative mass balance. The ongoing mass balance loss has led to retreat of 184 meters of this glacier from 1996-2005. A comparison of satellite images from 2004-2008 indicate a retreat of 70-75 meters, this is consistent with the reported retreat rate of 18 meters per year. The glacier has withdrawn from the new glacier lake formed from the ongoing glacier retreat in the 1990’s. The images below are focussed on the terminus in 2004 and in 2008, note the retreat from the lake shore. 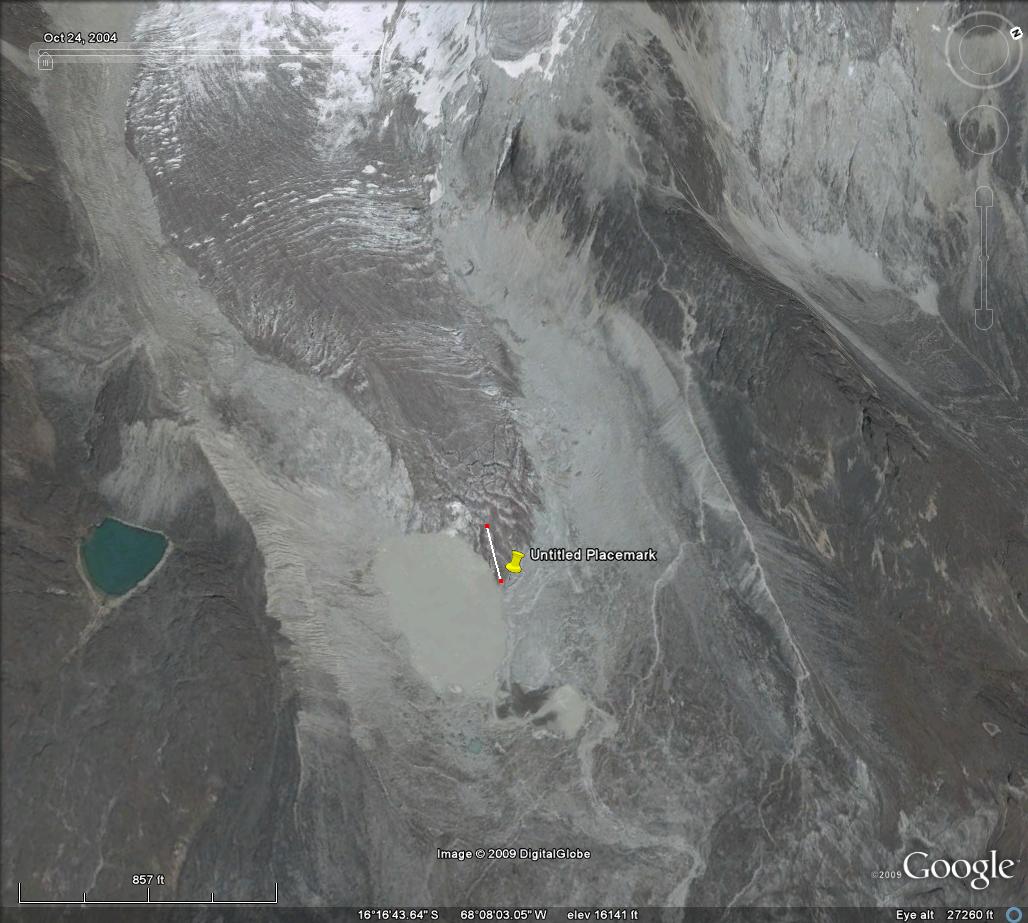

Zongo Glacier continues to have an accumulation zone, a necessary essential for glacier survival, and unlike the nearby Chacaltaya Glacier which has disappeared in 2009, it will exist for sometime. The Chacaltaya Glacier is a small glacier, like 80% of the glaciers in this region of the Cordillera Real, and its disappearance puts more pressure on the water resources provided by the larger remaining glaciers such as Zongo Glacier.
Khumbu Glacier Decay
The Khumbu Glacier is a large debris-covered glacier in the Khumbu region. It is one of the more famous and often visited Himalayan glaciers as it is the key route for climbing Mount Everest. About 12 km long, it drains mainly from the West Cwm between Mt. Everest and Lhotse and ranges in altitude from over 8000 meters to 4900 m. The equilibrium line separating the region where snow typically persists through the year is 5600 m. Melting is very limited above 5800 m. The famed Khumbu Icefall transitions the glacier from the accumulation zone to the ablation zone. The ablation zone is where melting dominates. Base camp for climbing expeditions is on a debris covered portion of the glacier below the Khumbu Icefall, Pumori Lake is about one mile away. The debris cover is brought down by avalanches and exposed at the surface via melting. In the lower picture it is evident that the lower 10 km of the glacier is dominantly debris covered. 
 The Kathmandu-based mountain research institute, ICIMOD, reports that the Khumbu Glacier is retreating at an average of 20m per year. The length of the glacier has shrunk from 12,040m in the 1960s to 11,100m in 2001. This 1 kilometer retreat has been consistently between 15 and 20 m per year during this interval. This retreat is less than nearby Ngozumpa Glacier and Imja Glacier. Everest Base Camp has actually dropped from 5,320m to 5,280m since Hillary and Tenzing first set up camp there more than fifty years ago. This 40 m of thinning at the base camp has occurred over this 55 year period. Base camp is on the right side of the glacier in this view notice the small colored blotches.
Measurements of velocity on the glacier by Nakawao and others (1999) noted that the Khumbu Glacier near the climbing base camp slowed by 10% between 1958 measurements and 1995 measurements. Kadota and others (2000) surveyed the Khumbu glacier in 1995 and compared the results with those of the 1978 survey. They found that the surface of the glacier lowered about 12-15 meters over most of the length but by only 6-8 meters near the terminus. A recent paper by Bolch et al (2008) compared a Corona DTM 1962 image and the ASTER DTM 2002 of Khumbu, Glacier. During this interval the Khumbu Glacier thinned in the ablation zone by an average of 17 m, This is a rate of 0.4 m/year.
Bolch et al. (2008).
Thinning at base camp of 40 meters is greater than at the terminus. The result is a reduced glacier slope. Reduced slope and thickness both lead to deceleration. The reduced thickness loss at the terminus is due to the debris cover thickness increasing towards the terminus. The same story is playing out on the Satopanth Glacier(Image from Jeff Engels)  Takeuchi and others (2000) noted that for Khumbu Glacier debris cover less than 5 cm increases ablation, debris greater than 5 cm in thickness reduces ablation. On Khumbu Glacier their ablation measurements indicate that ablation is reduced 40% from that of clean ice when the debris cover is 10 cm thick. Thicker debris cover reduced ablation even more, but only slightly. This is the primary reason why thinning has been less near the terminus.
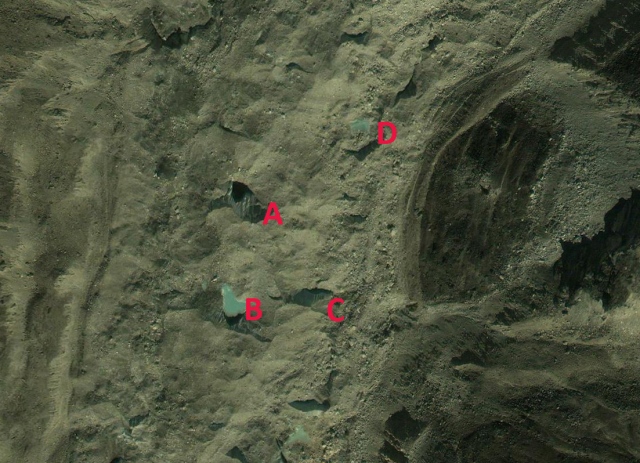
Naito et al. (2000) developed a model coupling mass balance and flow dynamics of debris covered glaciers and applied it to the Khumbu Glacier. The model predicts formation and enlargement of a depression in the lower ablation area about 5 km upstream of the terminus. This depression could transform into a glacier lake in future. Given the more rapid melting upglacier of the terminus and the low surface slope of this glacier, this is a reasonable result. The movement of the glacier can be tracked by examining the movement of supraglacial lakes downglacier. Below is 4 lakes denoted in a 2003 and 2009 image, the mean movement has been 120 m, 20 meters/year. 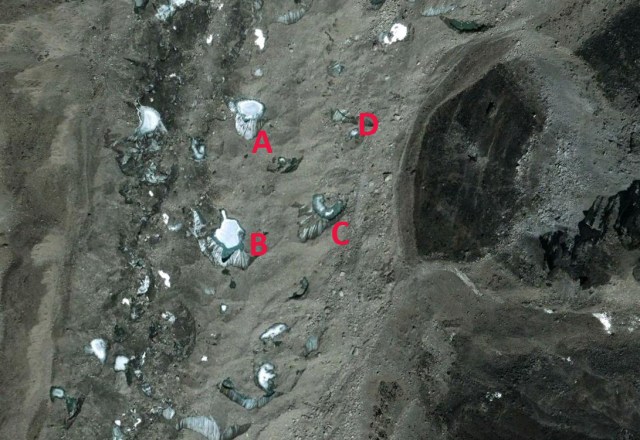
Given the slow rate of retreat and the 3000 m of altitude range above the current snowline the Khumbu Glacier is not in danger of disappearing with current climate. The entire Western Cwm the flat cirque seen beneath Nuptse, Lhotse and Everest here is in the permanent snow zone above 6000 m. The icefall then descends to 5400 m. The terminus is at 4900 m. It is not difficult to imagine this lower section of the glacier below the icefall wasting away. It is likely that a substantial proglacial will develop as is occurring at Ngozumpa Glacier and has occurred at Imja Glacier. 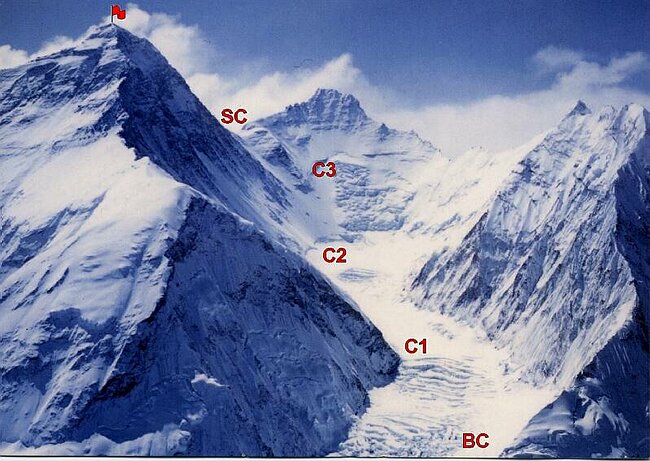

Kadota, T., K. Seko, T. Aoki, S. Iwata, and S. Yamaguchi. 2000.
Shrinkage of the Khumbu Glacier, east Nepal from 1978 to
1995. IAHS Publ. 264 (Symposium at Seattle 2000 – Debris-
Covered Glaciers), 235–243.
Naito, N., M. Nakawo, T. Kadota and C.F. Raymond. 2000.
Numerical simulation of recent shrinkage of Khumbu Glacier,
Nepal Himalayas. IAHS Publ. 264 (Symposium at Seattle 2000 –
Debris-Covered Glaciers), 245–254.
Nakawo, M., H. Yabuki and A. Sakai. 1999. Characteristics of
Khumbu Glacier, Nepal Himalaya: recent changes in the debriscovered
area. Ann. Glaciol., 28, 118–122.
Yakutat Glacier Rapid Retreat, Alaska
The Yakutat Glacier during the 1894-1895 Alaskan Boundary Survey ended near a terminal moraine on a flat coastal outwash plain. By 1906 the glacier had retreated from the moraine and a new lake was forming. Harlequin Lake. Surveys of the terminus of the glacier indicated a retreat of 1 kilometer in that decade. From 1906-1948 the glacier retreated an additional 5 km. From 1948-1958 the glacier retreated 3.6 km. The retreat is evident in comparing the Yakutat B-3 quadrangle, from 1958 photography, and Landsat imagery from 1984, 2010 and 2013. Points A-D are the same in each image and the yellow dots are the terminus. In 1984 the terminus was just retreating from a peninsula marked A, the valley at D was filled with ice, there was no break in the surface at C and B was well inland of the terminus. By 2010 the glacier had retreated from A, the valley at D was deglaciated, a small strip of bedrock-sediment was exposed at C from what had been beneath the glacier, and B was still well inland of the terminus. By 2013 the northern arm of the glacier had retreated 6.4 km from the peninsula at A toward the peninsula at B. The central arm of the glacier toward C had retreated 7.5 km and the retreat on the southern edge of the glacier was 6.5 km. The glacier had retreated on average more than 6.6 km in 30 years, a rate of 220 m/year. The retreat was most rapid from 2010-2013, when the glacier retreated 3 km.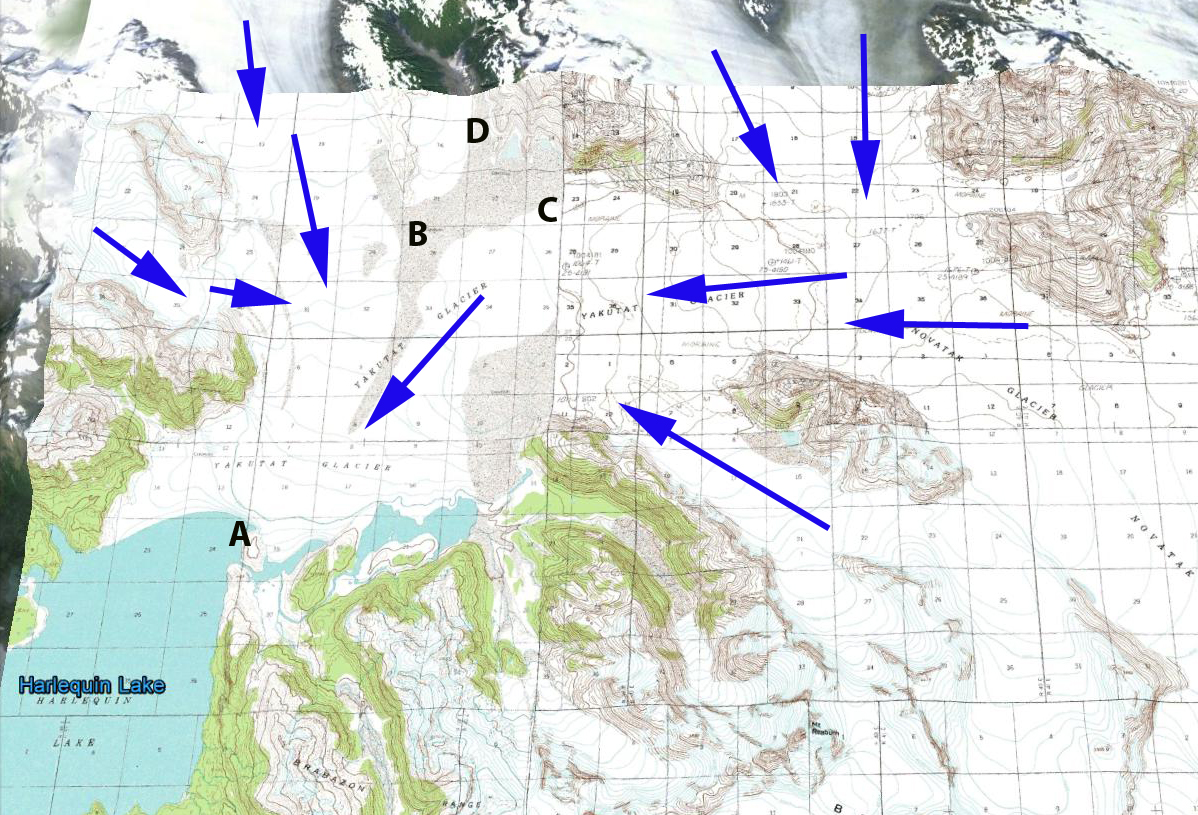
Yakutat terminus map
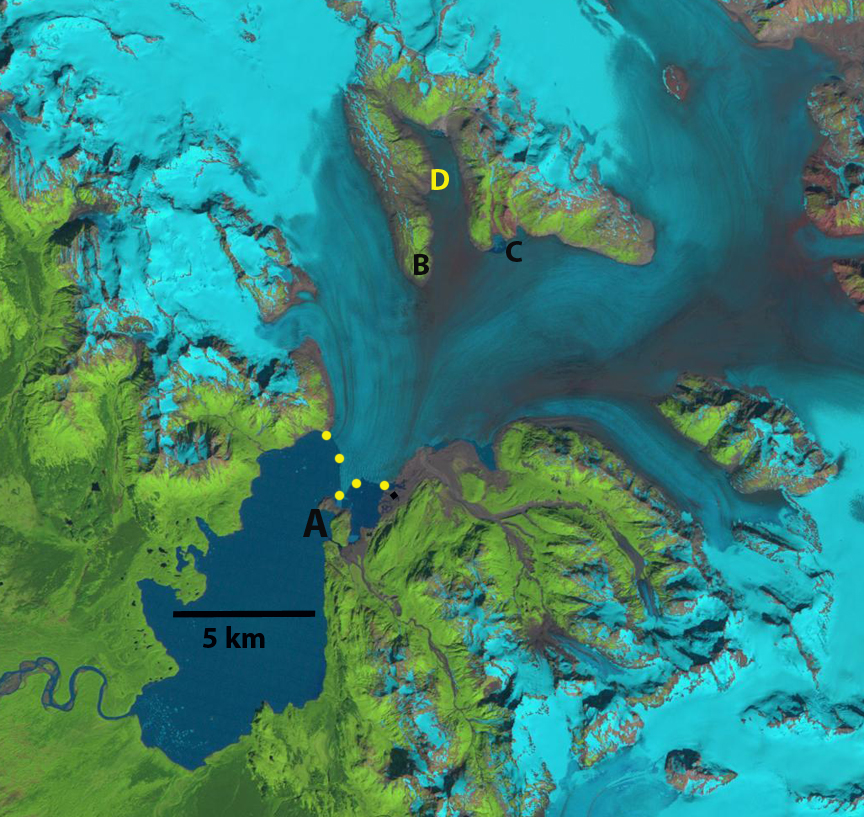
1987 Landsat image
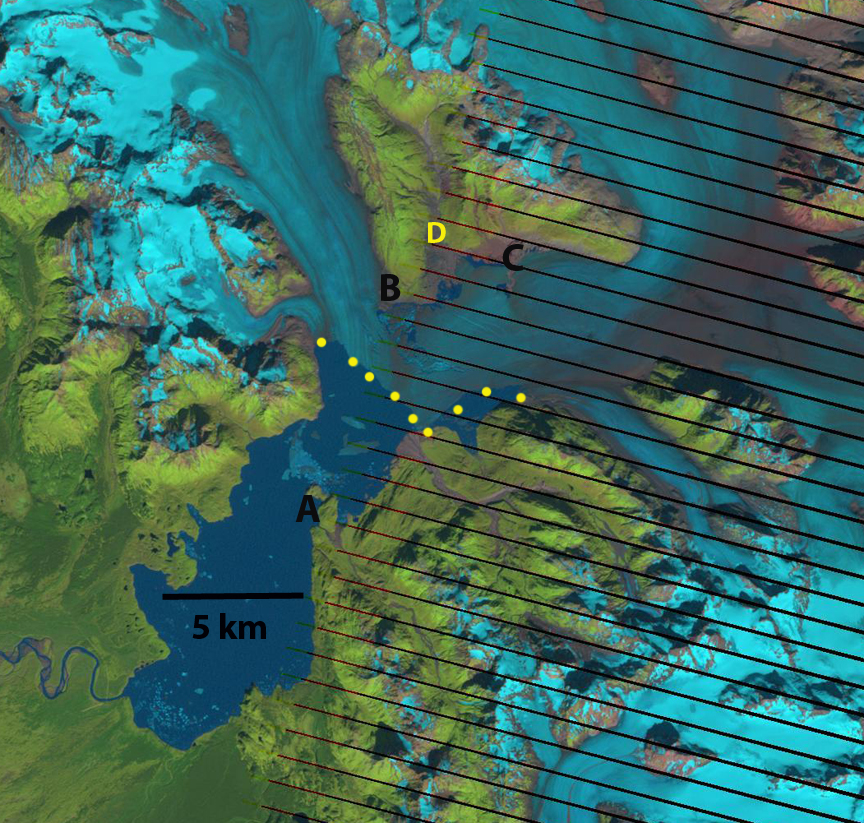 2010 Landsat image

2013 Landsat image.
Today the glacier is the focus of a study by the University of Alaska, led my Roman Motyka, Martin Truffer and Chris Larsen
They have set up a time lapse camera to record frontal changes. The goal is to understand the controls on calving into Harlequin Lake of this glacier. More amazing than the retreat has been the observed thinning of the glacier. The glacier has thinned by more 200 m on average according to the preliminary thickness change maps from the UAF project (Truessel et al 2013). The Yakutat Glacier does not have a high accumulation zone and the recent increase in the snowline elevation and thinning of the glacier have led to a substantial shrinking of the accumulation zone and thinning of the glacier in the accumulation (Truessel et al 2013). This glacier does not have a persistent significant accumulation zone and cannot survive (Pelto, 2010). For a calving glacier to be in equilibrium it needs to have at least 60 % of its area snowcovered at the end of the summer. The glacier is in the midst of a large ongoing retreat. The retreat rate and calving mechanism is similar to that of Grand Plateau Glacier, Bear Lake Glacier and Gilkey Glacier. However, unlike these Yakutat Glacier lacks an accumulation zone, a better analog is East Novatak Glacier, which also has a lower elevation accumulation zone. 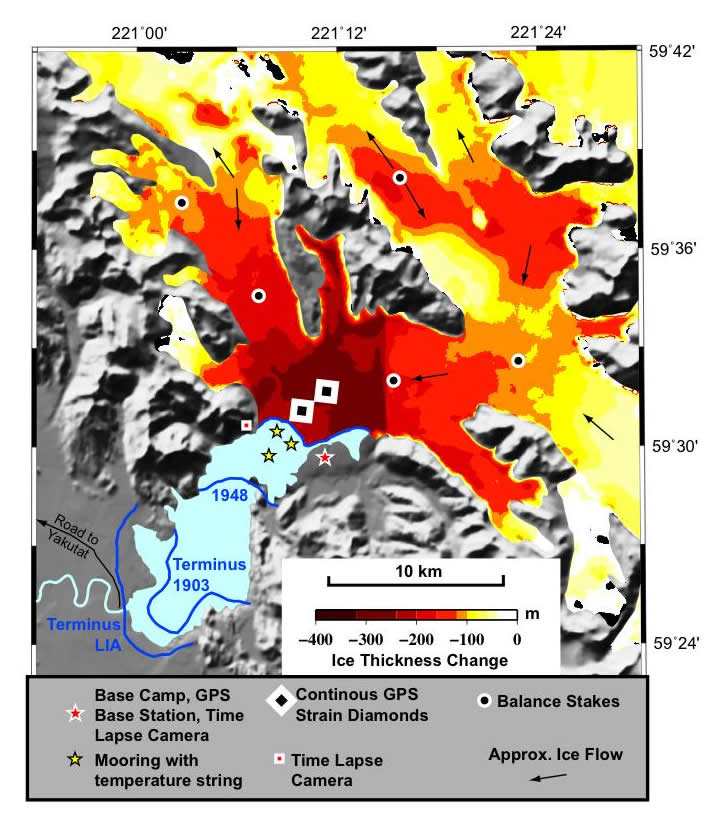
Tasman Glacier Retreat
Update for 2/22/2011-the Tasman Glacier’s thin and weak terminus area, see in the GE image below, in Tasman Lake shed some large icebergs due to the earthquake generating some substantial waves in the lake. The post earthquake image with numerous fresh icebergs is the second below and is from the EPA. 
 No word on the Hooker Glacier in the next valley west, which also calves into an expanding lake or Murchison Glacier in the next valley east. There is a Tasman Glacier update in 2013.
 . The New Zealand National Institute of Water and Atmospheric Research has been examining the changes in volume and snowline on New Zealand Glaciers since 1977. This survey has concluded for 2009 they same observation as for 2007 and 2008, the glaciers are shrinking. An examination of the recent volume changes on the glacier indicate that the volume has been particularly negative since 1998.
 . This followed a period of relatively positive mass balance from 1990-1997, which made the New Zealand glaciers the least rapidly retreating glaciers in the world. For Tasman Glacier the retreat has been ongoing, the NWIA has noted a retreat of 180 m per year on average since the 1990’s. The proglacial lake at the terminus continues to expand as the glacier retreats upvalley. The lake is deep with most of the lake exceeding 100 metes in depth, and the valley has little gradient, thus the retreat will continue. It has been noted by researchers at Massey University that it is just to warm for the terminus area at 730 m to endure. Imagery of Tasman Glacier indicates the future it faces. There was no lake in 1973 and now it is more than 7 km long. The glacier appears quite rotten along the ice margin and poised for further retreat. The glacier drains a valley just east of the highest mountains in the range Mount Cook and Mount Tasman.
  . The image above has a blue line up the center of the glacier from the former terminus at the end of the lake too the head of the glacier. The upper image is from 2007 and the lower image from 2009. In the latter image the lake has expanded considerably. The disconnected lakes and debris covered ice on the left side-west side of the glacier has been replaced by all lake. Icebergs are afloat in this lake, they do not survive very long. The debris cover itself insulates the glacier ice from melting, slowing the process. However, the process due to the warmth and increased melting of the last decade has been increasing.


In the image below is a closeup of the section of ice that has now disintegrated, before it did. You can see the crevasses in some of the icebergs too. This is a rapidly changing environment due to the ongoing climate warming.
Grasshopper Glacier, Montana-nearly gone
Grasshopper Glacier, the largest is located about 19 km. north of Cook, Montana within Custer National Forest. The glacier on Iceberg Peak occupies a north facing cirque at nearly 3300 m. (11,000 ft.). In 1940, it was about 1.6 km. wide and on its northwest side terminated in a 15-m. cliff. In 1966, seen below, the glacier had an area of 0.42 square kilometers.  The name of the glacier is derived from the myriads of grasshoppers that were embedded in the ice. These grasshoppers either were downed by sudden storms or were carried over the glacier by strong air currents, where the cold forced them onto the ice surface. The grasshoppers are an extinct type of Rocky Mountain grasshoppper Melanoplus spretus. They perished here, were buried by new snow and preserved. At the time the glacier ended in a small lake. Progressively the glacier has retreated. By 1966 it was 0.6 km long, in 1994, seen below, 0.36 km long and in 2006 0.27 km long.
In 2005 this glacier has ceased to exist as an active glacier, there are a few remnant perennial snow and ice patches the largest with an area of 0.05 km2. In the majority of recent summers the glacier has lost all of its snowcover. Glacier survival is dependent on consistent accumulation retained on the glacier each summer, this glacier will not survive. The glacier has continued its rapid recession and the further segmentation into small disconnected segments, heralds the end of an active glacier. We do have a gorgeous new alpine lake in its place. Notice the basin is still largely devoid of plant life and the surface still has the color of newly exposed-deposited sediments. 

Grasshopper Glacier in 2001 with a few crevasses near the ice front (A.Lussier Image).
Hinman Glacier, North Cascades disappears
In the USGS map for Mount Daniels-Mount Hinman in the North Cascades, Washington based on 1958 aerial photographs, overlain in Google Earth. Hinman Glacier is the largest glacier in the North Cascades south of Glacier Peak. Today it is nearly gone. Hinman Lake, unofficial name, has taken the place of the former glacier, which still has a couple of separated relict ice masses. From 1984-2007 all 47 glaciers observed by the North Cascade Glacier Climate Project receded. Hinman Glacier has had one of the more dramatic retreats. Immediately below is the 1965 Mount Daniels Quadrangle USGS map of the glacier. The glacier extends from the top of Mount Hinman at 7600 feet to the bottom of the valley at 5000 feet. The next image is of Hinman Glacier from the west in 1988,the Hinman Glacier is now a group of four separated ice masses, three are significant in size still. The third image in the sequence is the 1998 aerial image of the glacier a few areas of blue ice are seen, the glacier is 20% of its mapped size. There are still three sections of remanant blue glacier ice. The next picture in the chain is the glacier in 2006, from a Google Earth image,at this point the glacier is no longer detectable under the snowcover, note the map outline and the gorgeous new unnamed Lake Hinman. The new lake 0.6 miles (one kilometer long). Lastly is a 2009 view from the far end, north end of Lake Hinman up the valley and mountain side that was covered by the Hinman Glacier, now 90% gone. Each of the two larger ice masses from 1998 is now divided into at least two smaller portions. This is no longer a glacier and is just a few relict pieces of ice, the largest has an area of 0.05 square kilometers. 


Pine Island Glacier Grounding Line Updated 2012
The Pine Island Glacier is a principal outlet glacier of the West Antarctic Ice Sheet draining into the Amundsen Sea. The ice stream is 40 km wide as it reaches the sea. Recent retreat, thinning and acceleration have focussed attention on this glacier. This is a brief note in support of a RealClimate article. The grounding line is of principal concern here. This is where the glacier goes afloat. The grounding line is where the bottom of the glacier comes in contact with the ground, in this case the sea bottom. The grounding line is an anchoring point for the outlet glaciers. The length of the glacier that is grounded is being both slowed and stabilized by the basal friction. Beyond the grounding line toward the margin the floating ice shelf is susceptible to a rapid calving retreat and as the grounding line retreats, so would the calving front. Note in the image below that the current grounding line is on relatively high terrain, but is close to a deep basin. The annotated image below is from a British Antarctic Survey image, taken from their autosub program exploring beneath the ice shelf of the Pine Island Glacier combined with data from radar altimeter data flown by NASA. The second image below is a profile of depth under Pine Island Glacier from (Shepard et al, 2001)that indicates that beyond the grounding line the depth remains more than 1000 meters below sea level for approximately 200 km. 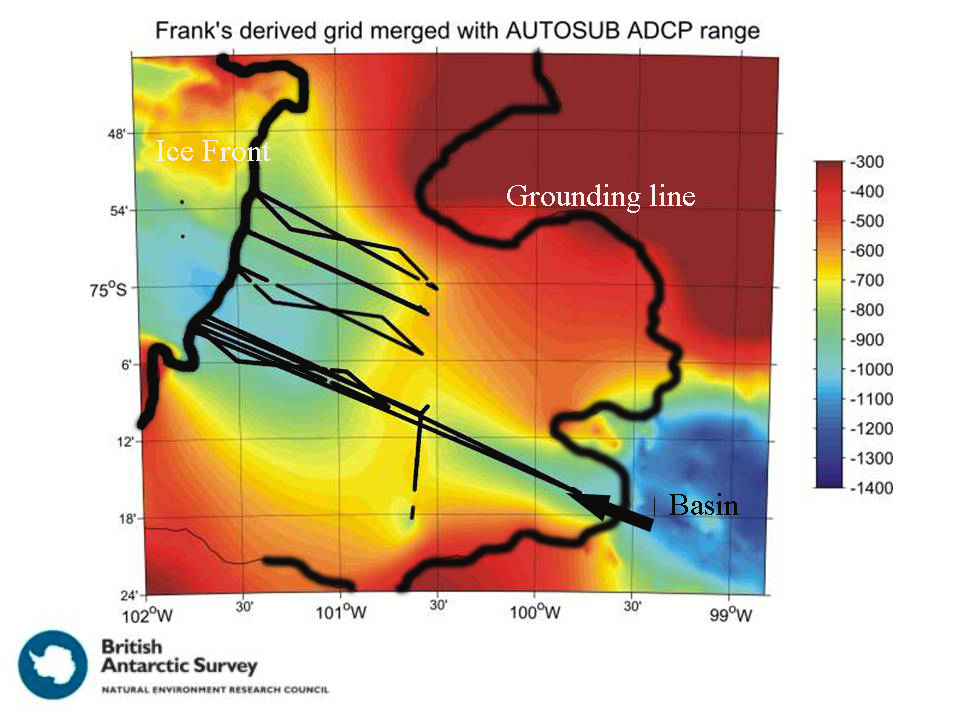
 Grounding line retreat could lead to the glacier retreating into this basin, not a stable situation. Basal melting is of particular concern, has been calculated to exceed 15 m/year. In addition the formation of basal crevasses which are much wider than surface crevasses may be critical in the rifting process. The British Antarctic Survey, NASA and several universities in particular have been focusing on this glacier. The second image shows the grounding line in the surface. This is an annotated satellite image from NASA. Just above the grounding line you can note that the surface of the glacier has some large scale roughness which indicates the impact of the sub-glacier topography.
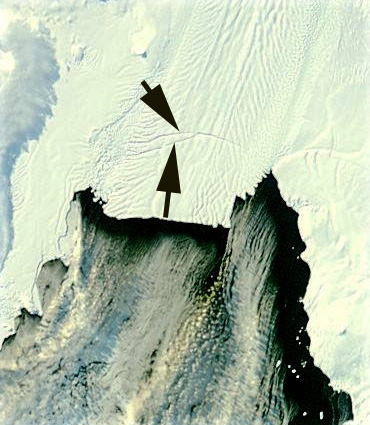
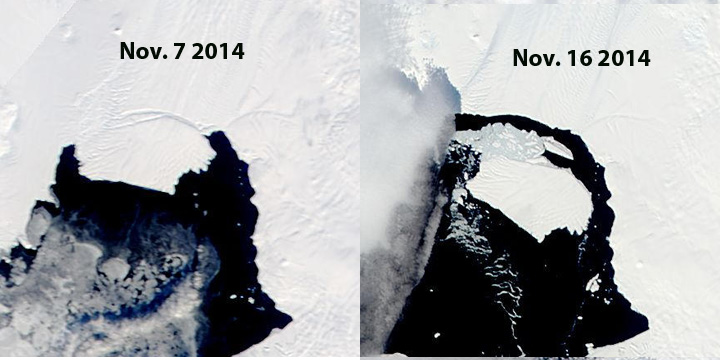
 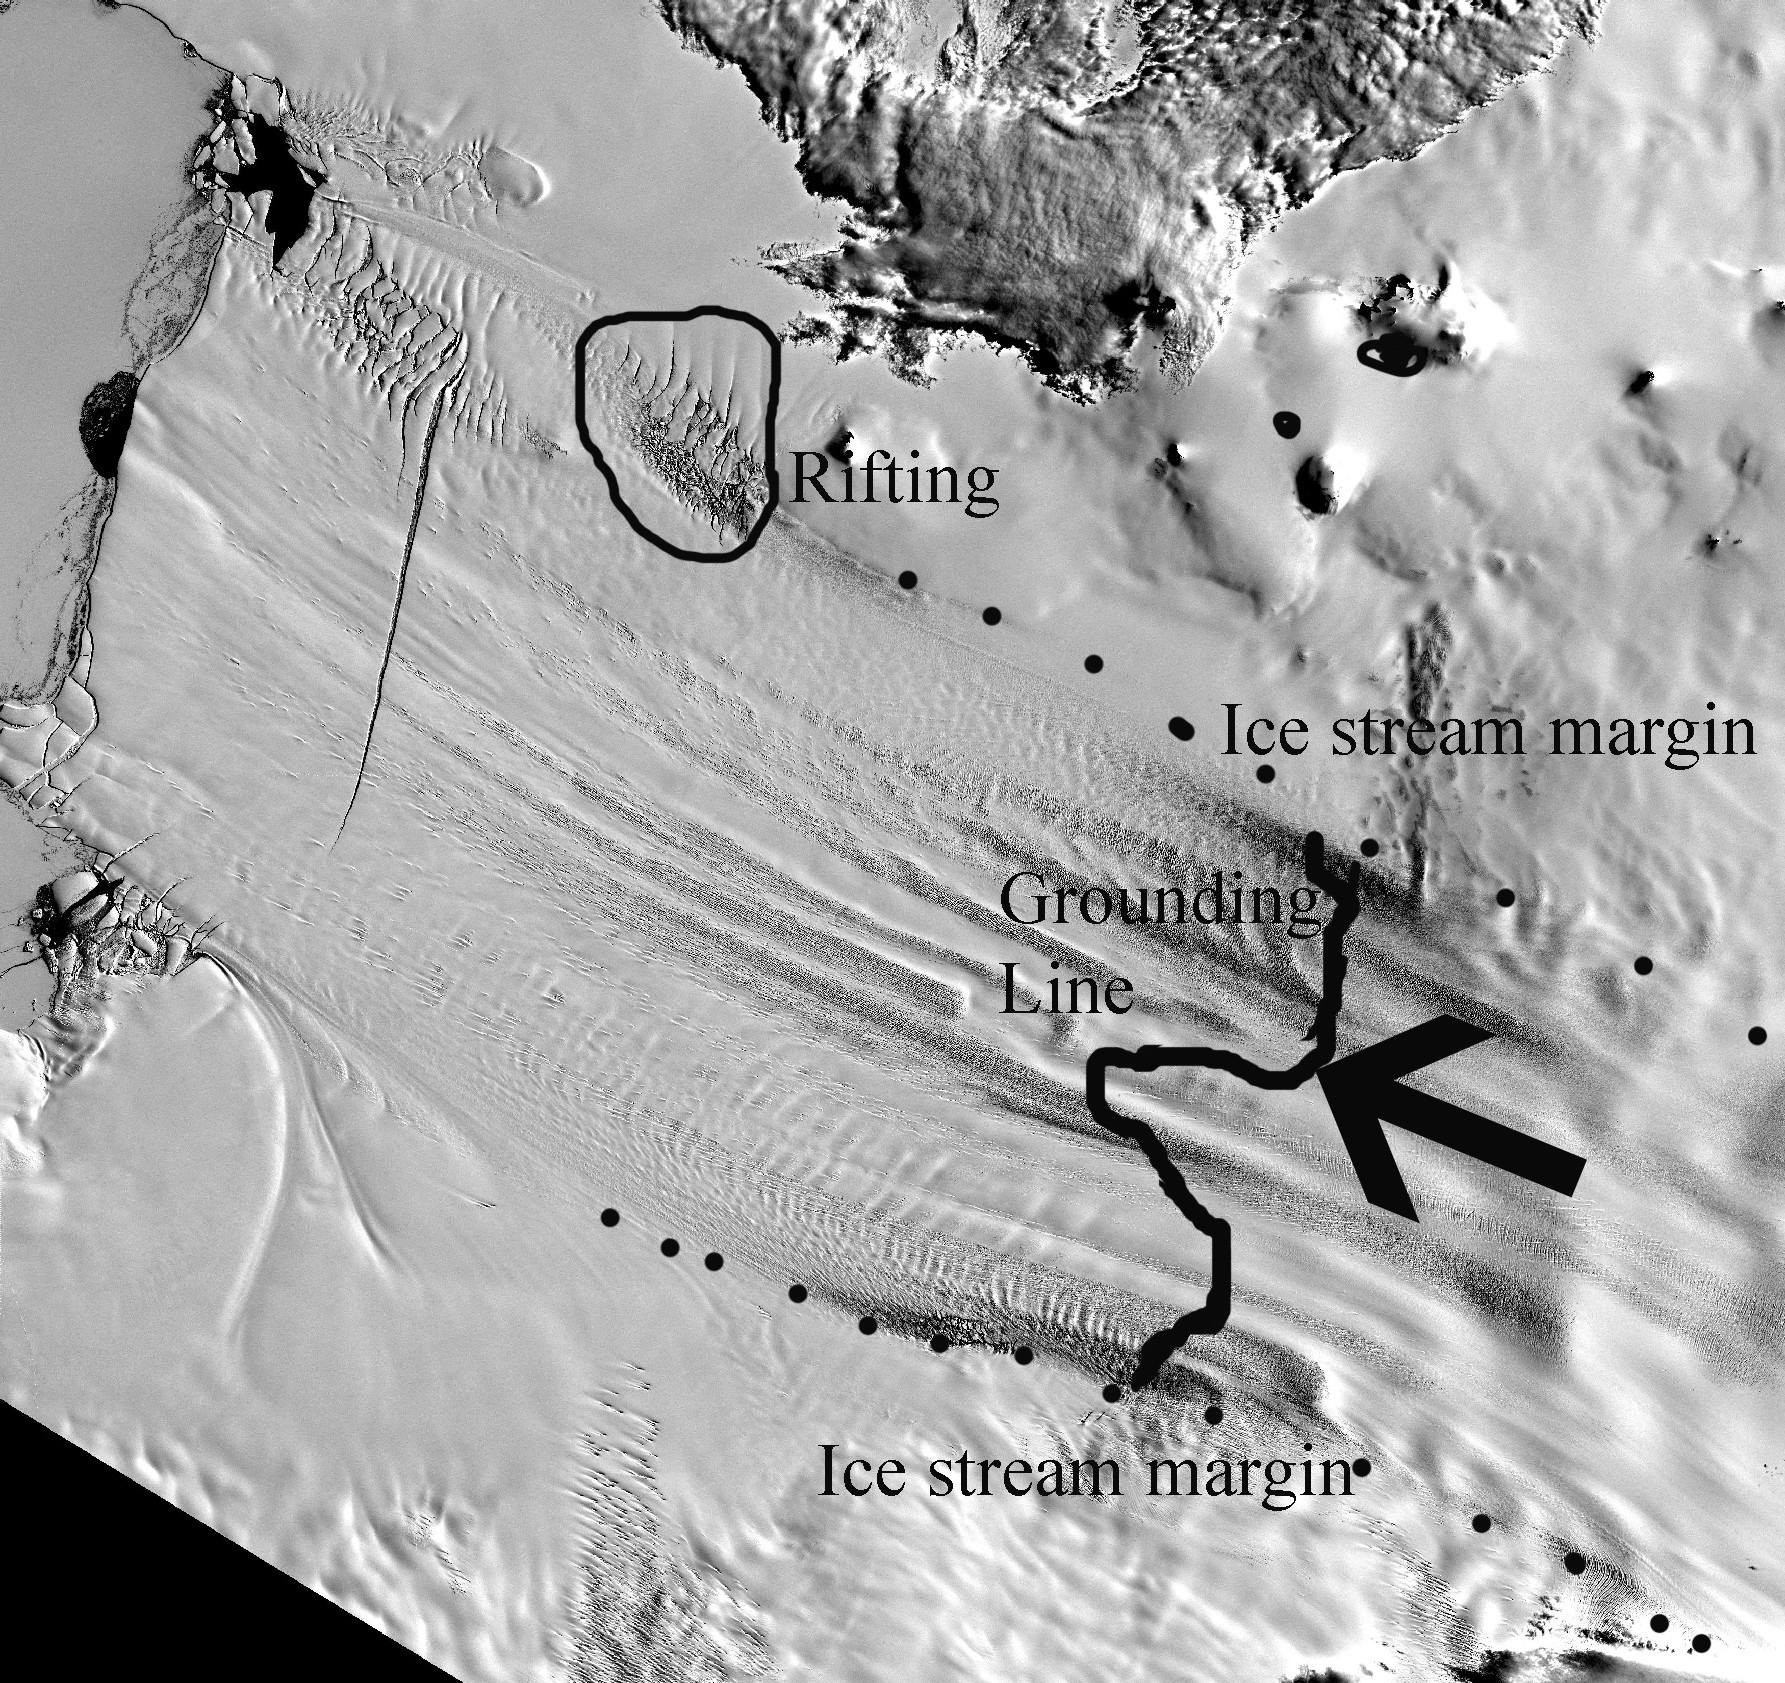 This topography acts to slow and buttress the glacier. This area is above the topographic rise from the deep basin to the higher terrain of the current grounding line. The ongoing focus on the Pine Island Glacier will be fascinating to watch. In particular the emphasis on the oceanographic aspects beneath the ice shelf. The melt rates beneath the ice shelf are significant, on the order of 15 m/year. This is an aspect that has received less attention and will certainly yield interesting results, considerable technologic frustrations and innovations. The nearby Smith Glacier has experienced a similar inland spread of rifting and retreat. In 2011 an additional rift has formed that is 20-25 km inland of the calving front, first noted by NASA’a Operation Icebridge. November 3, 2011 MODIS imagery is seen below. The rifts in both 2001 and 2011 have begun on the east edge of the ice stream an propogated westward. The propagation is more likely as an exploitation of basal crevasses then surface crevasses. The rift from 2011 led to iceberg formation in the fall of 2013 as seen in MODIS images.
 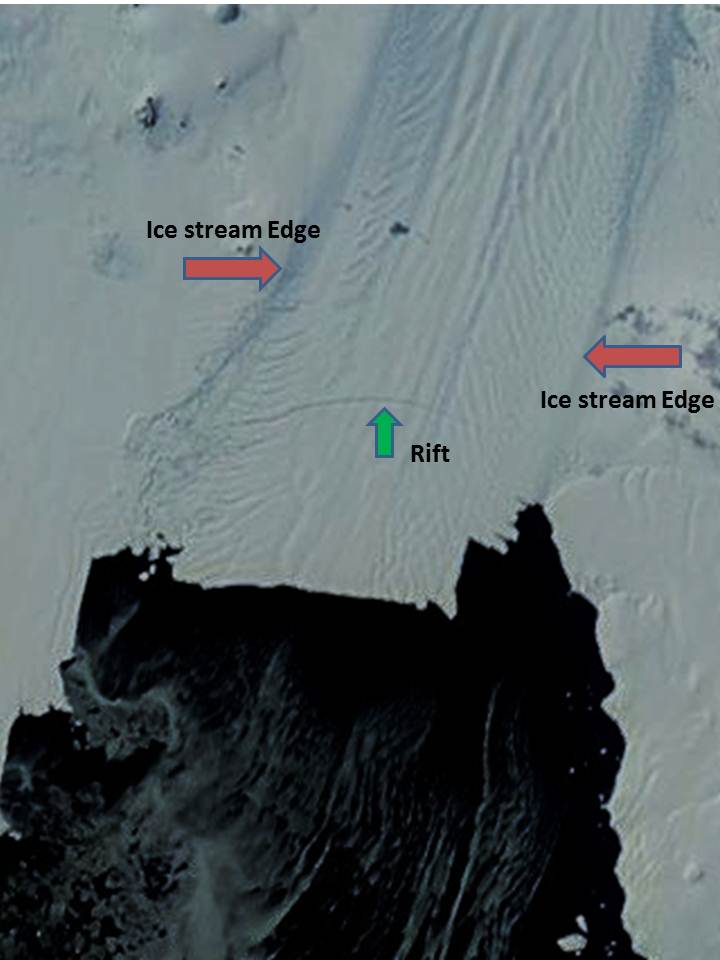 On October 5, 2011 MODIS imagery indicates no rift. By Sept. 17, 2012 a second rift parallel to the first had developed.
Denali National Park, East Taklanika Glacier retreat
The glaciers of Denali National Park are shrinking. The National Park Service has been chronicling the retreat with repeat photographs of glaciers from locations where historic photographs exist. The program has been a cooperation between glaciologist Guy Adema and photographer Ron Karpillo. One example is East Taklanika Glacier. This glacier drains north from the east ridge of Mount Scott. The glacier is currently 5.1 km long, the lower 2.2 km of the glacier is nearly completely debris covered. That ice is beneath the debris is clear from the lack of a the glacier melt fed river in the valley bottom and the color of the sediments which is darker, largely because the debris is wet from the ice melt underneath. The glacier in the center of the Google Earth satellite view below is East Taklanika Glacier. 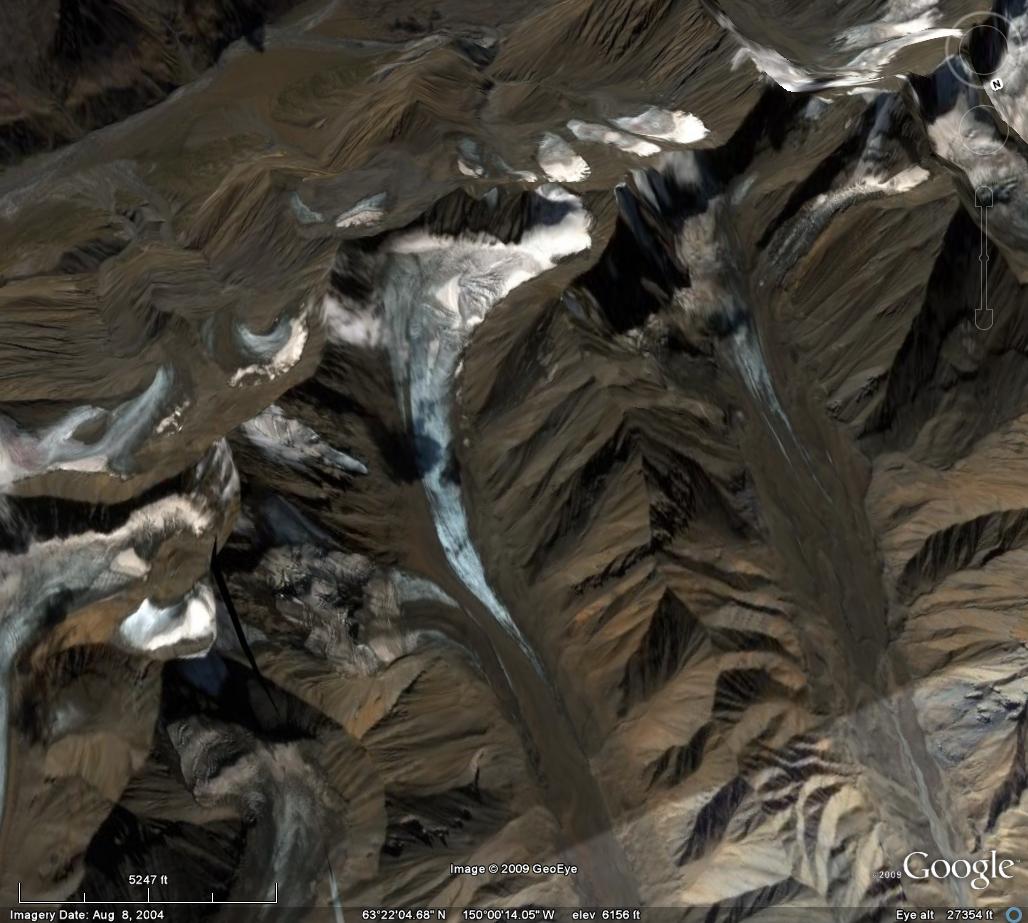 The glacier has retreated 1100 m between 1916 and 2004 in the phtographs of Ron Karpillo and Stephen Capps. There is a lateral moraine in the foreground of the 2004 Ron Karpillo image. This marks the former surface elevation of the glacier during the Little Ice Age. Since that time the lower section of the glacier has lost over 100 m of ice thickness.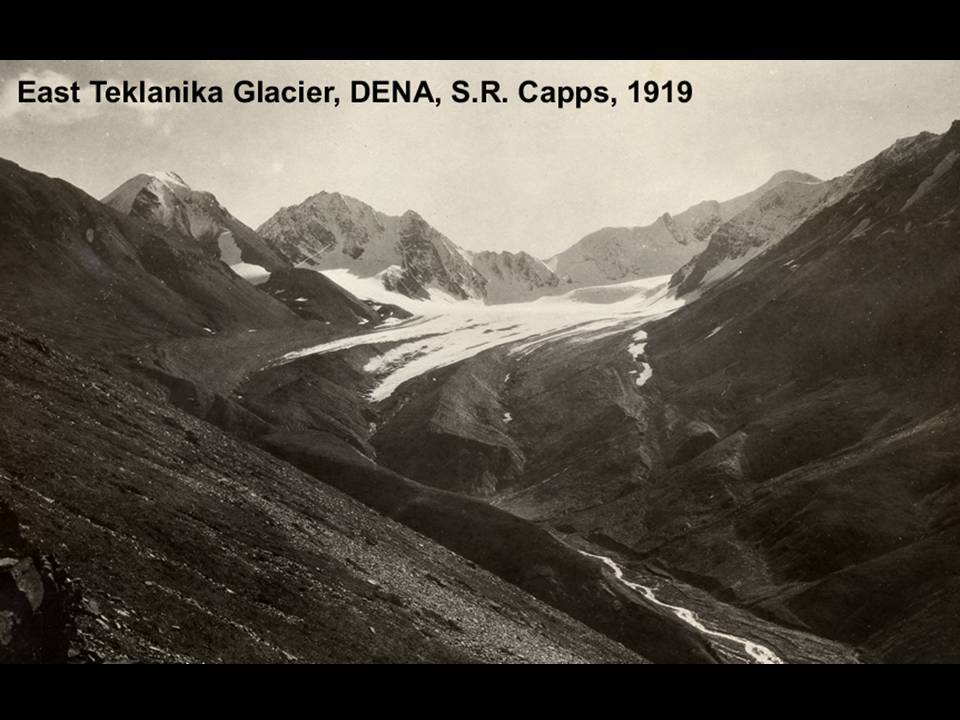
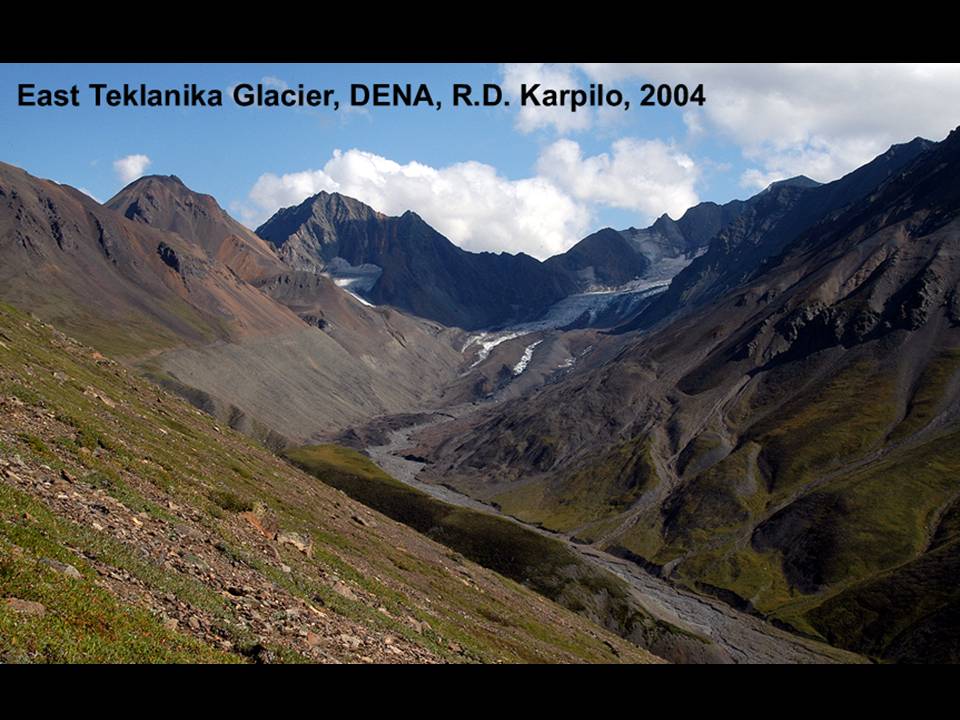 The retreat is ongoing. Medial moraines are bands of debris on the surface of a glacier that separate tributaries of a glacier. The moraines represent material eroded from the edge of the tributaries before they join. This material does not appear at the surface until you reach the ablation zone where melting dominates. In the accumulation zone such debris bands would be buried. On East Taklanika Glacier the debris bands extend to within 1 kilometer of the head of the glacier. For a glacier to be in equilibrium a glacier needs to have at least 50 % of its area in the accumulation zone at the end of the summer. Based on the satellite image hear showing 10% of its area in the accumulation zone and the extent of the medial moraine indicating no more than 25% of the glacier area above the moraine. This glacier needs to lose the lower 2-3 kilometers to be in equilibrium. This may not be enough. A glance at the glaciers around East Taklanika, indicate the same story, very little retained snowpack. Some of these glaciers have an accumulation area ratio (% of glacier snow covered at the end of the summer), of zero. This is like having no income, and plenty of expenditures and the result for your bank account, net loss and without some change eventual bankruptcy. The story of retreat is the same though the snowpack extent greater on the Juneau Icefield. The retreat of East Taklanika is slowed considerably by the debris cover which protects the ice underneath from melting as fast. This glacier is a long way from completing its retreat to adjust to current climate.