Above is a paired Landsat image from 1984 left and 2013 right indicaing the 3200 m retreat during this period of Gilkey Glacier.The Juneau Icefield Research Program has long monitored the mass balance of the Lemon Creek and Taku Glacier on the Juneau Icefield. This program begun by Maynard Miller in 1946 and continuing through today has also monitored the terminus behavior of the icefields outlet glaciers. Of the 17 significant outlet glaciers 5 have retreated more than 500 m since 1948, 11 more than 1000 m, and one glacier the Taku has advanced. I have a chance to visit the glaciers during a number of summers over the last 25 years as part of this ongoing annual program. The Gilkey Glacier is a 32 km long 245 km2 outlet glacier flowing west from the Juneau Icefield. In 1948 it terminate at the head of a braided outwash plain. At that time it was joined 5 km above the terminus by the Battle and Thiel Glaciers from the south.
  All three of these glaciers drain from the Juneau Iceifeld accumulation zone between 1500 and 2000 m, which maintain consistent snow cover. From 1948 to 1967 the Gilkey Glacier retreated 600 m and in 1961 a proglacial lake began to form. By 2005 Gilkey Glacier had retreated another 3200 m , generating a proglacial lake that is now 3.9 kilometers long, which is approximately the amount of retreat in the last 60 years as well.
  The lake is partly filled with large icebergs from disintegration of the, note below in an image from Scott McGee of JIRP,Gilkey terminus. The lake is currently terminating in this still growing lake. Approximately half of this retreat occurred after a 1991 satellite image indicated the lake was close to half its current size. The retreat has been resulted from calving icebergs into the new lake as well as thinning from melting in the lower reach of the glacier. The extensive debris cover and lack of crevassing in the lower 1500 meters of the glacier indicates that this section is stagnant and will break up soon.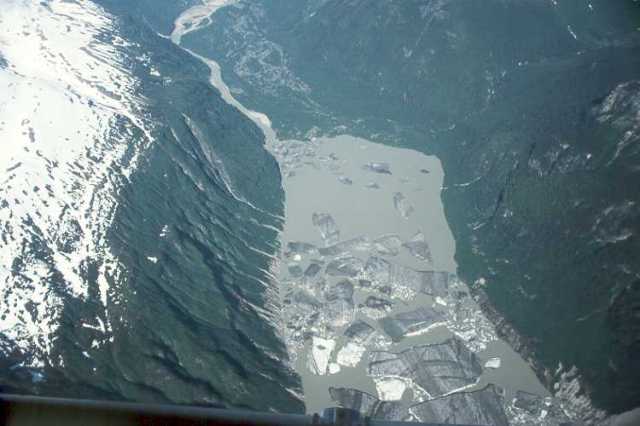
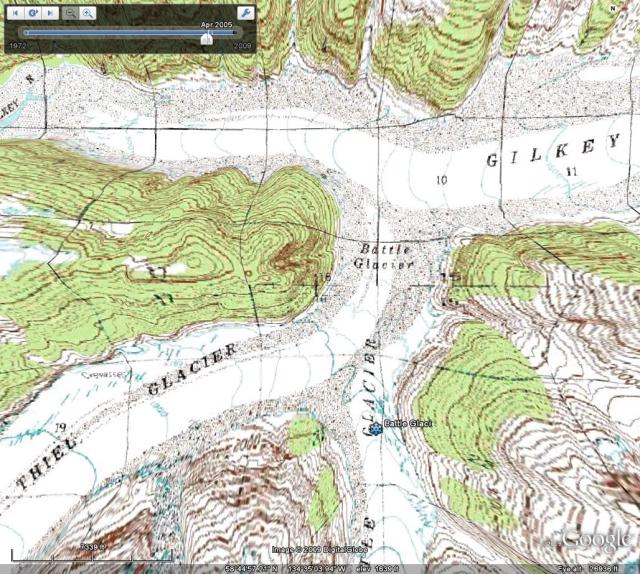
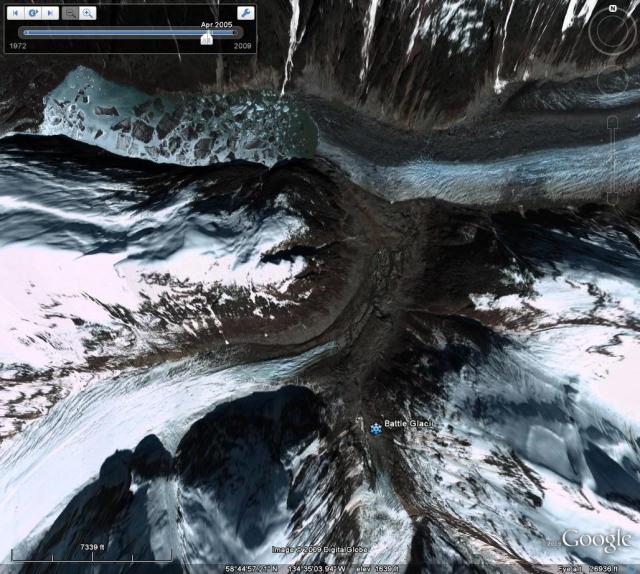
Gilkey Glacier was in 1955 joined by the tributary glaciers Battle and Thiel Glacier. A visit to the Battle Glacier in 1982 indicated that it had separated from the Gilkey Glacier and the Thiel Glacier, but the Thiel Glacier was still connected. By 1991 the Thiel Glacier had separated. Today these glaciers terminate 3200 m and 1700 m up their respective valleys from Gilkey Glacier. Thiel has retreated 1700 m from the Gilkey Glacier. A retreat of 3200 m has created a glacier 70 % its former length. The vast bare valley beyond the terminus is in stark contrast to the map above. Thiel Glacier has extensive lateral moraines extending above the glacier terminus indicating the ongoing retreat. The lower 3 kilometers of this glacier are flat and are downwasting, indicating a substantial retreat is still underway. A view up the valley from the Gilkey toward the terminus of Battle Glacier indicates that most of the area deglaciated was a flat low elevation valley. Now that the glacier is retreating up a steeper slope, the retreat rate of Battle Glacier should slow.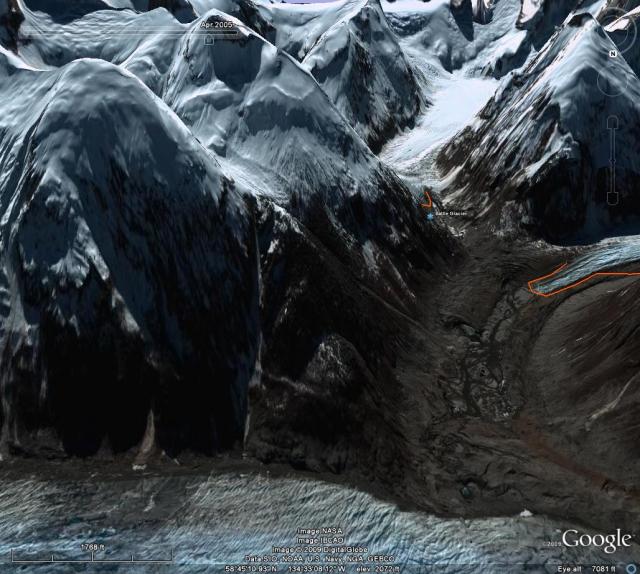
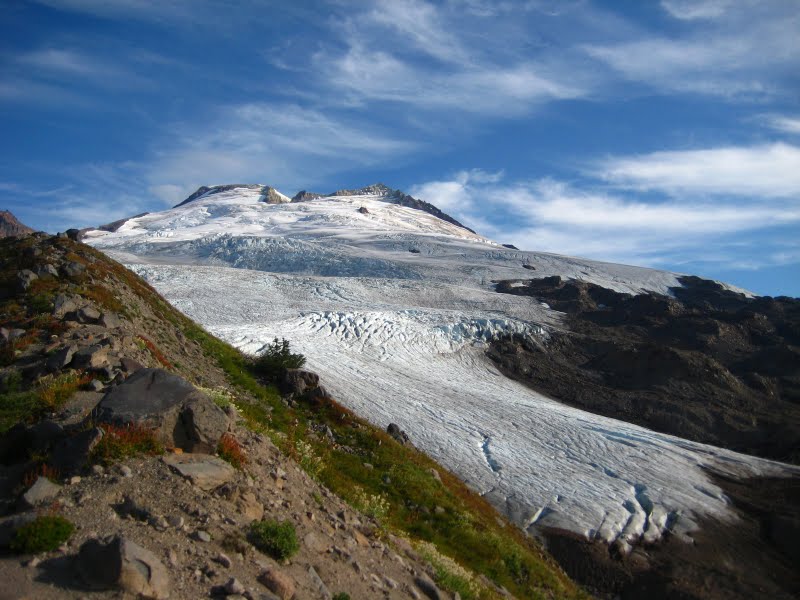
 Easton Glacier extends from the terminus at 5600 feet to the slopes near Sherman Crater at 9000 feet. Each summer since 1990 NCGCP has measured the mass balance of this glacier. View


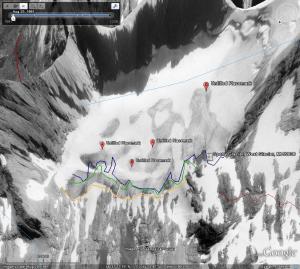
 Marginal recession averages 95 meters in this period ranging from 20-200 meters. The glacier was 1200 meters long in 1990 so this is close to a 10% loss in length. The current rate of retreat is slightly higher than the 3-5 m/a average fro the 1979-1993 period. The image in 1991 is from Aug. 25th, the glacier still has 70% of its area covered with snow from the previous winter. This is called the accumulation area ratio and in general must be above 60 at the end of the summer for the glacier to not lose mass. In 2003 the accumulation area ratio is about 30 and this is on Sept. 25th at the end of the melt season. In 2005 the accumulation area ratio is 30 at the most. Both years this limited a snowcover would lead to a significant negative mass balance, volume loss. The thinning in the upper portion of the glacier appears limited. There is not an evident change in the upper margin of the glacier. The crevassing which is indicative of movement has also not decreased much suggesting limited changes in the dynamics of the upper glacier. The comparatively slow changes in the accumulation zone, suggests a glacier that still has a consistent accumulation zone and is not likely to melt away rapidly, within the next 30 years, given the current climate. The glacier is showing no signs that it is approaching equilibrium, and that it can survive the current climate. This is in contrast to nearby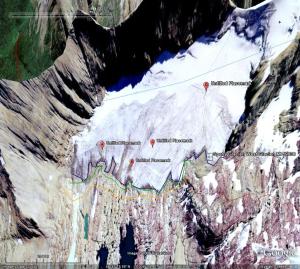

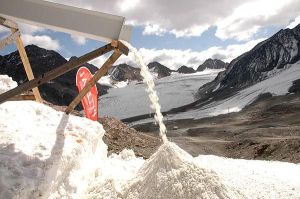
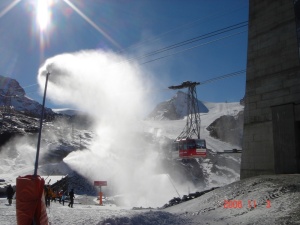
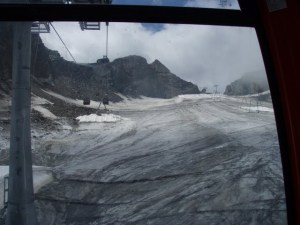
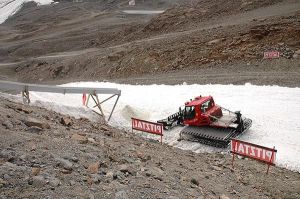 The snow produced here can be channeled directly onto the slopes below by the Gletschersee chair lift. The water for this innovative snow production system will be extracted using a vacuum system from the existing storage pools on the Pitztal Glacier. These pools are filled exclusively with melted glacier water, thus forming an ecological cycle on the glacier, returning its own meltwater as snow. After gaining experience, concrete attempts will be made to use the snow created by the Snowmaker to preserve the substance of the glacier in Austria’s highest glacier ski area. The glacier seen below has in most years been bare by late summer, not a skiable condition. The net volume loss of the glacier has also been notable.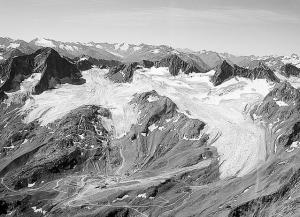
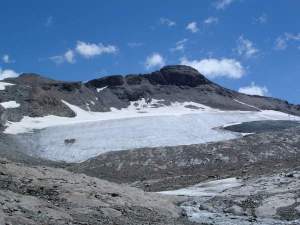
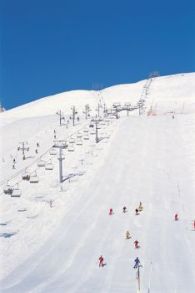
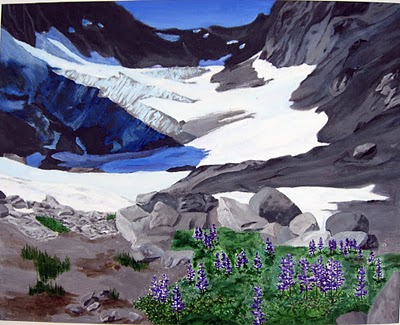 Despite the advantages of snow accumulation the glaciers mass balance since 1984 has average -0.5 m a year for a cumulative loss of 13 m. For a glacier that averages 60 m in thickness this is over 20% of its volume. Details of the
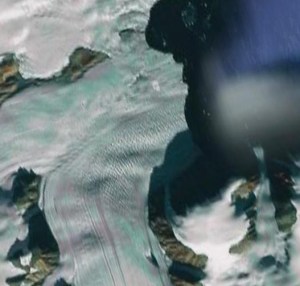 The Belcher Glacier above is the principal outlet glacier calving up to 30% of the total iceberg volume from the ice cap.
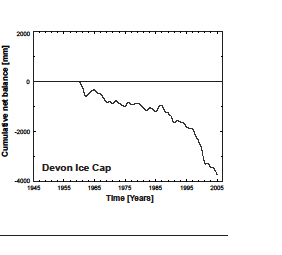 In this case the mass balance record indicates a dramatic worsening after 1995. It will be interesting to see the ablation results from the summer of 2008, when record melting was noted both in northern Greenland and northern Ellesmere Island. The glacier is not alone in its behavior, the Prince of Wales Icefield has had a negative mass balance over the last forty years of -80 km3, equivalent to a mean-specific mass balance across the ice field of -0.1 m w.e. a-1, contributes 0.20 mm to global eustatic sea level rise (
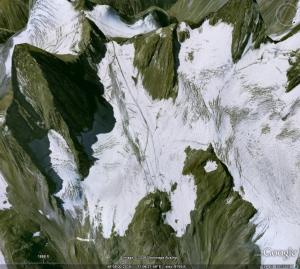 The Stubai Glacier has been retreating and thinning significantly as have most all glaciers in the Alps. Austria has a long term program monitoring the terminus position of over 100 glaciers. From 2000-2005 of the 115 glaciers observed and reported to the World Glacier Monitoring Service, all 115 experienced net retreat. The mass balance of Austrian glaciers, which represents volume loss, reported to the WGMS has been averaging a loss of more than 0.5 m per year since 1998. The loss of 5 m of ice in a decade on glaciers like the Stubai represents about 10% of their volume lost this decade. Stubai Glacier has experiences a 33% loss in its area since 1969 shrinking from 1.72 to 1.15 square kilometers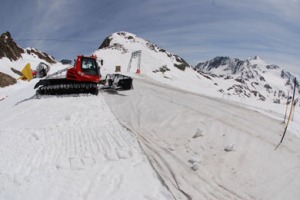
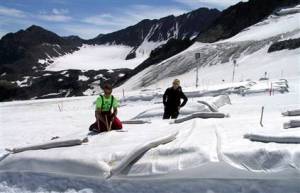 This technique reduced ablation by 60%. Is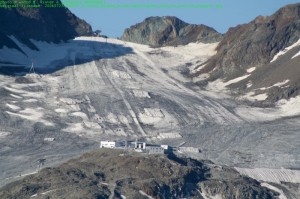

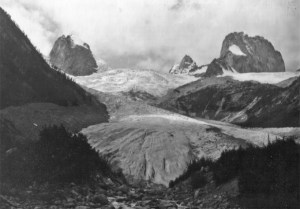 The glacier used to flow all the way to the valley bottom. The active front was both steep and crevassed By the early 1970’s the glacier had retreated from the valley bottom and had begun to retreat up the mountain slope adjacent to the Kain Hut. Snowpatch Spire is still surrounded by ice, but ice that is not as crevassed, indicating reduced thickness and velocity. The glacier than ended somewhat below where the ridge approached from the right of the glacier.
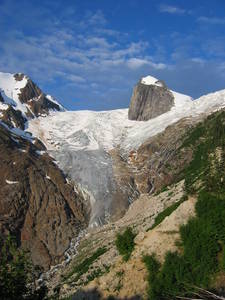
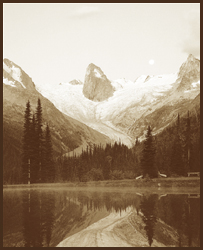 In the ensuing 34 years the glacier has continued to retreat up the slope and is notably thinner coming down the final steep slope. The glacier ends at the termination of the ridge on the right of the glacier. The glacier has retreated 420 m since 1972.
  . The first view is nearly identical to the 1972 view and the second more similar to the 1910 view
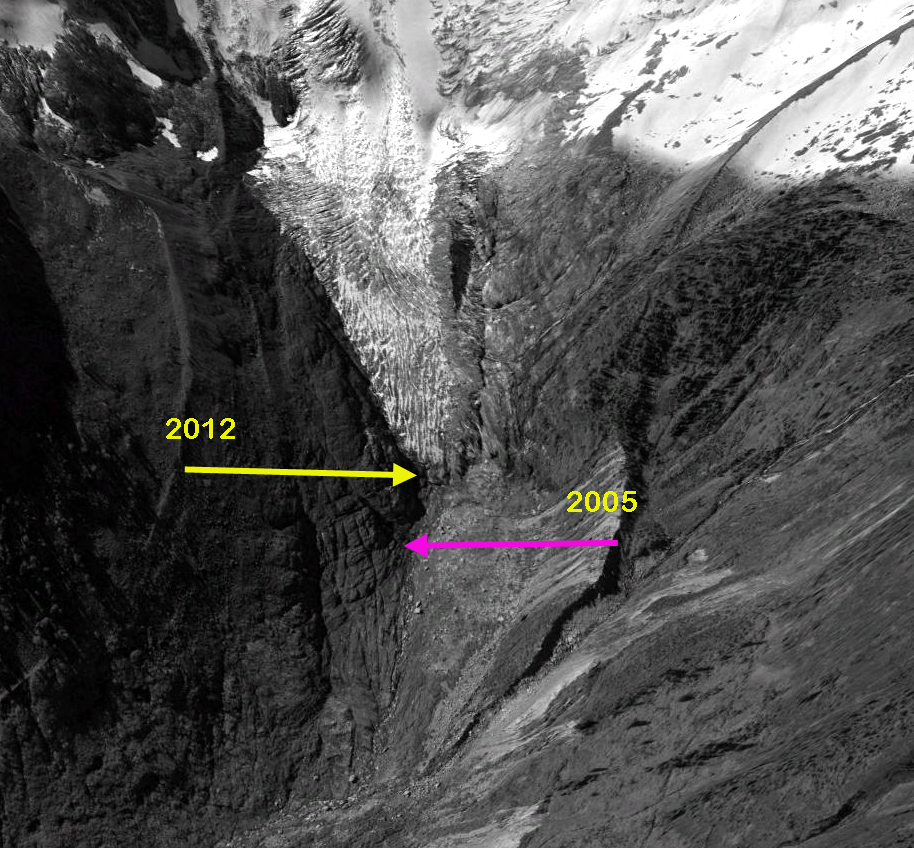
 A Google Earth image from 2005 of the terminus region indicates that the lower 700 meters of the current glacier is thin and lacks any crevasses indicating it nearly stagnant. By 2012 the terminus had retreated 80-90 m from 2005, yellow arrow indicates 2012 terminus, pink arrow 2005. This is in contrast to an active front, which indicates a healthy glacier, that would be thick and crevassed. A healthy glacier can still be retreating, the front was active at the time of my first visit to the glacier in 1984. The glacier is still 3.5 kilometers long and even after the retreat the glacier will still have a substantial length and area.

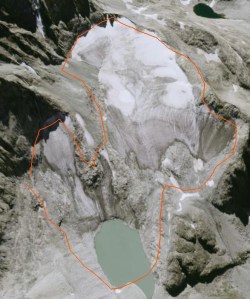 That is after a slow 12% loss in area from its Little Ice Age Maximum to 1952. A comparison of the 1966 map of the glacier and a 2006 SPOT satellite image illustrates the change. The glacier map outline is in orange on the satellite image. The glacier is quite thin and despite the steep slope has few crevasses evident in the image below. There is a substantial new lake that has formed at the terminus of the glacier since the 1966 map, which indicates no lake existed.
 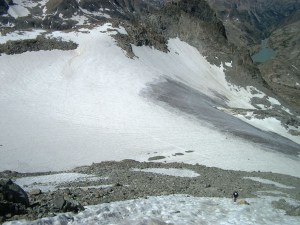 bottom image From Peter Bakwin.
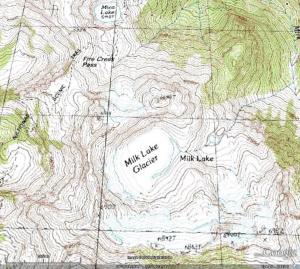 The flat topography over the lake indicates a very thin unstable glacier area. In 1967 the lake has begun to form, Austin Post, USGS image and a few bergs are evident. By 1988, Milk Lake had formed, a notably circular new alpine lake, the former glacier ice still filled part of the lake as ice bergs. In visiting the glacier in 1988 I was surprised at the expansion of this formally small lake. The glacier had retreated to the margins of the lake fringing the west side of the lake. The fringing ice was clearly thin, we found several crevasses that reached bedrock 5-10 m down. In 1994 on a return visit in miserable weather, there was no longer any icebergs in the lake and the lake was more of a jade to turquoise color. The fringing ice had lost about half of its area since 1988. This glacier remnant was not going to last long.
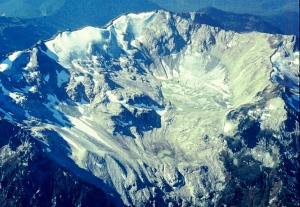 By 2006 the glacier was gone entirely even the fringing elements. One less glacier, one more alpine lake.
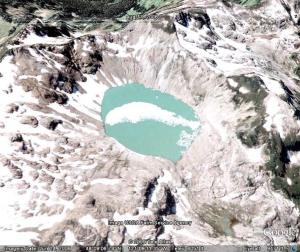 And in 2009 it is clear that Milk Lake would not be the correct name any longer, not a scrap of ice in sight this past summer.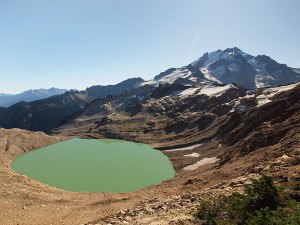
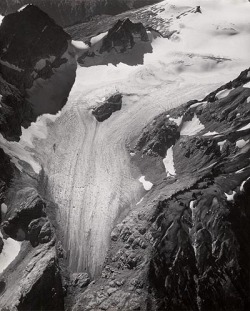 In 1995 we visited the margin of this lake, where the glacier ended in 1967 and took a photograph back to the glacier. As seen below retreat to this point was 400 m.
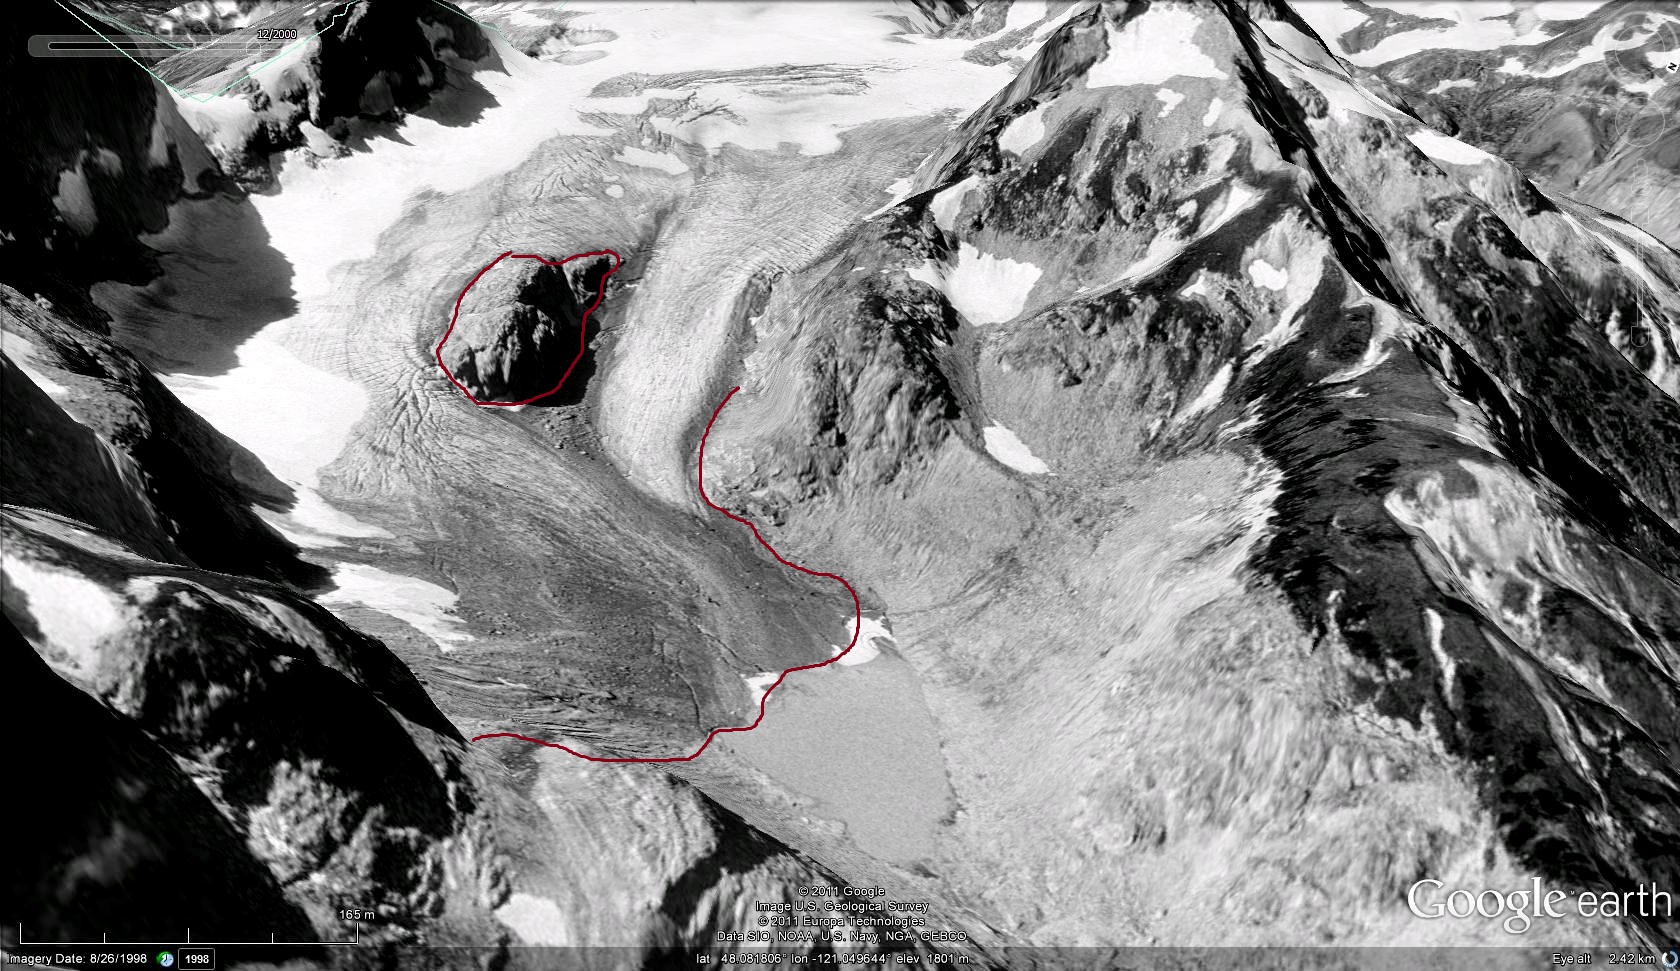
 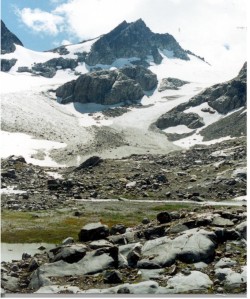 A pair of images from Bill Arundell in 1973 and Lowell Skoog in 2006 indicate the scale of the retreat, these images do not show the actual terminus but do show the main nunatak-rock island and how much it has become exposed in the 33 years. This nunatak was hardly evident in 1960, and in a 1940 image of the glacier literally did not yet exist.
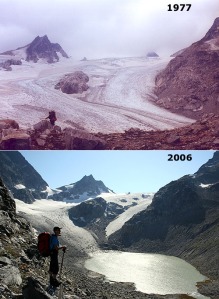 The terminus had retreated 400 m from the 1967 position to 1995. In 1987 a new lake began to form at the terminus of the glacier at 1680 m. The glacier is shown ending in this lake in 2002 from both the far end of the lake and the nunatak above the lake, the glacier had retreated 210 m since 1995. In 2006 the glacier retreated from the end of this lake. This is a shallow lake that may eventually be filled in by glacier sediments. The terminus is flat and stagnant ending at 1680 m in the lake. Thus, the rapid retreat will continue, the glacier is still not close to acheiving a post LIA equilibrium. Glacier retreat from 1940-1967 averaged 9 m/year. Retreat was minor between 1967 and 1979. The retreat rate since 1979 has been greater than 38 m/year, with a total retreat of 700 m. The nunatak in the middle of the glacier, which was beneath the ice in 1940 is now 90 m above the ice. The section of the glacier below the nunatak in 2002 is stagnant with no crevasses.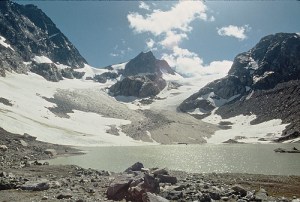
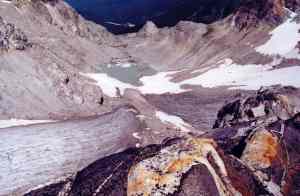 Indicating this glacier will retreat at least to the base of this rock knob, which will then no longer be a nunatak. A comparison of Google Earth Imagery from 1998 and 2009 illustrate the appearance of numerous new bedrock knobs in the area where there was an icefall in 1995.