Ellsworth Glacier, Alaska Calves Major Iceberg in 2020

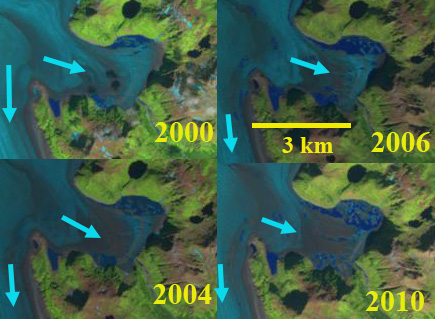
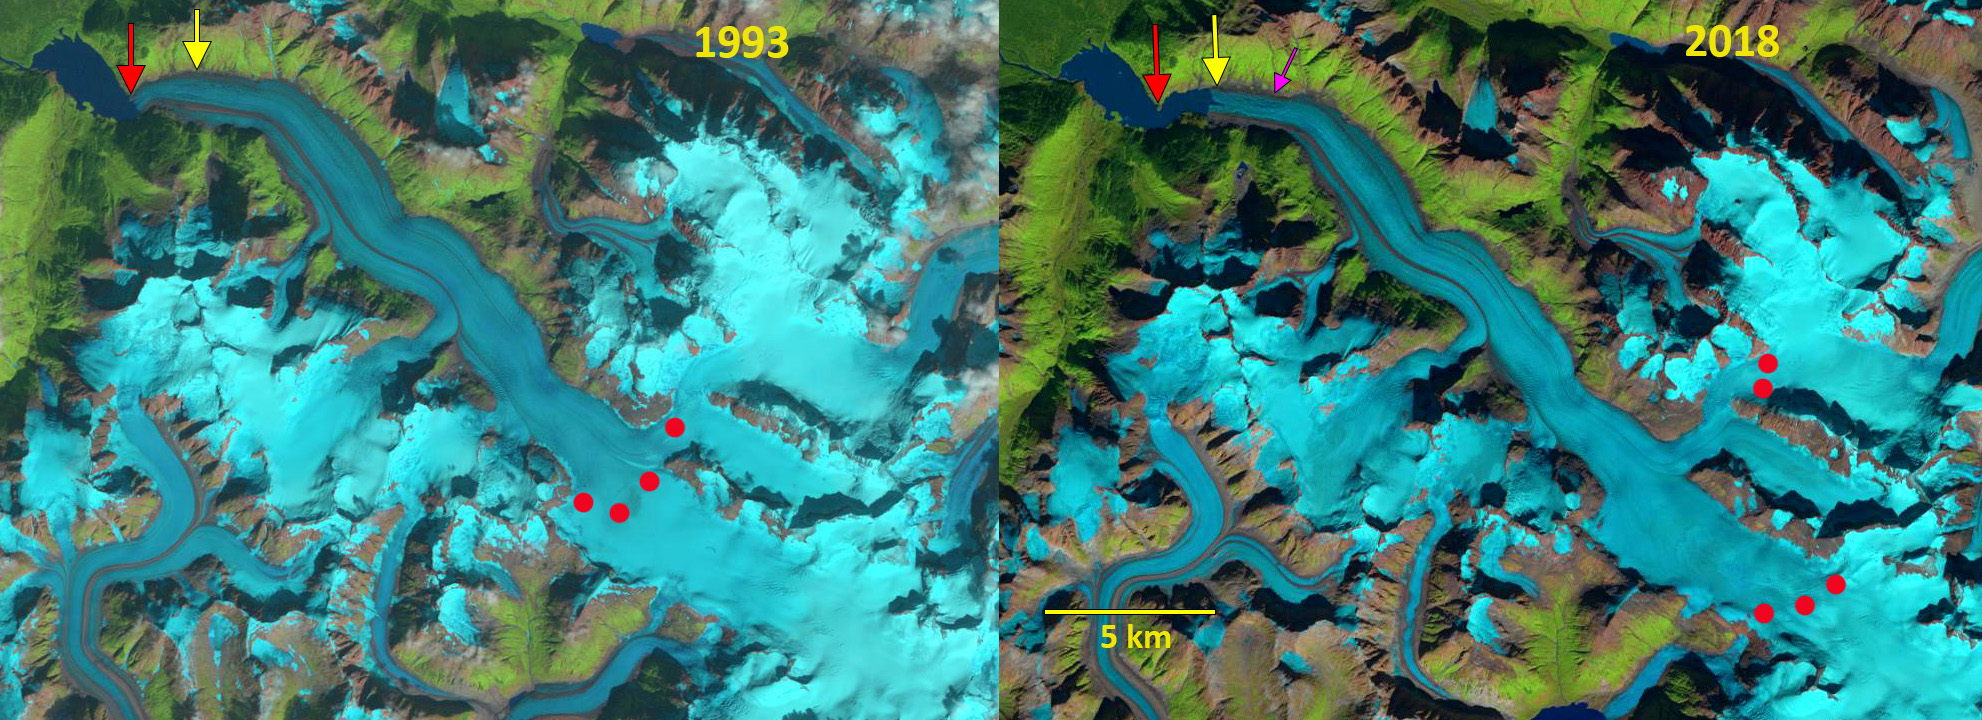
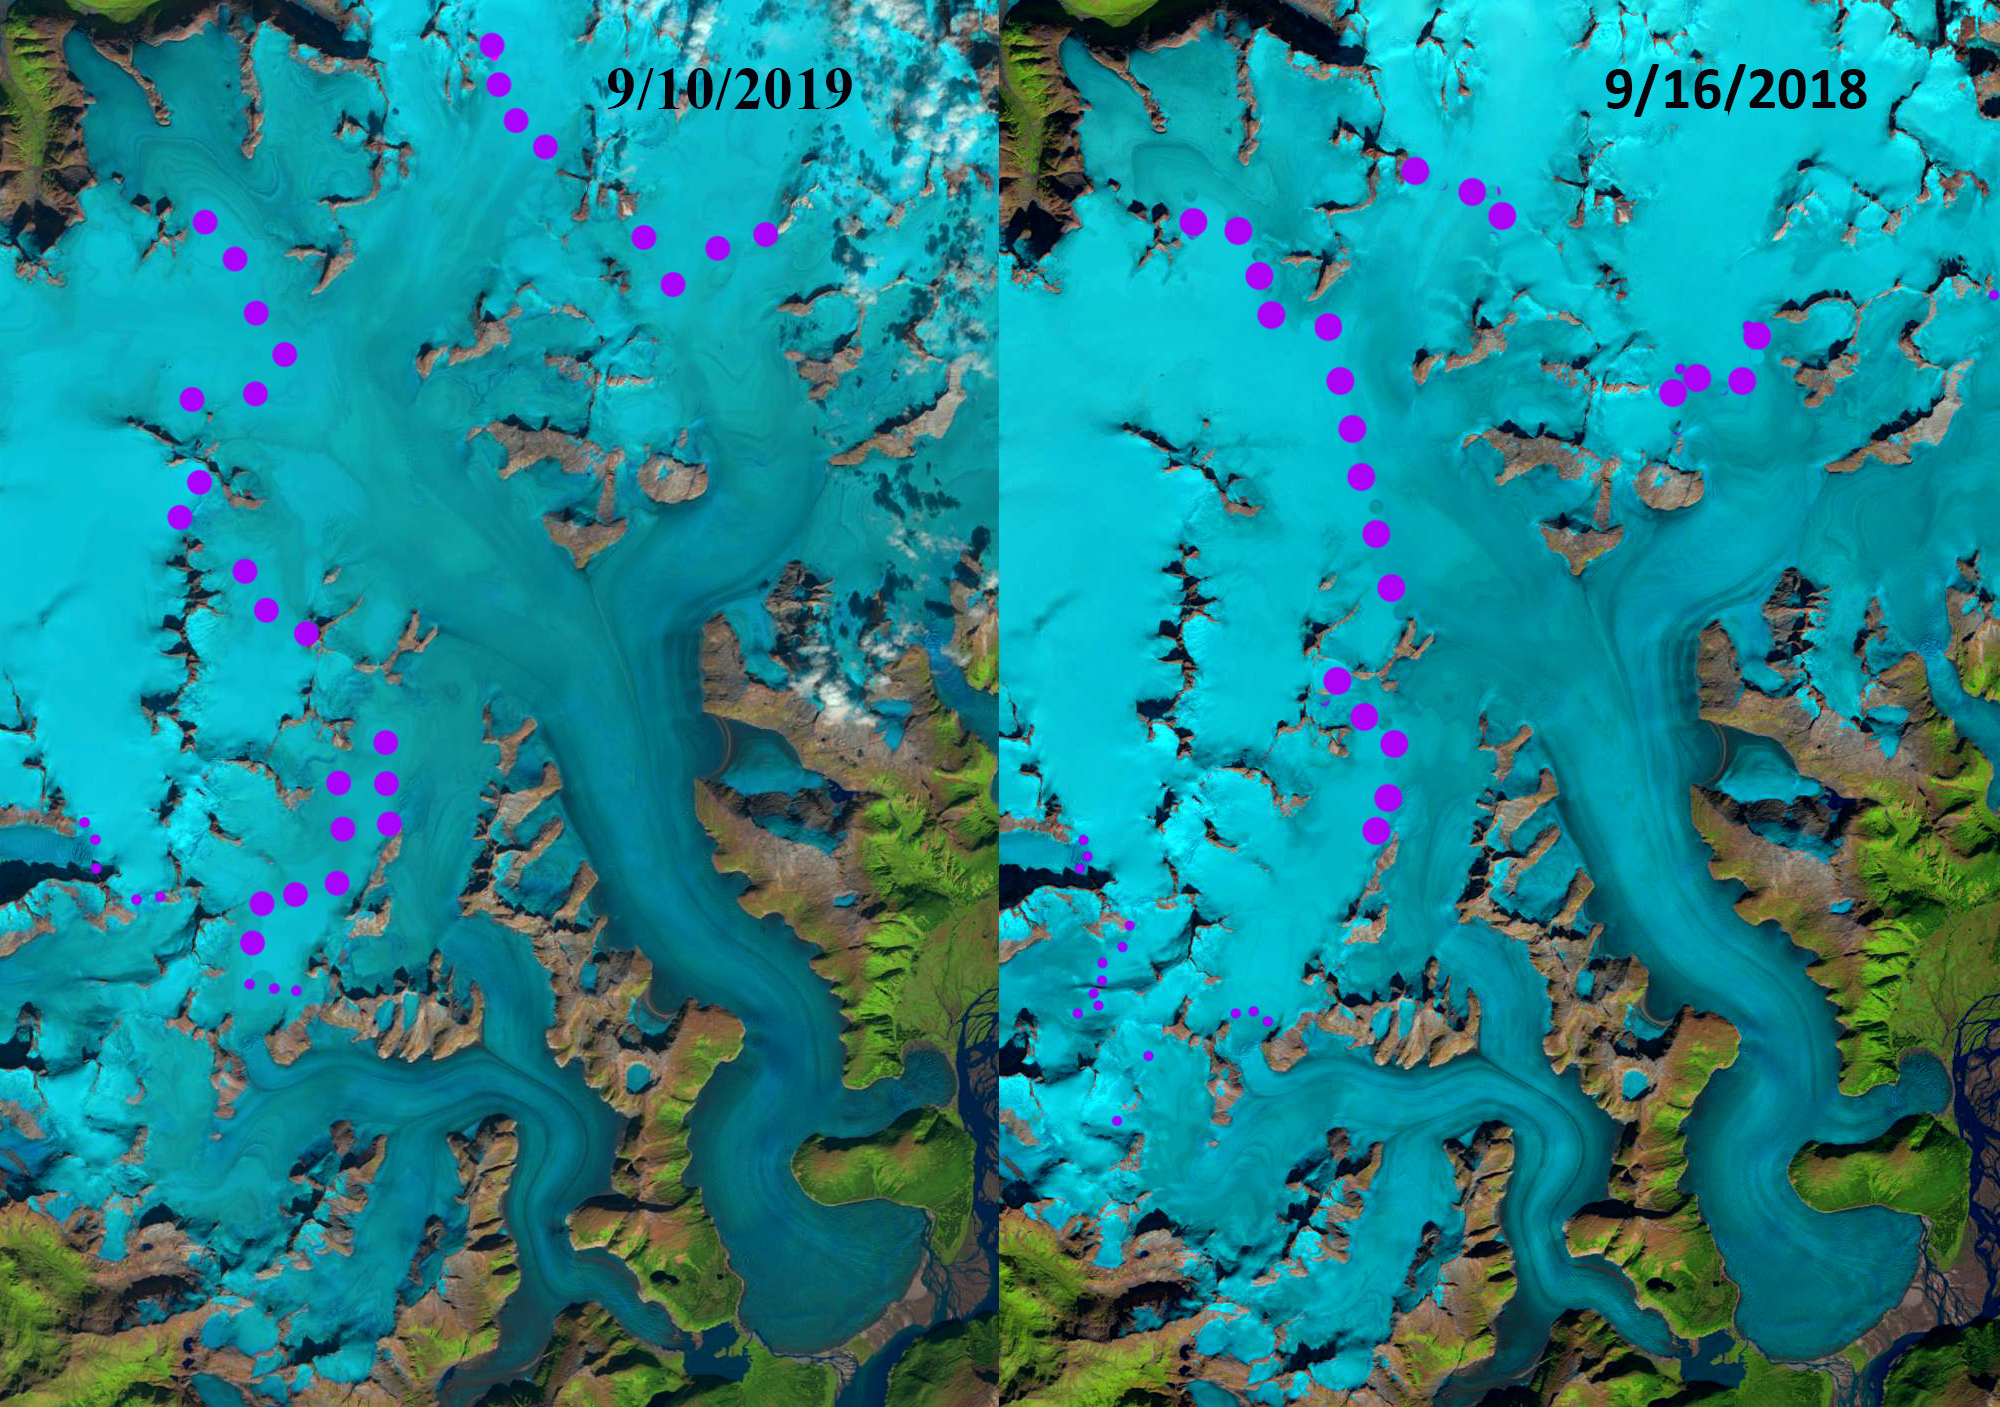
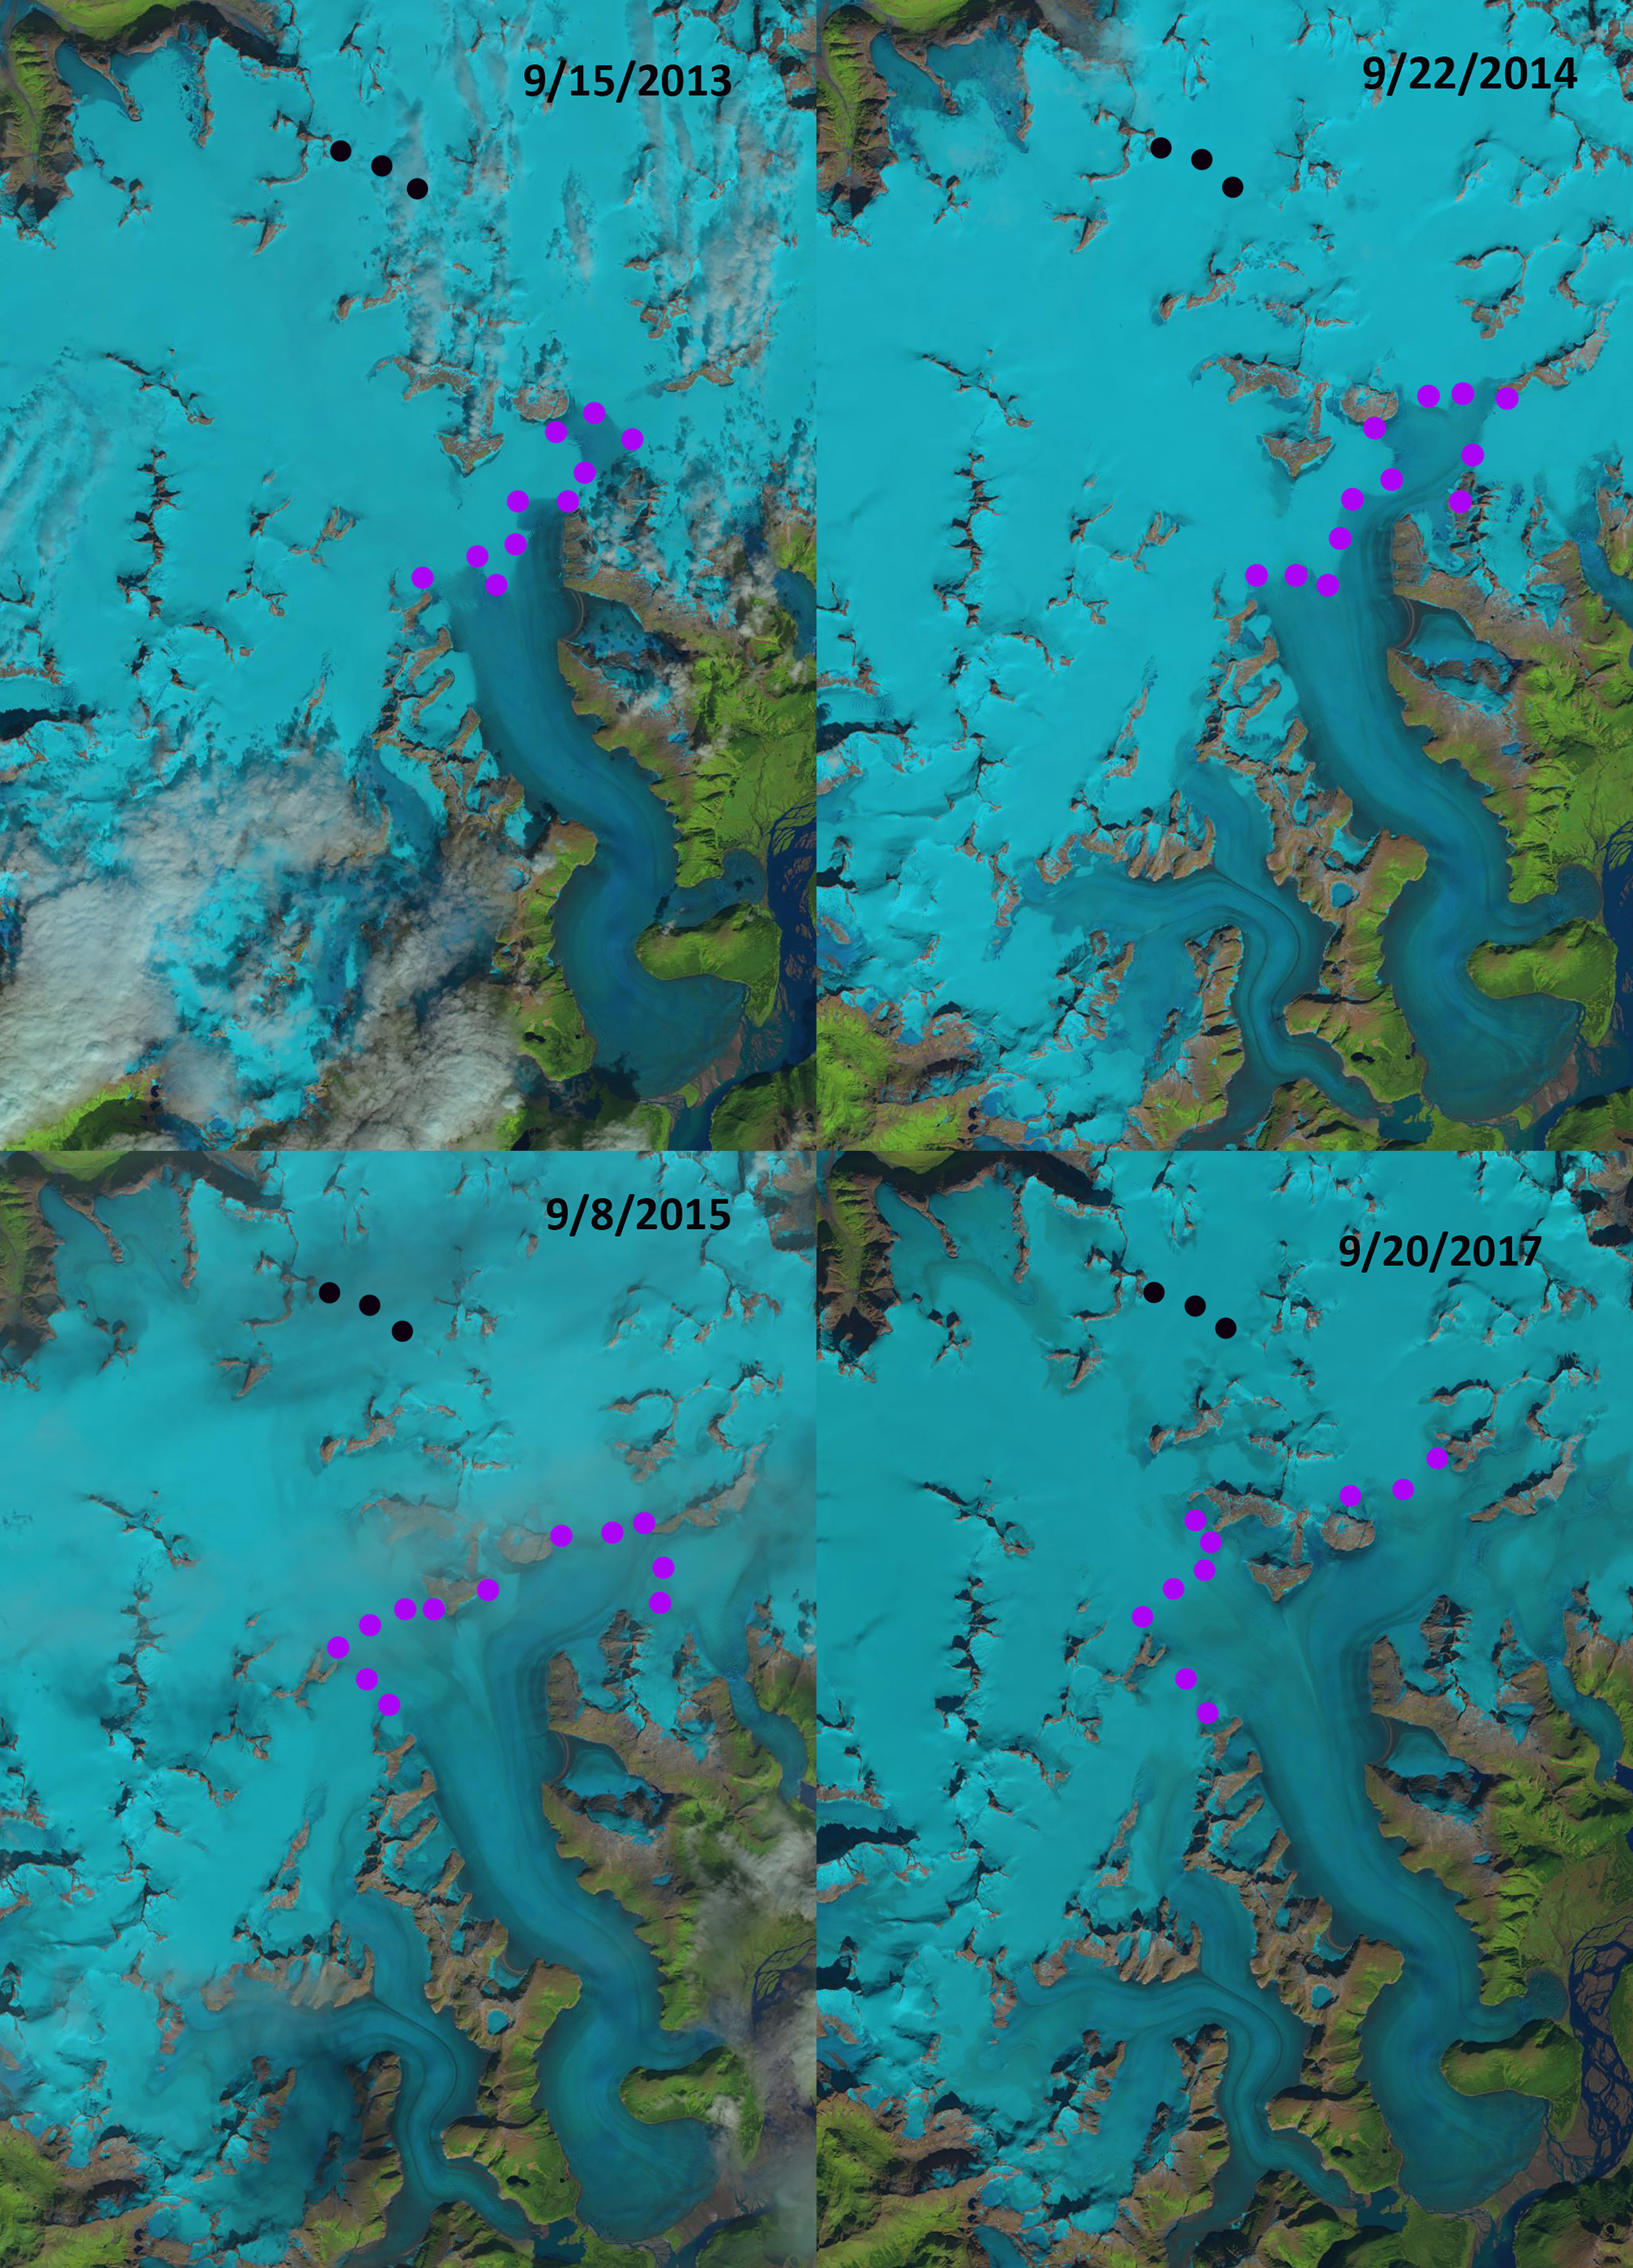
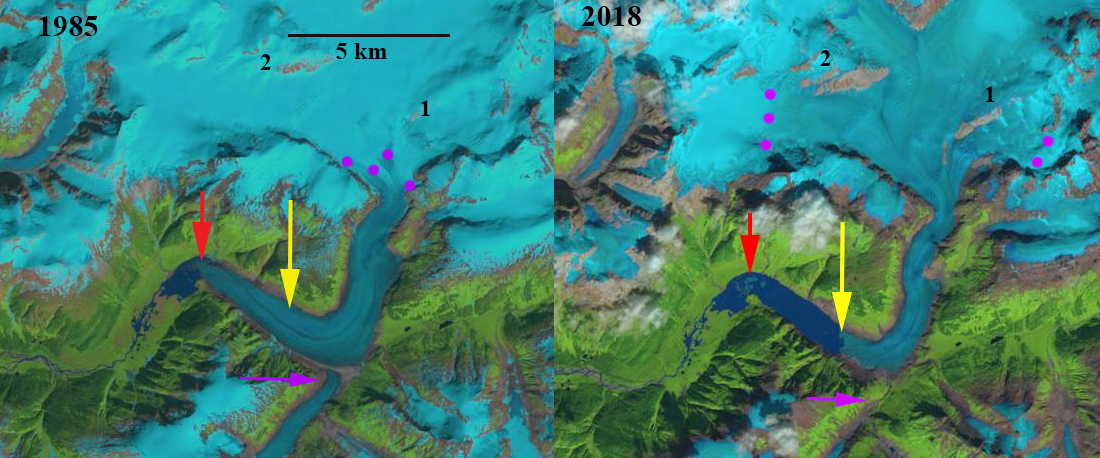
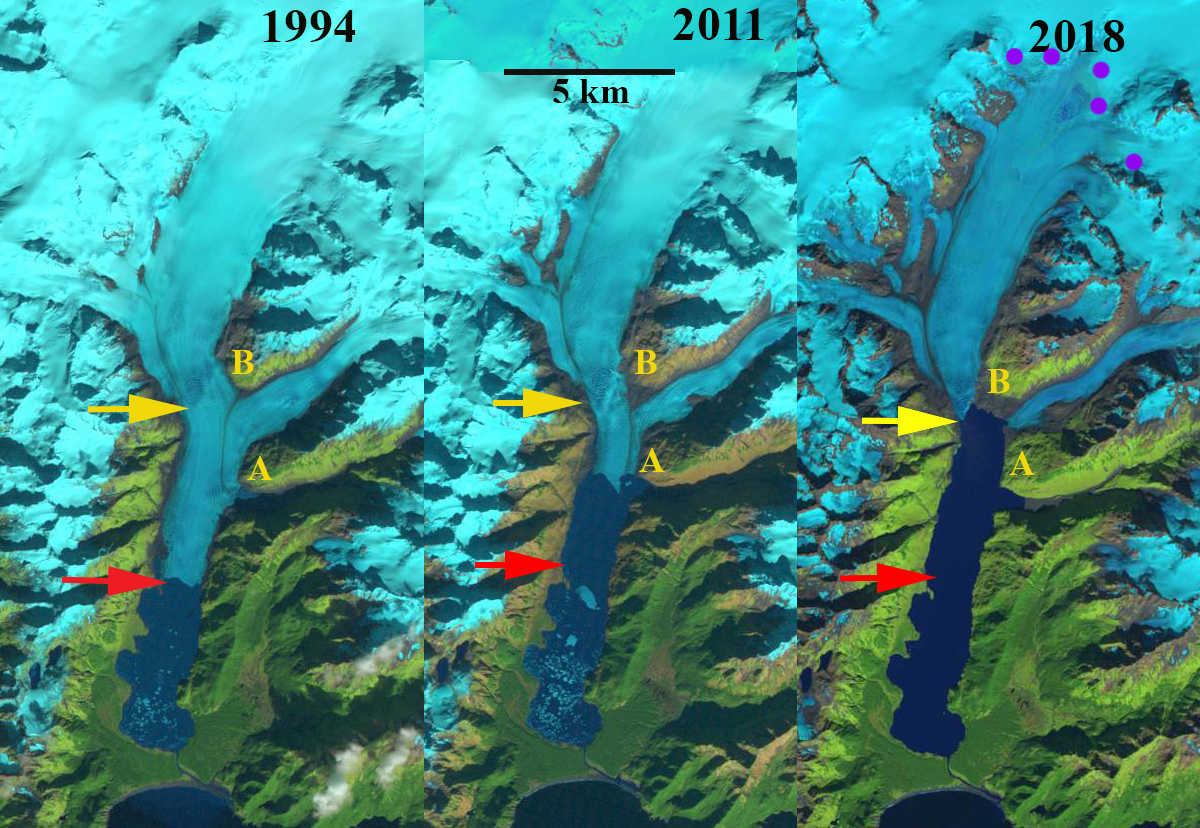
Ellsworth Glacier in Landsat images from 2018, 2019 and 2020. Red arrow is the 2016 terminus location, yellow arrow is the 2020 termins location, pink arrow is the rift, purple dots is the snowline, iceberg is Point A. Glacier retreated 2.4 km, main iceberg 1 km2

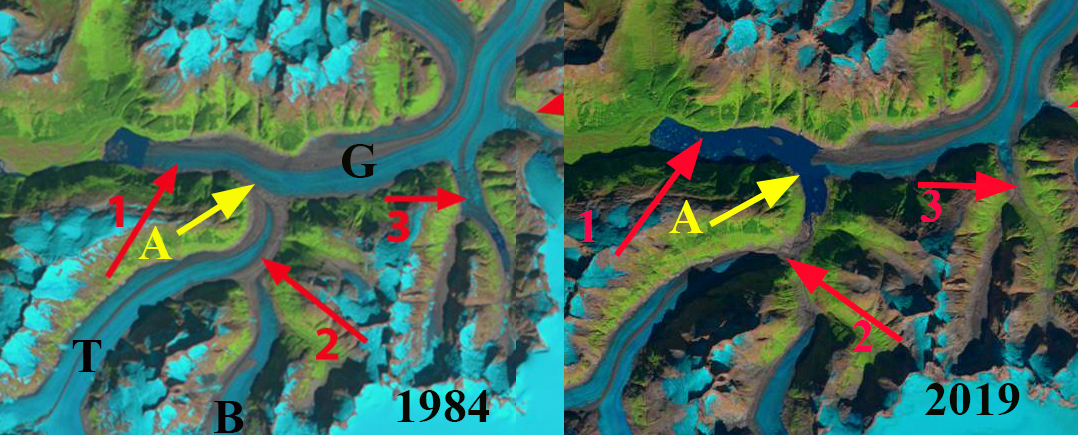
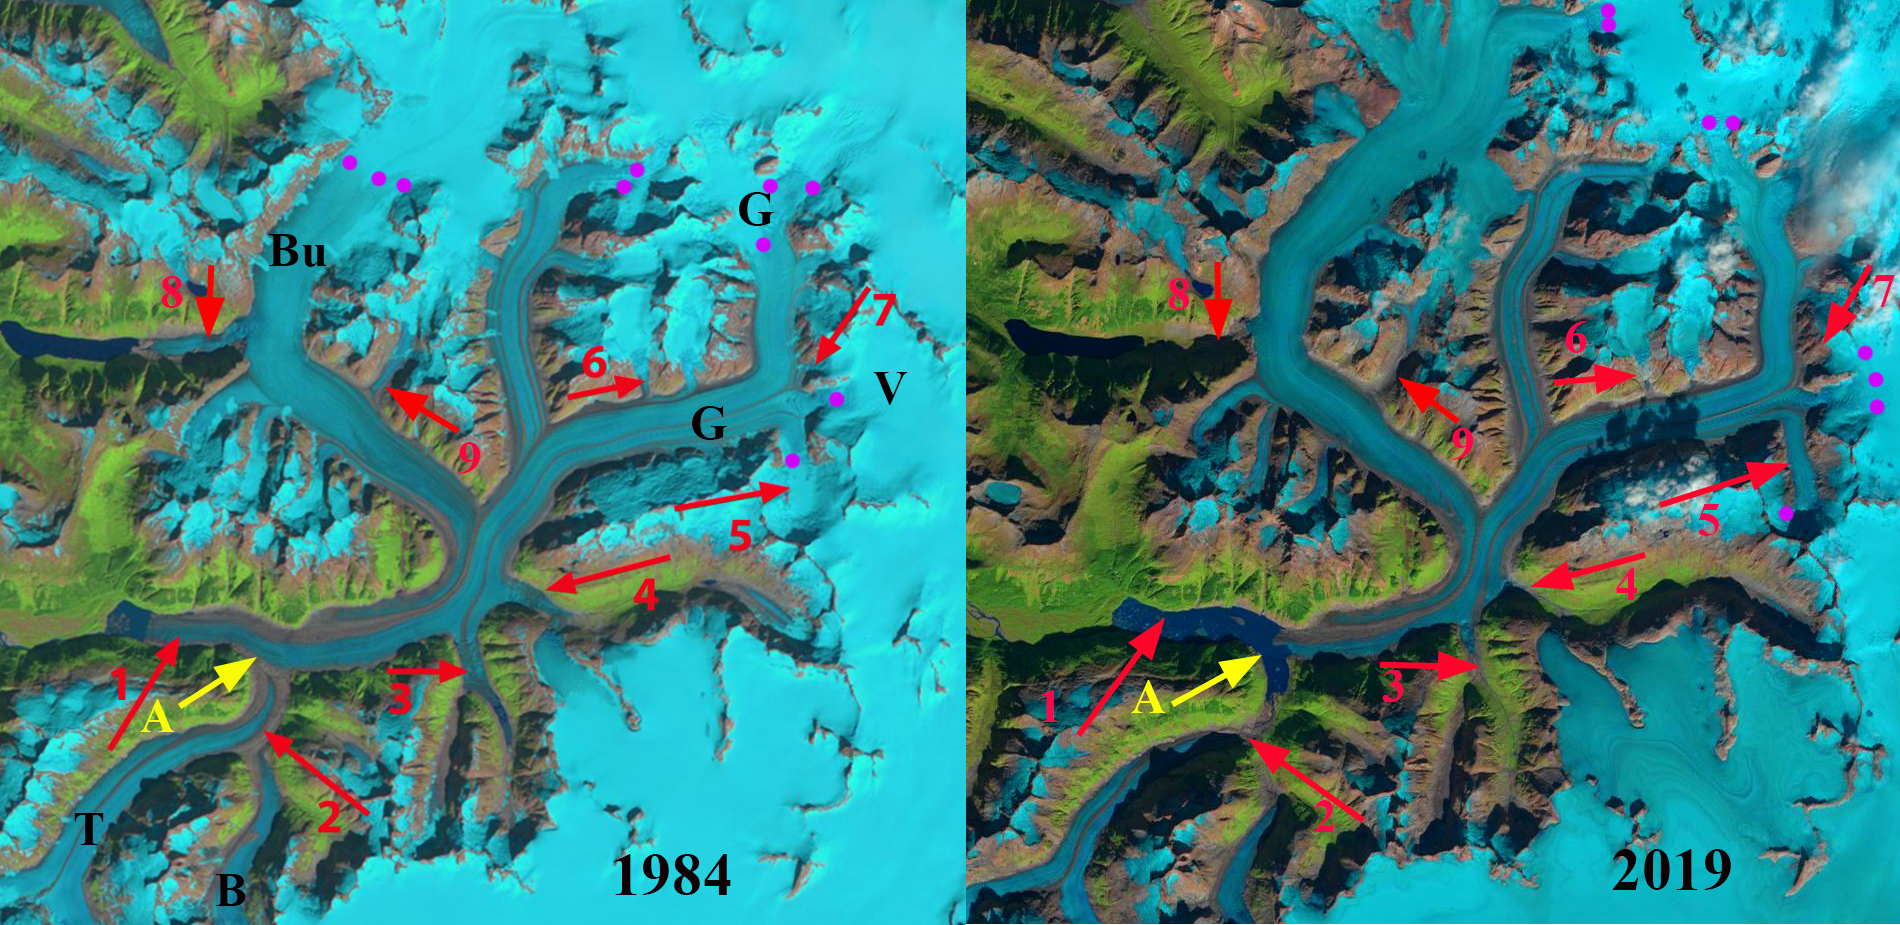
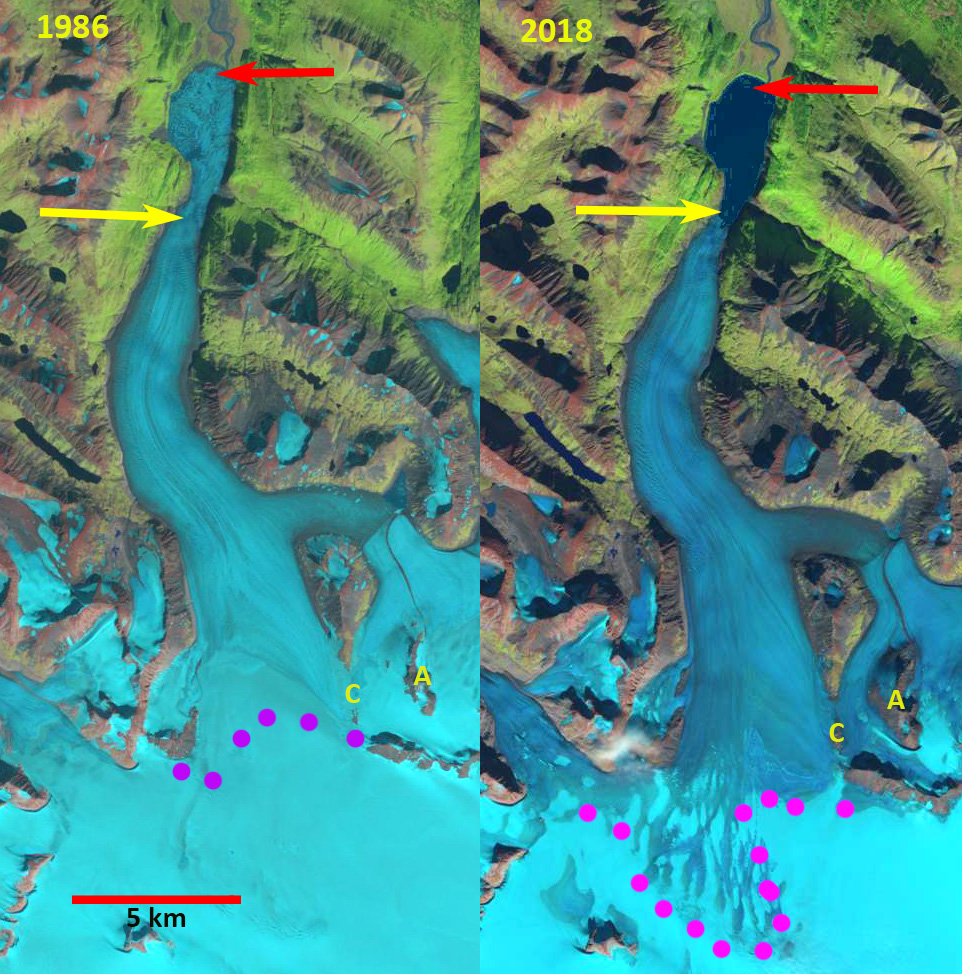
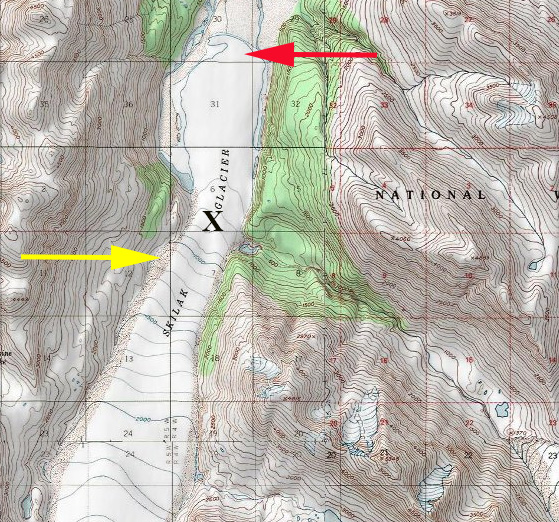
Ellsworth Glacier is a valley glacier draining south from Sargent Icefield on the Kenai Peninsula in Alaska. Along with the Excelsior Glacier it has been the longest glacier of the icefield.  The glacier retreated into an expanding proglacial lake in the early 20th century (USGS-Molnia, 2008). The terminus in 2000 was reported to be  3.5 to 4.5 km from the 1908 position (USGS-Molnia, 2008).  In a previous post we examined Landsat images from 1989-2016 to identify the changes including a 500 m retreat on the east margin of the lake and a 3400 m retreat on the west margin.  It as noted that “this rapid lake expansion indicates that the lower 3 km of the glacier occupies a basin that will become a lake and that the tongue is partially afloat and given the narrowing thinning tongue is poised for collapse”.  Here we document that collapse with Landsat images from 2016-2020.

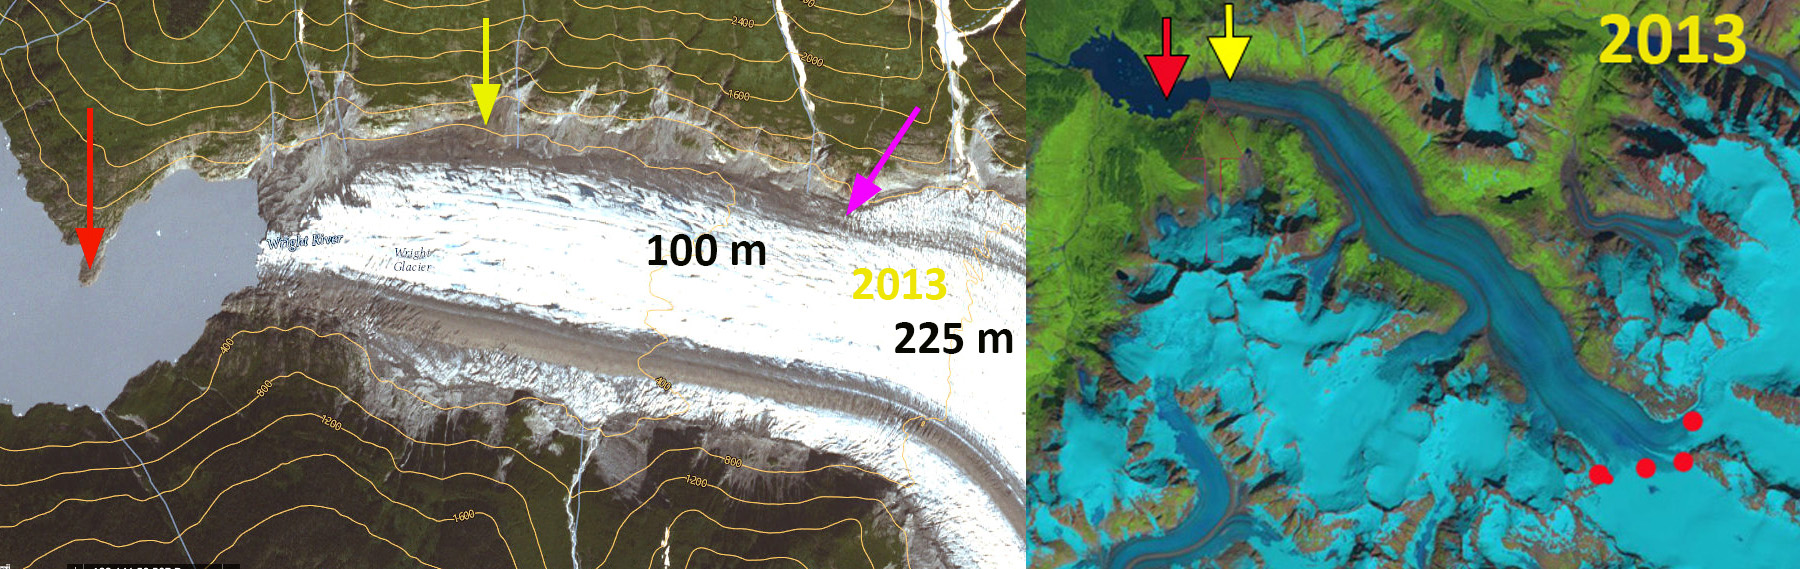
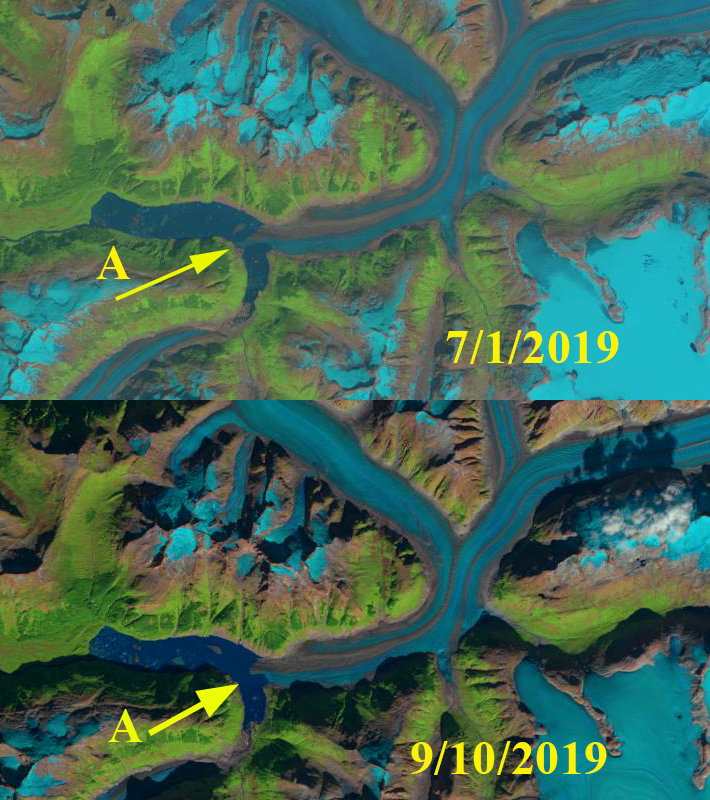
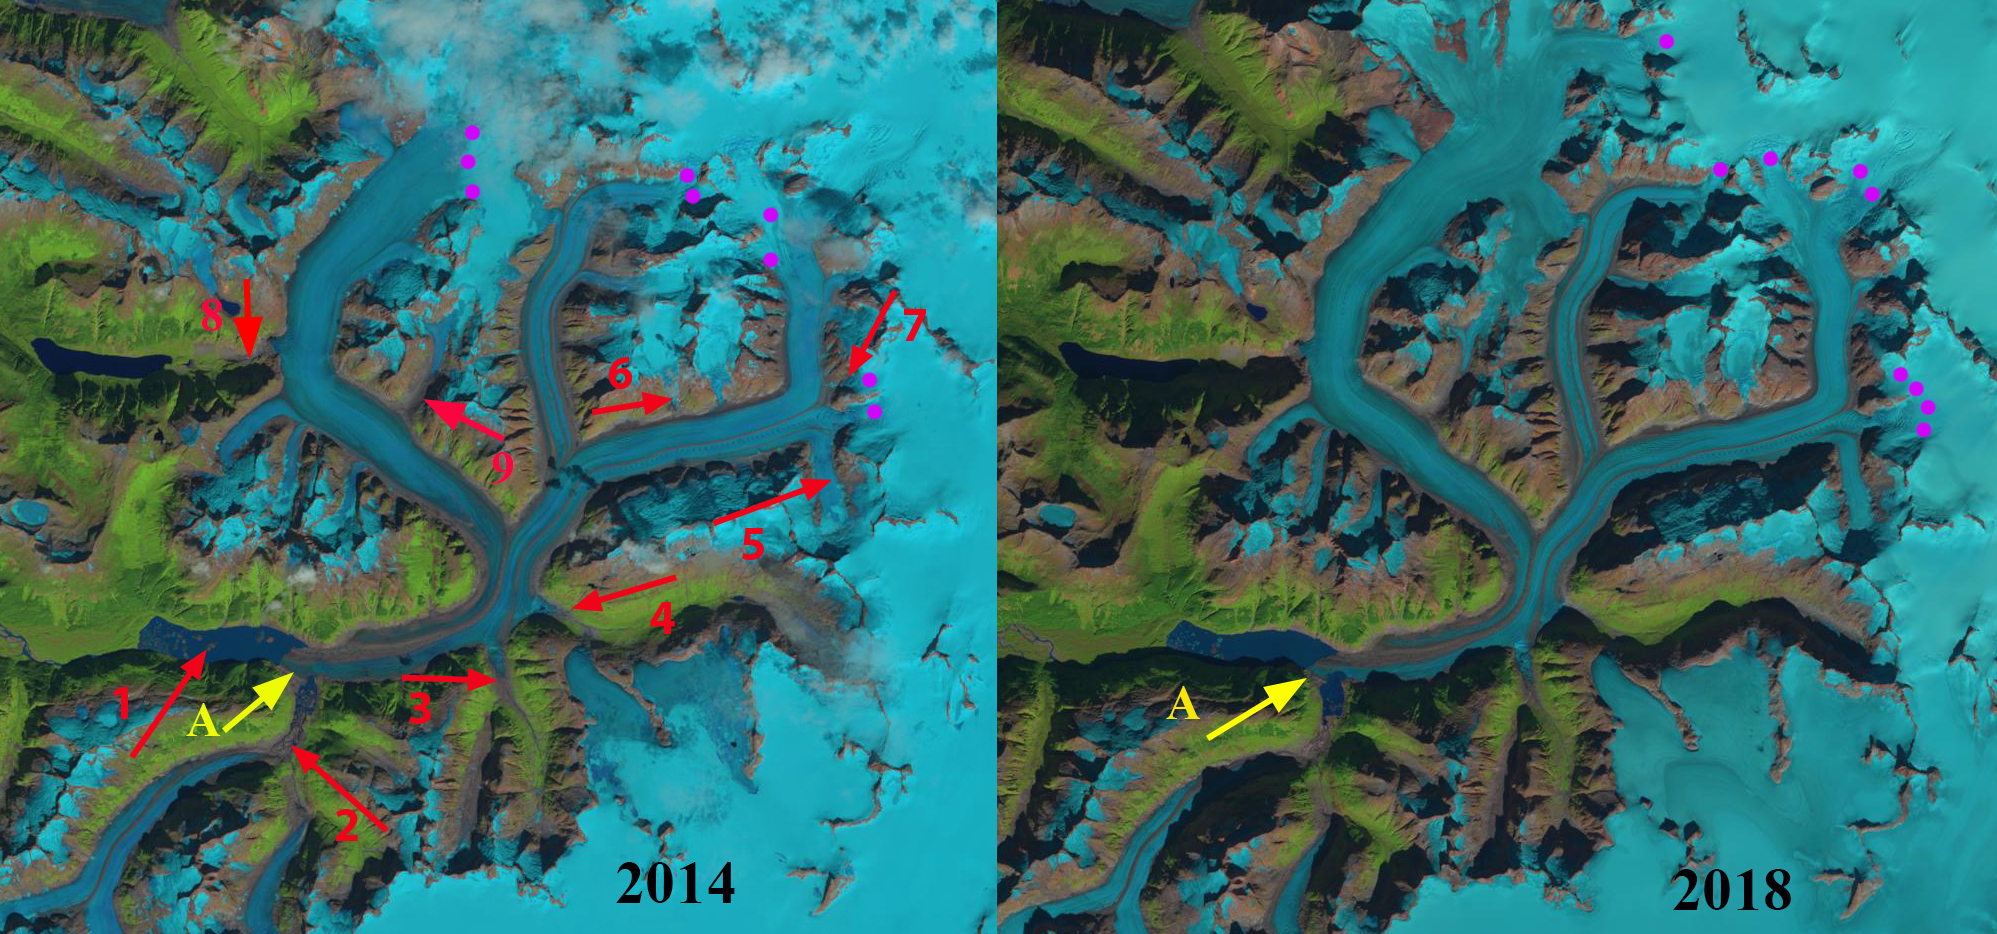
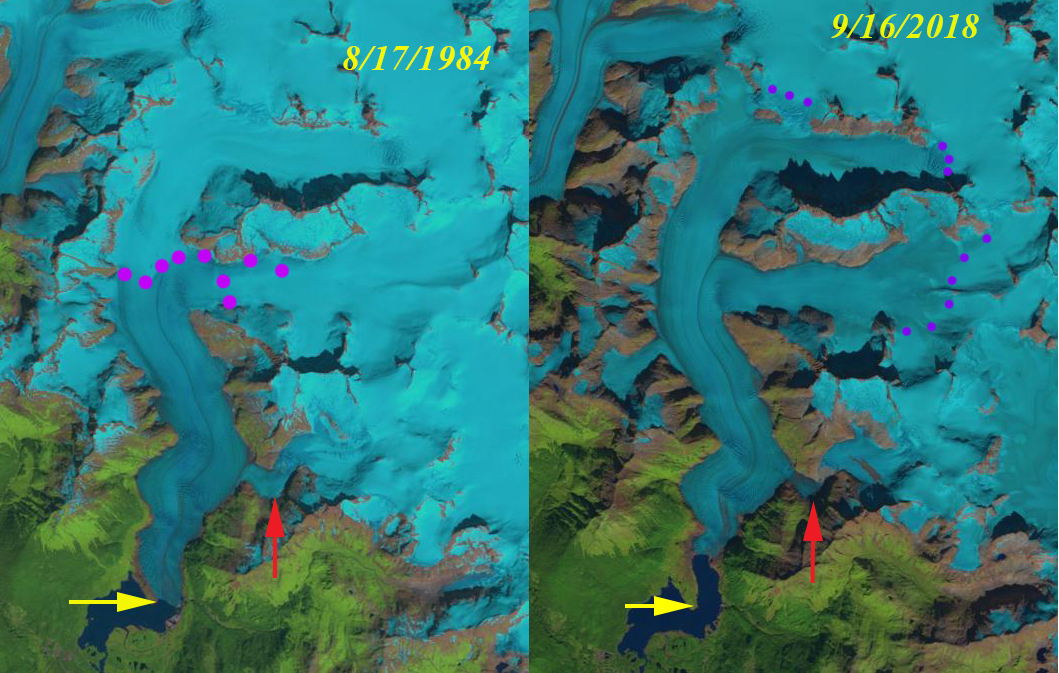
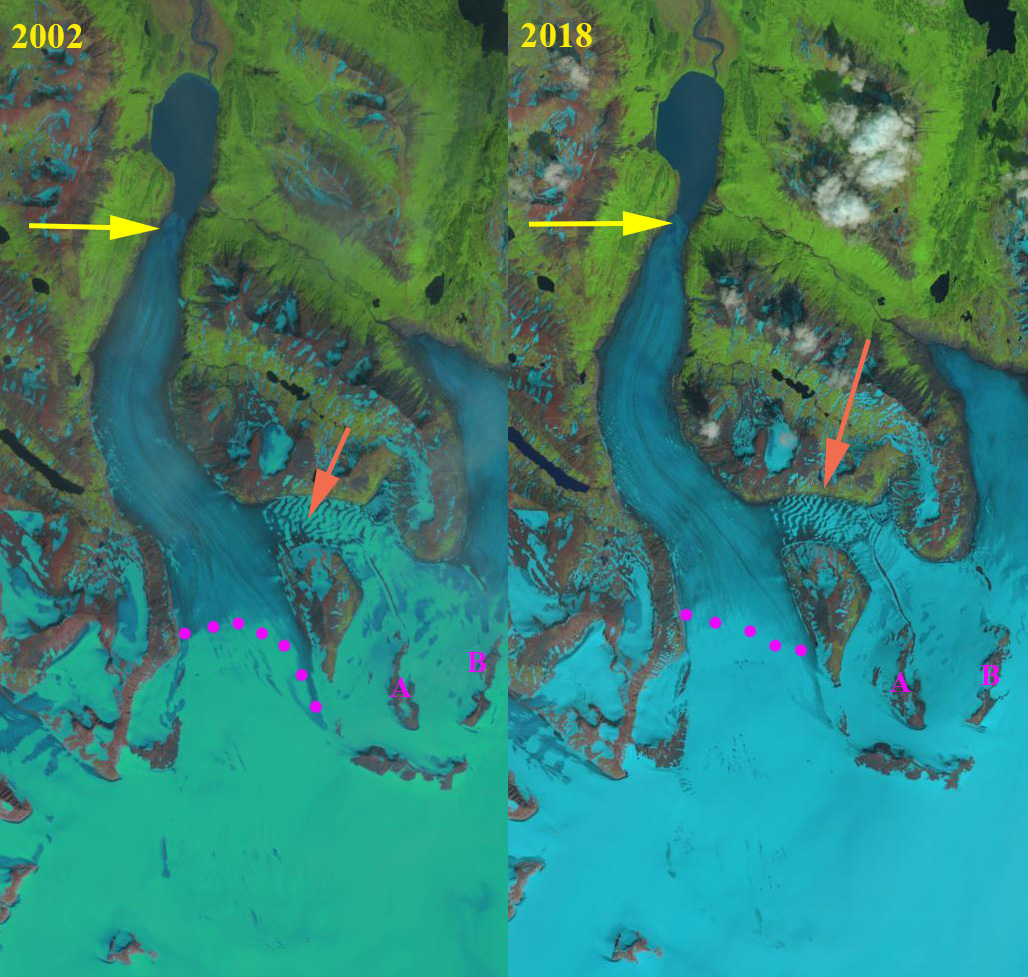
In 2016 the snowline is at 975 m, the lake has now extended 3 km along the western edge.  The terminus is just east of  a former tributary glacier, red arrow. The number of icebergs in 2016 indicates that significant ice calved during that year. The retreat of the eastern margin has been 500 m, with a 3.4 km retreat on the west margin.  The main tongue in the lower two kilometers is 800 m wide versus 1200 m wide in 1989.  In 2018 the snowline is at 1100 m, the terminus remains just west of a former tributary glacier.  There is a rift forming near the pink arrow, where an iceberg will eventually detach (A).  In late June of 2019 the rift has further developed, but the iceberg to be (A) has not detached.  By mid-August of 2019 the rift has nearly led to detachment of an iceberg (A), the snowline is at 1075 m.  In June of 2020 the iceberg has detached and there is a considerable melange of ice between the iceberg (A) and the main terminus.  By Sept. 11, 2020 the iceberg remains in much the same position.

The glacier has retreated 2.4 km since 2018, and now terminates at yellow arrow 1 km downglacier of the junction of the two main tributaries.  The iceberg has maintained an area of ~1 km2.  The snowline in 2020 is at 1125 m indicating another of mass balance loss for the glacier. The lake is now 7 km long and the lake area is ~7.5 kmup from 5 km2 in 2016. The retreat of this glacier paralells that of its neighbor Excelsior Glacier that retreated 4.7 km from 1994-2018. This continues to be a developing lake district including Grewingk Glacier.

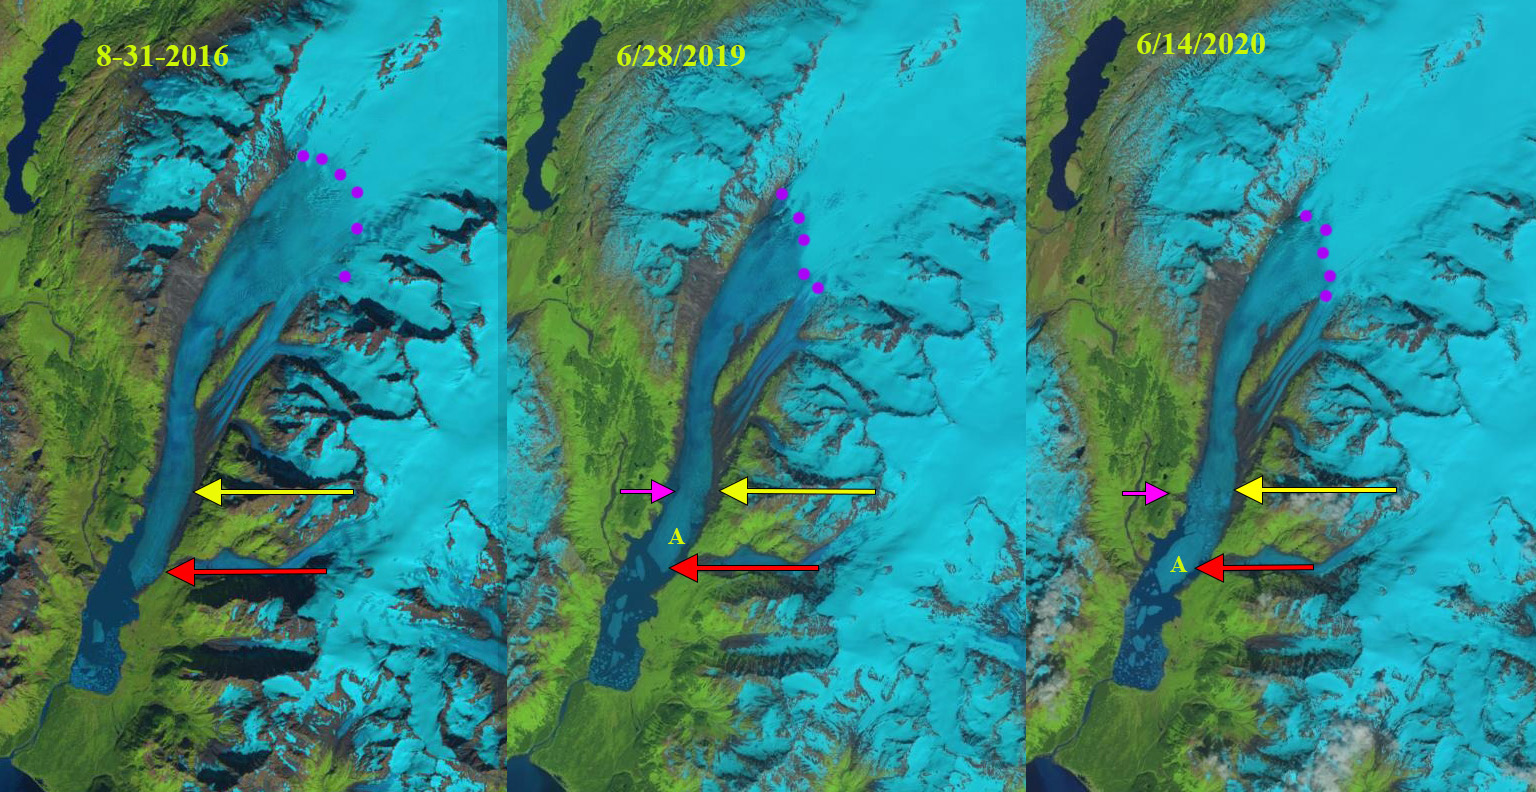
Ellsworth Glacier in Landsat images from 2016-2020. Red arrow is the 2016 terminus location, yellow arrow is the 2020 termins location, pink arrow is the rift, purple dots is the snowline, iceberg is Point A.

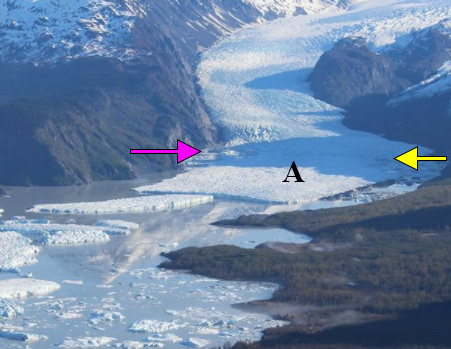
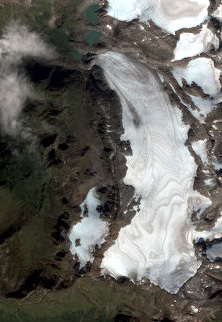
Ellsworth Glacier in 2019. Point A is future iceberg is, yellow arrow is 2020 terminus locations and pink arrow is rift.  Image from Johnstone Adventure Lodge.

Oscar Lake Expansion Carves Away at Brady Glacier, Alaska

Oscar Lake growth on the east margin of Brady Glacier in Landsat images from 2000-2020. Point A indicates glacier tongue that becomes iceberg. Blue arrows indicate flow direction.

Brady Glacier,  is a large Alaskan tidewater glacier, in the Glacier Bay region that is beginning a period of substantial retreat Pelto et al (2013).   The glacier has a number of expanding lakes that are expanding as the secondary termini feeding them retreat. The lakes Trick, North Deception, Dixon, Bearhole, Spur, Oscar, and Abyss continue to evolve. Pelto et al (2013) noted that the end of season observed transient snowline averaged 725 m from 2003-2011, well above the 600 m that represents the equilibrium snowline elevation.In 2018 and 2019 the melt season has been intense for the Brady Glacier in Alaska reaching 1100-1200 m both years. Here we examine the expansion of Oscar Lake from 2000-2020.

In 2000 the lake was just developing and had an area of ~0.5 km2.  In 2004 the lake had expanded to ~0.8 km2.  In 2006 the glacier was 1.0 km2 in area, Capps et al (2010) reported the maximum lake depth measured with a remote control boat at 140 m near the ice front.  The glacier still reaches the east margin of the basin separating the lake into a northern and southern section. They further noted that nearby Abyss Lake had begun to drain subglacially into Oscar Lake. In 2010 Oscar Lake had doubled since 2006 to an area of 2 km2.  In 2004 the glacier tongue that extends to the east margin of the lake is still in place, but is too narrow to be stable. In 2016, 2018 and 2019 very high snowlines led to extensive melt and glacier thinning, reported in 2016 (Pelto, 2016), and on nearby Taku Glacier setting a record (Pelto, 2019).  In 2018 and 2019 a debris covered tongue, Point A, remained attached to the main glacier.  In July 2020 this tongue has broken free.  The lake now has an area of 4 km2.  The high snowline in 2019 exposed many firn layers from previous years.  These layers were the retained snowcovered from previous winters, that had survived summer and been buried by the next years snowfall.  The collective melt of the recent years is exposing the layers.

Oscar Lake growth on the east margin of Brady Glacier in Landsat images from 2000-2010 Blue arrows indicate flow direction. There is a southern and northern part of the lake separated by the glacier tongue during this period.

Oscar Lake in 2014 in a Digital Globe image. Note unstable tongue exteding to east end of basin.

Brady Glacier in 98/2019 Landsat image indicating snowline at 1100-1200 m with purple dots. S=Spur Lake, O=Oscar Lake, A=Abyss Lake,  F=Firn lines, D=Dixon Lake, B=Bearhole Lake, N=North Deception Lake, T=Trick Lake


Firn layers on upper Brady Glacier in 9/8/2019 Landsat image.


Yalik Glacier, Alaska Retreat and Lake Expansion 1986-2019

Yalik Glacier (Y) in 1986 and 2019 Landsat images.  Red arrow is the 1986 terminus location and yellow arrow the 2019 terminus location. Petrof Glacier (P) is the western neighbor.

Yalik Glacier drains an icefield on the Kenai Peninsula, glaciers draining east are in the  Kenai Fjords National Park, which has a monitoring program.  From 1950-2005 all 27 glaciers in the Kenai Icefield region examined  retreated (Giffen et al 2014).  Yalik Glacier retreated 1057 m from 1950-1986, a rate of-29 m/year and 797 m from 1986-2000, a rate of 57 m/year (Giffen et al 2014).  Here we update the retreat using Landsat images from 1986, 2000, 2018 and 2019.

In the 1950 USGS map of the region Yalik Glacier terminates on a braided outwash plain, and does not have a proglacial lake.  By 1986 there is a 300-400 m wide fringing proglacial lake particularly on the eastern margin with an area of 0.6 km2. The glacier has retreated from the outwash plain into the developing proglacial lake basin.  By 2000 the proglacial lake has expanded to 1.3 km2 due to the ~800 m retreat.  In 2018 the proglacial lake has expanded to 2.1 km2 and a second proglacial lake has formed on the eastern margin.  This proglacial lake will merge with the main lake as the terminus retreats from a peninsula extending from the eastern margin. A bedrock knob has emerged east of Point 1 indicating substantial glacier thinning since 2000. In 2019 the total proglacial lake area is 2.4 km2.  The glacier has retreated 1500 m since 1986 and 700 m since 2000, the latter period has a retreat rate of 34 m/year.  The former braided river  that exited the glacier is now a single meandering stream channel as it leaves the proglacial lake. The retreat of Yalik Glacier is more than nearby Grewingk Glacier and less than nearby Excelsior Glacier.

What is driving the retreat is continued warming including warm summers.  The glacier generated few icebergs during this retreat, indicating melting not calving is the key factor. The 2019 Alaska Climate Review indicates 2019 was the state’s warmest year, see Anchorage example from this report below. Temperatures in nearby Homer averaged 4.2 F above normal with June-August averaging 4.4 F above normal.  These conditions also led to forest fires in the area reducing the 2019 image clarity due to forest fire smoke from the Swan Lake fire that burned ~167K acres.

Yalik Glacier in 2000 and 2018 Landsat images.  Red arrow is the 1986 terminus location and yellow arrow the 2019 terminus location. Point 1 is west of a bedrock knob that has emerged due to glacier thinning.

USGS map of Yalik Glacier in 1951

From the 2019 Alaska Climate Review .

Wright Glacier, Alaska Snowline and Terminus Retreat

Wright Glacier in 1984 and 2019 Landsat images.  The red arrow indicates 1984 terminus location, yellow arrow 2019 terminus location, pink arrow where the surface slope steepens and red dots indicate the snowline. 

Wright Glacier is the largest glacier draining an icefield just south of the Taku River and the larger Juneau Icefield. The glacier accumulation zone is mainly in British Columbia.  The glacier filled a lake basin in 1948 as illustrated by the USGS map and  NSIDC collection,  though the terminus is beginning to break up.

In 1984 the glacier ended at a peninsula in the lake where the lake turns east.  This was my view of this glacier during the summers of 1981-1984 from the Juneau Icefield with the Juneau Icefield Research Program. Our bad weather came from that direction so keeping an eye on that region during intervals between weather events was the practice. Here we examine Landsat imagery from 1984-2019 to document the retreat of Wright Glacier and the rise in elevation of the snowline.

In 1984 the lake had a length of 3.1 km extending northwest from the glacier terminus. The snowline in mid-August with a month left in the melt season was at 1150 m at a main glacier junction.  By 1993 the glacier had retreated little on the north side of the lake and 200 m on the south side. The snowline in mid-September close to the end of the melt season was at 1150 m. By 2013 the glacier had retreated 900 m and was terminating in a narrower portion of the expanding lake, 30 m/year. The snowline was again at the main junction near 1150 m. In 2018 the snowline on September 16th was at 1450 m with less than 25% of the glacier in the accumulation zone.  In 2019 on Aug. 2 the snowline was at 1500 m, likely the highest snowline in the last 70 years, as was the case at nearby Taku Glacier. The high snowlines of recent years has driven an acceleration of the retreat of 1000 m since 2013, 150+ m/year. The glacier has a steeper surface slope 2 km beyond the current terminus front indicating the lake ends either near this point, pink arrow.  This could lead to a reduction in the retreat rate, though calving has not been a major factor in retreat of this glacier.

The glacier drains the same icefield as the retreating West Speel and Speel Glacier.

Wright Glacier in 1993 and 2018 Landsat images.  The red arrow indicates 1984 terminus location, yellow arrow 2019 terminus location, pink arrow where the surface slope steepens and red dots indicate the snowline.

Wright Glacier in 2013 Landsat images and USGS Topo imagery.  The red arrow indicates 1984 terminus location, yellow arrow 2019 terminus location, pink arrow where the surface slope steepens and red dots indicate the snowline.

Taku Glacier, Alaska Retreat Begins: A Two Century Long Advance Reversed by Climate Change

Taku Glacier in 2016 and 2019 Sentinel 2 images.  The Hole in the Wall Tributary  (HW) is upper right, Taku Glacier main terminus (MT). Yellow line is the 2016 terminus location.  The arrows denote locations where thinning is apparent as the area of bare recently exposed bedrock has expanded. A closeup is below.  Pink and brown areas between blue ice and yellow line in 2019 indicates retreat.

The Taku Glacier is the largest outlet glacier of the Juneau Icefield in Alaska.  Taku Glacier began to advance in the mid-19th century and this continued throughout the 20th century. At first observation in the 19th century the glacier was calving in deep water in a fjord.   It advanced 5.3 km between 1890 and 1948 moving out of the fjord into the Taku River valley, see maps below (Pelto and Miller, 1990).  At this time calving ceased resulting in positive mass balance without the calving losses.  The glacier continued to advance 2.0 km from 1948-2013 (Pelto, 2017). The advance was paralleled by its distributary terminus, Hole in the Wall Glacier.  This advance is part of the tidewater glacier cycle (Post and Motyka, 1995), updated model by Brinkerhoff et al (2017)  .  At the minimum extent after a period of retreat the calving front typically ends at a point of constriction in fjord width and or depth that limits calving.  With time sedimentation in front of the glacier reduces water depth and calving rate, allowing the glacier to begin to advance. In the case of the Taku Glacier after a century of advance the glacier had developed a substantial proglacial outwash and moraine complex that had filled in the fjord and the glacier was no longer calving, images below from 1961 and 1981 illustrate this.  This allowed the advance to continue through the rest of the 20th century and into the 21st century.  The slowing of the advance in the latter half of the 20th century has been attributed to the impedance of the terminus outwash plain shoal (Post and Motyka, 1995; Pelto and Miller, 1990). There is a concave feature near the terminus with an increase in crevassing where the push impacts flow dynamics as seen at black arrow in 1975 and 1998 images below. In 1980’s the Taku Glacier’s accumulation area ratio was still strong enough for Pelto and Miller (1990) to conclude that the Taku Glacier would continue to advance for the remaining decade of the 20th century, which it did.

Beginning in 1946 the Juneau Icefield Research Program began annual mass balance measurements that is the longest in North America. In conjunction with JIRP and its first director Maynard Miller we compiled and published an annual mass balance record in 1990.  From 1990 to the present in conjunction with JIRP and Chris McNeil we have continued to compile and publish this annual mass balance record (Pelto et al 2013).  This mass balance record has been updated as of April 2020 (McNeil et al 2020). Much of the remarkable data record of JIRP has this month been made accessible to the public, particularly through the efforts of Seth Campbell, JIRP director, Scott McGee, survey team director and Chris McNeil, mass balance liaison with USGS.

The ELA in 2018 and 2019 in Landsat images, purple dots indicate the record high snowlines for the 1946-2019 period that occurred both in 2018 and again 2019, Pelto (2019)  

Taku Glacier is one of the thickest known alpine temperate glacier, it has a maximum measured depth of 1480 m and its base is below sea level for 40-45 km above the terminus (Nolan et al 1995).   Moytka et al (2006) found that the glacier base was more than 50 m below sea level within 1 km of the terminus, and had deepened substantially since 1984. This suggests a very long calving retreat could occur. The glacier had a dominantly positive mass balance of +0.42 m/year from 1946-1988 and a dominantly negative balance since 1989 of  -0.34 m/year (Pelto et al 2013). . This has resulted in the cessation of the long term thickening of the glacier.  On Taku Glacier, the annual ELA (end of summer snowline altitude) has risen 85 m from the 1946-1988 period to the 1989-2019 period.  During the 70+ year annual record the ELA had never exceeded 1225 m until 2018, when it reached 1425 m ( Pelto (2019) ).  In 2019 the ELA again has reached a new maximum of 1450 m (see above images). Contrast the amount of the glacier above the snowline in 2018 and 2019 to other recent years that had more ordinary negative balances (see Landsat images below).

In 2008 and 2012 JIRP was at the terminus, creating the map below.  There was no change at the east and west side of the margin since 2008 and 55 to 115 m of advance closer to the center. The glacier did not advance significantly after 2013, and did not retreat appreciably until 2018. The Taku Glacier cannot escape the result of three decades of mass losses, with the two most negative years of the record being 2018 and 2019. The result of the run of negative mass balances is the end of a 150+ year advance and the beginning of retreat. Sentinel images from 2016 and 2019 of the two main termini Hole in the Wall Glacier right and Taku Glacier left. The yellow arrows indicate thinning and the expansion of a bare rock trimline along the margin of the glacier. The Hole in the Wall terminus has retreated more significantly with an average retreat of ~100 m.  The Taku main terminus has retreated more than 30 m along most of the front.  A terminus change record has been published as of April 2020 (McNeil et al 2020).

The retreat is driven by negative balances, mainly by increased surface melt.  The equilibrium flow of the Taku Glacier near the long term ELA for the 1950-2005 period was noted by Pelto et al (2008). This occurred during a period of glacier thickening, average profile velocity was 0.5 md-1  (Pelto et al 2008). Since 1988 the glacier has not been thickening near the snowline as mass balance has declined slightly (Pelto et al 2013). The remarkable velocity consistency measured by JIRP surveyors led by Scott McGee each year at profile 4 has continued.  It is below this profile that surface ablation has reduced the volume of ice headed to the terminus.

All other outlet glaciers of the Juneau Icefield have been retreating, and are thus consistent with the dominantly negative alpine glacier mass balance that has been observed globally (Pelto 2017).  Now Taku Glacier joins the group unable to withstand the continued warming temperatures.  Of the 250 glaciers I have personally worked on it is the last one to retreat. That makes the score climate change 250, alpine glaciers 0.

1890 United States Coast Guard Map indicating deep water in the fjord in front of Taku Glacier. 


Map of terminus change from Lawrence (1950).


Taku Glacier aerial photograph from US Navy in 1948.  Still minor calving on right (east side).


Taku Glacier in 1961 photograph indicating calving had ended. 


Taku Glacier in 1981 photograph with the well developed outwash plain (Pelto).


Map of Terminus Change from Miller and Pelto (1990)


Maynard Miller image of Taku Glacier and Norris Glacier in 1975, not concave flexure point at black arrow.


Photograph of Taku Glacier and Norris Glacier in 1998, not concave flexure point at black arrow (Pelto)


JIRP terminus survey map of 2008 and 2012 surveys. 


Equilibrium line altitude (ELA) from 1946-2019.


ELA in 2013, 2014, 2015 and 2017 in Landsat images.


This is a view across the glacier accumulation area that until 2018 had always been snowcovered at the end of summer (Pelto).


Gilkey Glacier Retreat Leads to Rapid Lake Expansion in 2019

Gilkey Glacier in 1984 and 2019 Landsat images indicating retreat of 4300m, tributary separation and 5 km2 lake expansion. A=Terminus tongue, B=Battle Glacier, G=Gilkey Glacier and T=Thiel Glacier.

Gilkey Glacier draining the west side of the Juneau Icefield has experienced dramatic changes since I first worked on the glacier in 1981.   The Gilkey Glacier is fed by the famous Vaughan Lewis Icefall at the top of which Juneau Icefield Research Program (JIRP) has its Camp 18 and has monitored this area for 70 years. Here we examine the changes using Landsat images from 1984, 2014, 2018 and 2019.  Landsat images are a key resource in the examination of the climate change response of these glaciers (Pelto, 2011). The August 17th 1984 image is the oldest high quality Landsat image, I was on the Llewellyn Glacier with  JIRP on the east side of the icefield the day this image was taken. JIRP was directed by Maynard Miller at that time and by Seth Campbell now.

In 1984 Gilkey Glacier terminated in a new proglacial lake that had  and area of 1.5 km2 (#1). At #2 Thiel and Battle Glacier merged and then joined Gilkey Glacier. Arrow #3 and #4 indicates valleys which tongues of the Gilkey Glacier flow into, at #3 the glacier extended 1.6 km upvalley.  At arrow #4 the glacier extended 1.5 km up Avalanche Canyon.  At #6, #7 and #9 tributaries flow into the Gilkey Glacier.  At #8 Antler Glacier is a distributary glacier terminus that spilled into a valley terminating short of Antler Lake.

By 2014 the proglacial lake had expanded to 3.65 km2 as the glacier has retreated 3200 m.  Thiel and Battle Glacier have separated from Gilkey Glacier and from each with a retreat of 2600 m for Thiel Glacier and 1400 m for Battle Glacier. The glacier no longer flows into the valley at #4. Tributaries at #6 and #9 no longer reach Gilkey Glacier.  At #7 there is not a direct flow connection, but is still an avalanche connection.  At #8 Antler Glacier has retreated 2200 m.

In 2018 and 2019 the snowline on the Juneau Icefield has been the highest of any year since observations began in 1984.  This will accelerate mass loss and lead to continued extensive retreat.  In 2018 the snowline was at 1600-1650 m on Sept. 16. In 2019 the snowline on Gilkey Glacier was 1650-1700 m on Sept. 10.  In July of 2019 the terminus tongue of the glacier reached across the junction of the Gilkey and Battle Valley, separating the two proglacial lakes.  By September 10, the glacier tongue had broken off leading to the two lakes joining expanding the size of the proglacial lake to 6.5 km2. The terminus has retreated 4300 m since 1984, while the lake has increased in size by more than 400%. The retreat will continue leading to additional lake expansion just as is occurring at Meade and Field Glacier.

The expansion of Gilkey Lake into the Battle Valley in 2019 Landsat images.

Gilkey Glacier in 1984 and 2019 Landsat images indicating retreat of 4300m, tributary separation and 5 km2 lake expansion. A=Terminus tongue, B=Battle, Bu=Bucher, G=Gilkey, T=Thiel, V=Vaughan Lewis. Snowline=purple dots.

Gilkey Glacier in 2014 and 2018 Landsat images indicating retreat, snowline elevation and lake expansion. 


Mendenhall Glacier, Alaska Accumulation Zone Shrinks

Mendenhall Glacier in Landsat images from 1984 and 2018.  Yellow arrows indicates 1984 terminus location, read arrow the Suicide Basin tributary and the purple dots the snowline.

Mendenhall Glacier is the most visited and photographed terminus in the Juneau Icefield region. The glacier can be seen from the suburbs of Juneau.  Its ongoing retreat from the Visitor Center and the expansion of the lake it fills is well chronicled.  Here we document the rise in the snowline on the glacier that indicates increased melting and reduced mass balance that has driven the retreat.  The change in snowline from 1984-2018 and the associated retreat are documented. The snowline as July begins in 2019 is already in the end of summer range.  In 1984 I had a chance to ski across the upper portion of this glacier. Photo736861842897_inner_76-402-615-387-84-752-620-741

Top of the Mendenhall Glacier at 1500 m looking towards ocean in 1984.

Mendenhall Lake did not exist until after 1910, in 1948 it was 2.2 km across and by 1984 the lake was 2.7 km across.  Boyce et al (2007) note the glacier had two period of rapid retreat one in the 1940’s and the second beginning in the 1990’s, both enhanced by buoyancy driven calving. The latter period has featured less calving particularly in the last decade and is a result of greater summer melting and a higher snowline by the end of the summer, which has averaged 1250 m since 2003 vs 1050 m prior to that (Pelto et al, 2016).  In 2005, the base of the glacier was below the lake level for at least 500 m upglacier of the terminus (Boyce et al (2007).  This suggests the glacier is nearing the end of the calving enhanced retreat.  It is likely another lake basin would develop 0.5 km above the current terminus, where the glacier slope is quite modest.

Photo736861827670_inner_51-268-606-268-57-633-606-633

Terminus of Mendenhall Glacier before the 1982 field season on the Juneau Icefield.

The glacier in 1984 ended at the tip of a prominent peninsula in Mendenhall Lake. The snowline is at 950 m. In 1984 with the Juneau Icefield Research Program we completed both snowpits and crevasse stratigraphy that indicated retained snowpack at the end of summer is usually more than 2 m at 1500-1600 m. The red arrow indicates a tributary that joins the main glacier, where Suicide Basin, currently forms. In 2014 the snowline in late August  is at 1050 m.  The terminus has retreated to a point where the lake narrows, which helps reduce calving. In 2015 the snowline is at 1475 m.  In  2017 the snowline reached 1500 m.  There is a small lake in Suicide Basin. In September 2018 the snowline reached 1550 m the highest elevation the snowline has been observed to reach any year.  In Suicide Basin the lake drained in early July. In 2018 Juneau Icefield Research Program snowpits indicates only 60% of the usual snowpack left on the upper Taku Glacier, near the divide with Mendenhall Glacier. On July 1. 2019 the snowline is already as high as it was in late August of 1984.  This indicates the snowline is likely to reach near a record level again.  The USGS and NWS is monitoring Suicide Basin for the drainage of this glacier melt filled lake. In 2019 the lake rapidly filled from early June until July 8, water level increasing 40 feet.  It has drained from July 8 to 16 back to it early June Level. The high melt rate has thinned the Mendenhall Glacier in the area reducing the elevation of the ice dam and hence the size of the lake in 2019 vs 2018.

The snowline separates the accumulation zone from the ablation (melting) zone and the glacier needs to have more than 60% of its area in the accumulation zone.  The end of summer snowline is the equilibrium line altitude where mass balance at the location is zero. With the snowline averaging 1500 m during recent years this leaves less 30% of the glacier in the accumulation zone. This will drive continued retreat even when the glacier retreats from Mendenhall Lake. The declining mass balance despite retreat is evident across the Juneau Icefield (Pelto et al 2013).  Retreat from 1984-2018 has been 1900 m.  This retreat is better known, but less than at nearby Gilkey Glacier and Field Glacier.

Mendenhall Glacier in Landsat image from 2014.  Yellow arrows indicates 1984 terminus location and the purple dots the snowline.

Mendenhall Glacier in Landsat image from 2015.  Yellow arrows indicates 1984 terminus location and the purple dots the snowline.

Mendenhall Glacier in Landsat image from 2017.  Yellow arrows indicates 1984 terminus location and the purple dots the snowline.

Mendenhall Glacier in Landsat image from 2019.  Yellow arrows indicates 1984 terminus location and the purple dots the snowline.

Chickamin Glacier, Alaska Retreat Generates Separation and Lake Expansion

Chickamin Glacier, Alaska in 1985 and 2018 Landsat images indicating the 3.5 km retreat and associated lake expansion. Red arrow is 1985 terminus location, yellow arrow is the 2018 terminus location, pink arrow is former junction area with Through Glacier.  The purple dots indicate the snowline.  Point 1 and 2 are locations of bedrock expansion above the equilibrium line altitude. 

Chickamin Glacier in southeast Alaska glacier drains south from an icefield near Portland Canal and straddling the border with British Columbia. The glacier ended on an outwash plain in 1955 at an elevation of 250 meters.  Shortly thereafter a lake began to form, and by 1979 a Landsat image indicates a lake that is 1300 meters long and a retreat of ~2.5 km from 1902-1979 (Molnia, 2008). The glacier at that time was fed by a substantial tributary entering from the south ~5 km above the terminus, Through Glacier-pink arrow. Here we examine Landsat images from 1985-2018 to identify the response to climate change.

In 1985 the glacier terminated at an elbow in the lake where the lake both narrows temporarily and turns east, red arrow. The glacier had terminated close to this location for 30 years. The snowline is at 1150 m, and Through Glacier still connects to Chickamin Glacier.  At point 1 and 2 the area of exposed bedrock is limited. In 1994, the glacier has retreated 500 m from the elbow.  Through Glacier has separated from Chickamin Glacier. The snowline in 1994 is at 1125 m.  In 2013, Through Glacier has retreated 1600 m from Chickamin Glacier. Chickamin Glacier has retreated 2 km since 1985 and the snowline is at 1250 m.  By 2018 Chickamin Glacier has retreated 3.5 km since 1985 a rate of just over ~100 m/year, yellow arrow. The terminus is currently at a point where the lake narrows, which should reduce the retreat rate.  In 2018, the snowline reached 1525 m, leaving only 10-15% of the glacier in the accumulation zone.  The exceptionally high  snowline in 2018 was also noted at Taku Glacier. The snowline from 2014-2018 has persistently been above 1350 m, which indicates substantial negative mass balance for the glacier that will drive continued retreat. The persistent snowline elevation above 1250 m is indicated by the expansion of bedrock areas at Point 1 and 2 from 1985 to 2018, which both are located in what was the typical accumulation zone prior to that time.

The sustained mass balance losses follow that of Lemon Creek Glacier, which has a a long term record from 1953-2018 indicating a loss of  ~-0.5 m/year (Pelto et al. 2013).  The retreat and lake expansion has become a chorus with more than 20 coastal Alaskan glaciers having at least a 2 km lake expansion due to retreat since 1984, documented individually in previous posts at this blog.

Chickamin Glacier, Alaska in 1994 and 2013 Landsat images indicating the 3.5 retreat and associated lake expansion. Red arrow is 1985 terminus location, yellow arrow is the 2018 terminus location, pink arrow is former junction area with Through Glacier.  The purple dots indicate the snowline.  Point 1 and 2 are locations of bedrock expansion above the equilibrium line altitude. 

USGS map of Chickamin Glacier based on 1948 aerial photographs

Excelsior Glacier, Alaska Retreat Leads to Lake Doubling in Size

Excelsior Glacier retreat from 1994 to 2018 in Landsat images from 1994, 2011 and 2018.  The red arrow is the 1994 terminus location and the yellow arrow is the 2018 terminus location.  Point A and B are on the south and northwest side of the eastern tributary of the glacier.

Excelsior Glacier is an outlet glacier of the Sargent Icefield, on the Kenai Peninsula of Alaska, that has terminated in an expanding Big Johnstone Lake since 1941. Here we examine the retreat of Excelsior Glacier from 1994-2018 using Landsat imagery. In 1909 the glacier ended on the strip of forested land between the lake and the ocean (Molnia, 2007). By 1950 the glacier had retreated 2 km from this strip of land creating the new lake (USGS-Molnia, 2008).  This blog post is source of an article published by the Washington Post and from NASA Earth Observatory.

In 1994 the glacier was 21 km long and had retreated 5.5 km from the southern margin of Big Johnstone Lake, this is a rate of ~100 m/year since the lake began forming 1941.  There is a glacier dammed lake just south of Point A named Excelsior Lake. By 2001 the glacier had retreated 800 m from the 1994 position, a rate of ~100 meters per year, and the glacier dammed lake south Point A remains, along with a few large icebergs. By 2011, the glacier had retreated beyond the former glacier dammed lake and ended at the prominent ridge just north of this former lake, adjacent to Point A, and the new inlet that replaces it. The glacier has retreated 2200-2500 m depending where on the front the measurement is made. By 2013 the glacier has retreated back to the junction of the two main tributaries between Point A and B.  The snowline is at 900 m, with more than 80% of the glacier falling below the snowline.  A calving Alaskan glacier typically needs at least 60% of its area above the snowline consistently to be in equilibrium. In 2011 and 2013 images there are large icebergs in Big Johnstone Lake indicating active calving. In 2018 the snowline is at 925 m again leaving an insufficient accumulation zone to support the glacier. Big Johnstone Lake has expanded to a length of 10.2 km, with an area of 18 km2.  The glacier has retreated 4.7 km from 1994-2018, a rate of ~200 m/year, twice the previous rate.  The eastern and western tributaries have now fully separated.  Johnstone Adventure Lodge visited the eastern tributary, they call it Roan Glacier, glacier in May of 2019, the photograph they provided below indicates the glacier has receded from the lake.  The glacier in 2018 is 15 km long having lost ~30% of its length in 24 years. Big Johnstone Lake is nearing its maximum size as the glacier surface slope steepens within 1 km of the current terminus, indicating a substantial increase in elevation of the base of the glacier. The lake width has changed little and is 1.4-1.8 km wide in the region the terminus has been retreating through during the last 25 years are has doubled from 9 to 18 km2.  There will be a reduction in calving and retreat rate as the lake development nears completion, in 2018 for the first time there are no visible icebergs. Johnstone Adventure Lodge observed 15-20 harbor seals during their first visit to the glacier front in 2019, 10 of them had pulled out on icebergs.  A reduction in icebergs will make the lake less attractive to harbor seals.

Excelsior Glacier follows the pattern of retreat of the neighboring Ellsworth Glacier and  Pedersen Glacier of the Harding Icefield. This glacier is seen as a model for the impending retreat of Brady Glacier (Pelto et al, 2013).

Excelsior Glacier retreat from 1994 to 2018 in 1984 USGS map and Landsat images from 2001 and 2013.  The red arrow is the 1994 terminus location and the yellow arrow is the 2018 terminus location.  Point A and B are on the south and northwest side of the eastern tributary of the glacier.

“Roan Glacier”  the eastern tributary of Excelsior Glacier in May 2019 now terminating on an outwash plain.  Image from Johnstone Adventure Lodge.

Lemon Creek Glacier 2018 Ablation and Glacier Runoff

Lemon Creek Glacier (L) with the snowline (black line) indicated in Landsat images from July 5, July 30 and Sept. 16 2018. P=Ptarmigan Glacier, T=Thomas Glacier, red arrow is the 1948 terminus location. A,B and C mark firn horizons exposed by the loss of all snowpack in the accumulation zone.

The summer of 2018 was exceptional for warmth in Southeast Alaska.  July was the most unusual with Juneau recording daily highs above 70 F on 18 days, including 12 consecutive days at the end of the month.  The average temperature in July in Juneau was 2.4 C above average and the warmest average monthly temperature in history. Precipitation was recorded on just 6 days of precipitation at the Long Lake SNOTEL site in the mountains near Juneau. This resulted in the highest observed snowline of the 70 year record on Taku Glacier, a 25 km2 snow swamp developing in three days on Lowell Glacier and the loss of all snowpack on Lemon Creek Glacier.  For a glacier to be in equilibrium most glaciers need to be more than 50% snowcovered.  On Lemon Creek Glacier at the end of the summer the glacier must be covered 62% to be in equilibrium (Pelto et al 2013).  The Lemon Creek Glacier is a reference glacier of the World Glacier Monitoring Service, with mass balance measured since 1953 by the Juneau Icefield Research Program (JIRP).  The USGS began monitoring the glacier in 2016 and currently reports mass balance to WGMS, Chris McNeil (USGS) is leading a reanalysis of the mass balance record. The cumulative mass loss from 1953-2018 is ~37 m w.e, with 2018 having the most negative balance of -2.31 m w.e. The area of the glacier has declined from 12.8 square kilometers in 1948 to 9.7 square kilometers in 2018, a 24% decline.  For the glacier to provide an equivalent runoff ablation rates would have had to rise by 24%.

In 2018 on July 5 2018 the snowline on Lemon Creek Glacier was at 950 m.  From July 4-6 a series of snowpits were dug on the glacier by JIRP yielding a retained snowpack ranging from 0.9 m (water equivalent=w.e.) to 1.2 m (w.e.).  One of the snowpits with 0.9 m w.e. was at 1075 m.  On July 30 the snowline had reached 1100 m, indicating approximately 0.9 m of snow ablation in that 21 day interval. Because ice ablates faster than snow, 36% faster on Lemon Creek Glacier this would equate to  ~1.2 m of ice ablation. By September 2 the snowline had risen above the top of the glacier, with one small snowpatch in the northwest corner at 1200 m, firn horizon exposed by snowpack loss are evident .  This remains the case in the Sept. 16 image.  The small snowpatch also melted away by the end of September.  There was no accumulation zone for the third time in the last five years,indicating this glacier cannot survive current climate (Pelto, 2010).

The consistency of the balance gradient, seen below from year to year allows for determination of melt rates and runoff based on the rise of the snowline.  The transient snow line migration rate times the balance gradient yields ablation rate at the snowline (Pelto, 2011). The impact of a greater area of surface ice exposed is increased ablation.  To illustrate this impact if we as an example take a day with a mean temperature of 10 C:

This would yield 350,000 m3 of melt on July 5, the glacier was 23% bare ice and 77% snow cover on this date.

This would yield 382,000 m3 of melt on July 30, the glacier was 41% bare ice and 59% snow cover on this date.

This would yield 480,000 m3 of melt on Sept. 16, the glacier was 97% bare ice/old firn and 3% snow cover on this date.

The actual July 5 temperature for Lemon Creek Glacier was 12 C. This yields 420,000 m3 of runoff.

The actual July 30 temperature for Lemon Creek Glacier was 11.5 C. This yields 440,000 m3 of runoff.

The actual Sept. 16 temperature for Lemon Creek Glacier was 1.5 C. This yields 72,000 m3 of runoff.

Base map of Lemon Creek Glacier from 2014 prepared by Chris McNeil (JIRP and USGS).  The blue dots are JIRP 2018 snowpit locations and the lines are the snowline on the respective dates. Camp 17 is the JIRP camp used for Lemon Creek Glacier research, including the upcoming 2019 field season.

USGS topographic map based on 1948 aerial photographs. On right is the hillshade image from 2011, margin is the black dots.

Image of the glacier on 9/2/2018 indicating firn horizons and the small remaining snowpack in the southwest corner.

Balance gradient of Lemon Creek Glacier, note the consistency.


Skilak Glacier, Alaska Retreat and Salmon Connection

Skilak Glacier in 1986 and Sept. 2018 Landsat images.  In 1986 icebergs and remnant glacier fill nearly the entire lake.  The snowline in 1986 is at 1200 m and is at 1300 m in 2018. Red arrow is the 1982 terminus location and yellow arrow is the 2018 terminus location. Point A and C are bedrock outcrops at around 1200 m that have expanded.

Skilak Glacier is an outlet glacier on the northwest side  of the Harding Icefield, Kenai Peninsula, Alaska. From 1952-1982 Skilak glacier terminated on a proglacial plain with a broad nearly flat terminal lobe, see map below. The glaciers that drain eastward are in the Kenai Fjords National Park, which has a monitoring program.  From 1950-2005 all 27 glaciers in the Kenai Icefield region examined  retreated (Giffen et al 2014).  Giffen et al (2014) observed that retreated 1,800 m from from 1986-2000, with no retreat from 2000-2005. Here we examine Landsat imagery from 1986-2018 to illustrate the retreat of this glacier, recent snowline elevation and other upglacier changes. The glacier supplies meltwater to Skilak Lake which is a critical salmon habitat for the Kenai.  Chinook Salmon spawn on a section of the Kenai River between Kenai Lake and Skilak Lake. With Skilak Lake being the resulting home for ninety percent of the salmon fry for the Kenai River, and with the most of any nursery in the Cook Inlet area.  Escapements of chinook in the Kenai River exceed 50,000 annually in two runs (Heard et al 2007). Sockeye salmon is the largest run in the river with over 1,000,000 annual in the Kenai River run (Schoen et al, 2017).

In the 1958 USGS map from there is no lake evident at the terminus of the glacier.  The lower 2 km of the glacier is nearly flat.  By 1986 the flat terminus was breaking up with icebergs filling the lake. By 2002 the glacier had retreated 4 km generating a lake with an area of 6.2 square kilometers. The snowline in 2002 was at 1200 m.  The glacier retreated 300 m from 2002 to 2018.  From July 2018 to Sept. 2018 the snowline rose from 1050 m to 1300 m.  Though retreat has been slow since 2002 upglacier thinning has been substantial At Point A and C from 1986 to 2018 and at Point A and B from 2002-2018. This will drive additional retreat.  The retreat rate should be more in line with that of the neighboring Harris Glacier. 

Skilak Glacier  1958 Map prior to lake formation.

Skilak Glacier in 2002 and July 2018 Landsat images.  In 2002 is at 1100 m and is at 1150 m in July 2018. Red arrow is the 1982 terminus location and yellow arrow is the 2018 terminus location. The orange arrow indicates indicated banded snow formation.  Point A and B are bedrock outcrops at around 1200 m that have expanded.


Wrangell Mountain Icefields, Alaska Lose their Snowcover 2016 and 2017

Mount Gordon Icefield (MG) Mesa Creek Icefield (MC) and Icefield Plateau (IP) in 2016 and 2017 Landsat imagery.  The purple dots indicate the areas with retained snowcover in both years. Nabesna Glacier (N) is the largest glacier in the Wrangell Mountains, just a corner seen here.

Mount Gordon Icefield (MG) Mesa Creek Icefield (MC) and Icefield Plateau (IP) are three neighboring Icefields in the Wrangell-Saint Elias National Park and Preserve in Alaska.  Each has a principal accumulation area between 2300 and 2550 m, with a limited area above .  The area of Mount Gordon Icefield is ~10 square kilometers, Mesa Creek Icefield ~12 square kilometers and Icefield Plateau ~35 square kilometers. This is a region that has been experiencing significant mass loss.  Das et al (2014) used repeat altimetry measurements to identify accelerated mass loss over the Wrangell Mountains, from –0.07 ± 0.19 m w.e./year during 1957–2000 to –0.24  m w.e./year during 2000–07.  Larsen et al (2015) identified that the Wrangell Mountains experienced a mass balance of -0.5 to -1 m/year  from 1994–2013 using laser altimetry.

On August 17, 2016 less than 10% of the Icefield Plateau is snowcovered, with the snowline at 2500 m.  The snowline is at 2400 m on Mount Gordon Icefield and Mesa Creek Icefield with 30% of each icefield retaining snowcover.  On August 4, 2017 there is insignificant retained snowcover on Mesa Creek Icefield.  The snowline is at 2500 m on both Mount Gordon Icefield and Icefield Plateau with less than 10% overall retained snowcover.  The lack of retained snowcover across most of the former accumulation area from 2300-2550 m indicates these icefields will have substantial icefield wide thinning.  In addition the lack of a persistent substantial accumulation zone indicates the icefield will not survive, though a small mountain glacier may remain on the est side of Mount Gordon and the southern edge of the Icefield Plateau. In 2018 there is not a good cloud free August image from this region. The high snowline and rapid melt on nearby Lowell Glacier suggest the snowline would again have been high. This will lead to substantial retreat of the icefield margins and is indicative of the retreat of large glaciers in the range such as Nizina Glacier or Yakutat Glacier in the Saint Elias Range.

Mount Gordon Icefield (MG) Mesa Creek Icefield (MC) and Icefield Plateau (IP) in topographic map.

Mount Gordon Icefield (MG) Mesa Creek Icefield (MC) and Icefield Plateau (IP) in 1999 Landsat image.  The purple dots indicate areas with retained snowcover. N=Nabesna Glacier.

Mount Gordon Icefield (MG) Mesa Creek Icefield (MC) and Icefield Plateau (IP) in 2001 Landsat image.  The icefield are nearly fully covered with snow. N=Nabesna Glacier.