Burroughs Glacier, Alaska Down to Last 1%

Burroughs Glacier in 1986 and 2022 Landsat images. The red arrow marks the west margin and the yellow arrow the east margin in 1986. Yellow dots mark the outline of the glacier in 2022. Glacier area declined from 12.5  km² to 1.5 km² during this 36 year period.

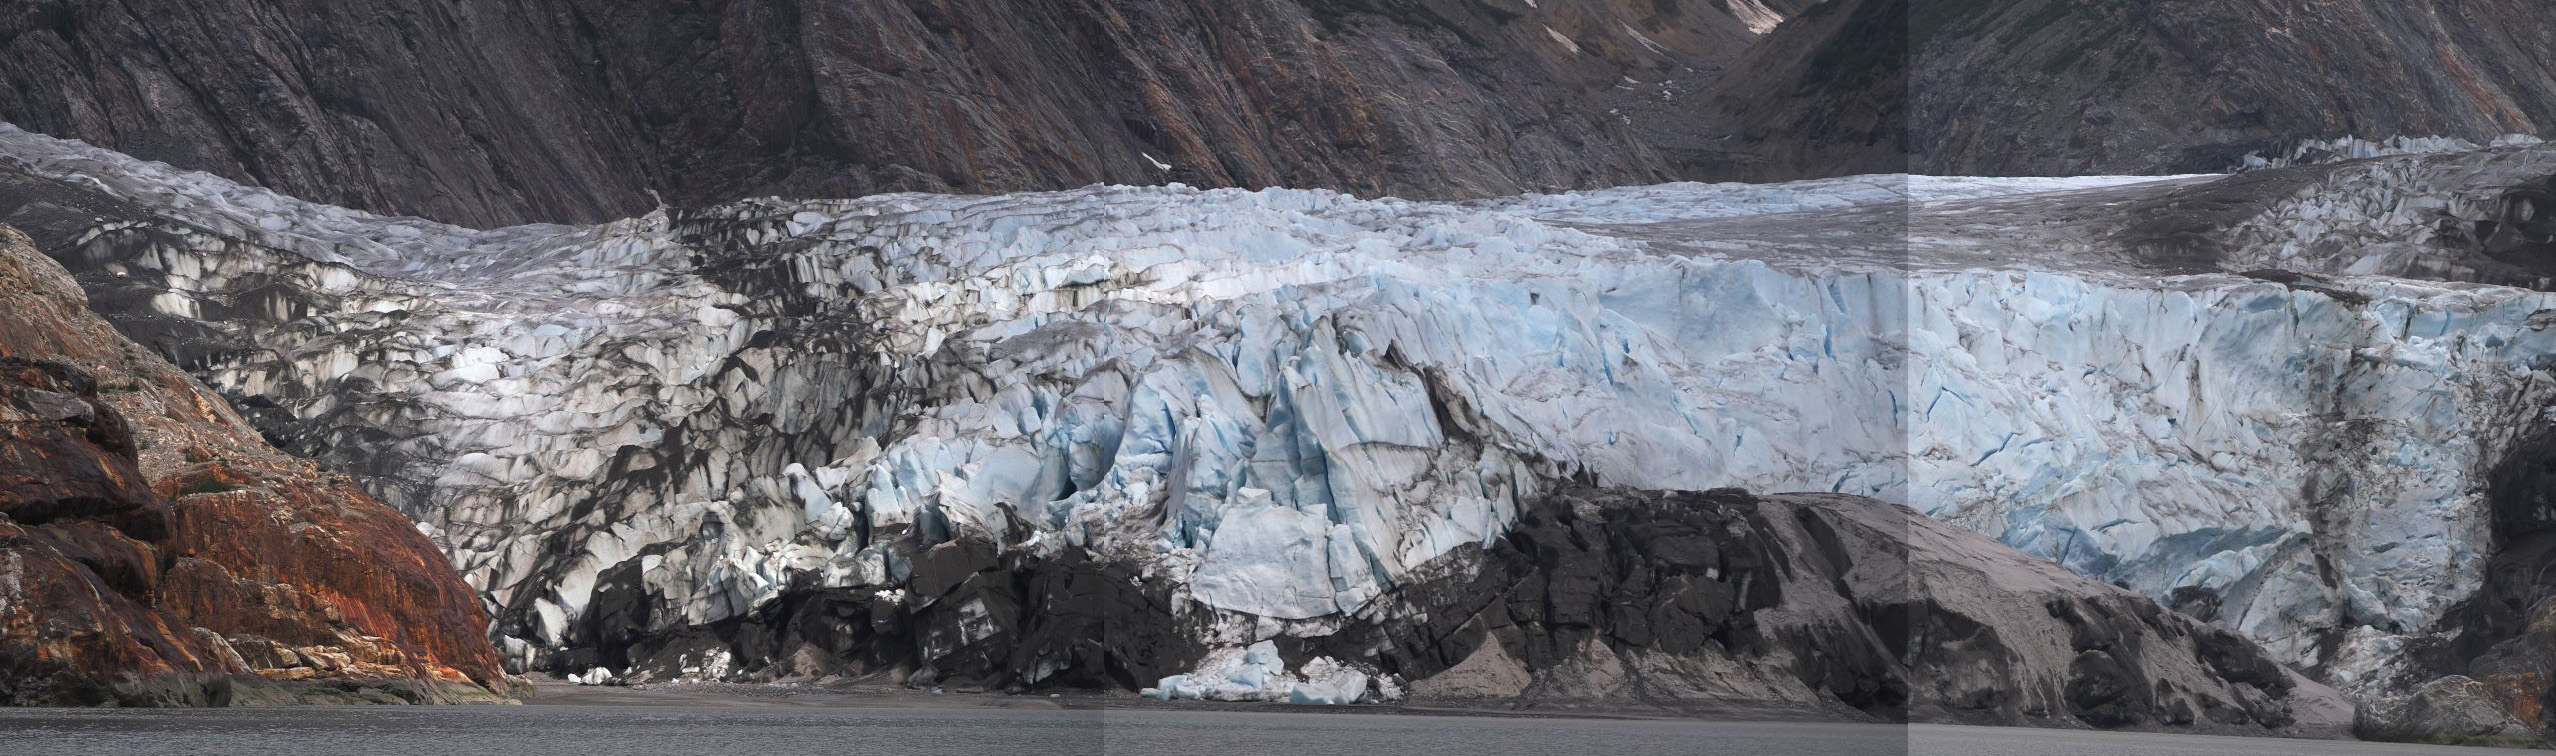
Burroughs Glacier in Glacier Bay National Park, Alaska has been retreating without pause since 1892 when it was part of the Muir Glacier complex. The glacier is unusual in that it has not had an accumulation zone over the last century, where snow persists through the year. Without an accumulation zone a glacier cannot survive (Pelto, 2010). Mickelson (1971) summarized the retreat of the glacier from 1892-1960. In 1892 the Burroughs ice plateau was assessed as a 10 km by 25 km ice cap. By 1960 it had thinned by as much as 750 m and its calving margin had retreated 27 km.. By the 1970’s the glacier was essentially stagnant (Molnia, 2008). In 1982 I briefly visited the western terminus, which provided a still imposing slope, made more so by the rain and clouds lowering onto its surface.

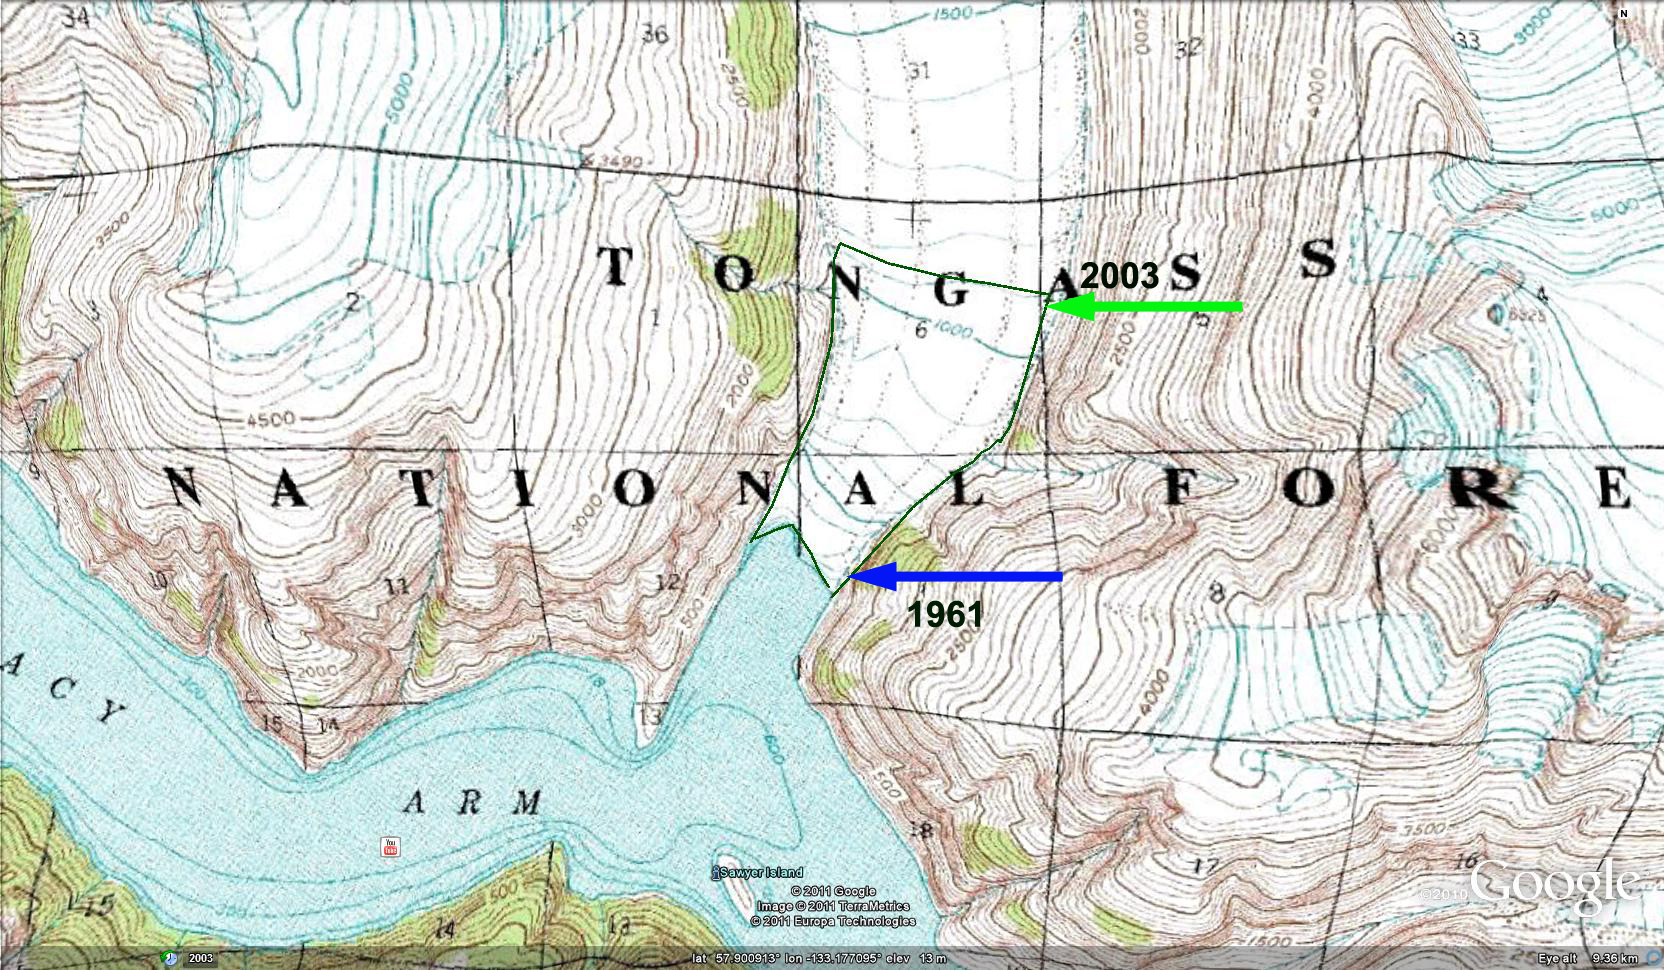
Here we examine the glacier in Landsat imagery from 1986 to 2022 to illustrate the retreat, the lack of snowcover  and the thinning. In the 1948 map of Burroughs Glacier, the glacier is 12.1 km long, and much of the glacier is already stagnant, the glacier has both a north and south terminus, purple arrows. To the west of Burroughs Glacier is Plateau Glacier (P).
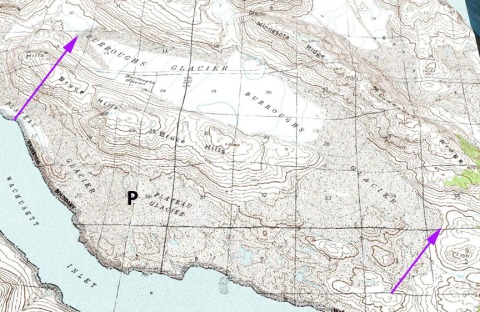
burroughs map

Burroughs Glacier in 1948 USGS map.

In 1948 Burroughs Glacier has an area of 22 km² and is 12.5 km long, with the crest of the glacier at ~1500 feet. In 1986 Burroughs Glacier has an area of 12.5 km² and has no snowcover by mid-summer. The glacier terminates in proglacial lakes at both the north and south terminus red and yellow arrow respectively, and is 9 km long, purple arrows indicate 1948 terminus. By 1986 Plateau Glacier has only three small remnants marked by P, surrounding these vegetation is still limited, with considerable expanse of bare glacial sediments. By 2003 Plateau Glacier is gone and vegetation is filling in most of the area that was still bare sediment in 1986. In 2003 Burroughs Glacier again lacks any snowcover. The southern terminus has retreated 2.2 km from the lake, and the northern terminus has retreated into a second lake basin. The glacier is 6.3 km long, half of its length in 1948. In 2004 snowcover is again lacking anywhere on the glacier. In 2010 snowcover is lacking and retreat has continued shrinking the glacier to 5.4 km in length.  The glacier was assessed with an area of 2.8 km² and a median elevation of  313 m (1025 feet) by GLIMS. In 2013 the glacier lacks snowcover in this September Landsat image even though snow has returned to the surrounding mountains. This indicates how far below the snowline the glacier lies. Portions of a glacier are supposed to be the first locations that receive snowcover. The terminus has continued to retreat and the glacier was 4.6 km long in 2013. The northern terminus was retreating into a third basin of the proglacial lake. Vegetation has reclaimed almost all of the Plateau Glacier area and has reclaimed the region deglaciated by Burroughs Glacier before 2003. By 2022 the glacier area has been reduced to 1.5 km², this is just 12% of its area remaining from 1986 and 1% of the 1892 area.  The length of the glacier in 2022 is 2.3 km, only 50% of the lenght just a decade ago, and ~20% of the 1948 length.

Thinning of this glacier from 1948-2016 is evident from a comparison of topographic maps. Thinning in remaining glacier are averages 225 m during this period, that is a rate of ~3.3 m/year. Larsen et al (2007) had found a thinning rate of ~3 m/year for the 1948-2000 period.

Overlay of 1948 (blue labeled contours) and 2014 elevation map (Brown labeled contours) for Burroughs Glacier.

Burroughs Glacier has not been in equilibrium with climate since the end of the Little Ice Age. Its retreat has been hastened by the rising snowline of the last decade note by Pelto et al (2013) on Brady Glacier. This glacier area has declined by 88% since 1986, with volume loss being even larger.  Retreat usually increases as elevation declines and as the size of the remnant ice declines. There is no debris cover or persistent snowcover to slow the loss. Thus, it seems likely this glacier will be gone within 25 years. The 2011 Google Earth image at bottom indicates no snow, the reduced albedo from the dirty surface and a few crevasses near the margin that are collapse features. This is unlike nearby glaciers that are retreating significantly but not disappearing, like Brady Glacier, Geikie Glacier, Yakutat Glacier and Riggs Glacier. 

r.

1986 Landsat image of Burroughs Glacier. The  purple arrows mark the 1948 margin, red arrow the west margin in 1986 and the yellow arrow the east margin.

2003 Landsat image of Burroughs Glacier. The red arrow marks the west margin in 1986 and the yellow arrow the east margin.

2004 Landsat image of Burroughs Glacier. The red arrow marks the west margin in 1986 and the yellow arrow the east margin.

2010 Landsat image of Burroughs Glacier. The red arrow marks the west margin in 1986 and the yellow arrow the east margin.

2013 Landsat image of Burroughs Glacier. The purple arrows mark the 1948 margin, red arrow the west margin in 1986 and the yellow arrow the east margin in 1986, pink arrows the 2013 margin.

2022 false color Sentinel image of Burroughs Glacier. The ice is dirty but not debris covered at this point.

 

Brady Glacier Retreat Causes Ice Dammed Spur and Trick Lake Drawdown

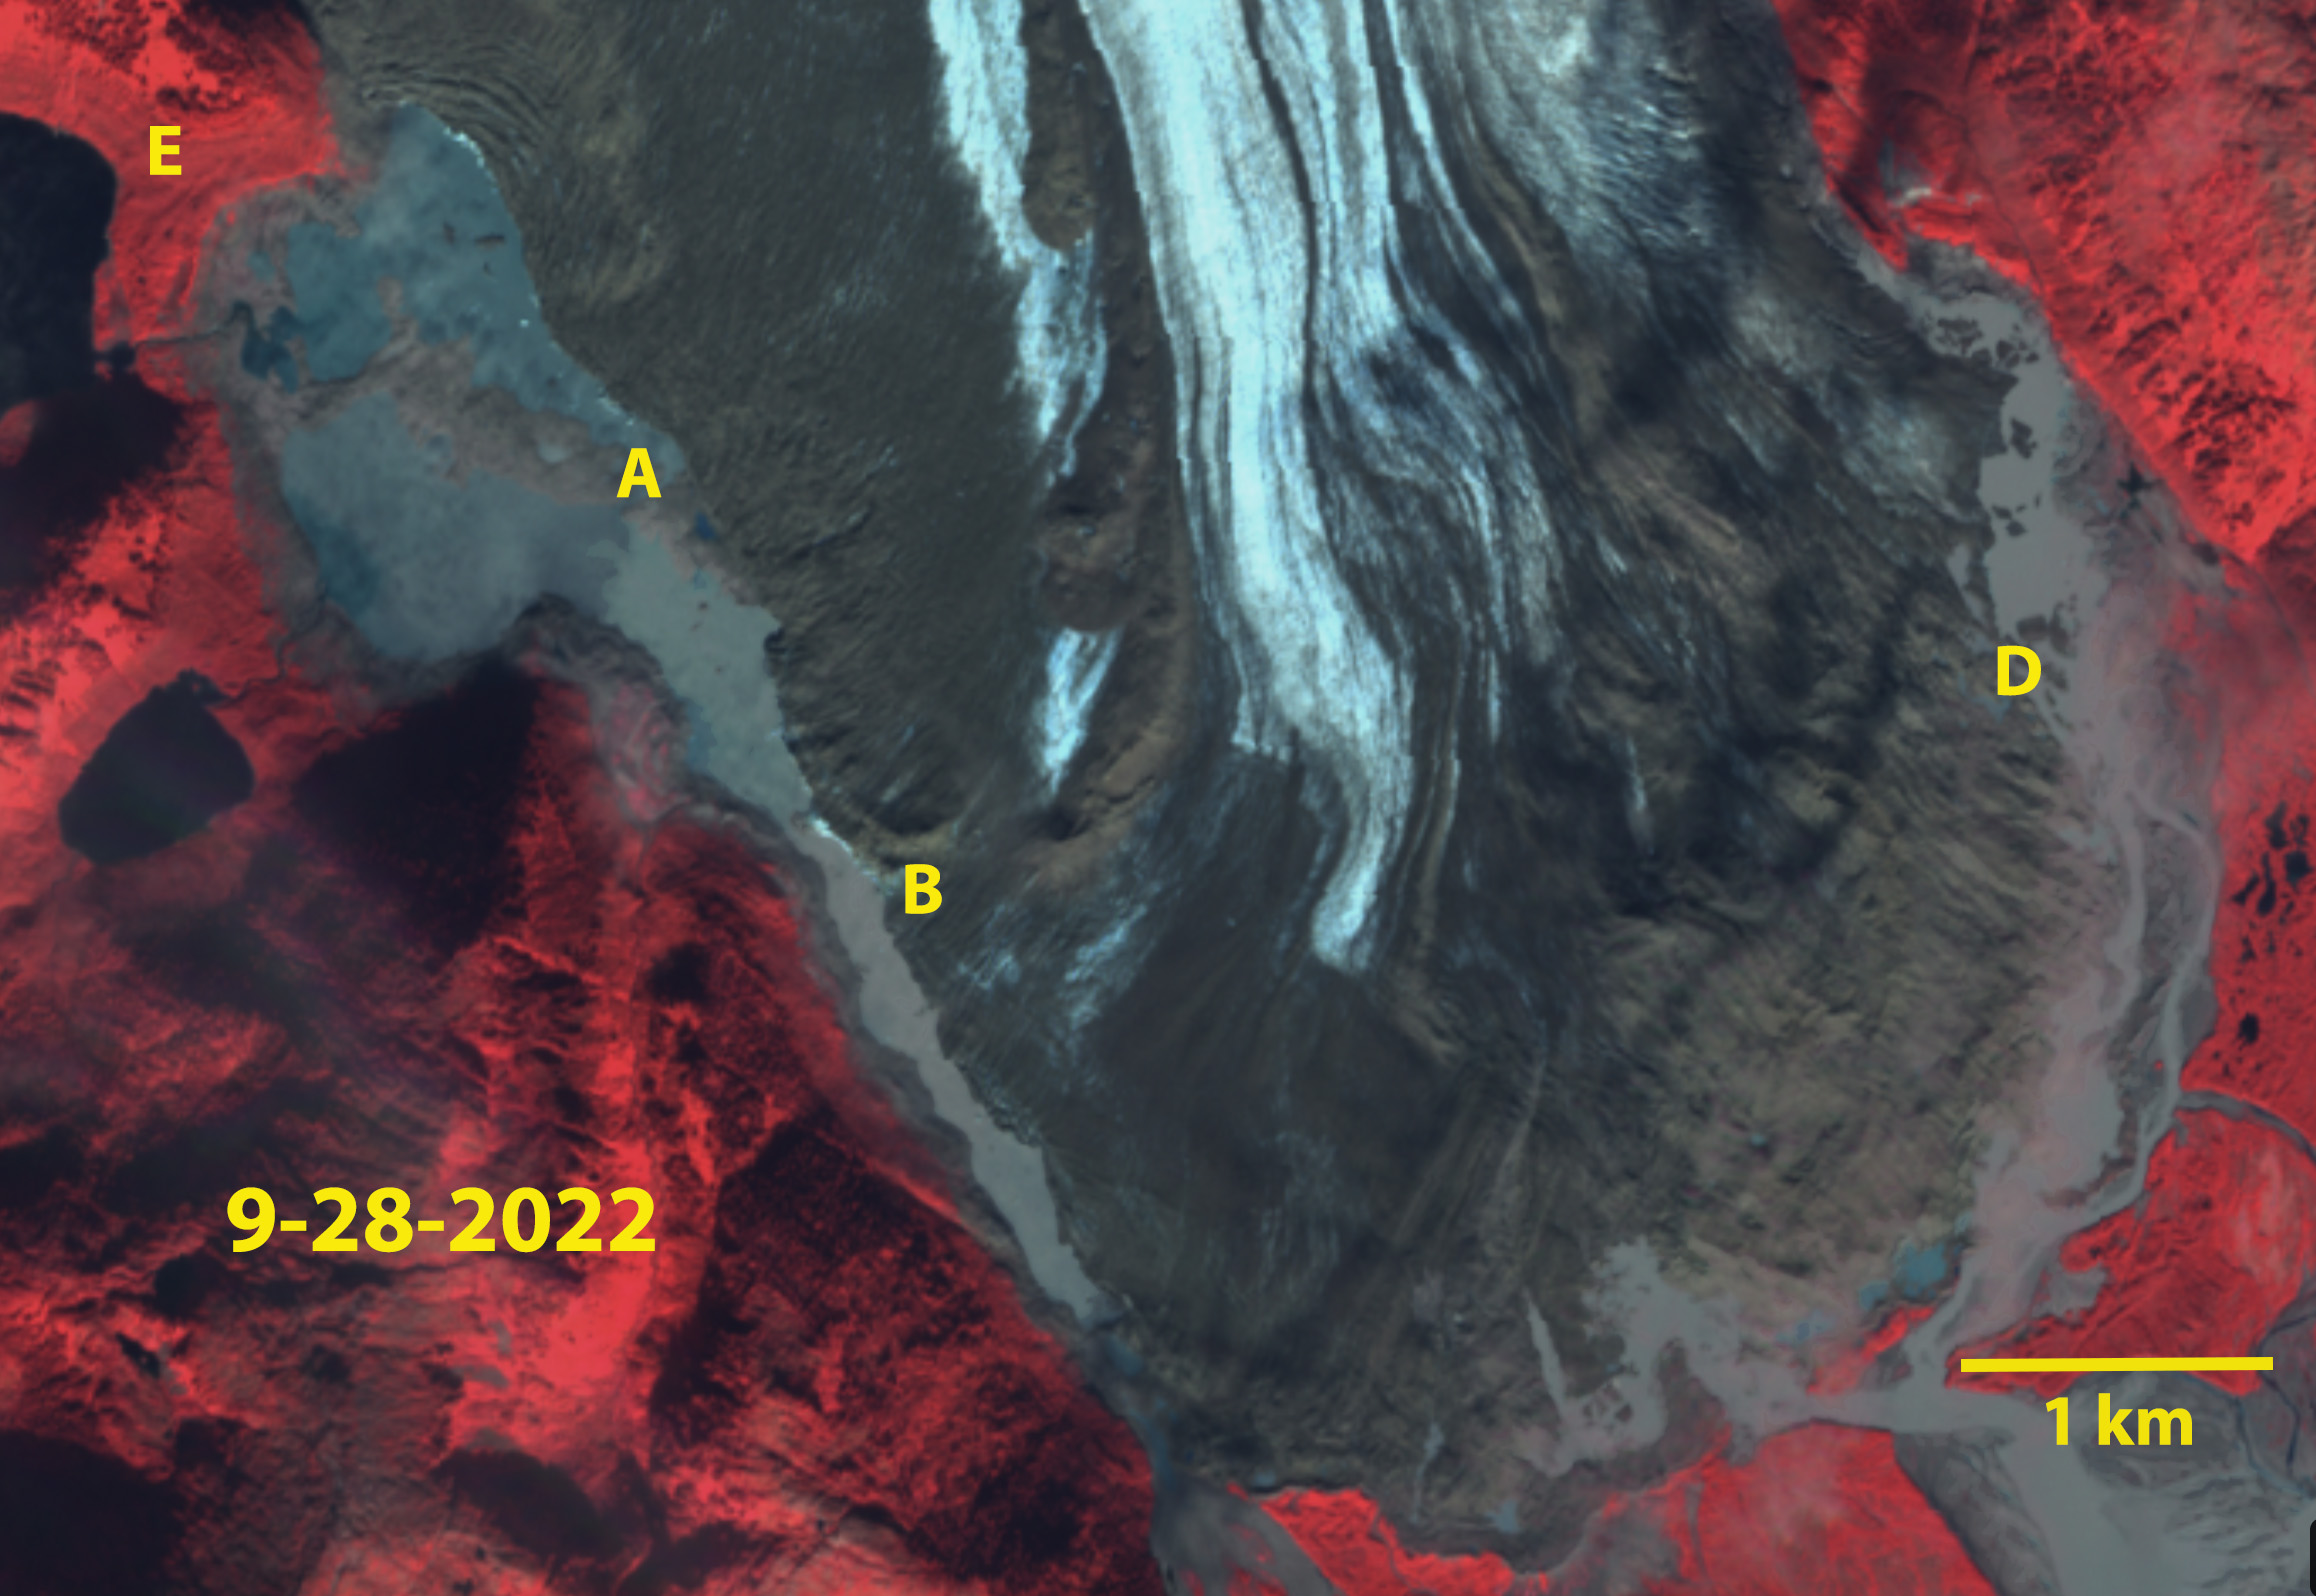
Brady Glacier terminus region in September 28, 2022 Sentinel image. Red dots indicate the 2016 margin. Point A marks the new isthmus exposed by falling lake water level. Point B-D are the expanded drainage channels.

Brady Glacier is a large Alaskan tidewater glacier in the Glacier Bay region that is beginning phase of substantial retreat that was forecast by Pelto et al (2013). The glacier has seven secondary termini in marginal ice dammed proglacial lakes. There was a consistent pattern in the change in position of the glacier margin at each of the lakes between 1948 and 2010. The rate of retreat of the glacier margin at all seven ice dammed lakes accelerated later during this period; the mean retreat rate was 13 m/a from 1948 to 2004 and 42 m/a from 2004 to 2010 (Pelto et al 2013). Lake area and calving fronts were measured for each lake: Spur, Abyss, North Deception, Bearhole, Oscar, and East Trick based on the September 2010 imagery, with earlier measurements from Capps  et al (2010). Lake areas can increase as a result of Brady Glacier marginal retreat, and can decrease due to declines in surface water levels as previously ice-dammed conduits form to drain the lake (Pelto 2016). Here we examine the changes in area of  Spur and Trick Lake from 2016-2022 during development of substantial marginal drainage channels. During this period the terminus of the glacier has retreated on average 175 m, with 300 m of retreat from its maximum position advance position.

Brady Glacier terminus region in September 29 2016 Sentinel image. Yellow dots indicate the 2022 margin. East and North Trick lakes are connected basins. Spur Lake still has an eastward extension.

Trick Lakes: In 1986 North and South Trick Lake were proglacial lakes in contact with the glacier. By 2016 the two lakes were no longer in contact with the glacier, water levels had fallen and a third lake East Trick Lake had formed. North Trick Lake  and South Trick Lake are currently relatively stable moraine-dammed lakes. The more recently developed East Trick Lake is the current proglacial Trick Lake, a large glacier river exits this lake and parallels the glacier to the main Brady Glacier terminus. In 2016 this river was narrow and flowed beneath the glacier in several spots.  By 2022 the channel has expanded to a width that seldom is less than 200 m, and is tranisitioning to an ice marginal lake. East Trick Lake has an area of 1.25 km²  in 2016, expanding to 1.4 km² in 2019, before declining to 1.0 km² in 2022 with the lake separating into two parts by a narrow peninsula exposed by falling water levels. The water level decline resulting from a  200 m marginal retreat from 2016 to 2022 has led to a narrow isthmus running across the lake from the glacier to be exposed. At Point E below the trimlines from reduced water levels are evident.

Spur Lake: It is likely that retreat toward the main valley of the Brady Glacier will lead to increased water depths at Spur Lake. a marginal retreat of 600 m led to a lowering lake water level from 2010-2016. The lake had an area of 0.6 km2 in 2010, 0.5 km² in 2016, o.5 km² and 0.5 km² in 2022. The lake area decline due to falling water level has been matched by lake area increase due to marginal retreat of Brady Glacier. This marginal retreat has also opened a marginal channel along the east edge of the glacier, draining Spur Lake. This drainage has led the lake shoreline to migrate west. Marginal retreat has been ~100 m from 2016-2022. The marginal river on the east side of the glacier was narrow and occasionally went beneath the glacier in 2016. In 2022 the channel has expanded so that the upper 2.5 km and lower 1.5 km is more of a marginal lake.

North Deception Lake has been expanding as the glacier has retreated 600 m, 100m/year from 2016-2022 while maintaining its water level. At present there is not a marginal channel developed that can reduce the water level. How long until a channel opens?

In Alaska the glacial lakes have expanded in area by 58% from 1984-2018 (Field et al 2021), however the ice dammed lakes declined by 0.4%. The latter indicates the competing impacts of water level reduction due to glacier recession of ice dammed lakes, and the expansion due to retreat as well.

Brady Glacier terminus region in September 28, 2022 Sentinel image. Point A marks the new isthmus exposed by falling lake water level. Point B and D are the expanded drainage channels. Point E is where trimlines are evident.

Tebenkof Glacier, Alaska Snowcover Loss Exposes Century of Annual Layers

Tebenkof Glacier in 2018 ESRI World Image with annual layers numbered. from near the divide to near the terminus. A couple of layers of layers buried near top of glacier by snowcover. This indicates 90-100 annual layers exposed at the surface as they emerge at the surface.

Tebenkof Glacier is a land terminating glacier on the Kenai Peninsula just west of Blackstone Bay. WGMS (2021) documented the retreat rate from 1910-2009 as ~20 m/year. Black and Kurtis (2022) examined 19 tidewater glaciers on the Kenia Peninsula identifying a 42 km² area loss from 1984-2021.  From 1986-2022 Landsat imagery indicates a retreat of 1100 m. During the summers of 2018-2020 the glacier lost all or nearly all snowpack, this allowed atellite imagery to reveal ~90-100 annual layers exposed from divide to near the terminus during years when the glacier was stripped of snowpack such as in 2018-2020.

Tebenkof Glacier retreat from 1986-2022 generating proglacial lake as it retreated 1100 m.

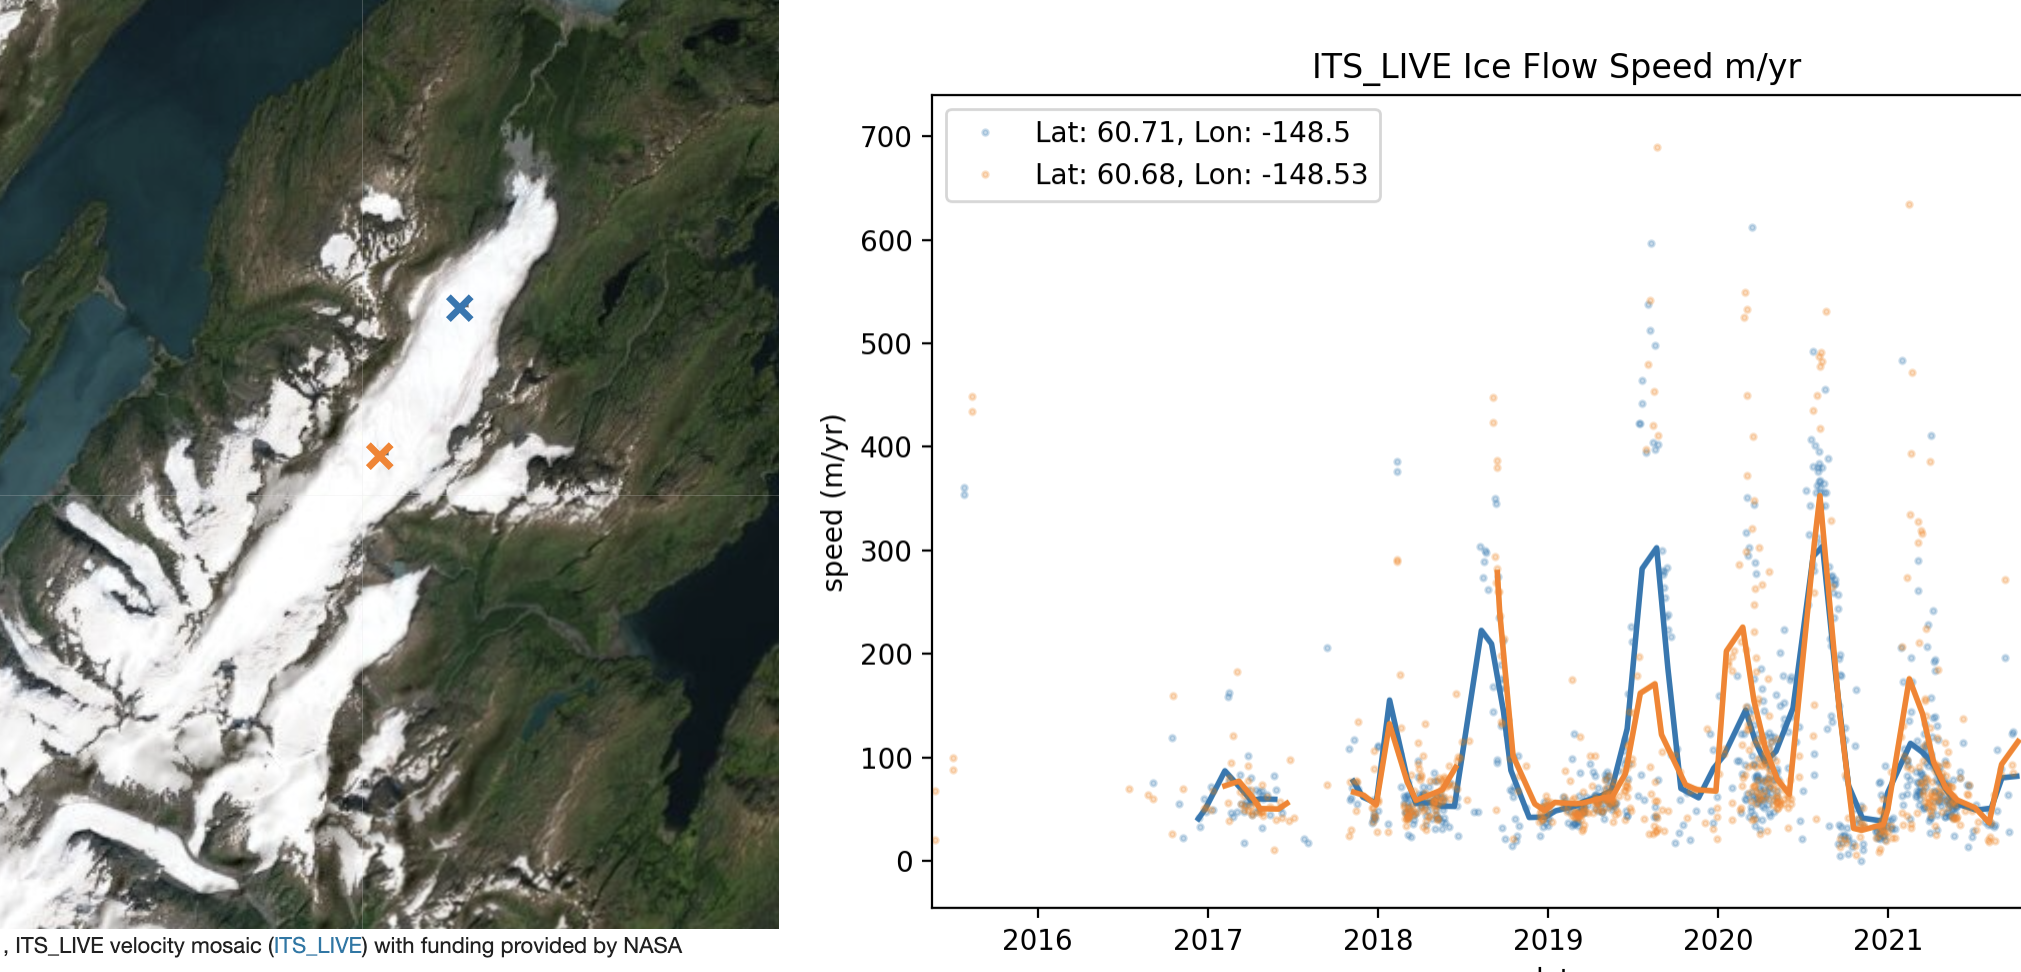
Tebenkof Glacier has an unsually low elevation and consistent gentle slope with the main glacier divide at 650 m and terminus at 200 m, with a length of 9 km. From 650 m where the first annual line layer is visible to 275 m where the last annual layer is visible is a distance of 6.5 km, with an average slope of 3.3 degrees. Above the equilbrium annual layers are submergent and below this line annual layers are emergent.The observed velocity at the blue and orange X show a remarkable consistency just as the slope with the 2017-2021 average fron the NASA ITS_LIVE of 60.72 at the orange point and 60.68 m/year at the blue x. This translates to travel time of 100 years from the divide to the end of the annual layer area. This is slightly more than the number of visible annual layers, however a few years have had no retained accumulation and hence no layer would form.

Tebenkof Glacier in Landsat images in 2018 and 2020 with less than 2% retained snowcover exposing annual layers.

Tebenkof Glacier velocity data at two locations, both averaging 60 m/year, velocity from NASA ITS_LIVE

Speel Glacier Retreats out of Alaska

Speel Glacier in 1984 and 2022 Landsat images illustrating lake expansion and detachment of tributaries A-C. Red arrow is 1984 terminus location and yellow arrow is 2022 terminus location.

In 1984 I observed Speel Glacier while flying into Juneau, AK to work with the Juneau Icefield Research Program. Speel Glacier is south of the Taku Inlet and the Juneau Icefield draining west from a shared accumulation area with Wright Glacier. Unlike the map on my lap, there was now a big lake at the terminus of the glacier. This post examines the retreat of this glacier across the international boundary, out of Alaska, and the expansion of the unnamed lake at its terminus using Landsat images.

Speel Glacier terminus on 8-18-2022 with the Alaska/British Columbia boundary in blue.

In 1948 Speel Glacier ended at the head of a braided outwash plain, generated by the Speel River. Upglacier in 1948 there was a small side valley lake impounded by the glacier, Speel Lake. The lower part of the glacier was heavily debris covered and stagnant in 1948.  I  In the 1984 Landsat image the glacier had retreated 3 kilometers from the 1948 position and was fed by four separate tributaries flowing into the glacier A-D.  n 1984 the original Speel Lake had drained and a new lake had formed filling the valley that the glacier had filled in 1948. The proglacial lake was 2.2 km long. By 2003 the glacier had retreated an additional 1.8 km from 1984 to where the lake bends east, and the main tributary from the north separated from the glacier prior to 1984. By 2013 tributaries A and B had been completely separated.  In 2022 the glacier has retreated  6.35 km since 1948, 3.3 km since 1984 and the connection with the three of the four tribuaries had been lost A-C.  The tributary detachments have led to continued retreat, have reduced input to the main glacier, which by the summer of 2022 resulted in the glacier retreating across the international boundary from Alaska into British Columbia. The new lake is now over 7 km long, and should be called Speel Lake again. The retreat of this glacier fits the pattern of other glaciers in the region Field, Gilkey, and Tulsequah Glacier  (Pelto (2017). The  detachments are frequent and significanly impact ice dynamics on the Juneau Icefield (Davies et al 2022). There we found 176 such detachments/disconnections in the outlet and valley glaciers of the Juneau Icefield Davies et al (2022).

Speel Glacier in 1948 USGS map.

.

Speel Glacier in 2003 and 2013 Landsat images illustrating lake expansion and detachment of tributaries A-C. Red arrow is 1984 terminus location and green arrows are detachment of tributaries.


Alsek Glacier, Alaska Releases its own Fireworks-Iceberg Discharge July 2022

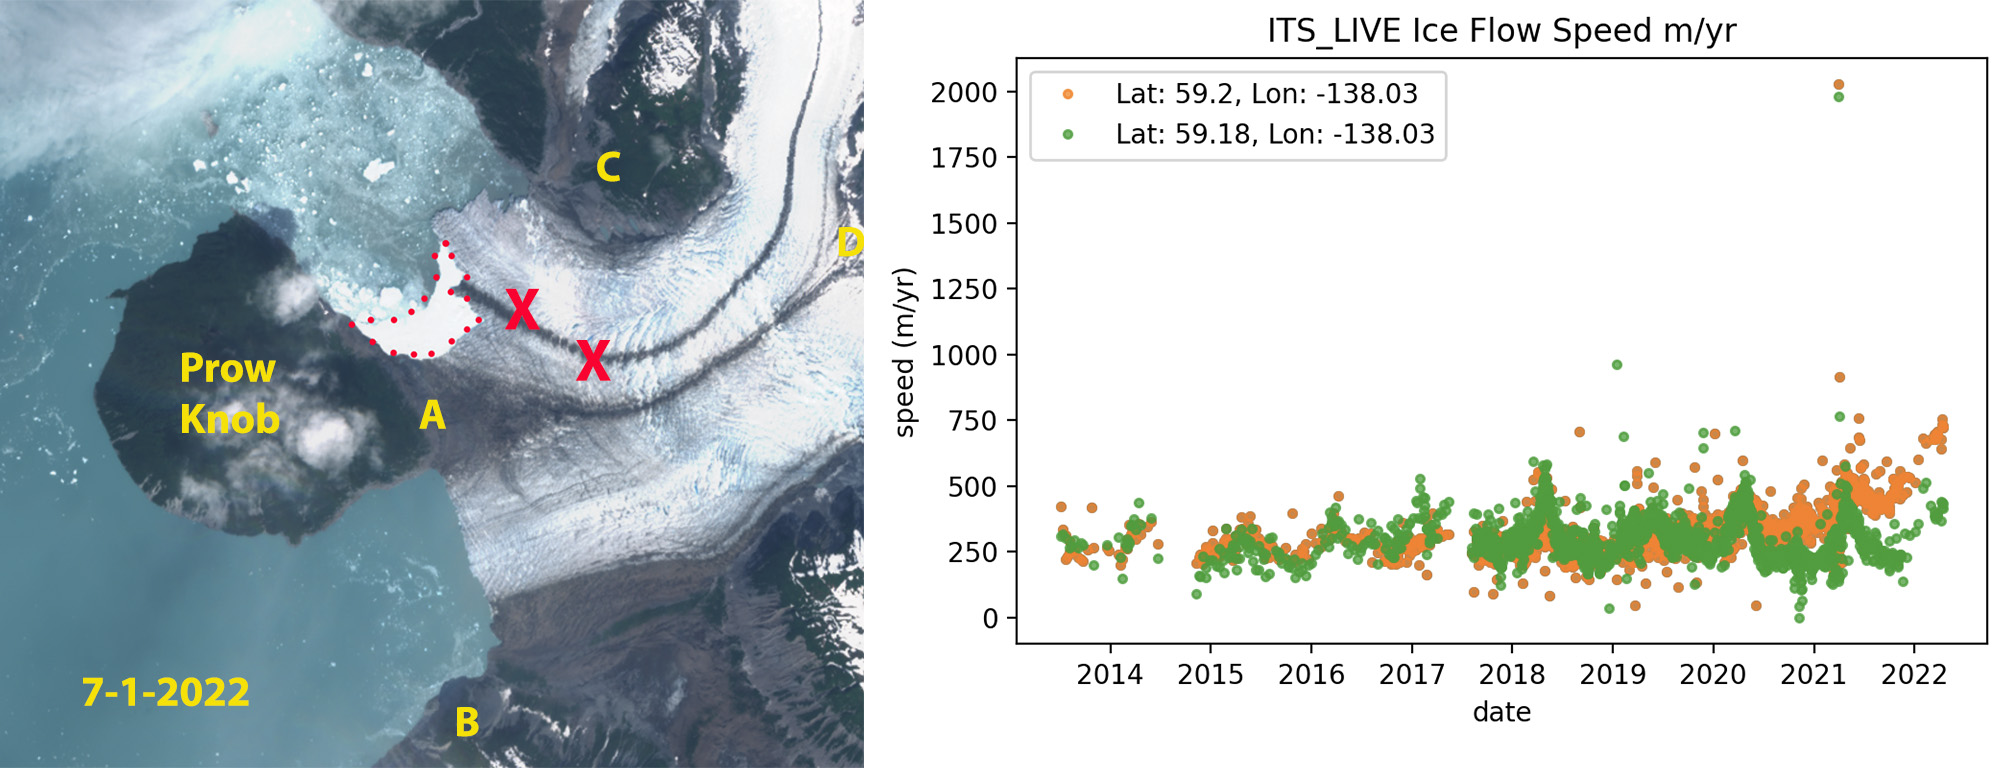
Alsek Glacier, Alaska in a Sentinel Image from July 1, 2022 indicating an area of rapid recent calving, red dots. The northern tongue has accelerated in the last six year (NASA ITS_Live).

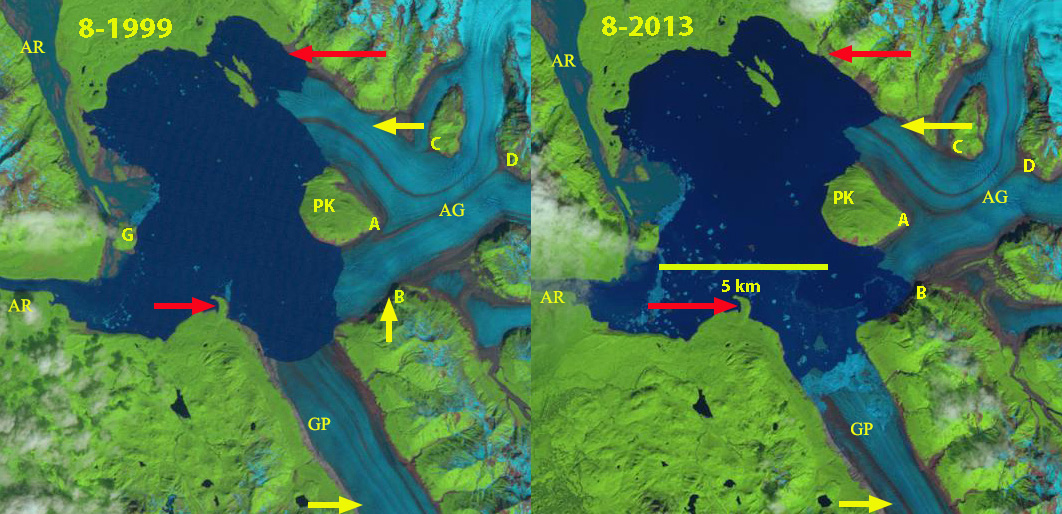
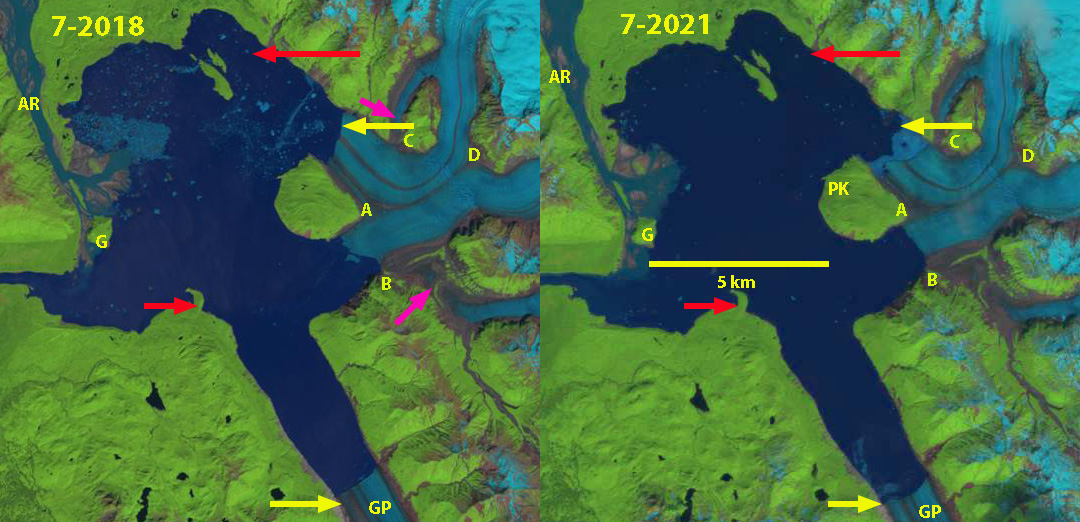
Alsek Glacier descends from the Fairweather Range terminating in Alsek Lake on the coastal plain. The glacier terminated at Gateway Knob (G) near the outlet of Alsek River from Alsek Lake in the early part of the 20th century (Molnia, 2005). At that time it had a joint terminus with Grand Plateau Glacier. The glacier retreated 5-6 km by 1984 along the central margin from Gateway Knob. In 1960 the glacier had a single terminus joining downstream of an unnamed island in Alsek Lake, that Austin Post told me reminded him of a boats prow. This “Prow Knob” (P) much like Gateway Knob a century ago stabilizes the terminus.  Retreat from this knob will lead to an increase retreat of Alsek Glacier.  Loso et al (2021) note that retreat of Grand Plateau Glacier will change the outlet of Alsek Lake from Dry Bay to the Grand Plateau Lake. Here we examine the change from 1984-2022 with Landsat and Sentinel imagery updating Pelto (2017)

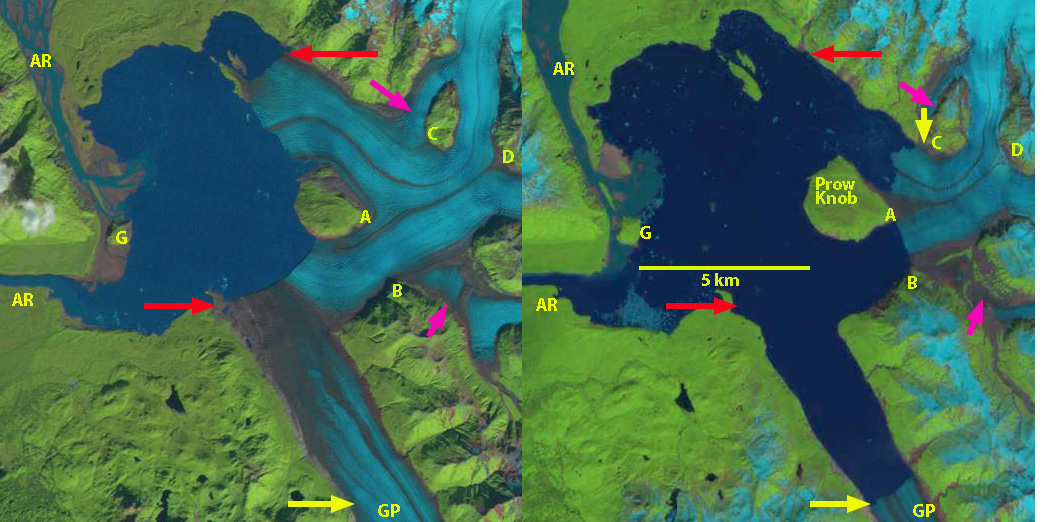
Alsek Glacier retreat from 1984-2022 in Landsat images. Red arrows mark the 1984 terminus location, yellow arrows the 2022 terminus location, pink arrows indicate tributary separation, AR=Alsek River, GP=Grand Plateau, G=Gateway Knob, A=glacier junction, B=tributary separation, C=tributary separation, D=tributary confluence.

In 1984 the terminus location is denoted with red arrows it has separated into two termini on either side of “Prow Knob”. The northern terminus tongue is located on a narrow island on the north side of Alsek Lake. The southern tongue merges with the northern arm of Grand Plateau Glacier in 1984. Two tributaries at the pink arrows merge with the main glacier. By 1999 the northern tongue has retreated from the narrow island, which exposes the terminus to enhanced calving. The southern terminus has separated from the Grand Plateau Glacier. By 2013 the northern terminus has retreated to the northern end of “Prow Knob” and the southern terminus is directly south of “Prow Knob” in a 1.8 km wide channel.  By 2018 two tributaries of Alsek Glacier are fully detached from the glacier, pink arrows. In 2018 the northern terminus tongue has retreated 3.7 km since 1984 into the 2.0 km wide channel on the northeast side of “Prow Knob”. The center of the southern terminus has retreated 2.5 km since 1984 and remains in the channel on the south side of “Prow Knob”. The length of the calving front has declined from an 8 km long calving front in 1984 to a 4 km calving front in 2018. By 2021 further retreat has led to a 2.8 km wide calving front, and a 1.6 km long contact with Prow Knob. From 1984-2022 the retreat and loss of area has been: 4.3 km and 8.6 km2 respectively for the northern terminus,  2.7 km and 5.1 km2 for the southern terminus and 7 km and 13.1 km2 for the northern arm of Grand Plateau Glacier.

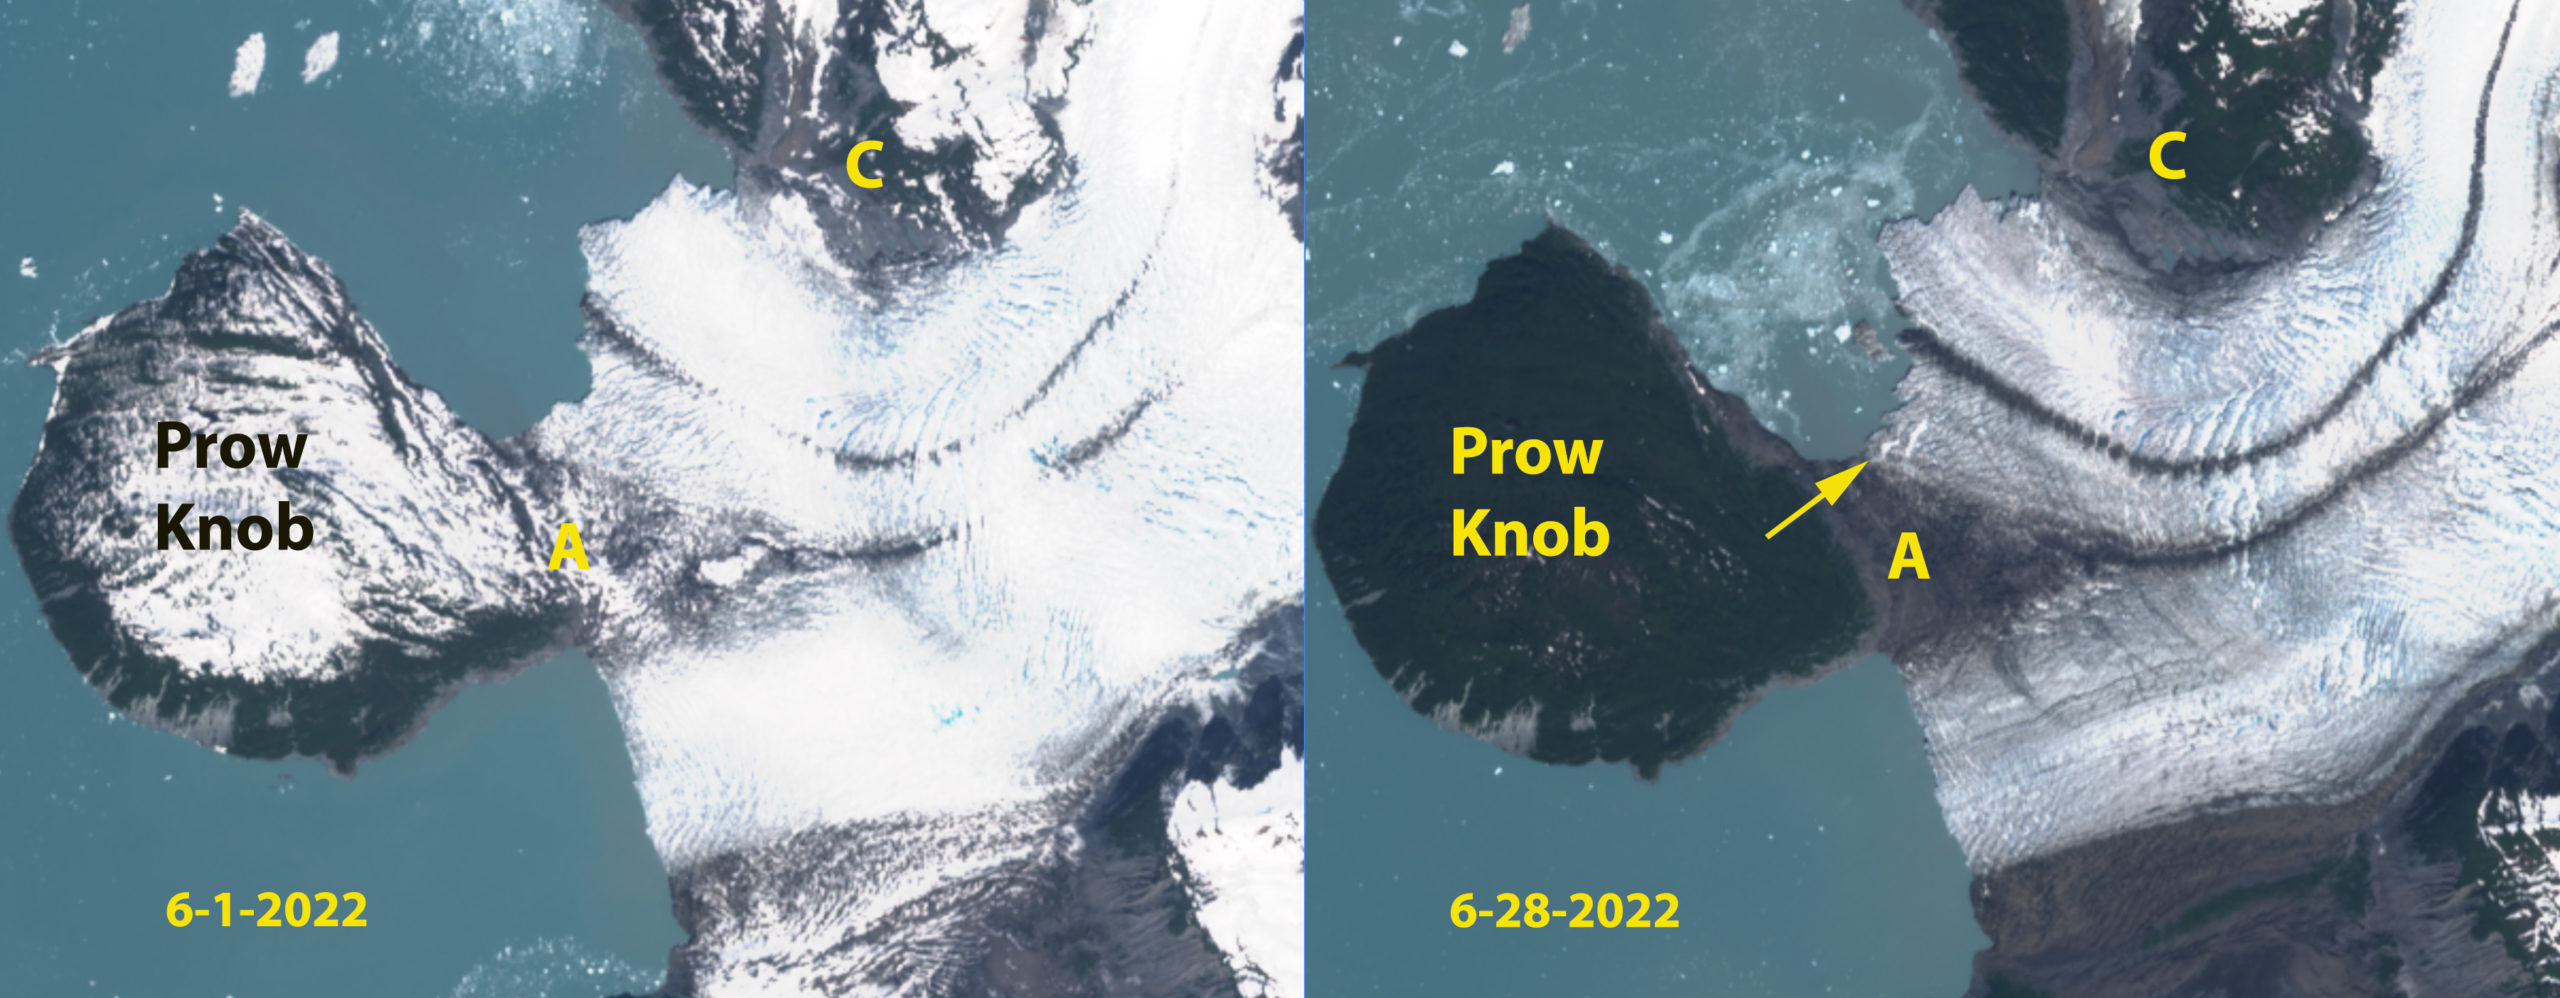
In 2022 the northern terminus arm has accelerated within 1 km of the calving front, note the two red X, marking velocity locations. This has generated additional calving and rifting, that is evident in the June 28 image. The NASA ITS_LIVE velocity measurement tool uses Landsat and Sentinel images to determine velocity using feature tracking. The rifting and acceleration is producing enhanced calving and retreat. The area of enhanced calving on July 1 is 0.3 km2. The acceleration and rifting is typically an indication of a greater degree of terminus flotation that can be due to thinning and/or reduced contact with Prow Knob. This will lead to additional calving events this summer as the glacier progressively detaches from Prow Knob.


Alsek Glacier retreat from 1999-2013 in Landsat images. Red arrows mark the 1984 terminus location, yellow arrows the 2022 terminus location, AR=Alsek River, GP=Grand Plateau, PK=Prow Knob, G=Gateway Knob, A=glacier junction, B=tributary separation, C=tributary separation, D=tributary confluence.

Alsek Glacier retreat from 2018-2021 in Landsat images. Red arrows mark the 1984 terminus location, yellow arrows the 2022 terminus location, pink arrows indicate tributary separation, AR=Alsek River, GP=Grand Plateau, PK=Prow Knob, G=Gateway Knob, A=glacier junction, B=tributary separation, C=tributary separation, D=tributary confluence.

Sentinel images from June 2022 illustrating the development of rifting at yellow arrow, that leads to the July 1 calving event. A=glacier junction, B=tributary separation, C=tributary separation


Grand Pacific Glacier Losing its Grand and Pacific Connection

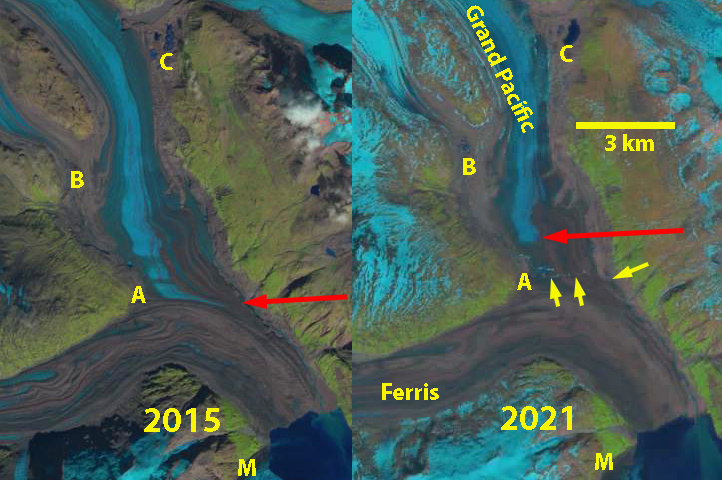
Grand Pacific Glacier in 1984 and 1999 Landsat images. Red arrow indicates the front of the clean ice flow of the Grand Pacific that also marks its lateral boundary with Ferris Glacier.  B and C indicate locations where tributary tongues have been retreating from the main glacier. M is the Margerie Glacier.

Grand Pacific Glacier in 2015 and 2021 Landsat images. Red arrow indicates the front of the clean ice flow of the Grand Pacific that also marks its lateral boundary with Ferris Glacier and the front of its active ice. Yellow arrow indicates outlet stream that is now beginning to separate the glaciers. B and C indicate locations where tributary tongues have been retreating from the main glacier. M is the Margerie Glacier.

The Grand Pacific joins with Ferris Glacier before ending at the head of Tarr Inlet in a ~1.9 km wide glacier front and 20-50 m high ice front. William Field observed the glacier advancing steadily from the 1930’s-1968 at 35 m/year , extending ~.0.5 km across the US/Canada boundary.  This advance continued behind its protective shoaling moraine/outwash plain until it was 1.5-1.6 km across the national boundary and just meeting the Margerie Glacier. A slow recession of 200 m has occurred since, with the current terminus having a width of 1.8 km, most in shallow water or terminating on a tidal flat. The Grand Pacific Glacier has been thinning for more than 50 years, which is leading to the recession, though not nearly as significant at for Melbern Glacier which it shares a divide with. Clague and Evans (1993) noted a 7 km retreat of Melbern Glacier from 1970-1987, and a 5.25 km retreat from 1986-2013 (Pelto, 2011-2017). The mass loss of the Grand Pacific Glacier system is part of the 75 Gt annual loss of Alaskan glaciers that make this region the largest alpine glacier contributor to sea level rise  from 1984-2013 (Larsen et al 2015).

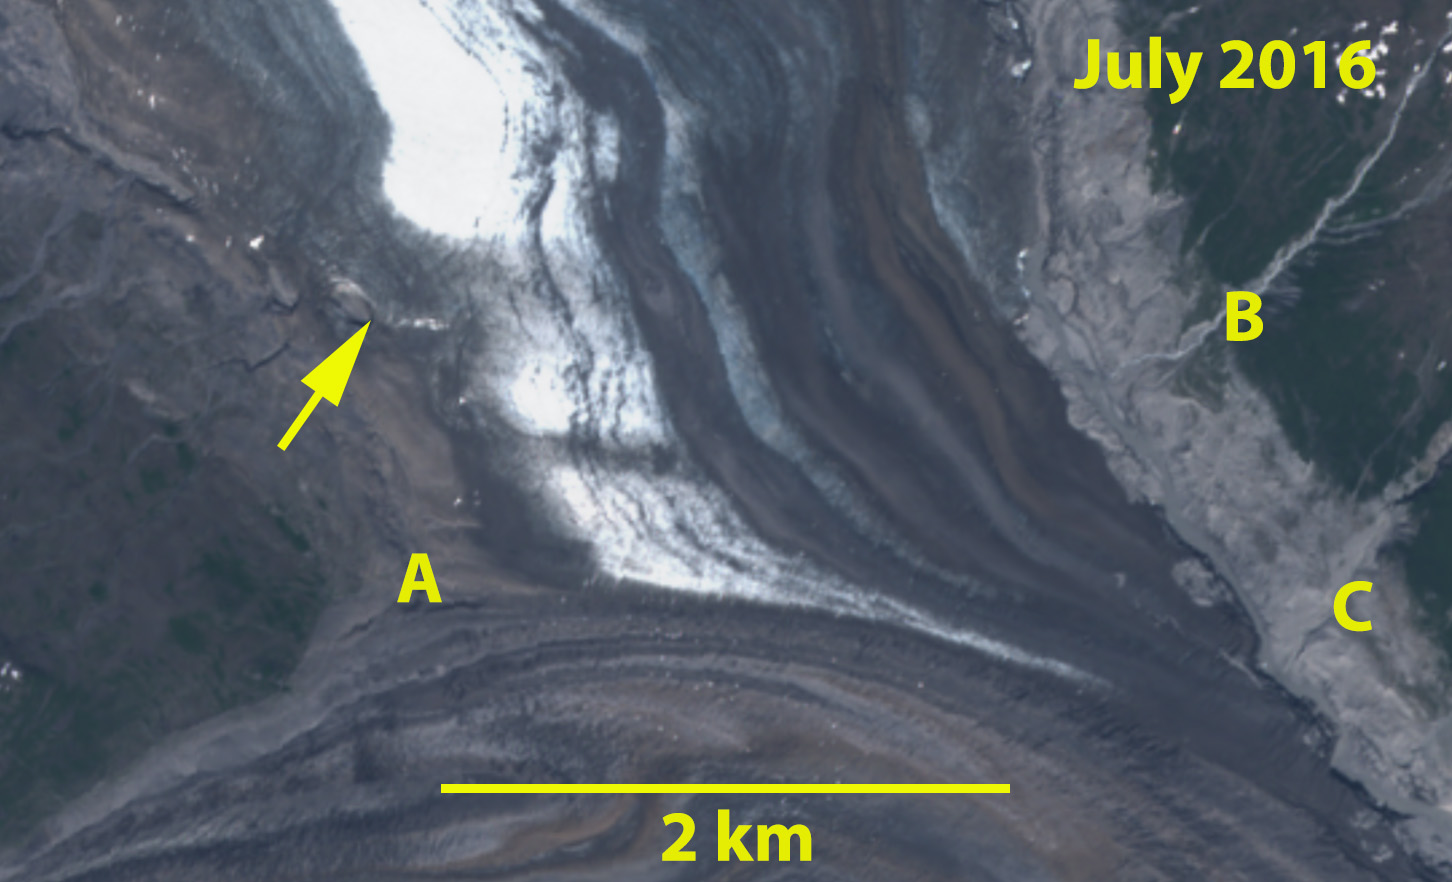
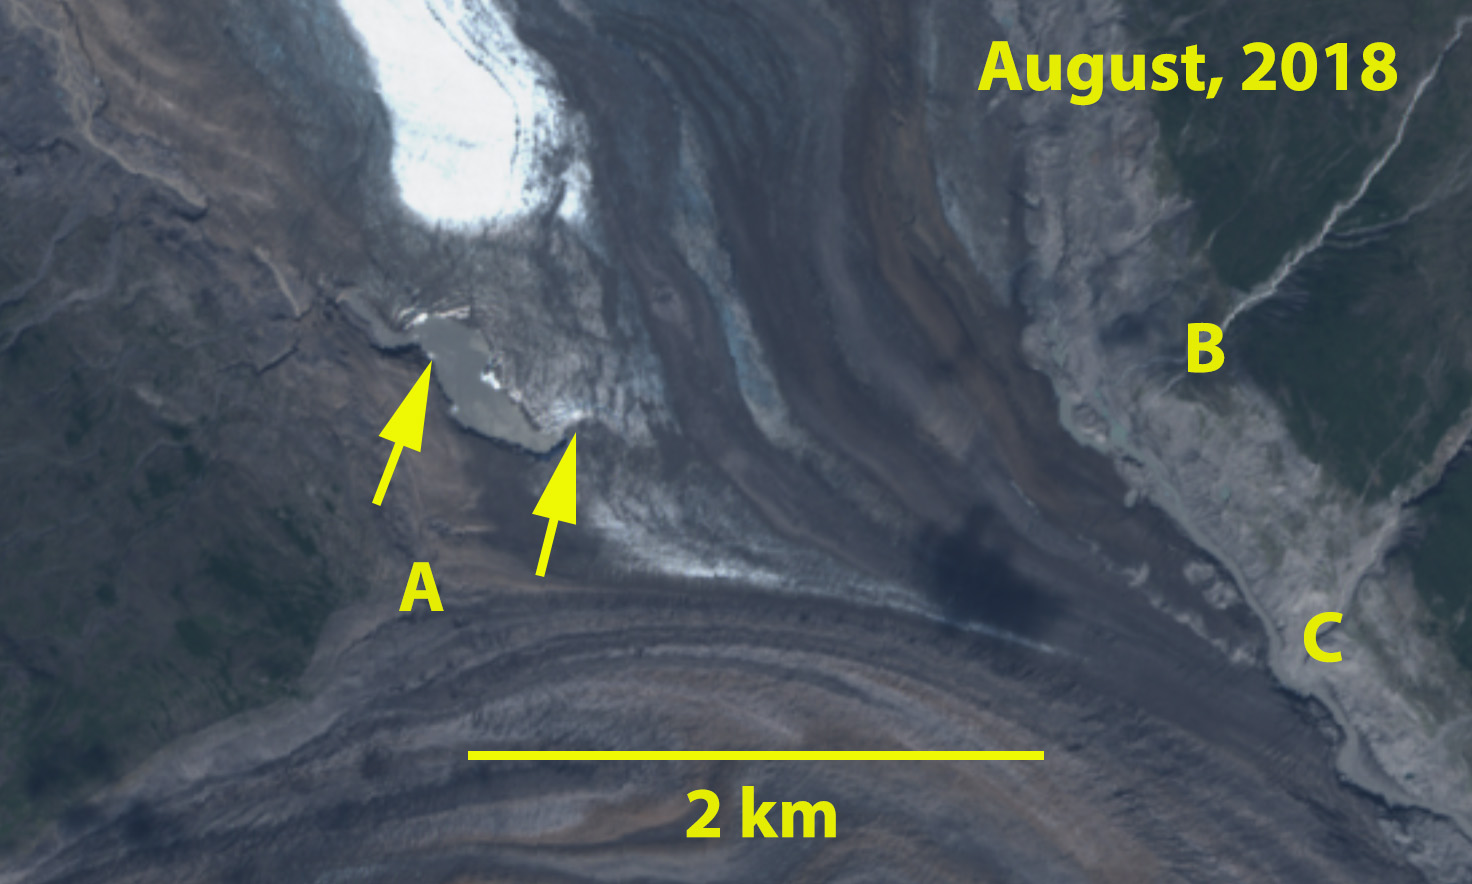
William Field reported that Grand Pacific Glacier comprised 80% of the joint glacier front with Ferris Glacier in 1941, declining to 40% in 1964.  In 1984 Landsat imagery illustrates that the Grand Pacific is still supplying ice to the glacier front but only comprises 25% of the ice front. In 1999 this has diminished to 20% of the ice front, that is now entirely on an outwash plain above the tidal level.  Tributary C has disconnected from Grand Pacific Glacier between 1984 and 1999, and tributary B has retreated substantially from the Grand Pacific. By 2015 the junction of the Ferris and Grand Pacific Glacier indicates all flow of the latter is diverted east along the Ferris margin and does not reach the ice front. There is a band of clean glacier ice that reaches the junction in 2015 and in the 2016 Sentinel image, but no longer reaches the eastern margin. In 2016 the glacier outlet stream along the west side of the Grand Pacific goes under the glacier to the east margin near the junction. By 2018 the surface exposed section of the stream extends ~700 m across the Grand Pacific Glacier before going beneath the glacier along the Ferris/Grand Pacific margin. In 2021 the glacier outlet stream cuts halfway across the glacier before going beneath and emerges prior to reaching the east margin, note yellow arrows below on the Sentinel image . The clean ice area no longer reaches the junction with the Ferris Glacier in 2021. The rapid expansion of the surficial outlet stream that is physically separating the two glacier will continue to cut across the entire width of the Grand Pacific Glacier. This glacier no longer has a connection to the Pacific Ocean, and no longer presents a grand front. The retreat is limited in distance compared to Grand Plateau or Fingers Glacier, but the separation is dramatic.

Sentinel 2 image of Grand Pacific Glacier in July 2016, yellow arrow indicates glacier outlet stream beginning to transect glacier. 

Sentinel 2 image of Grand Pacific Glacier in August 2018, yellow arrow indicates glacier outlet stream expanding across glacier. 

Sentinel 2 image of Grand Pacific Glacier in July 2016, yellow arrow indicates glacier outlet stream nearly transecting the entire width of the Grand Pacific Glacier front/margin with Ferris Glacier.


Lake Fork Knik River Headwater Glaciers, Alaska Retreat, Separation and Lake Expansion

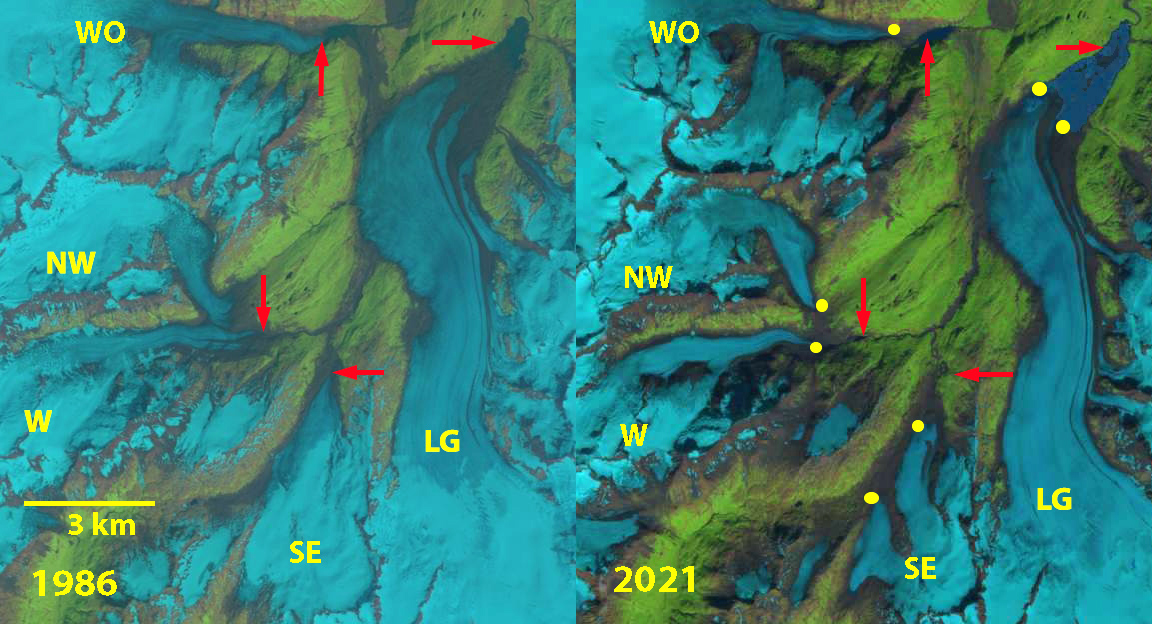
Glaciers in the Lake Fork Knik River watershed  in 1986 and 2021 Landsat images. LG=Lake George Glacier and WO=Whiteout Glacier with the remainder unnamed, labelled here as W=West, NW=Northwest and SE=Southeast. Red arrows mark 1986 terminus locations and yellow dots the 2021 terminus locations.

At the headwaters of the Lake Fork of the Knik River are a series of glaciers undergoing retreat and separation. The headwaters is dominated by the Lake George Glacier, which had terminated in the large proglacial Lake George that periodically drained past/beneath Knik Glacier (Stone, 1963), after 1966 the lake no longer filled (Post and Mayo, 1971). A new smaller proglacial lake began to form due to the retreat of Lake George Glacier by. Here we examine the changes in this headwater glacier group from 1986-2021 with Landsat imagery. The proglacial lake at the terminus of Lake George Glacier is moraine dammed and has expanded from 1986-2021, this is representative of the expansion of moraine dammed lakes in Alaska with an 87% areal increase from 1984-2019 noted by Rick et al (2022).

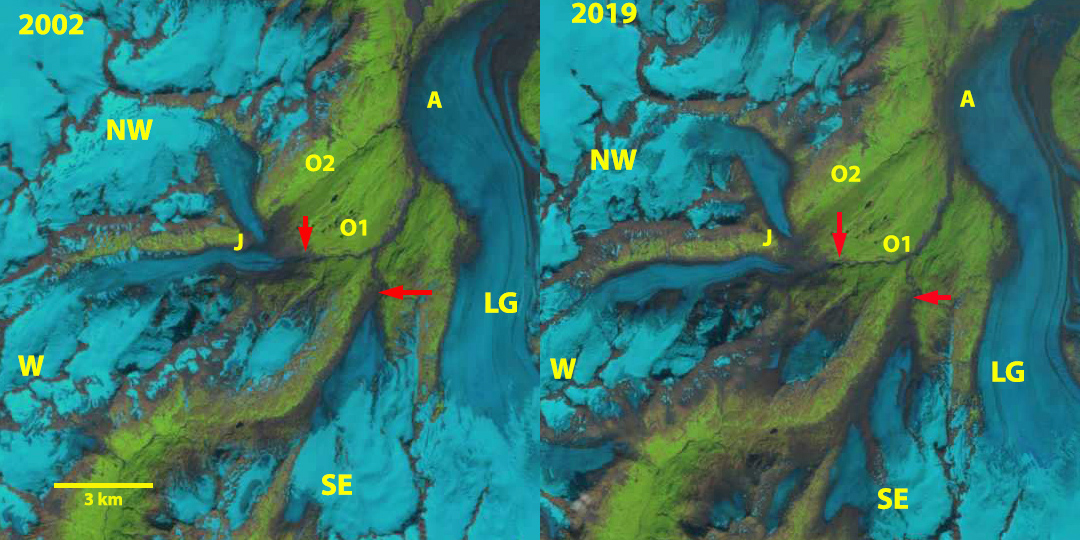
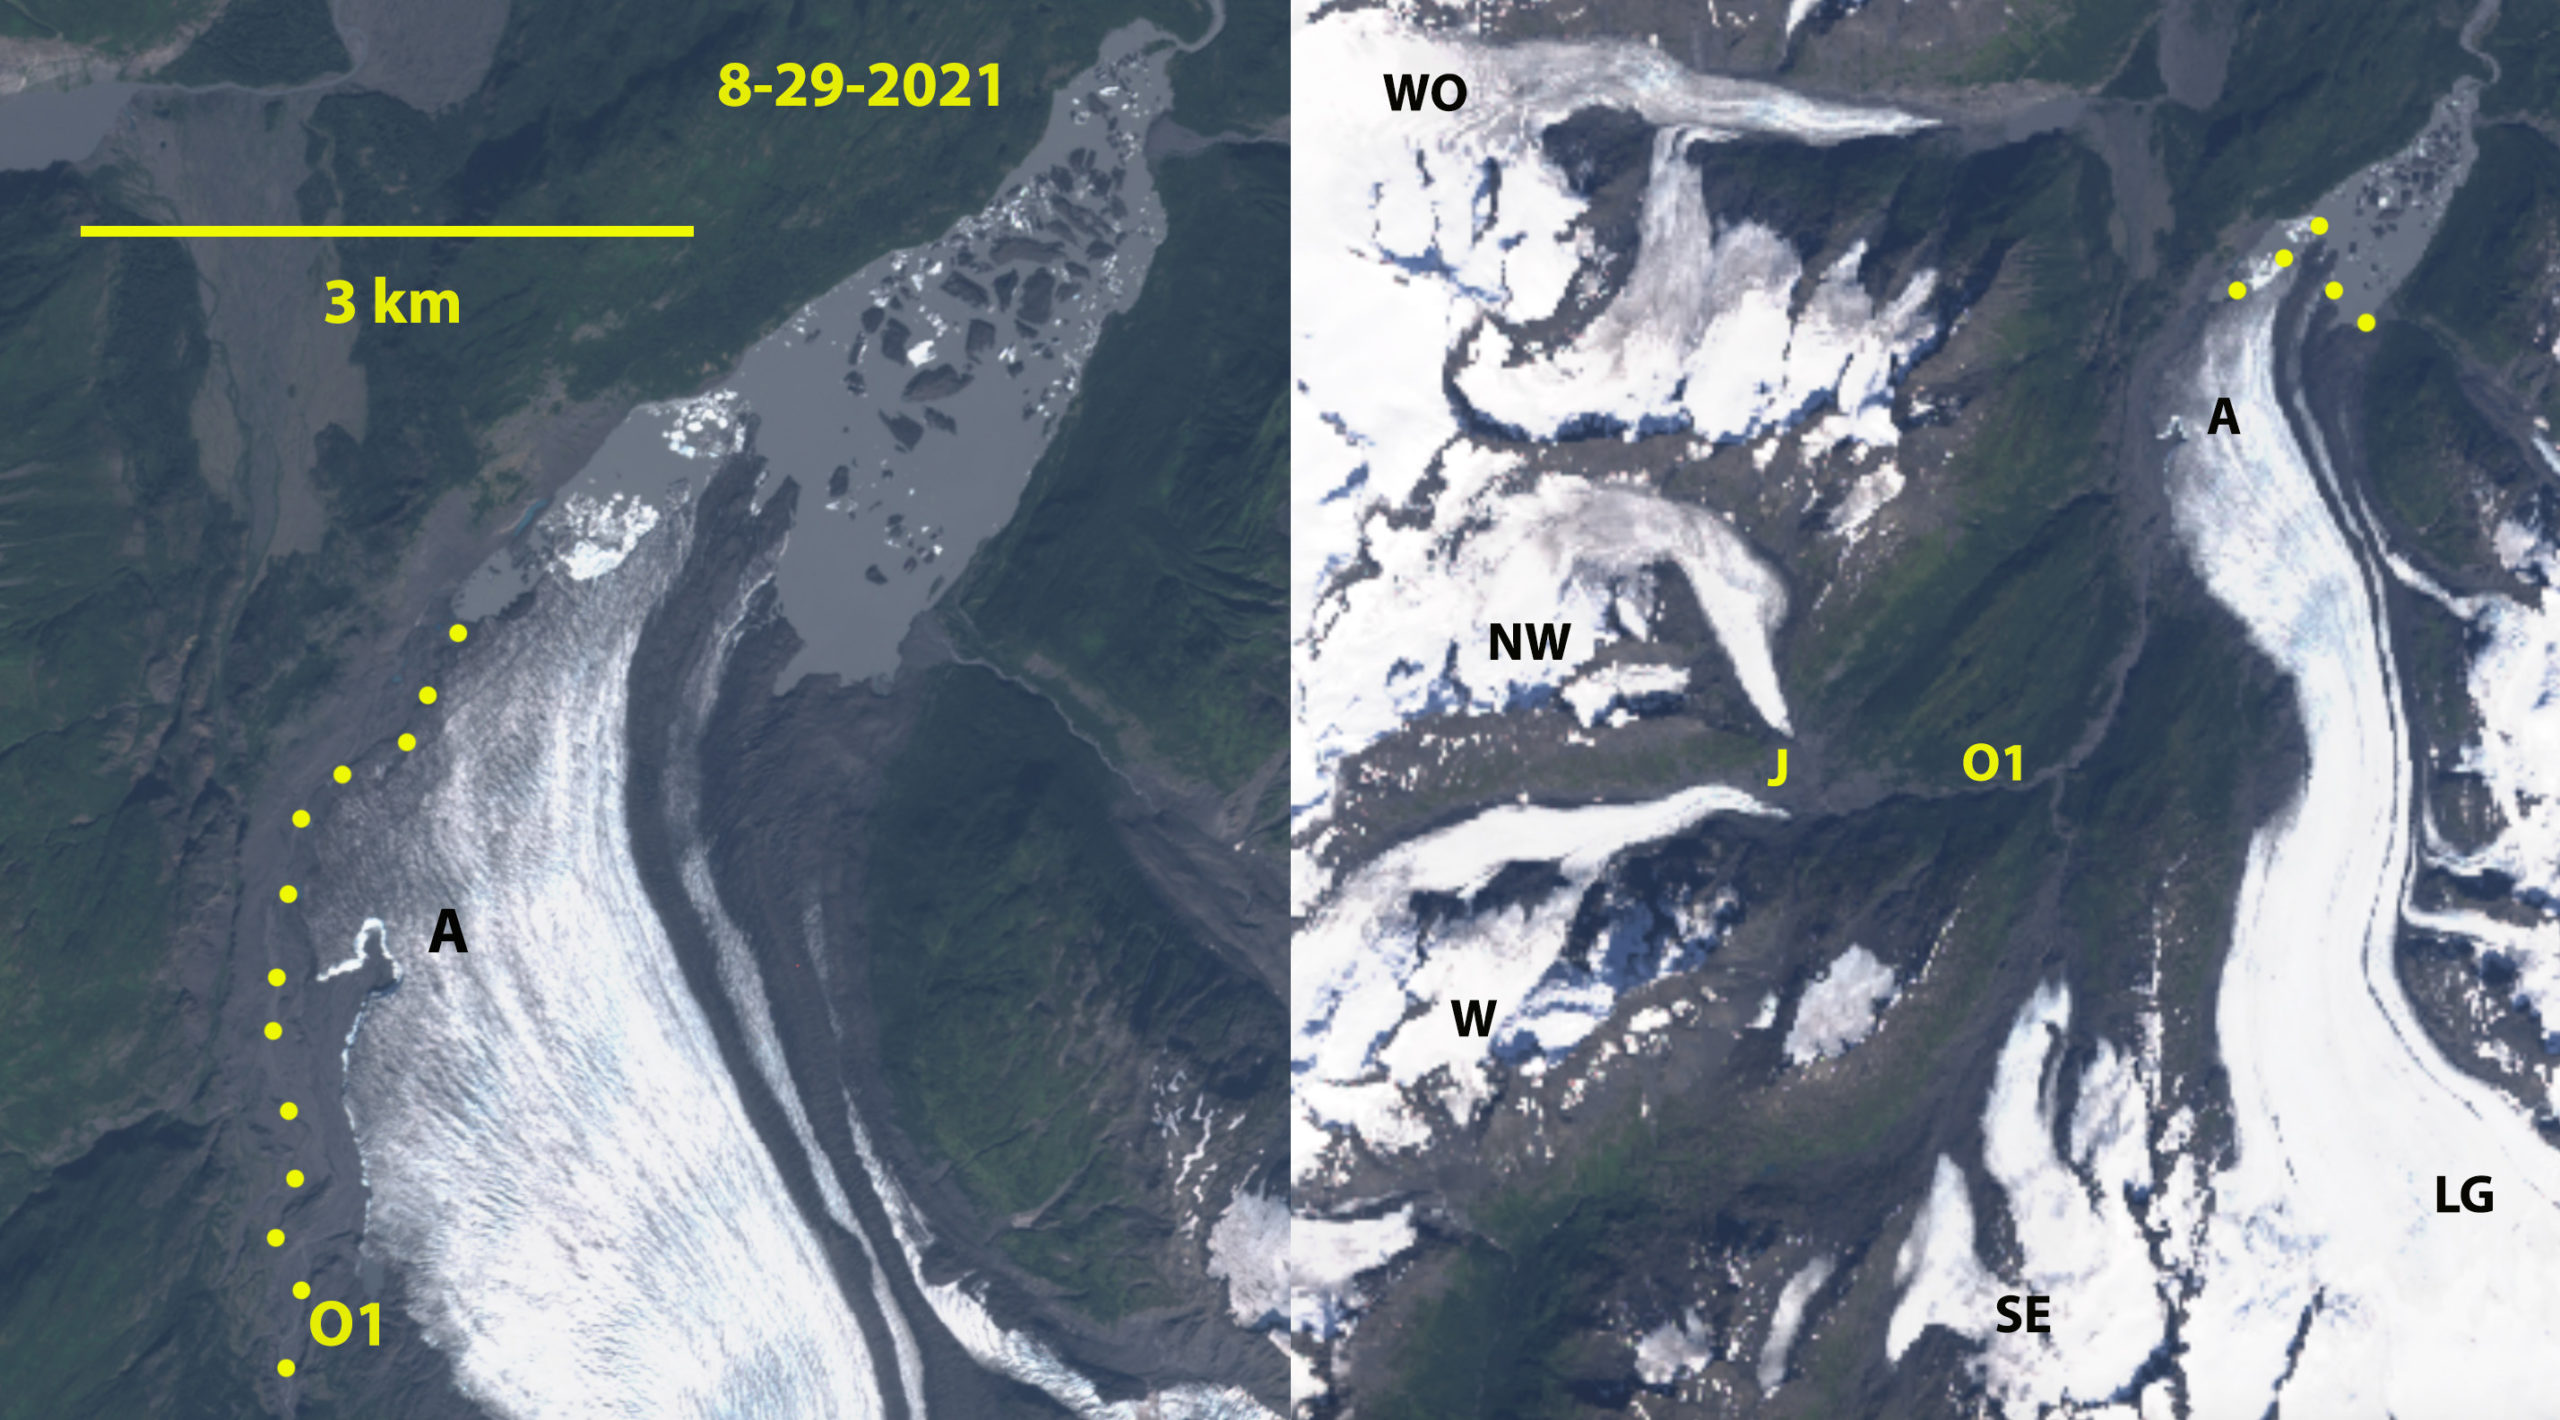
In 1986 Lake George Glacier terminated in a small proglacial lake with an area of 0.3k m2,. Whiteout Glacier terminated at 300 m, within 3 km of LG. West and Northwest Glacier had a joint terminus (Point J) at 600 m, with two outlet streams O1 and O2. Southeast Glacier had a single terminus at 500 m and had an area of 18.4 km2,.  In 2002 the main change was the separation of West and Northwest Glacier. The snowline on LG was at 900 m in August 2002. By 2019 Southeast Glacier has two separate termini, with the ridge just north of SE dividing the glacier, with the snowline at 1100 m in August. The proglacial lake at the end of Lake George had an area of 4.0 km2,. By 2021 the proglacial lake had expanded to an area of 4.3 km2,, a 4.0 km2, increase since 1986.  Terminus retreat has been  2100 m for Lake George Glacier 1100 m for Whiteout Glacier, 1250 m for West Glacier,  1000 m for Northwest Glacier and 1100 m for Southeast Glacier. Southeast Glacier now has an area of 12 km2, a 33% area loss since 1986, ~1% per year.  In 2021 the Outlet Stream from W, NW, and SE glacier parallels the margin of Lake George Glacier, but no longer goes under or is in contact.  A notch at Point A has developed, from a meltwater runoff channel. Icebergs occupy much of the lake in 2021 indicating there is still active development of the lake.  The lake development and separation of glaciers is similar to that observed at Field Glacier, Sheridan Glacier and Excelsior Glacier.

Glaciers in the Lake Fork Knik River watershed  in 2002 and 2019 Landsat images. LG=Lake George Glacier with the remainder unnamed, labelled here as W=West, NW=Northwest and SE=Southeast. O1 and O2 are the  outlet streams of the W and NW Glacier in 1986, with O2 abandoned by 2002. 

Glaciers in the Lake Fork Knik River watershed  in August 29, 2021 Landsat image. LG=Lake George Glacier  and WO=Whiteout Glacier, with the remainder unnamed, labelled here as W=West, NW=Northwest and SE=Southeast. O1 is the outlet streams of the W and NW Glacier, yellow dots at right indicate the course. Note the notch in Lake George glacier at Point A. 

East Twin Glacier Retreats from Twin Lake with Developing Icefield Disconnection

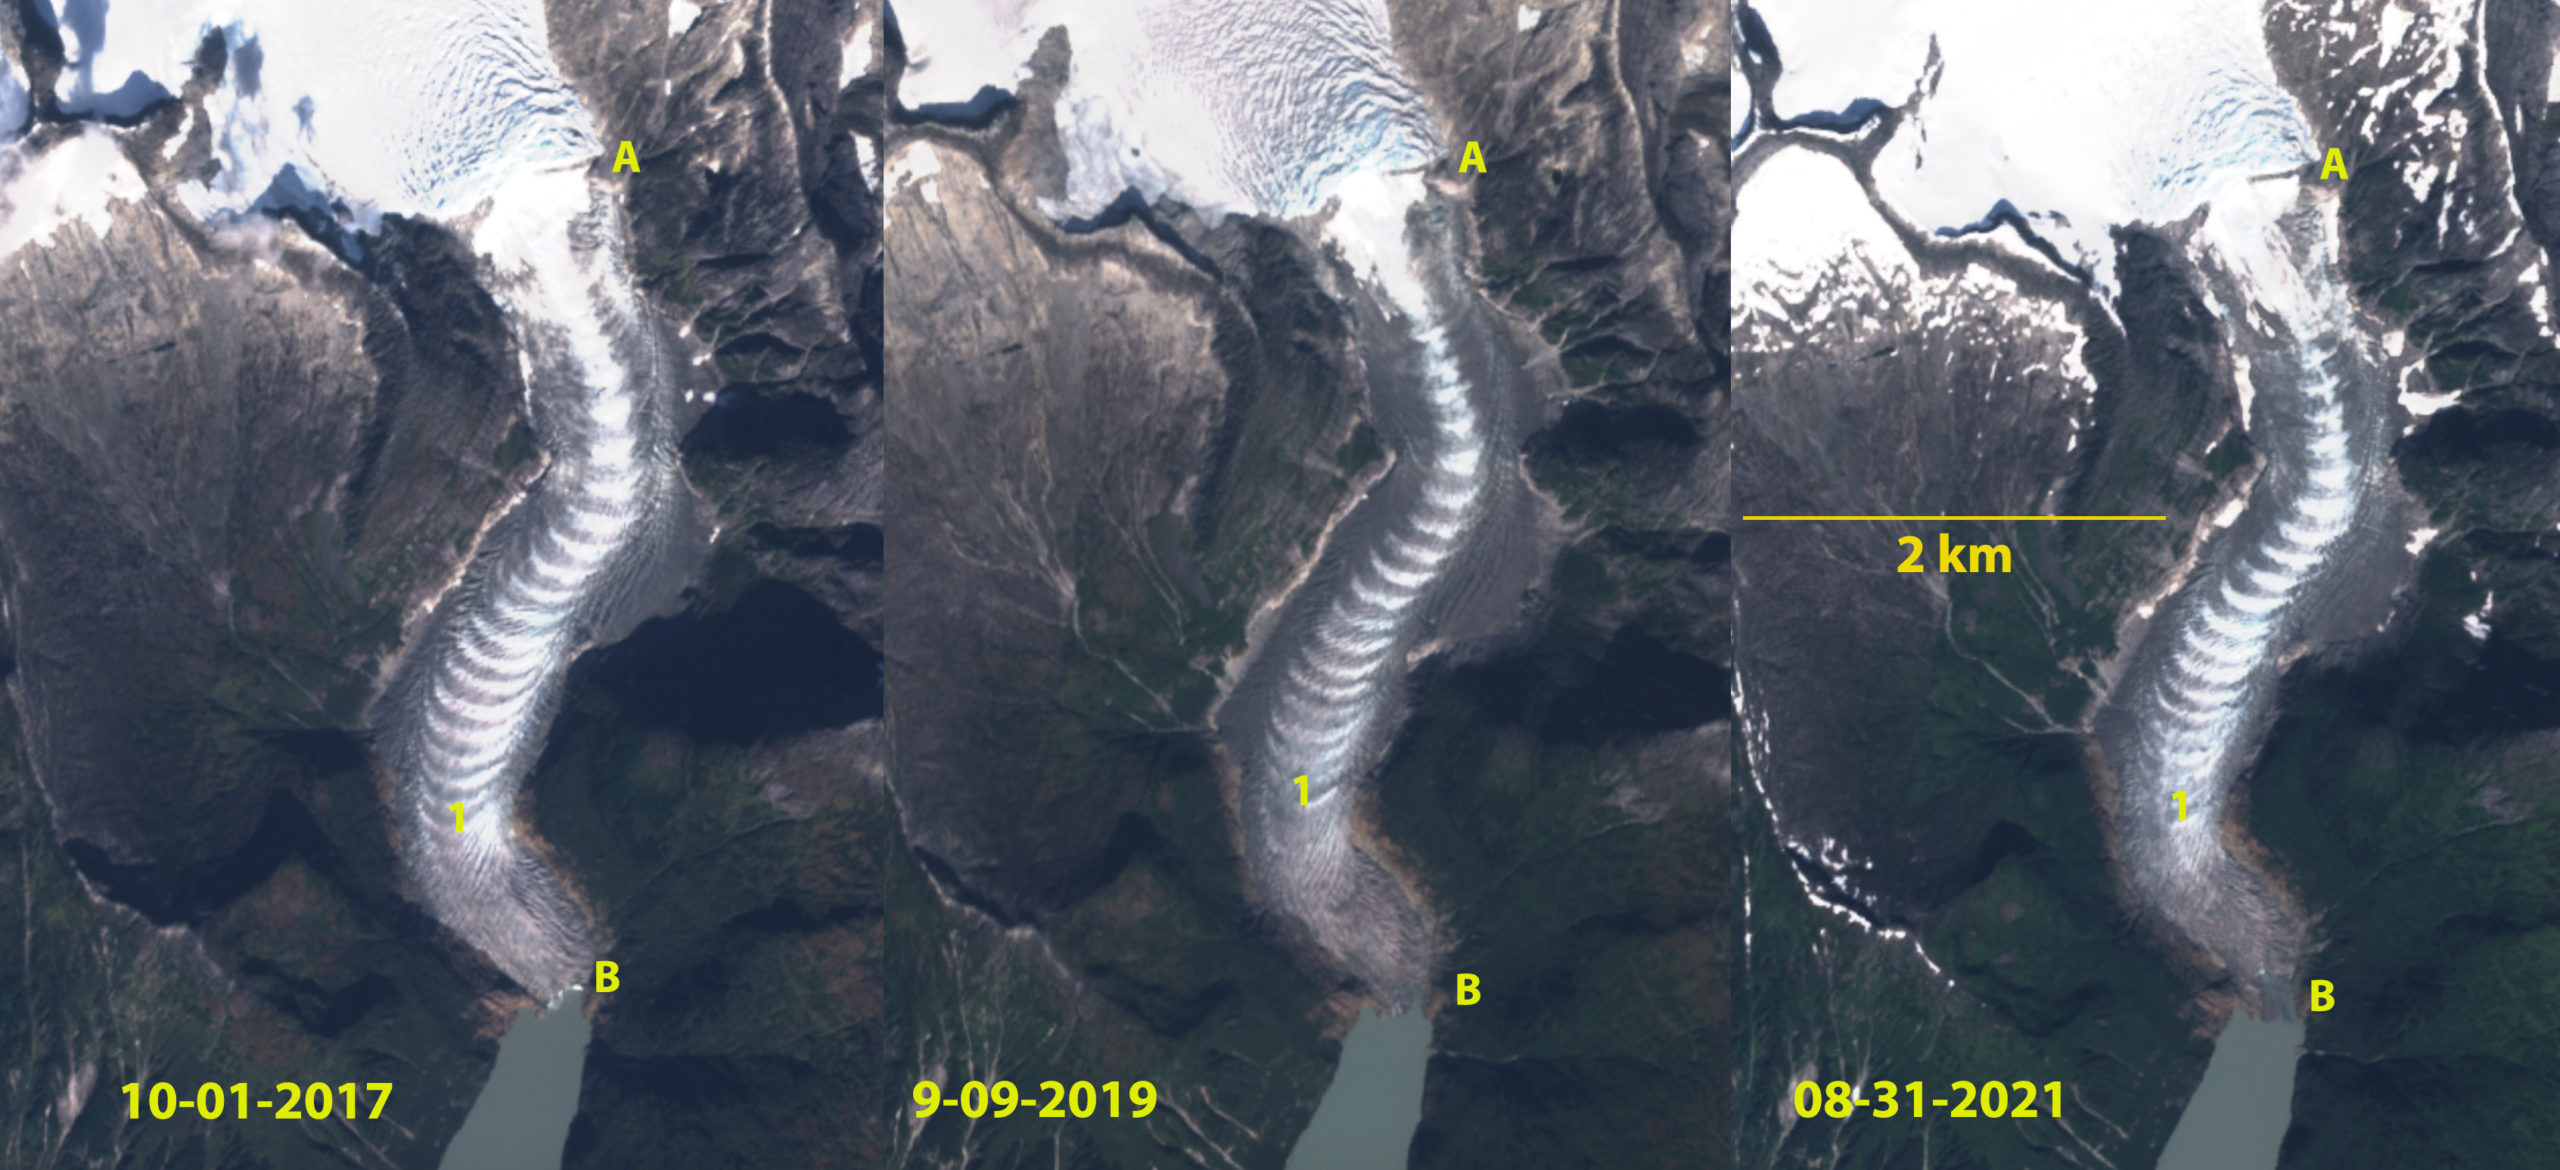
East Twin Glacier in Sentinel 2 images from 2017, 2019 and 2021. Point A marks the threshold, B the terminus contact with lake in 2017, Point 1 is the first ogive above the terminus.

East Twin Glacier is a narrow valley outlet glacier from the Juneau Icefield.  The glacier descends from the icefield through an icefall at 975 m- 600 m that generate ogives at the icefall base. The extensive crevassing begins at 975 m with a threshold at 900 m.  Davies et al (2022) examination of the Juneau Icefield found 63 glaciers had disappeared since a 2005 inventory, with a 10% reduction of glacier area. This study noted the importance of glacier disconnections occurring which separates the accumulation and ablation zones,  leading to stagnation of the glacier segment below.  We found 176 such disconnections in the outlet and valley glaciers of the Juneau Icefield Davies et al (2022). The focus of this post is on the development of a disconnection on the main stem of the East Twin Glacier.

In 1984 I had a chance to complete mass balance observations on the glacier.  The terminus in the lake was 600 m wide,  and the threshold at 900 m was also 600 m wide in 1984. The glacier retreated 900 m from 1984 to 2015 (Pelto, 2017). The terminus has calved into Twin Lake for over a century, but by 2015 the width of the terminus calving into the lake has declined by 75% since 1984, to 150 m. In 2017 there is still a very narrow steepened calving front. By 2019 the terminus no longer has a calving front, but was in contact with the lake.  By 2021 the glacier terminates 200 m from the lake on the west side and 100 m from the lake on the east side. The total retreat from 1984-2021 is 650 m.  In 2018 the snowline reached ~1250 m, 300 m higher than the long term average.  In 2019 the snowline again reached this level. The result is an accelerated reduction in accumulation flowing towards the top of the icefall, along with glacier thinning at the threshold, which enables the disconnection to rapidly develop. The high snowline elevations and exceptional melt in 2018 and 2019 helped to further narrow the glacier at the threshold to 240 m in 2021. The bedrock threshold is quickly cutting across the glacier, this is limiting flow through the icefall and may have shut off the production of new ogives.

The declining mass balance of the Juneau Icefield indicated by the high snowlines is driving thinning, disconnections and  retreat (Pelto 2019).

East Twin Glacier in 2018 and 2019 the highest snowlines since observations began on the Juneau Icefield in 2018. Snowline is the purple dots at 1250-1275 m, well above the threshold at Point A which had just below the mean 950 m snow line position from 1946-2000. 

East Twin Glacier terminus change from 1984-2021 in Landsat images. Red arrow is the 1984 terminus, yellow arrow the 2021 terminus.

Field Glacier, Alaska Retreat, Separation and Rapid Lake Development 1984-2021

Field Glacier on Aug. 31, 2021 in a Sentinel image. Note former glacier junctions A and B where the glacier has separated this century. The 7.5 km2 lake did not exist when I first visited this glacier.

The Field Glacier flows from the northwest side of the Juneau Icefield, and is named for Alaskan glaciologist and American Geographical Society leader William O. Field. Bill along with his work around Glacier Bay helped initiate the Juneau Icefield Research Program, which Maynard Miller then ably managed for more than 50 years. The JIRP program is still thriving today led by Seth Campbell. In 1981, as a part of JIRP, I had my first experience on Field Glacier completing a snowpit in its upper accumulation area. In the summer of 1983 I met with Bill to discuss where to setup a long term glacier mass balance program. I ended up selecting the North Cascade Range. In 1984 we skied back to the same snowpit site on Field Glacier, finding 3.8-4.1 m of retained snowpack in crevasses. At the end of our 11th field season in the North Cascade Range I spent a couple of nights at Austin Post’s (USGS) house and he reviewed his choice for a glacier to name after Bill, who had passed earlier that month. This was truly a remote area, which was why it had remained unnamed.

In 1984 the glacier began from the high ice region above 1800 meters, with two main branches joining at Point A and one significant tributary joining from the northern branch at Point B. There are icefalls near the snowline at 1350 meters on both the southern branch and the tributary entering at Point B. In 1984 the glacier descended the valley ending at 100 meters on the margin of an outwash plain. The meltwater feeds the Lace River which flows into Berners Bay. This post focusses on the changes from 1984-2021 using primarily Landsat imagery.

Field Glacier in Landsat images from 1984 and 2021 illustrating lake development, glacier separation at Point A and B and progressive detachment/separation at Point C,D and E. Purple dots indicate the snowline elevation at 1350-1400 m.

The USGS map from 1948 imagery and the 1984 imagery indicate little change in the terminus position. There is a narrow fringing proglacial lake along the southern edge of  the terminus in 1984 with most of the margin resting on the outwash plain. In 1997 the proglacial lake was still a narrow fringing lake, though clearly poised to expand as it extended nearly the full perimeter of the terminus. By 2006 the proglacial lake at the terminus averaged 1.6 km in length, with the east side being longer. There were several small incipient lakes forming at the margin of the glacier above the main lake. In 2009 the lake had expanded to 2.0 km long and was beginning to incorporate the incipient lake on the west side of the main glacier tongue. There was also a lake on the north side of this tributary. This lake was noted as being poised to soon fill the valley of the south tributary and fully merge with the main lake at the terminus (Pelto, 2017).   In 2013 Landsat imagery indicates the fragile nature of the terminus tongue that was about to further disintegrate, retreat from 1984-2013 was 2300 m and the lake had an area of 4.0 km2 (Pelto, 2017). This disintegration led to the separation of the two branches by 2017.

In 2021 the Field Glacier has two main branches are separated by 4 km, Point A. The tributary at Point B is also separated, no longer joining the main glacier. There is another separation imminent at the junction-Point E, 5 km of this former tributary.  At Point C and D progressive detachment of smaller tributaries are evident. From 1984 to 2021, Field Glacier has experienced a retreat of 5500 m of the southern branch and 4100 m of the northern branch. The lake has expanded to 7.5 km2.  Fringing lake on the northern branch indicates the lake will expand at least another 1 km. For the southern branch the glacier is close to what will be the lake margin. The record snowline elevation on the icefield in 2018 and 2019 (Pelto, 2019), has led to a continuation of the rapid mass balance loss, retreat, and lake development at Field Glacier. This glacier is experiencing retreat and lake expansion like several other glaciers on the Juneau Icefield, Gilkey Glacier, Llewellyn Glacier, and Tulsequah Glacier (Pelto, 2017).

Field Glacier in Landsat images from 1997 and 2017 illustrating lake development, glacier separation at Point A and B and progressive detachment/separation at Point C,D and E.


Field Glacier terminus in Landsat images from 1984 and 2013, dots indicate terminus, with pink arrows in 2013 indicating where marginal lakes have developed.

Field Glacier terminus in Landsat images from 2006 and 2009, red line is terminus with orange arrows indicating fringing lake development.

Tulsequah Glacier, BC 2021 Glacier Lake Outburst Flood


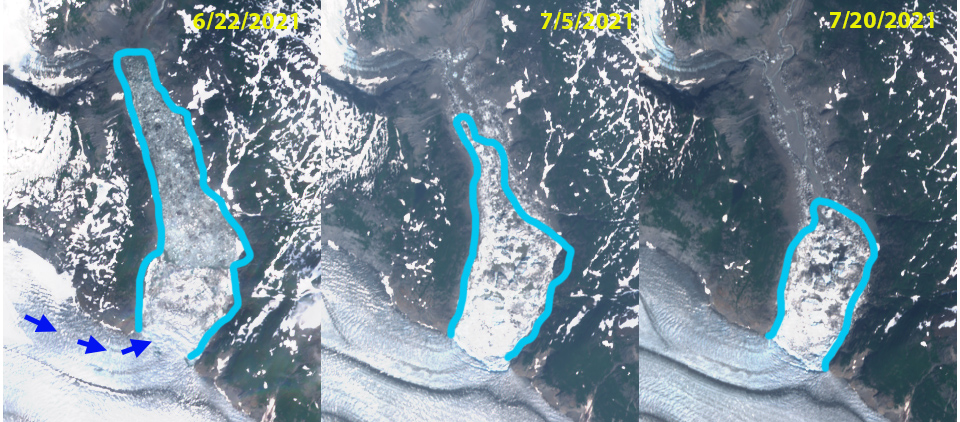
Landsat images of Tulsequah Glacier on June 22 and July 5, 2021.  Lake No Lake is between the yellow arrows with the margin of glacier extending upvally on June 22nd. By July it has receded back to main valley and lake has largely drained. The former location of Tulsequah glacier dammed lake is at red arrow.

Tulsequah Glacier, British Columbia drains east from the Juneau Icefield and is best known for its Jökulhlaups or glacier lake outburst floods (GLOF) from Tulsequah  Lake and Lake No Lake dammed by Tulsequah Glacier in northwestern British Columbia, Canada (Neal, 2007). The floods pose a hazard to the Tulsequah Chief mining further downstream. This glacier feeds the Taku River which has seen a significant decline in salmon in the last decade (Juneau Empire, 2017).The continued retreat of the main glacier at a faster rate than its subsidiary glaciers raises the potential for an additional glacier dammed lakes to form. The main terminus has disintegrated in a proglacial lake.  Pelto (2017) noted that by 2017 the terminus has retreated 2900 m since 1984, with a new 3 km long proglacial occupying the former glacier terminus. The USGS has a stream gage measuring a range of parameters including turbidity and discharge which can identify a GLOF. Neal (2007) examined the 1988-2004 period identifying 41 outburst floods from 1987-2004. Here we examine Landsat images and USGS records of Taku River to quantify the 2021 GLOF event between June 25 and July 3.

USGS records of turbidity and discharge on Taku River that indicate the onset on glacial lake drainage and of the GLOF event on July 3, note purple arrows.

On June 22, 2021 the region between the yellow arrows is an iceberg choked lake. The red arrow indicates the location where Tulsequah Lake used to expand, it is limited. The terminus of the glacier reaching upvalley 600 m from the main glacier.  Discharge is at 60,000 cfs and the turbidity is at ~100 FNU. Starting on the June 25th through the 27th turbidity rises to 400 FNU, while discharge rises to 90,000 cfs.  This is during a protracted dry period and is the result of the beginning of increased glacier discharge from the lake. On July 27th-June 30th it is evident that the margin of the distributary glacier tongue has receded ~500 m back to the main glacier margin, representing a terminus collapse generating icebergs likely resulting from a fall in water level. There is no change in the small Tulsequah Lake at the red arrow. On July 3rd turbidity rises above 500 FNU and discharge exceeds 130,000 cfs, this is at the high end of the typical peak GLOF events from Lake No Lake as noted by Neal (2007)  from 90,000-130,000 cfs. This is the main event and was reported by the USGS. By July 5 Landsat imagery indicates the water level has dropped between the yellow arrows, resulting in more prominent icebergs. The Sentinel image illustrates the zone of iceberg stranding as well.  The icebergs continue to melt away by July 20. No change at the red arrow. If we look back to Sept. 2020 we see what Lake No Lake will appear like by the end of summer and that the distributary terminus margin does not extend upvalley at that time. The large proglacial lake that has formed after 1984 due to retreat helps spread out the discharge from ice dammed lake GLOF’s of Tulsequah Glacier.  This lake will continue to expand and the damming ability of the glacier will continue to decline, which will eventually lead to less of a GLOF threat from Lake No Lake.

Sentinel images from June 22, July 5 and July 20 of the area of the lake and then the area of stranded icebergs.  Note how almost the entire width of a the northern tributary flows into this valley.


Landsat images of Tulsequah Glacier on June 27 and June 30.  Lake No Lake is between the yellow arrows. The former location of Tulsequah glacier dammed lake is at red arrow.

Tulsequah Glacier in 1984 and 2017 Landsat images.  The 1984 terminus location is noted with red arrows for the main and northern distributary tongue, southern distributary red arrow indicates lake margin.  The yellow arrows indicate the 2017 glacier terminus locations. The retreat of 2900 m since 1984 led to a lake of the same size forming. Purple dots indicate the snowline.


Landsat images of Tulsequah Glacier on Sept. 15, 2020.  Lake No Lake now drained fills between the yellow arrows. The former location of Tulsequah glacier dammed lake is at red arrow.

Sheridan Glacier, Alaska Retreat Causes Rapid Lake Expansion

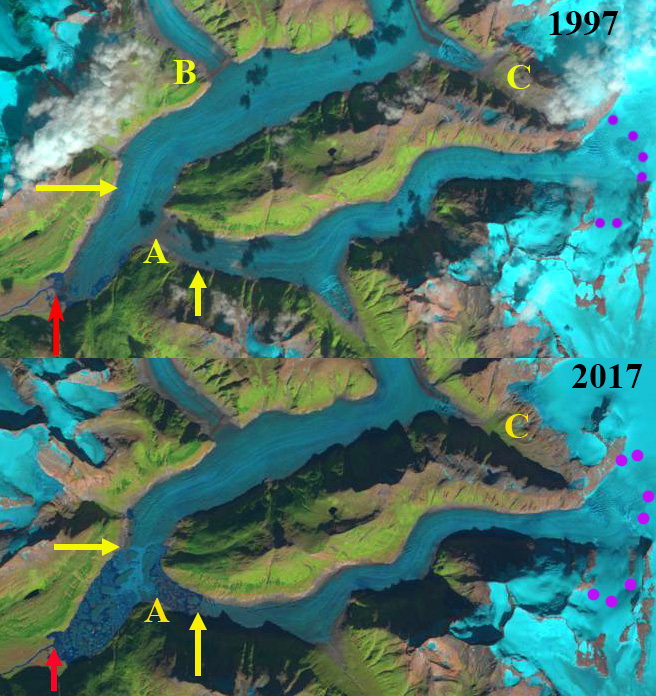
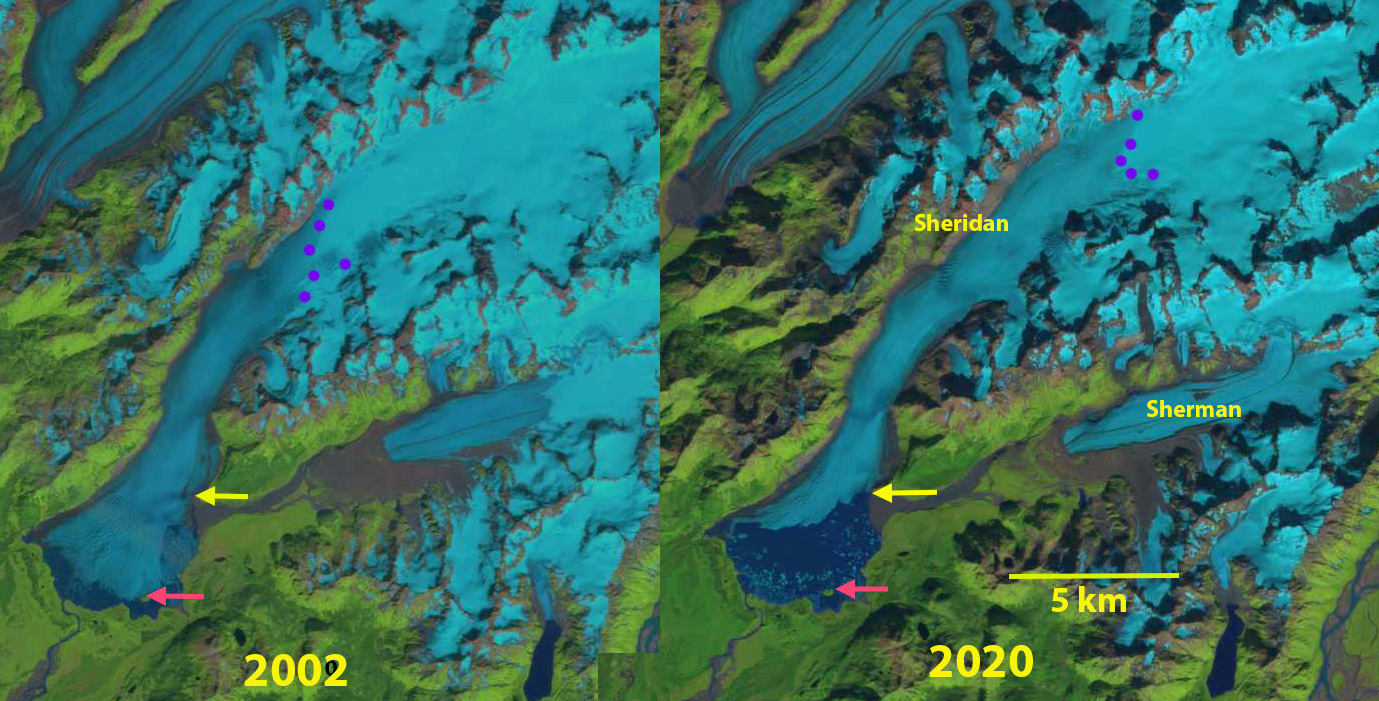
Sheridan Glacier in 2002 and 2020 Landsat images illustrating retreat of the margin and expansion of the lake. Red arrow is 2002 margin on small island, yellow arrow is 2020 terminus location just north of Sherman Glacier stream and purple dots are the snowline.

Sheridan Glacier in the Chugach Mountains of Alaska begins at 1500 m and flow southwest out of the mountains with the terminus spreading out in a  lake basin on the low slope coastal plain.  Sheridan Lake is a proglacial lake at the terminus that drains into the Sheridan River which 12 km later reaches tidewater. From 1950 to 2000 Sheridan Glacier experienced modest retreat, with the terminus, with a fringing proglacial Sheridan Lake persisting, followed by a terminus disintegration from2000-2016. (Shugar et al 2018). Here we examine Landsat imagery from 2002-2020 to identify the retreat and resultant lake expansion.

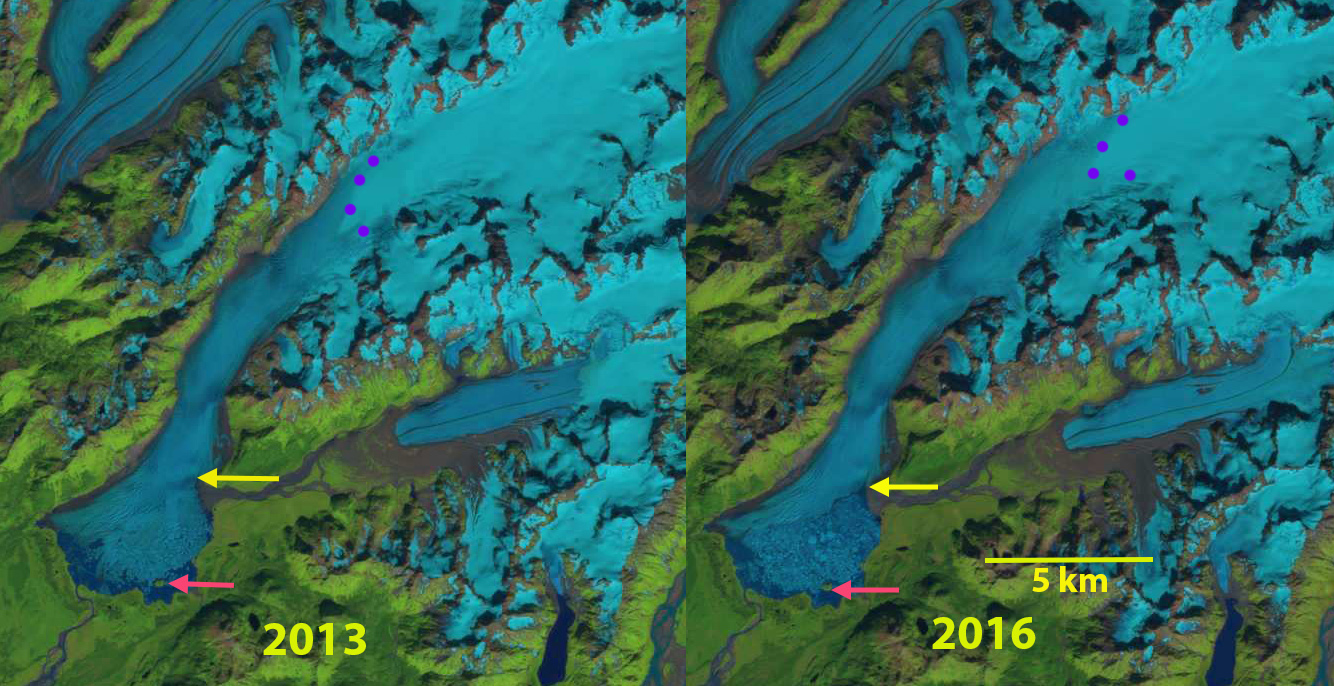
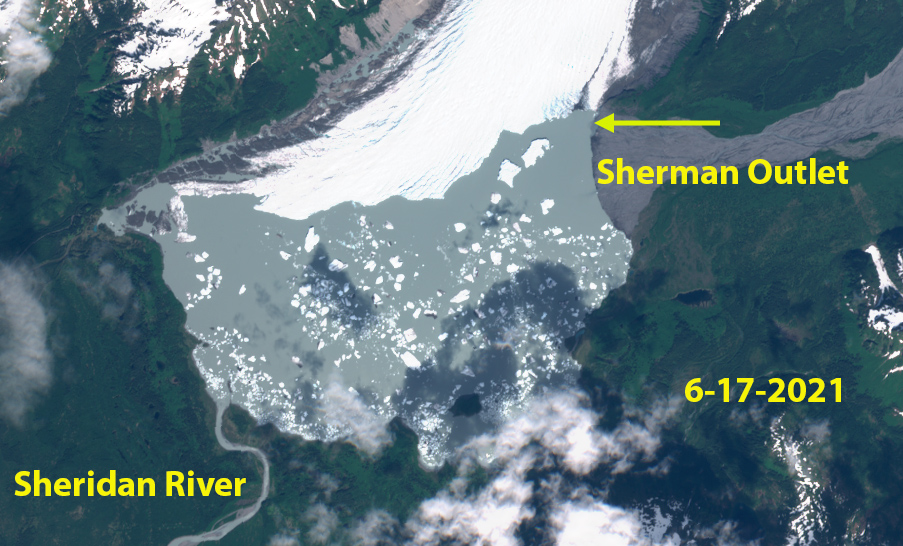
In 2002 the proglacial lake has an area of 3.8 km2, with the terminus crossing one small island in the lake.  The snowline is at 750 m. In 2013 there is a 4 km2 terminus area that has disintegrated, the terminus has retreated off of the island.  The snowline is at 850 m. By 2016 the terminus has retreated north of the glacier stream from Sherman Glacier entering from the east, though much of the lake is still filled with an iceberg melange.  The snowline is at 925 m.  In 2020 the Sheridan Lake area has expanded to 11.2 km2, representing a retreat of 7.4 km2 since 2002.  The snowline in 202o is at 970 m.  In June 2021 there are a significant number of new icebergs indicating ongoing lake expansion during 2021.  Sheridan Lake is not a large glacial lake by Alaskan standards, but is bigger than any glacial lake in most alpine regions such as the Himalaya.  The ability to be so large is in large part due to the ability to develop larger basin on low sloped terrain near the coastline.

The amount of terminus retreat here is less than that at Excelsior Glacier or Yakutat Glacier, but the lake expansion rate is comparable to Excelsior Glacier.

Sheridan Glacier in 2013 and 2016 Landsat images illustrating the breakup of a large terminus region generating a melange of icebergs. Red arrow is 2002 margin on small island, yellow arrow is 2020 terminus location just north of Sherman Glacier stream and purple dots are the snowline.

June 2021 Sentinel Image indicating considerable new iceberg activity leading to ongoing lake expansion in 2021.


Dawes Glacier, Alaska Retreat Driven Separation

Dawes Glacier retreat in 1985 and 2020 Landsat images. Red arrow 1985 terminus, yellow arrow 2020 terminus. Point 1-3 are tributaries joining the main glacier. The glacier is about to separate into two calving termini.

Dawes Glacier terminates at the head of Endicott Arm in the Tracy Arm-Fords Terror Wilderness of southeast Alaska. Endicott Arm is a fjord that has been extending with glacier retreat, and is now  58 km long.  Dawes is a major outlet glacier of the rapidly thinning Stikine Icefield. Melkonian et al (2016) observed a rapid thinning of the Stikine Icefield of -0.57 m/year from 2000-2014.  Here we compare Landsat imagery to identify changes from 1985-2020. Endicott Arm is host to a population of harbor seals that prefer hauling out on icebergs during the day supplied by Dawes Glacier (Blundell and Pendleton, 2015)

In 1985 the glacier terminated at the red arrow in each image, the tributaries at points 1,2 and 4 connected with the main glacier. Point 3 is the junction point of two tribuataries. The northern arm is 1.3 km wide and the eastern arm is  2.5 km wide.  The snowline was at 1100 m.  In 1987 the snowline on the glacier was at 1150 m.  By 1999 the glacier had retreated 900 m since 1985 and the snowline was at  1300 m.  In 2019 the tributaries at Point 1, 2 and 4 have detached from the the main glacier. At Point 3 the northern arm has declined to 0.7 km wide and the eastern arm is  1.8 km wide.  In 2019 the snowline is at a record 1450-1500 m.This fragmentation of Dawes Glacier will continue, which leads to a reduced ice flux to the terminus reach. By 2020 Dawes Glacier has retreated 3.8 km since 1985, a rate of 105 m/year. The snowline is again exceptionally high at 1400-1450 m. Of equal importance the glacier terminus is separating into two individual calving termini, that could become fully separate this summer of 2021.

McNabb et al (2014) reported a thinning of 62 m/year from 1985-2013. The reduced inflow and up glacier thinning is ongoing and has driven the increased retreat rate despite a reduction in water depth at the cavling front. A key mechanism for retreat over the last century has been calving. The 2007 Hydrographic map of the area indicates water depth at the calving front still over 100 m, with a depth of 150 m 1 km down fjord of the terminus (see bottom image). The  depth more recently has declined to 60 m at the calving front in 2013 (Melkonian et al 2016), yet retreat has increased driven by enhanced melting. The glacier thinning is continuing, but the retreat rate will decline as the fjord head is approached.

At the glacier front the velocity was 13 m/day in 1985, increasing to 18 m/day by 1999 and declining to 5 m/day by 2014 (Melkonian et al 2016).

This reduction will reduce calving and iceberg production. As icebergs are reduced harbor seals will be disappointed as they prefer icebergs to haul out on. The Alaska Department of Fish and Game has been monitoring harbor seals in the fjord and noting that females travel to pup on the icebergs in the spring and also utilize them for mating.  ADFG attached satellite tags to harbor seals to monitor their movements beyond the breeding and puppin season finding  that that adult and sub-adult seals captured in Endicott Arm spent the late summer and fall months in Stephens Passage, Frederick Sound, and Chatham Strait. How will a reduction in icebergs affect this population overall?

The retreat leading to separation is also happening at other outlets of Stikine Icefield such as Baird Glacier and Sawyer Glacier.

Dawes Glacier retreat in 1985 and 2020 Landsat images. Red arrow 1985 terminus, yellow arrow 2020 terminus and purple dots the snowline. Point 1-4 are tributaries joining the main glacier.

Dawes Glacier retreat in 1985 and 2020 Landsat images. Red arrow 1985 terminus, yellow arrow 2020 terminus and purple dots the snowline. Point 1-4 are tributaries joining the main glacier.

Dawes Glacier in June 2021 Sentinel image. Indicating the impending separation of the terminus.

Hydrograh of Endioctt Arm from 2007.