Excelsior Glacier, Alaska Retreat Leads to Lake Doubling in Size

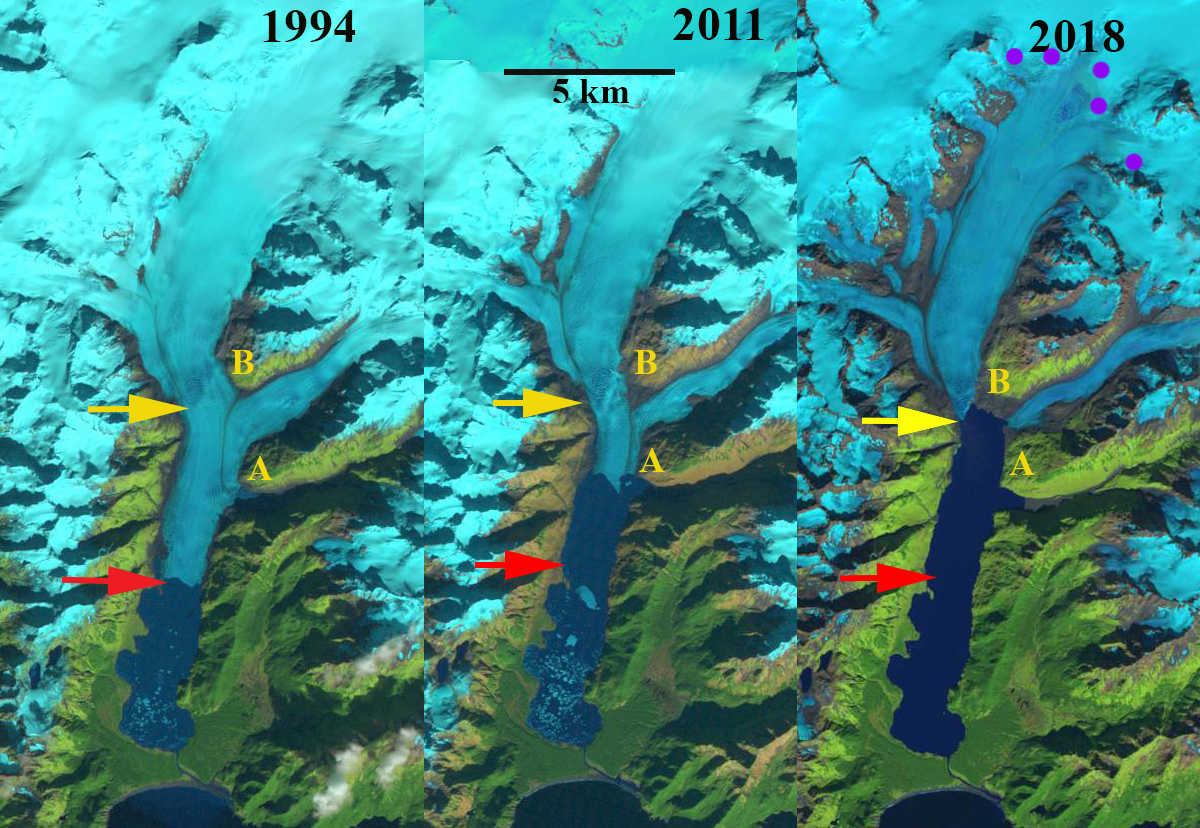
Excelsior Glacier retreat from 1994 to 2018 in Landsat images from 1994, 2011 and 2018.  The red arrow is the 1994 terminus location and the yellow arrow is the 2018 terminus location.  Point A and B are on the south and northwest side of the eastern tributary of the glacier.

Excelsior Glacier is an outlet glacier of the Sargent Icefield, on the Kenai Peninsula of Alaska, that has terminated in an expanding Big Johnstone Lake since 1941. Here we examine the retreat of Excelsior Glacier from 1994-2018 using Landsat imagery. In 1909 the glacier ended on the strip of forested land between the lake and the ocean (Molnia, 2007). By 1950 the glacier had retreated 2 km from this strip of land creating the new lake (USGS-Molnia, 2008).  This blog post is source of an article published by the Washington Post and from NASA Earth Observatory.

In 1994 the glacier was 21 km long and had retreated 5.5 km from the southern margin of Big Johnstone Lake, this is a rate of ~100 m/year since the lake began forming 1941.  There is a glacier dammed lake just south of Point A named Excelsior Lake. By 2001 the glacier had retreated 800 m from the 1994 position, a rate of ~100 meters per year, and the glacier dammed lake south Point A remains, along with a few large icebergs. By 2011, the glacier had retreated beyond the former glacier dammed lake and ended at the prominent ridge just north of this former lake, adjacent to Point A, and the new inlet that replaces it. The glacier has retreated 2200-2500 m depending where on the front the measurement is made. By 2013 the glacier has retreated back to the junction of the two main tributaries between Point A and B.  The snowline is at 900 m, with more than 80% of the glacier falling below the snowline.  A calving Alaskan glacier typically needs at least 60% of its area above the snowline consistently to be in equilibrium. In 2011 and 2013 images there are large icebergs in Big Johnstone Lake indicating active calving. In 2018 the snowline is at 925 m again leaving an insufficient accumulation zone to support the glacier. Big Johnstone Lake has expanded to a length of 10.2 km, with an area of 18 km2.  The glacier has retreated 4.7 km from 1994-2018, a rate of ~200 m/year, twice the previous rate.  The eastern and western tributaries have now fully separated.  Johnstone Adventure Lodge visited the eastern tributary, they call it Roan Glacier, glacier in May of 2019, the photograph they provided below indicates the glacier has receded from the lake.  The glacier in 2018 is 15 km long having lost ~30% of its length in 24 years. Big Johnstone Lake is nearing its maximum size as the glacier surface slope steepens within 1 km of the current terminus, indicating a substantial increase in elevation of the base of the glacier. The lake width has changed little and is 1.4-1.8 km wide in the region the terminus has been retreating through during the last 25 years are has doubled from 9 to 18 km2.  There will be a reduction in calving and retreat rate as the lake development nears completion, in 2018 for the first time there are no visible icebergs. Johnstone Adventure Lodge observed 15-20 harbor seals during their first visit to the glacier front in 2019, 10 of them had pulled out on icebergs.  A reduction in icebergs will make the lake less attractive to harbor seals.

Excelsior Glacier follows the pattern of retreat of the neighboring Ellsworth Glacier and  Pedersen Glacier of the Harding Icefield. This glacier is seen as a model for the impending retreat of Brady Glacier (Pelto et al, 2013).

Excelsior Glacier retreat from 1994 to 2018 in 1984 USGS map and Landsat images from 2001 and 2013.  The red arrow is the 1994 terminus location and the yellow arrow is the 2018 terminus location.  Point A and B are on the south and northwest side of the eastern tributary of the glacier.

“Roan Glacier”  the eastern tributary of Excelsior Glacier in May 2019 now terminating on an outwash plain.  Image from Johnstone Adventure Lodge.

Lemon Creek Glacier 2018 Ablation and Glacier Runoff

Lemon Creek Glacier (L) with the snowline (black line) indicated in Landsat images from July 5, July 30 and Sept. 16 2018. P=Ptarmigan Glacier, T=Thomas Glacier, red arrow is the 1948 terminus location. A,B and C mark firn horizons exposed by the loss of all snowpack in the accumulation zone.

The summer of 2018 was exceptional for warmth in Southeast Alaska.  July was the most unusual with Juneau recording daily highs above 70 F on 18 days, including 12 consecutive days at the end of the month.  The average temperature in July in Juneau was 2.4 C above average and the warmest average monthly temperature in history. Precipitation was recorded on just 6 days of precipitation at the Long Lake SNOTEL site in the mountains near Juneau. This resulted in the highest observed snowline of the 70 year record on Taku Glacier, a 25 km2 snow swamp developing in three days on Lowell Glacier and the loss of all snowpack on Lemon Creek Glacier.  For a glacier to be in equilibrium most glaciers need to be more than 50% snowcovered.  On Lemon Creek Glacier at the end of the summer the glacier must be covered 62% to be in equilibrium (Pelto et al 2013).  The Lemon Creek Glacier is a reference glacier of the World Glacier Monitoring Service, with mass balance measured since 1953 by the Juneau Icefield Research Program (JIRP).  The USGS began monitoring the glacier in 2016 and currently reports mass balance to WGMS, Chris McNeil (USGS) is leading a reanalysis of the mass balance record. The cumulative mass loss from 1953-2018 is ~37 m w.e, with 2018 having the most negative balance of -2.31 m w.e. The area of the glacier has declined from 12.8 square kilometers in 1948 to 9.7 square kilometers in 2018, a 24% decline.  For the glacier to provide an equivalent runoff ablation rates would have had to rise by 24%.
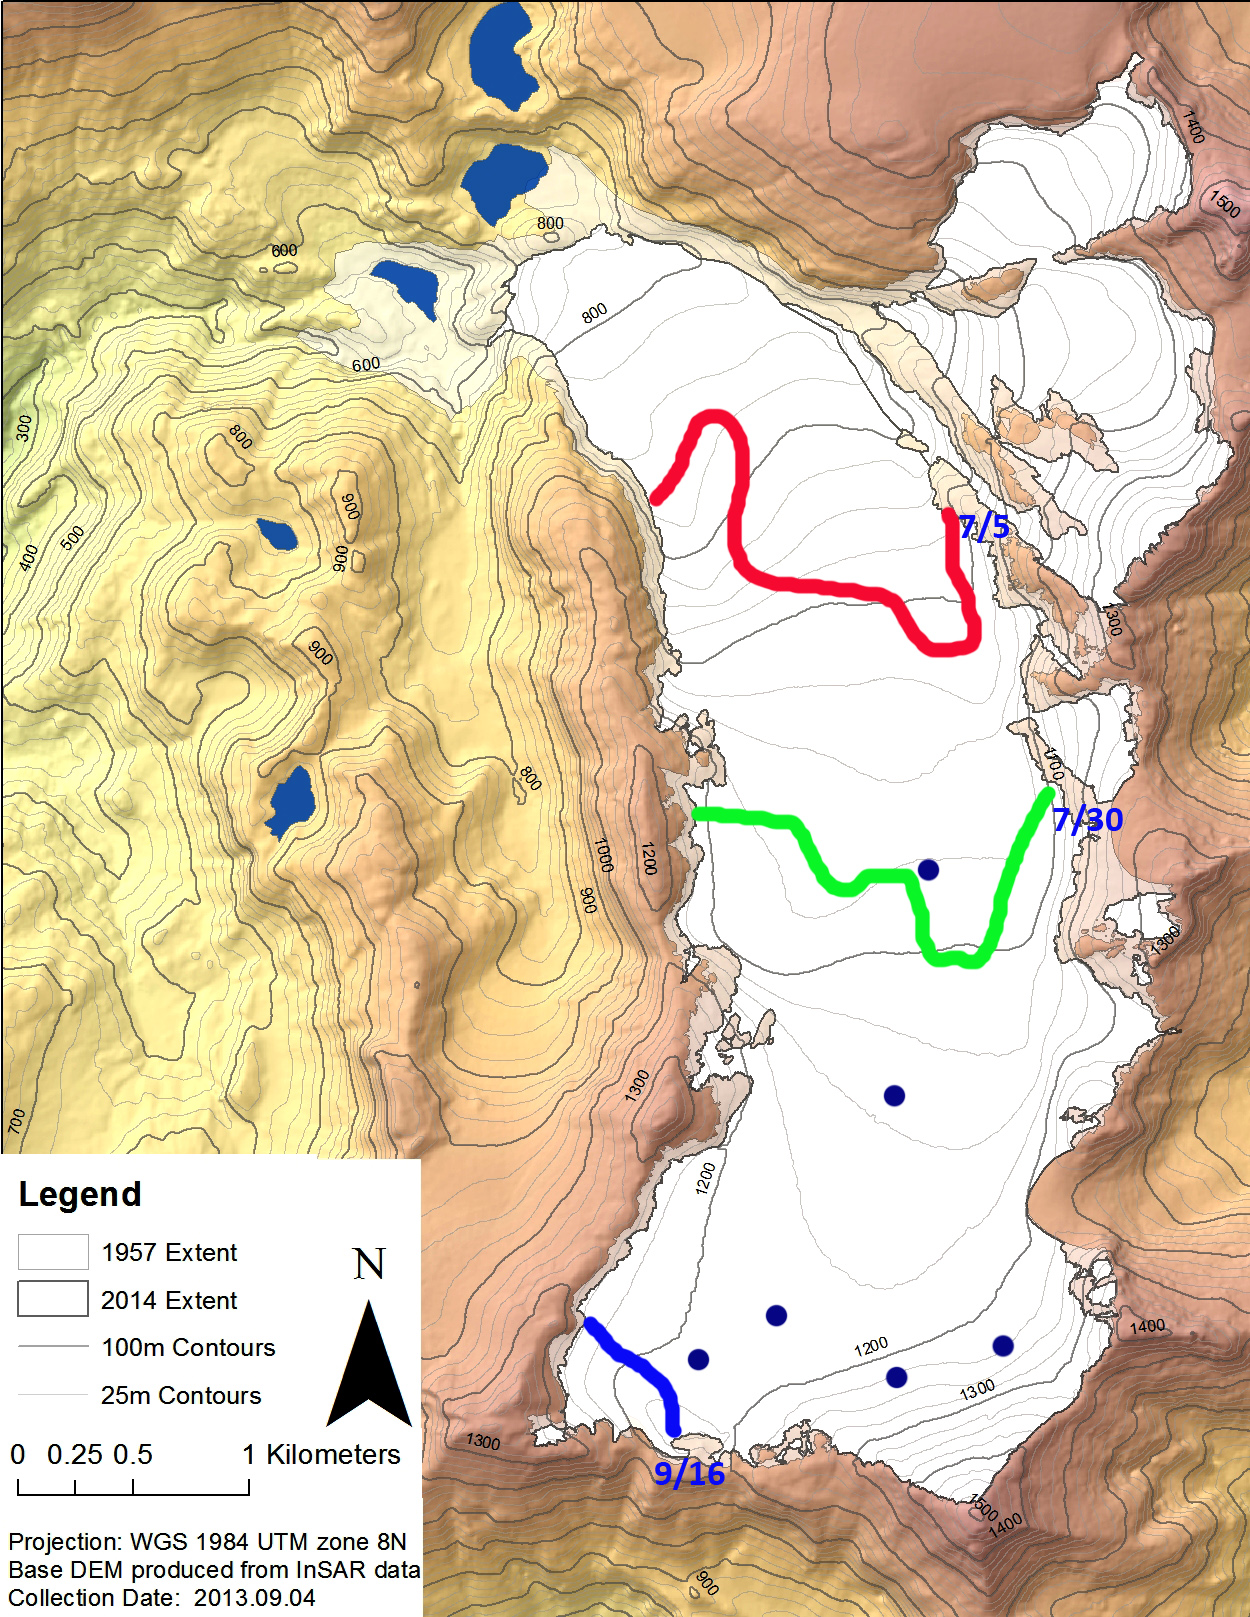
In 2018 on July 5 2018 the snowline on Lemon Creek Glacier was at 950 m.  From July 4-6 a series of snowpits were dug on the glacier by JIRP yielding a retained snowpack ranging from 0.9 m (water equivalent=w.e.) to 1.2 m (w.e.).  One of the snowpits with 0.9 m w.e. was at 1075 m.  On July 30 the snowline had reached 1100 m, indicating approximately 0.9 m of snow ablation in that 21 day interval. Because ice ablates faster than snow, 36% faster on Lemon Creek Glacier this would equate to  ~1.2 m of ice ablation. By September 2 the snowline had risen above the top of the glacier, with one small snowpatch in the northwest corner at 1200 m, firn horizon exposed by snowpack loss are evident .  This remains the case in the Sept. 16 image.  The small snowpatch also melted away by the end of September.  There was no accumulation zone for the third time in the last five years,indicating this glacier cannot survive current climate (Pelto, 2010).

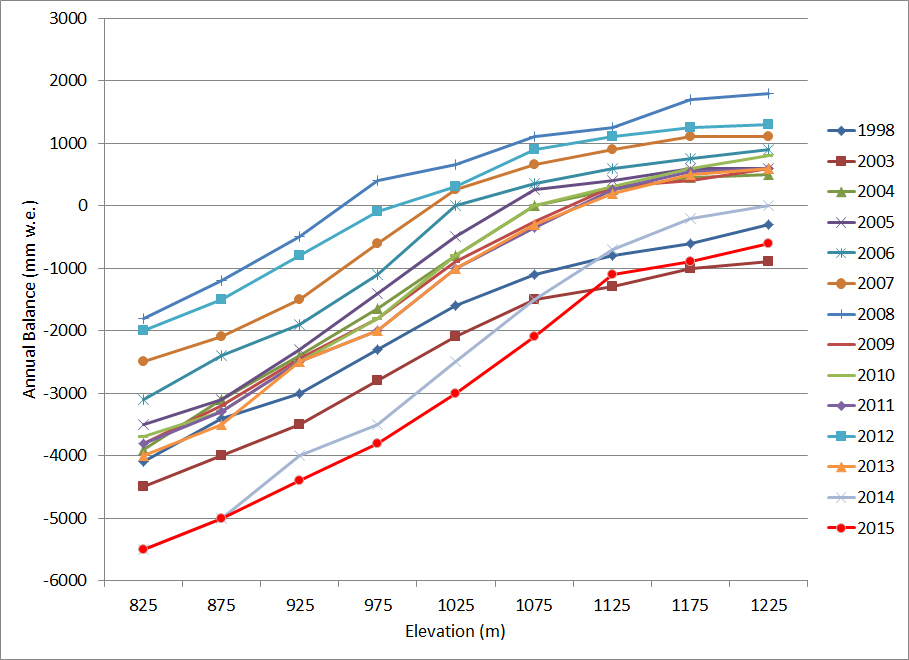
The consistency of the balance gradient, seen below from year to year allows for determination of melt rates and runoff based on the rise of the snowline.  The transient snow line migration rate times the balance gradient yields ablation rate at the snowline (Pelto, 2011). The impact of a greater area of surface ice exposed is increased ablation.  To illustrate this impact if we as an example take a day with a mean temperature of 10 C:

This would yield 350,000 m3 of melt on July 5, the glacier was 23% bare ice and 77% snow cover on this date.

This would yield 382,000 m3 of melt on July 30, the glacier was 41% bare ice and 59% snow cover on this date.

This would yield 480,000 m3 of melt on Sept. 16, the glacier was 97% bare ice/old firn and 3% snow cover on this date.

The actual July 5 temperature for Lemon Creek Glacier was 12 C. This yields 420,000 m3 of runoff.

The actual July 30 temperature for Lemon Creek Glacier was 11.5 C. This yields 440,000 m3 of runoff.

The actual Sept. 16 temperature for Lemon Creek Glacier was 1.5 C. This yields 72,000 m3 of runoff.

Base map of Lemon Creek Glacier from 2014 prepared by Chris McNeil (JIRP and USGS).  The blue dots are JIRP 2018 snowpit locations and the lines are the snowline on the respective dates. Camp 17 is the JIRP camp used for Lemon Creek Glacier research, including the upcoming 2019 field season.

USGS topographic map based on 1948 aerial photographs. On right is the hillshade image from 2011, margin is the black dots.

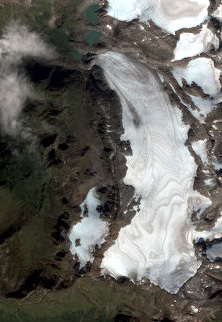
Image of the glacier on 9/2/2018 indicating firn horizons and the small remaining snowpack in the southwest corner.

Balance gradient of Lemon Creek Glacier, note the consistency.


Skilak Glacier, Alaska Retreat and Salmon Connection

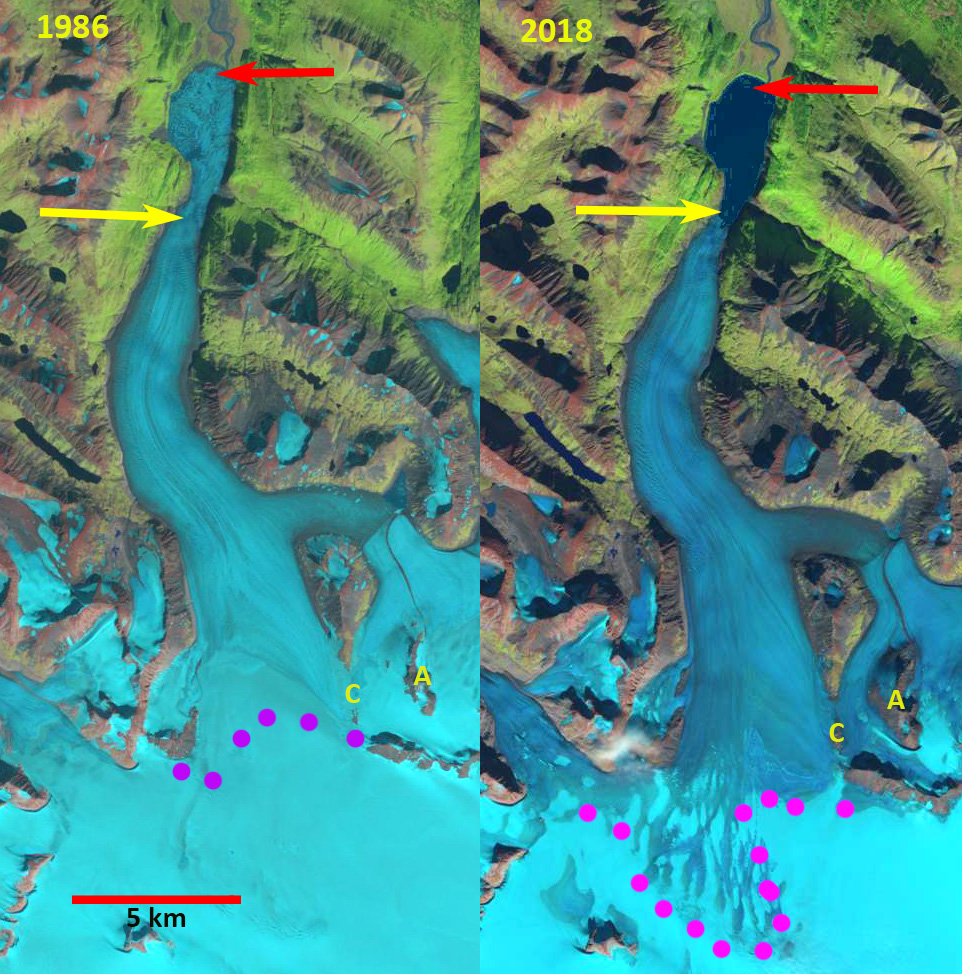
Skilak Glacier in 1986 and Sept. 2018 Landsat images.  In 1986 icebergs and remnant glacier fill nearly the entire lake.  The snowline in 1986 is at 1200 m and is at 1300 m in 2018. Red arrow is the 1982 terminus location and yellow arrow is the 2018 terminus location. Point A and C are bedrock outcrops at around 1200 m that have expanded.

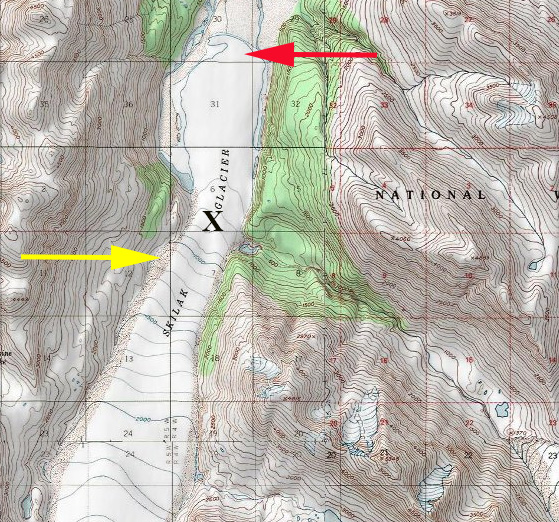
Skilak Glacier is an outlet glacier on the northwest side  of the Harding Icefield, Kenai Peninsula, Alaska. From 1952-1982 Skilak glacier terminated on a proglacial plain with a broad nearly flat terminal lobe, see map below. The glaciers that drain eastward are in the Kenai Fjords National Park, which has a monitoring program.  From 1950-2005 all 27 glaciers in the Kenai Icefield region examined  retreated (Giffen et al 2014).  Giffen et al (2014) observed that retreated 1,800 m from from 1986-2000, with no retreat from 2000-2005. Here we examine Landsat imagery from 1986-2018 to illustrate the retreat of this glacier, recent snowline elevation and other upglacier changes. The glacier supplies meltwater to Skilak Lake which is a critical salmon habitat for the Kenai.  Chinook Salmon spawn on a section of the Kenai River between Kenai Lake and Skilak Lake. With Skilak Lake being the resulting home for ninety percent of the salmon fry for the Kenai River, and with the most of any nursery in the Cook Inlet area.  Escapements of chinook in the Kenai River exceed 50,000 annually in two runs (Heard et al 2007). Sockeye salmon is the largest run in the river with over 1,000,000 annual in the Kenai River run (Schoen et al, 2017).

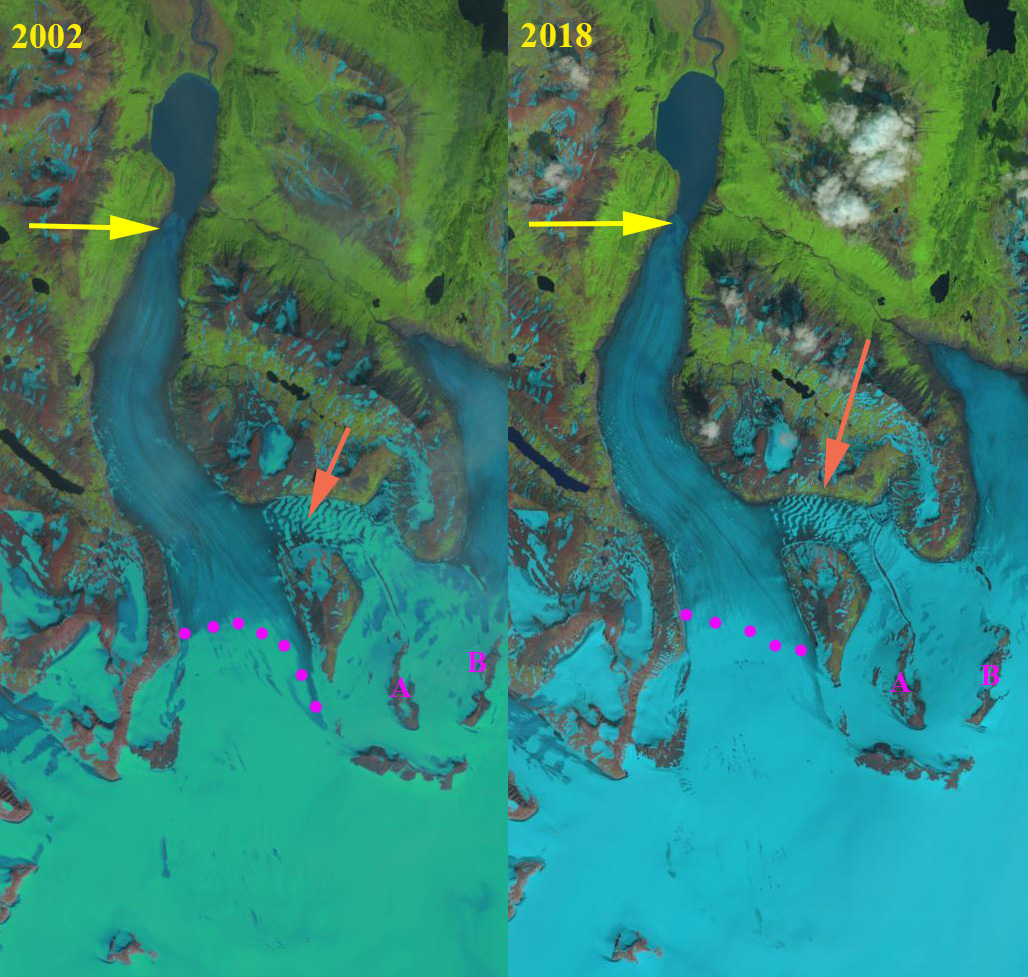
In the 1958 USGS map from there is no lake evident at the terminus of the glacier.  The lower 2 km of the glacier is nearly flat.  By 1986 the flat terminus was breaking up with icebergs filling the lake. By 2002 the glacier had retreated 4 km generating a lake with an area of 6.2 square kilometers. The snowline in 2002 was at 1200 m.  The glacier retreated 300 m from 2002 to 2018.  From July 2018 to Sept. 2018 the snowline rose from 1050 m to 1300 m.  Though retreat has been slow since 2002 upglacier thinning has been substantial At Point A and C from 1986 to 2018 and at Point A and B from 2002-2018. This will drive additional retreat.  The retreat rate should be more in line with that of the neighboring Harris Glacier. 

Skilak Glacier  1958 Map prior to lake formation.

Skilak Glacier in 2002 and July 2018 Landsat images.  In 2002 is at 1100 m and is at 1150 m in July 2018. Red arrow is the 1982 terminus location and yellow arrow is the 2018 terminus location. The orange arrow indicates indicated banded snow formation.  Point A and B are bedrock outcrops at around 1200 m that have expanded.


Wrangell Mountain Icefields, Alaska Lose their Snowcover 2016 and 2017

Mount Gordon Icefield (MG) Mesa Creek Icefield (MC) and Icefield Plateau (IP) in 2016 and 2017 Landsat imagery.  The purple dots indicate the areas with retained snowcover in both years. Nabesna Glacier (N) is the largest glacier in the Wrangell Mountains, just a corner seen here.

Mount Gordon Icefield (MG) Mesa Creek Icefield (MC) and Icefield Plateau (IP) are three neighboring Icefields in the Wrangell-Saint Elias National Park and Preserve in Alaska.  Each has a principal accumulation area between 2300 and 2550 m, with a limited area above .  The area of Mount Gordon Icefield is ~10 square kilometers, Mesa Creek Icefield ~12 square kilometers and Icefield Plateau ~35 square kilometers. This is a region that has been experiencing significant mass loss.  Das et al (2014) used repeat altimetry measurements to identify accelerated mass loss over the Wrangell Mountains, from –0.07 ± 0.19 m w.e./year during 1957–2000 to –0.24  m w.e./year during 2000–07.  Larsen et al (2015) identified that the Wrangell Mountains experienced a mass balance of -0.5 to -1 m/year  from 1994–2013 using laser altimetry.

On August 17, 2016 less than 10% of the Icefield Plateau is snowcovered, with the snowline at 2500 m.  The snowline is at 2400 m on Mount Gordon Icefield and Mesa Creek Icefield with 30% of each icefield retaining snowcover.  On August 4, 2017 there is insignificant retained snowcover on Mesa Creek Icefield.  The snowline is at 2500 m on both Mount Gordon Icefield and Icefield Plateau with less than 10% overall retained snowcover.  The lack of retained snowcover across most of the former accumulation area from 2300-2550 m indicates these icefields will have substantial icefield wide thinning.  In addition the lack of a persistent substantial accumulation zone indicates the icefield will not survive, though a small mountain glacier may remain on the est side of Mount Gordon and the southern edge of the Icefield Plateau. In 2018 there is not a good cloud free August image from this region. The high snowline and rapid melt on nearby Lowell Glacier suggest the snowline would again have been high. This will lead to substantial retreat of the icefield margins and is indicative of the retreat of large glaciers in the range such as Nizina Glacier or Yakutat Glacier in the Saint Elias Range.

Mount Gordon Icefield (MG) Mesa Creek Icefield (MC) and Icefield Plateau (IP) in topographic map.

Mount Gordon Icefield (MG) Mesa Creek Icefield (MC) and Icefield Plateau (IP) in 1999 Landsat image.  The purple dots indicate areas with retained snowcover. N=Nabesna Glacier.

Mount Gordon Icefield (MG) Mesa Creek Icefield (MC) and Icefield Plateau (IP) in 2001 Landsat image.  The icefield are nearly fully covered with snow. N=Nabesna Glacier.


Meade Glacier, Alaska 4 km Retreat 1986-2018

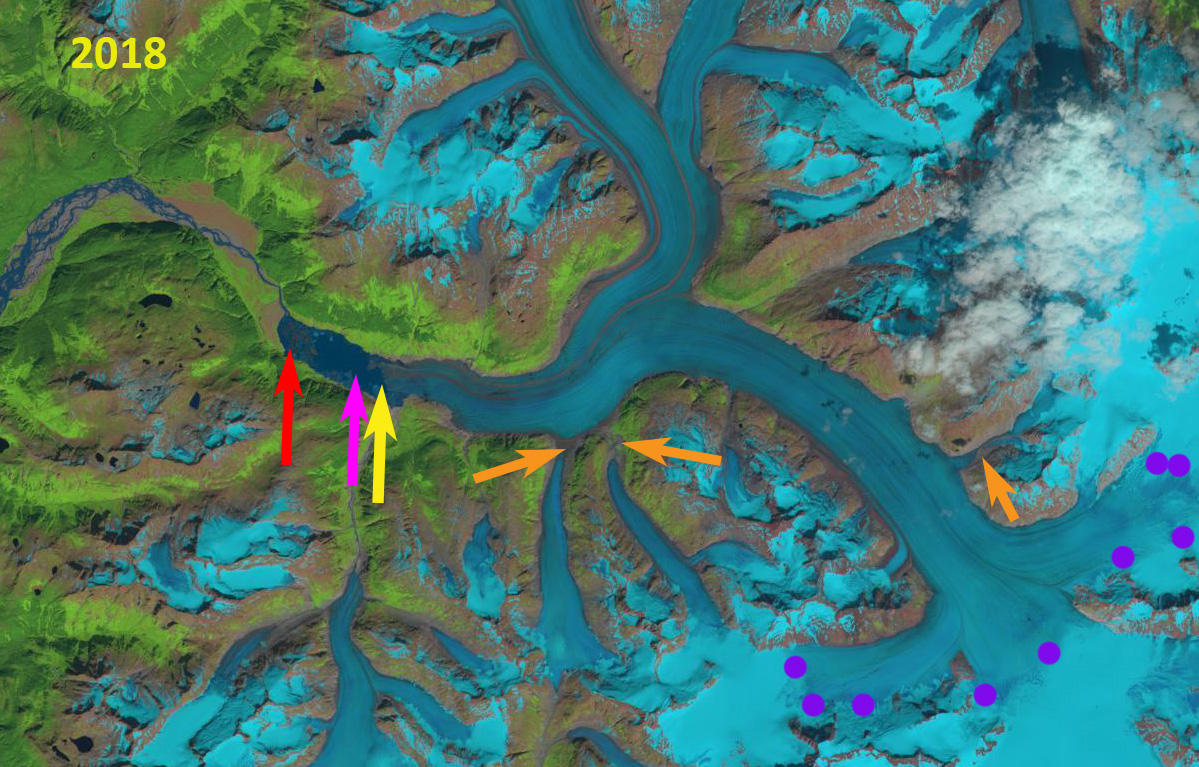
Meade Glacier in Landsat images from 1986 and 2018.  The red arrow indicates the 1986 terminus, pink arrow the 2014 terminus, yellow arrow the 2018 terminus, orange arrows tow tributaries to Meade Glacier and the purple dots the snowline.

Meade Glacier drains the northwest portion of the Juneau Icefield, with meltwater entering the Katzehin River and then Chilkoot Inlet. The glacier begins in British Columbia and ends in Alaska. Here we use Landsat imagery to examine changes in the glacier from 1986 to 2018. The glacier experienced a slow continuous retreat from 1948 to 1986 of 400 m, with the glacier ending on an outwash plain.

In 1986 the terminus is indicated by a red arrow, the snowline is at 1250 m in 1986, there is no evident lake at the terminus of glacier just an expanding outwash plain. Both tributaries from the south, orange arrows, are 750 m+ wide where they join Meade Glacier. By 2004 a 400 m long proglacial lake has formed at the terminus. The two tributaries from the south, at the orange arrows, no longer are connected to the glacier. The snowline is at 1450-1500 m. In 2014 the proglacial lake is 3.5 km long, the entire lower 2.5 km of the glacier has collapsed since 2004. There is still considerable relict ice floating in the lake. There is a substantial lake along the southern margin of the glacier where a tributary streams enters the main valley. This indicates the glacier will quickly retreat to this point by further collapse into the lake.  The snowline in 2014 is at 1450 m on Aug. 2, the date of the imagery, the high snowline ensures continued mass loss and glacier retreat.  By 2018 Mead Glacier has retreated 4.1 km since 1986.  The snowline is at 1450 m on October 2, when fall snow should have already begun.  A third tributary entering the glacier from the east at 1200 m no longer reaches the main stem.  Based on surface slope changes the glacier appears to be within 1 km of the inland limit of the proglacial lake.  The inland limit should be near the prominent bedrock knob on the south side of the glacier a short distance inland of the current terminus. When this is reached the glacier retreat will be reduced.  The retreat parallels that of most Juneau Icefield glaciers including the next glaciers to the south Field Glacier and Gilkey Glacier.  The glacier shares a divide with Warm Creek Glacier that terminates in British Columbia that is also retreating rapidly in an expanding lake.

Meade Glacier in Landsat image from 2004.  The red arrow indicates the 1986 terminus, pink arrow the 2014 terminus, yellow arrow the 2018 terminus, orange arrows tow tributaries to Meade Glacier and the purple dots the snowline.

Meade Glacier in Landsat image from 2014.  The red arrow indicates the 1986 terminus, pink arrow the 2014 terminus, yellow arrow the 2018 terminus, orange arrows tow tributaries to Meade Glacier and the purple dots the snowline.

Meade Glacier in Landsat image from 2018.  The red arrow indicates the 1986 terminus, pink arrow the 2014 terminus, yellow arrow the 2018 terminus, orange arrows tow tributaries to Meade Glacier and the purple dots the snowline.

Taku Glacier, Alaska in 2018 Highest Snowline in 70+ years

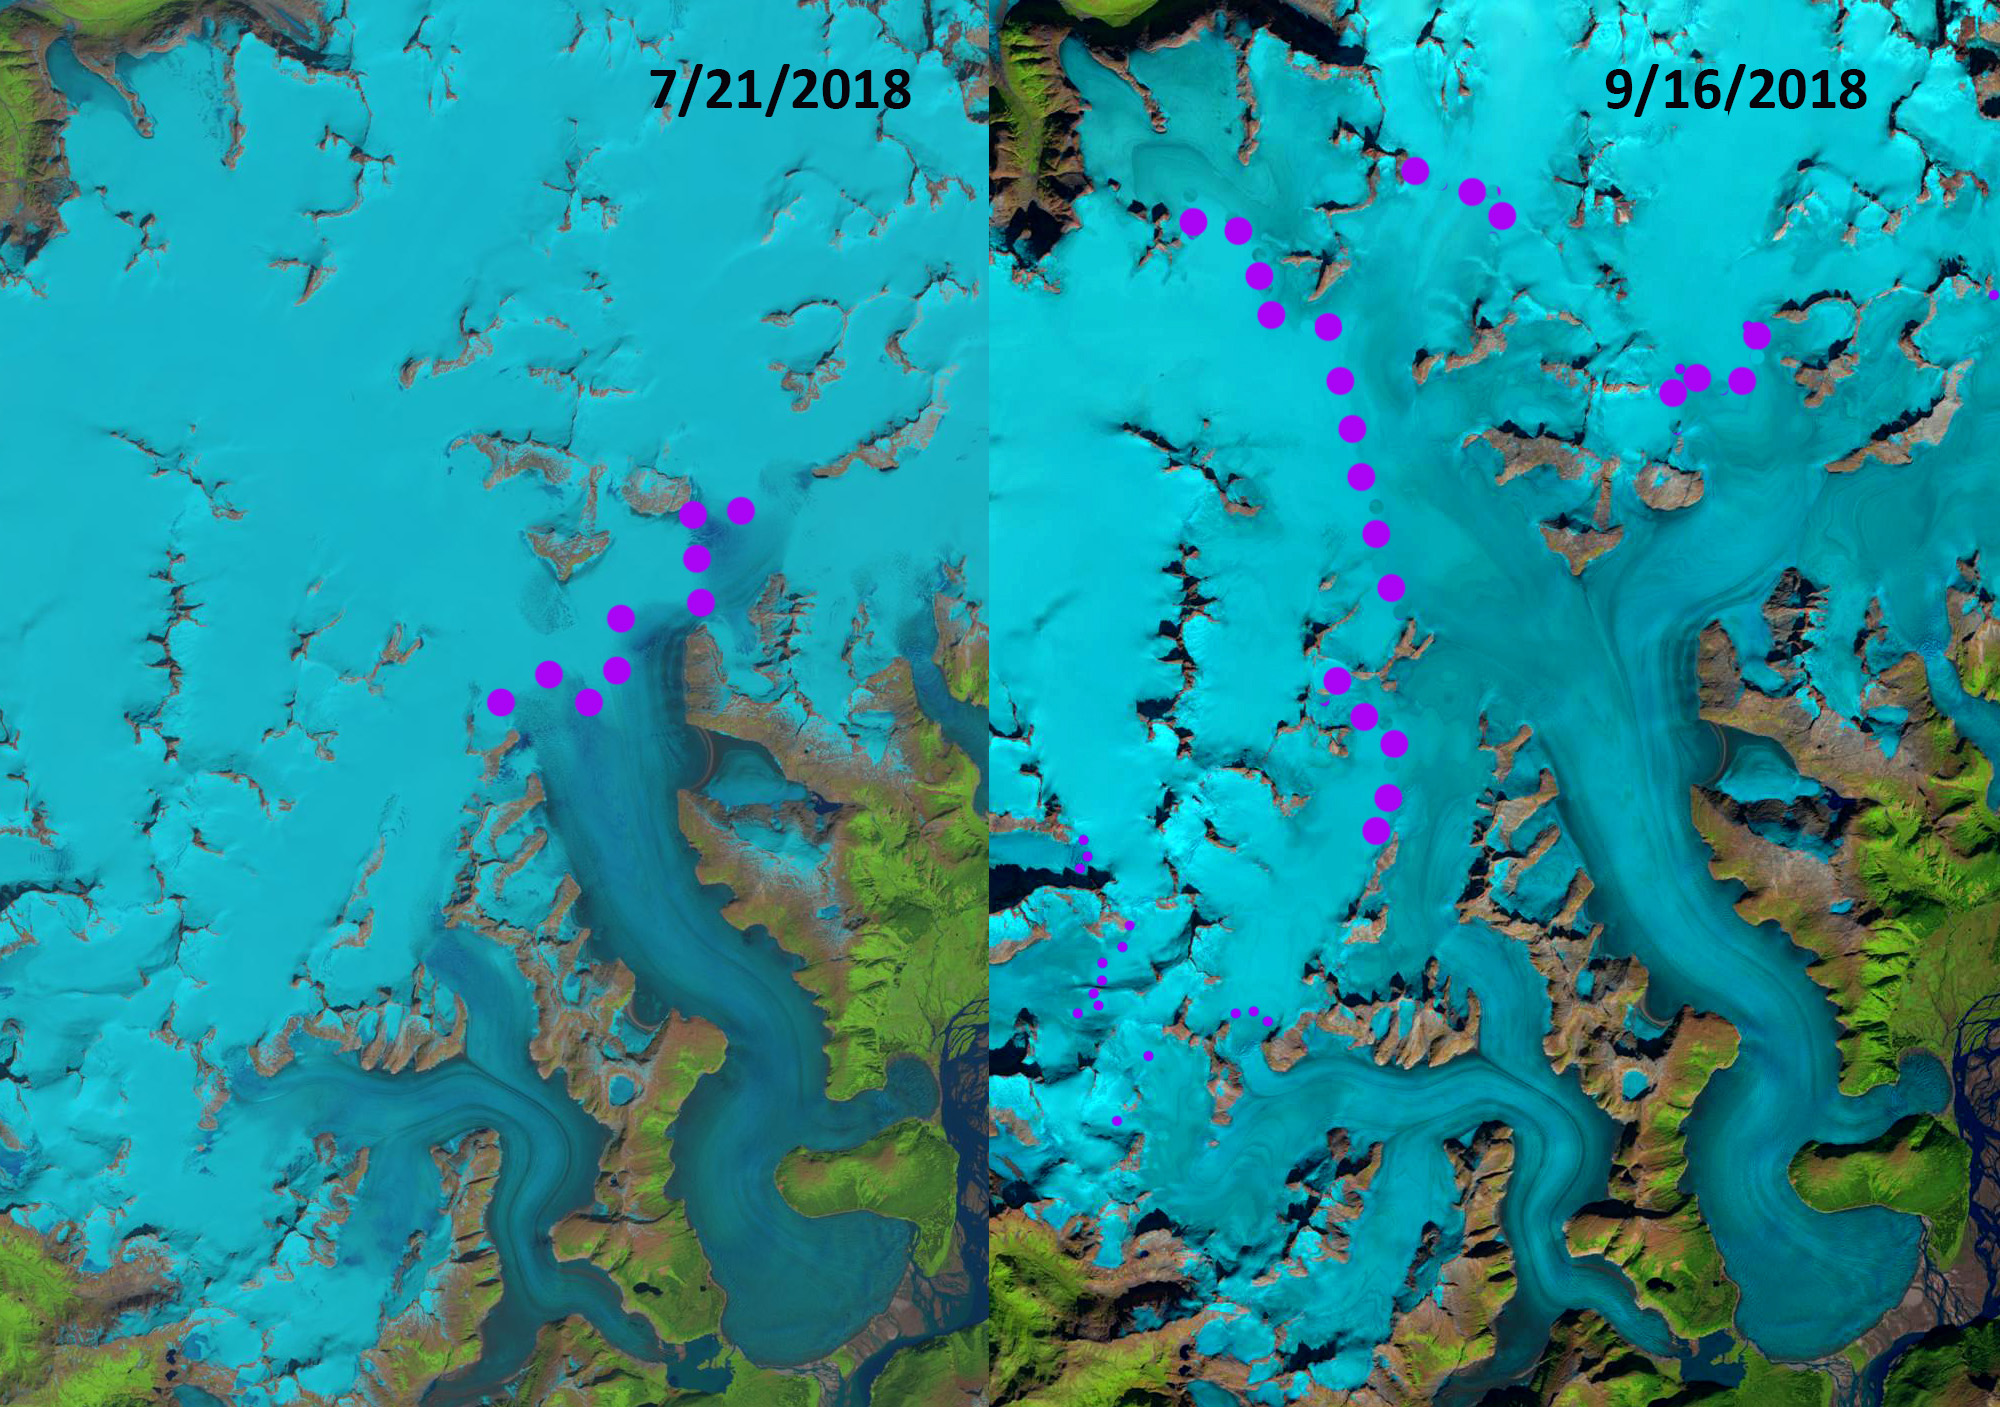
Taku Glacier transient snowline (purple dots) in Landsat images from 7/21 and 9/16/2018.

The Juneau Icefield Research Program (JIRP) has been examining the glaciers of the Juneau Icefield since 1946. Until the NASA Landsat program began, field measurements and aerial observations were the only means to observe the glaciers of the icefield. For more than 40 years it was Maynard Miller, U of Idaho, who led this expedition that has trained so many of today’s glaciologists, today it is led by Seth Campbell, U of Maine who followed Jeff Kavanaugh, U of Alberta.   Landsat images have become a key resource in the examination of the mass balance of these glaciers (Pelto, 2011). The overall mass balance record of the glaciers was published this by Pelto et al (2013). On Taku Glacier, the mean annual equilibrium line altitude (ELA) has risen 85 m from the 1946–1985 period to the 1986–2018 period.  Mean annual mass balance from 1946-1985 and 1986-2018, with 2018 values being preliminary, were +0.40 m/yr and −0.18 m/yr respectively, indicative of the snow line rise resulting in cessation of the long-term thickening of the glacier.

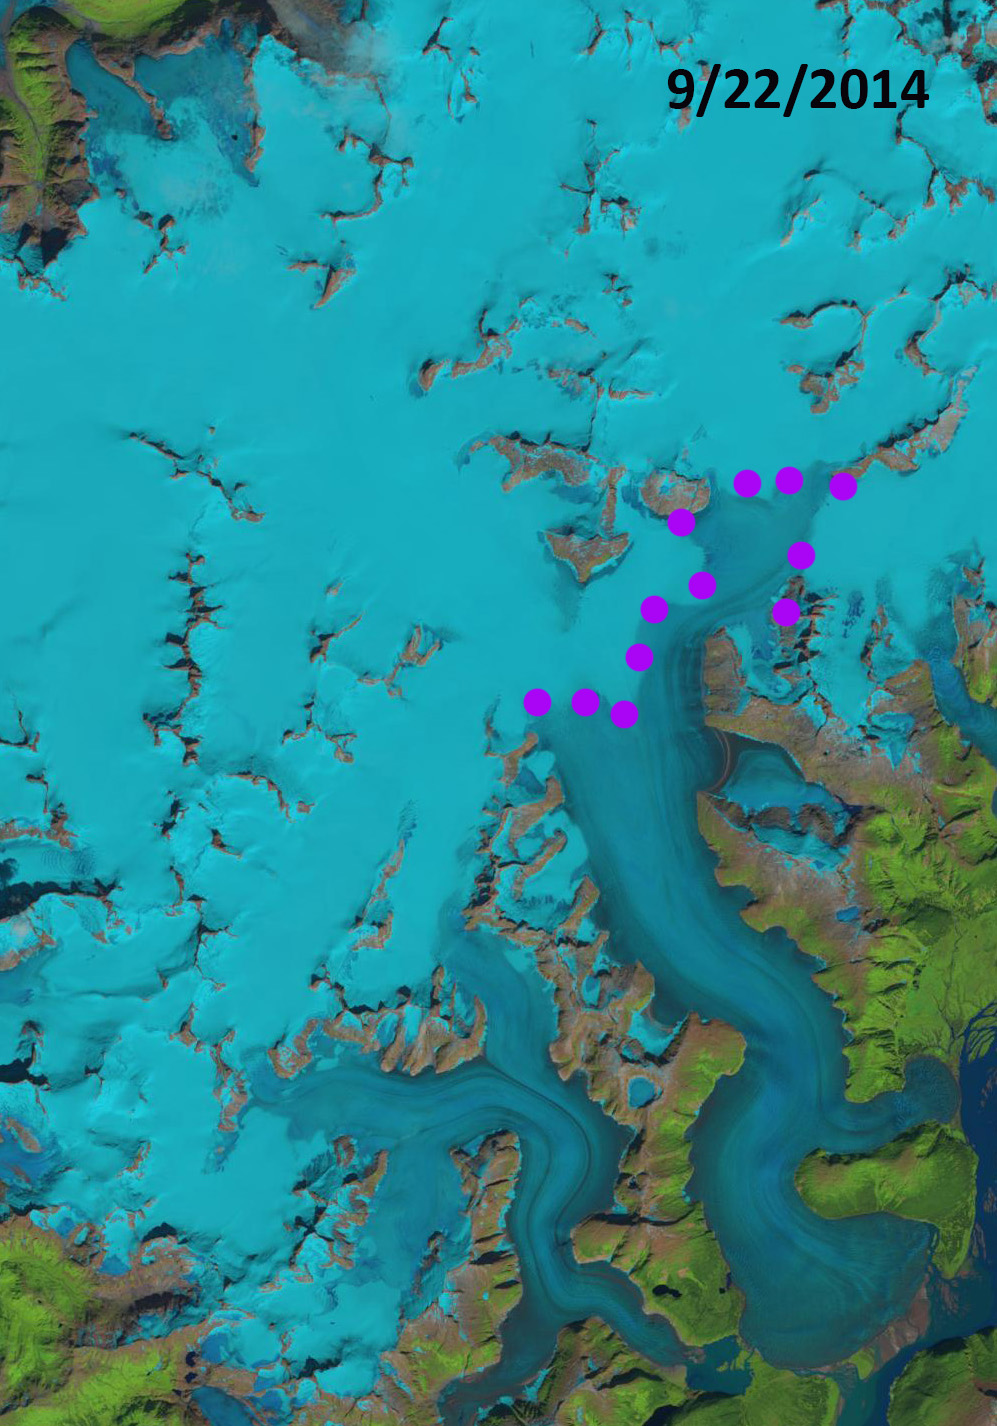
The height of the transient snowline (purple dots) at the end of the summer represents the ELA for the glacier, where ablation equals accumulation.  This also is a good estimator of mass balance. The end of the summer melt season typically occurs in September. In the last three decades the average ELA has been 1000 m.  In 2018 the transient snowline on July 21 was at 975 m, and by July 30 the TSL was above 1075 m.  On Sept. 16, 2018 the snowline was at 1400 m on average, the highest observed since records began in 1946. This is a rise of 425 m in ~57 days.  Given the balance gradient observed on the glacier of  ~3.3 mm/m this represents ablation of 1.4 m w.e. snow, or 2.0 m of snow depth  (Pelto et al 2013 and Roth et al 2018)  The snowline on Brady Glacier, Glacier Bay was also the highest that had been observed in 2018. In the images below the TSL in 2013 is at 1000 m, in 2014 at 1100 m, 2015 at 1140 m, and in 2017 at 1150 m. Pelto (2017) identifies the response of the entire icefield to climate changes from 1984-2013. The 2014-2018 period has been the most negative balance 5 year period for the icefield, which will lead to continued thinning and volume loss.


Annual equilibrium line altitude on Taku Glacier 1946-2018, 2018 is the highest and 1985 the lowest.

Taku Glacier transient snowline (purple dots) in Landsat image from 9/15/2013.

Taku Glacier transient snowline (purple dots) in Landsat images from 9/22/2014.

Taku Glacier transient snowline (purple dots) in Landsat images from 9/8/2015.

Taku Glacier transient snowline (purple dots) in Landsat images from 9/20/2017.

Brady Glacier, Alaska Nunatak Expansion and High Snowline 2018

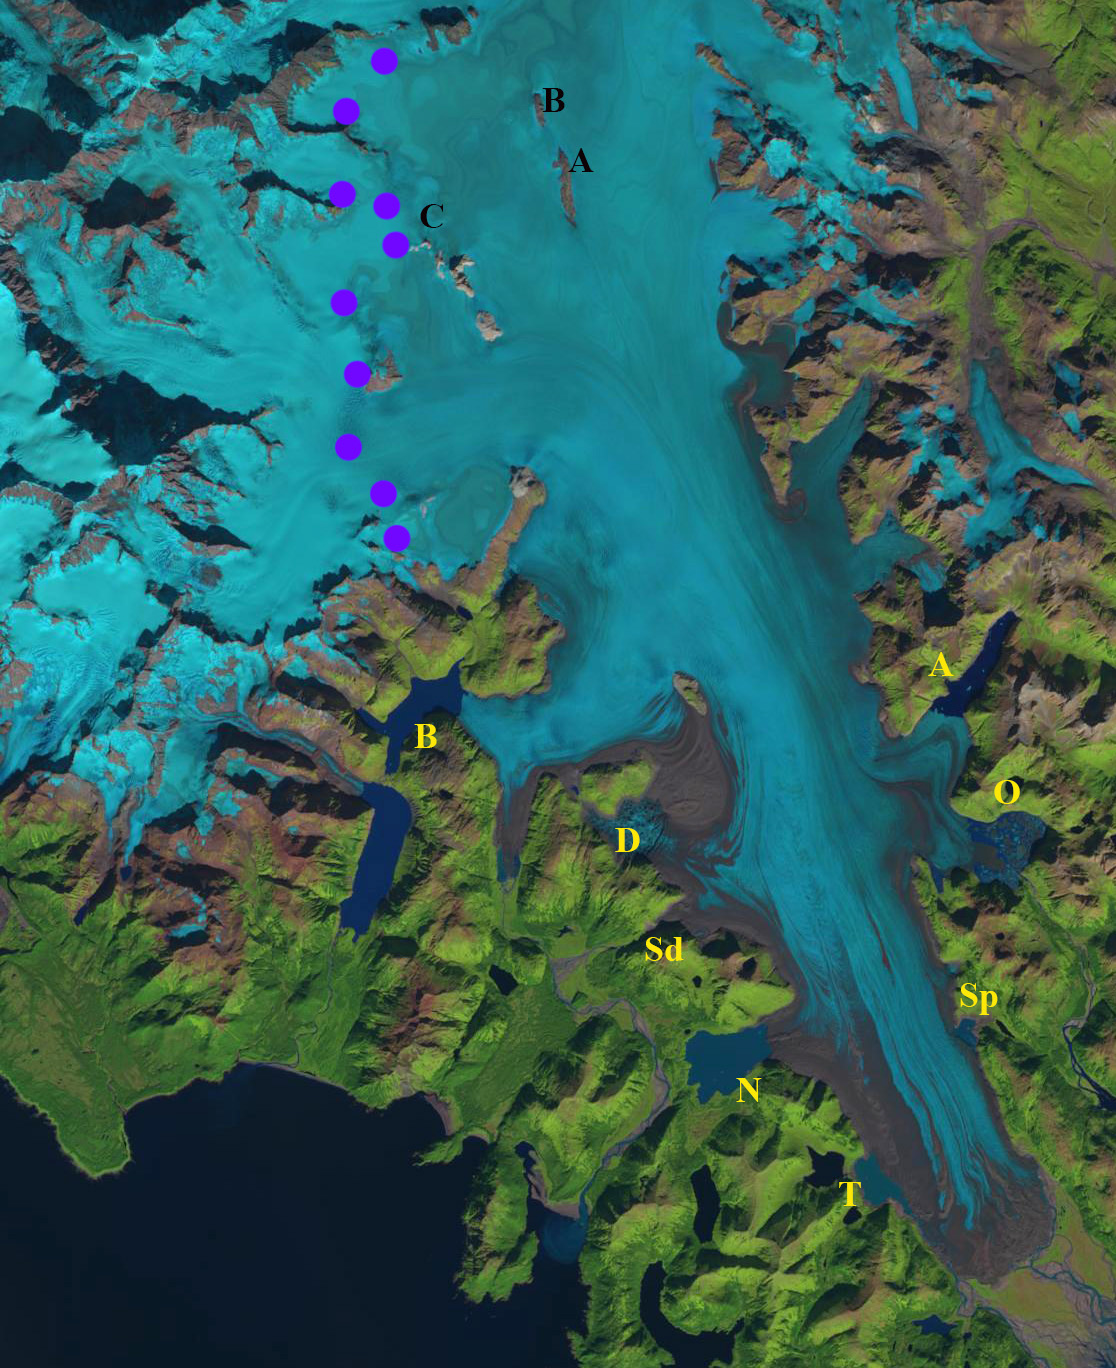
Emergence of Nunataks at Point A, B and C at 850 m on Brady Glacier from 1986 and 2018 Landsat Images.  Transient snowline on 9/21/2018 indicated by purple dots.

Brady Glacier,  is a large Alaskan tidewater glacier, in the Glacier Bay region that is beginning a period of substantial retreat Pelto et al (2013). Pelto et al (2013) noted that the end of season observed transient snowline averaged 725 m from 2003-2011, well above the 600 m that represents the equilibrium snowline elevation, for the glacier to sustain its current size. In 2015, 2016 and 2018 the snowline has been at 900-1000 m.  This is leading to thinning across of what was much of the accumulation zone.  Here we examine Landsat images from 1986 to 2018 to identify signs of this thinning.

In 1986 Point A and B have insignificant rock exposure, while C has a limited single rock nunatak.  By 2000, below there is bedrock exposed west of Point A and B, with two small nunataks near C.  By 2015 there is a 2 km long bedrock ridge at Point A and a ~1 km long bedrock ridge at Point B.  The snowline in 2015 is just above Point B and C at 900 m.  In 2016 on Oct. 1 2016 after the end of the typical melt season the snowline is at 900 m. In 2018 the snowline on Sept. 21 is at 1000 m.  At Point A the bedrock Ridge is now 2300 m long and up to 300 m wide.  At Point A the ridge is 1100 m long.  At Point C a third nunatak has emerged and the series of nunataks will soon merge into a single ridge.

The persistent high snowlines indicate the consistent accumulation zone is now above 900 m, below this point thinning will continue.  The mean elevation of the glacier is at 720 m and thinning is significant below 1000 m from 1995-2011(Johnson et al 2013).  That far less than 50% of the glacier is retaining snowpack and widespread thinning will drive further retreat of the distributary glacier termini in expanding lakes noted by Pelto et al (2013) and a the 2016 blog post.   Brady Glacier abuts the adjacent Lampugh Glacier that has and will be impacted by a large landslide.

Trick Lakes: In 1986 North and South Trick Lake are proglacial lakes in contact with the glacier. By 2016 the two lakes are no longer in contact with the glacier, water levels have fallen and a third lake East Trick Lake has formed. The more recently developed East Trick Lake is the current proglacial Trick Lake, a large glacier river exits this lake and parallels the glacier to the main Brady Glacier terminus, going beneath the glacier for only several hundred meters.

North Deception Lake had a limited area in 1986 with no location more than 500 m long. By 2016 retreat has expanded the lake to a length over 2 km. The width of the glacier margin at North Deception Lake will not change in the short term, but the valley widens 2 km back from the current calving front, thus the lake may grow considerably in the future.

South Dixon Lake This new lake does not have an official name. It did not exist in 1986, 2004, 2007 or 2010. It is nearly circular today and 400 m in diameter.

Dixon Lake: It is likely that retreat toward the main valley of the Brady Glacier will lead to increased water depths at Dixon Lake, observations of depth of this lake do not exist. Retreat from 1986 to 2016 has been 600 m.

Bearhole LakeBearhole Lake is expanding up valley with glacier retreat, and there are no significant changes in the width of the valley that would suggest a significant increase in calving width could occur in the near future. Currently the lake is 75 m deep at the calving front and there has been a 1400 m retreat since 1986 Capps et. al. (2013).

Spur Lake:It is likely that retreat toward the main valley of the Brady Glacier will lead to increased water depths at Spur Lake. the depth has fallen as the surface level fell from 1986-2016 as the margin retreated 600 m, leaving a trimline evident in the 2016 imagery.

Oscar Lake has experienced rapid growth with the collapse of the terminus tongue. Depth measurements indicate much of the calving front which has increased by an order of magnitude since 1986 is over 100 m. The tongue as seen in 2014 Google Earth image will continue to collapse and water depth should increase as well. The central narrow tongue has retreated less than 200 m since 1986, but the majority of the glacier front has retreated more than 1 km since 1986.

Abyss Lake: Continued retreat will lead to calving width expansion> The retreat from 1986 to 2016 has been 400 m. The water depth has been above 150 m at the calving front for sometime and should remain high.

Emergence of Nunataks at Point A, B and C at 850 m on Brady Glacier from 2000 and 2015 Landsat Images.  Transient snowline on 9/21/2018 indicated by purple dots.

Landsat image of Brady Glacier on 9/21/2018 indicating the snowline (purple dots)  and the emerging nunataks at Point A-C. Lakes noted are: A=Abyss, B=Bearhole, D=Dixon, N=North Deception, O=Oscar, Sd=South Dixon, Sp=Spur, T=Trick.

Landsat image of Brady Glacier on 10/1/2016 indicating the snowline (purple dots)  and the emerging nunataks at Point A-C.

Yakutat Glacier Terminus Collapse Nears Completion, 45 km2 lost 2010-2018

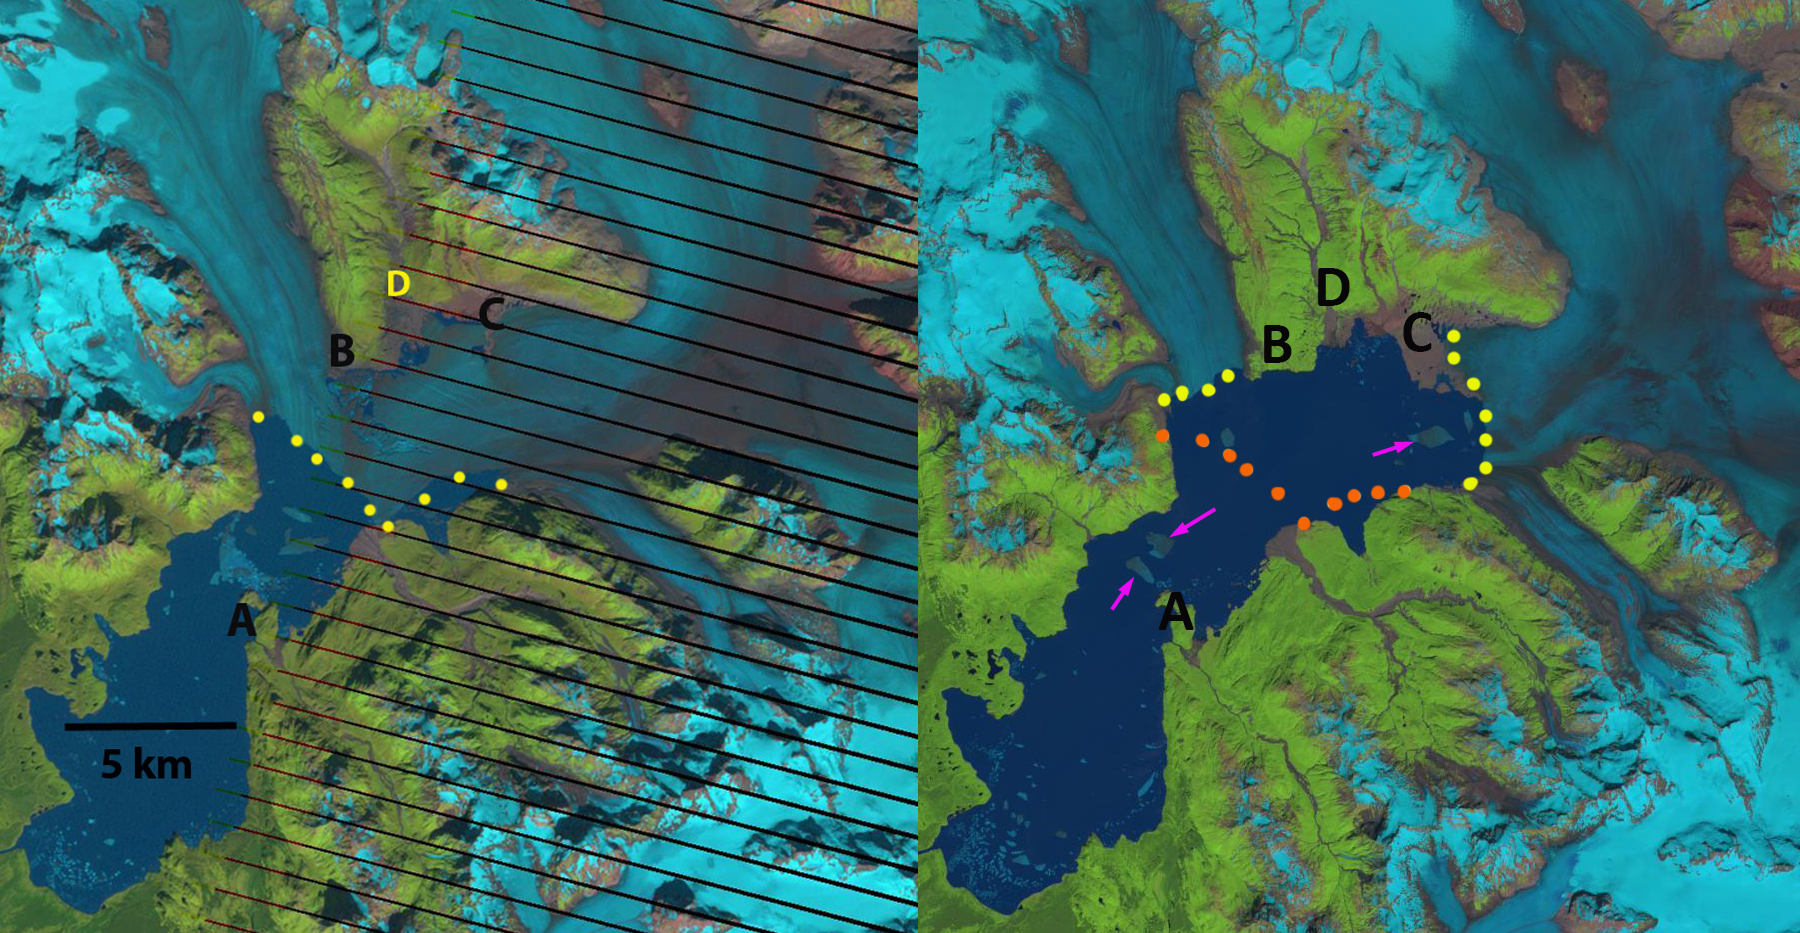
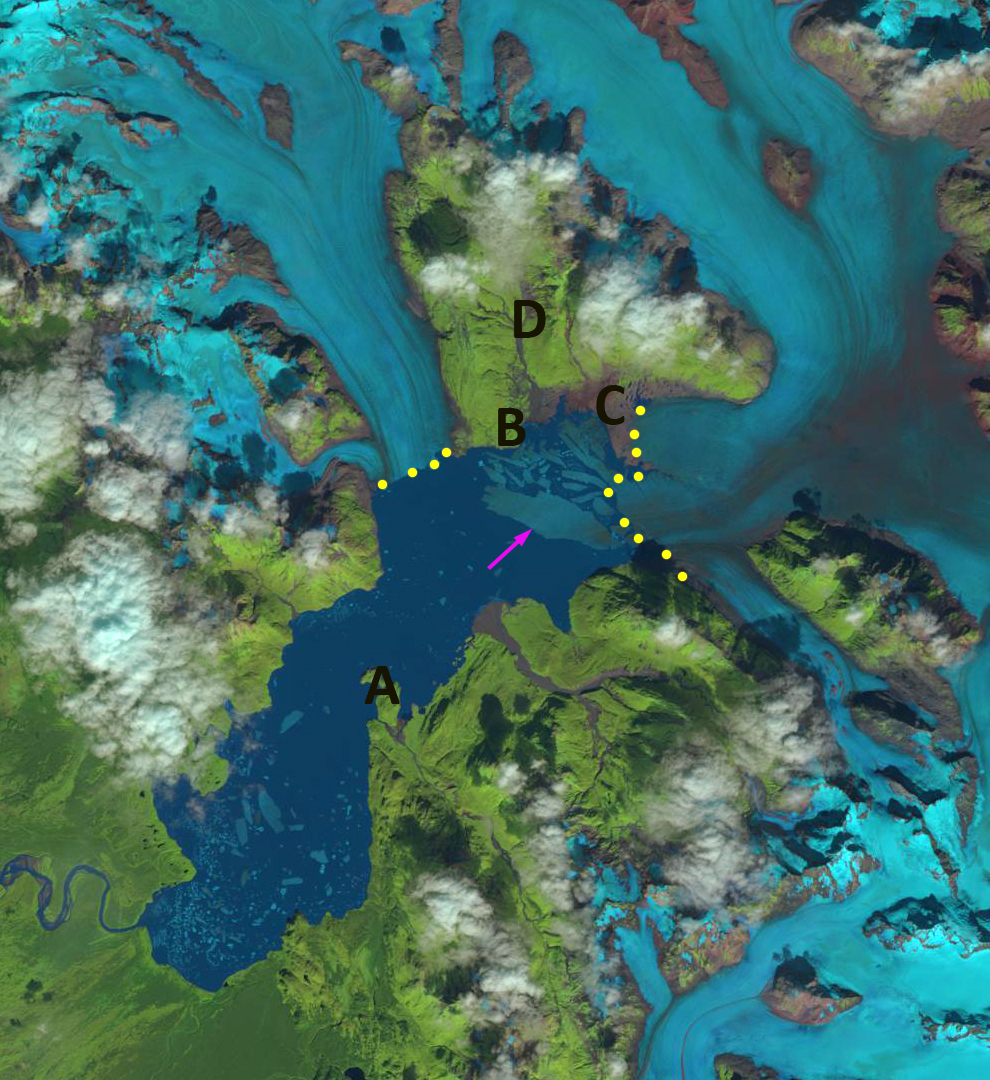
Landsat images from 2010 and 2018 with terminus indicated by yellow dots in both, the orange dots indicate 2010 margin on 2018 image. Point A indicates the 1987 terminus location, pink arrows indicate icebergs. Main terminus now extends south near Point C. Northern terminus extends west from Point B.

Yakutat Glacier, Alaska has experienced a spectacular retreat in the last decade losing 45 km² from 2010-2018.  The Yakutat Glacier during the 1894-1895 Alaskan Boundary Survey ended near a terminal moraine on a flat coastal outwash plain. By 1906 the glacier had retreated from the moraine and a new lake was forming, Harlequin Lake.  From 1906-1948 the glacier retreated an additional 5 km. From 1948-1958 the glacier retreated 3.6 km. Here we examine Landsat imagery to quantify the retreat from 2010-2018. This is an update to a Yakutat Glacier 2016 post

In 2010 the glacier has just retreated from the peninsula at Point A, the valley at D was deglaciated, a small strip of bedrock-sediment was exposed at C from that had been beneath the glacier, and B was still well inland of the terminus. An aerial image of the glacier indicates significant rifting, blue arrows,  in 2010 that leads to the substantial 2013 breakup.  Rifts are not just crevasses, as they typically extend to the base of the glacier along part of the glacier.  They typically form in areas of a glacier that are near flotation.  In this case an area that has thinned until approximate flotation (Benn, Warren ann Mottram, 2007). In 2013 there is a large area of icebergs and melange in front of the terminus, yellow dots. By 2013 the northern arm of the glacier had retreated 6.4 km from the peninsula at A toward the peninsula at B. The central arm of the glacier toward C had retreated 7.5 km and the retreat on the southern edge of the glacier was 6.5 km.  In 2015 the snowline is quite high at 2200 m, leaving very little of the glacier in the accumulation zone. In 2015 a large iceberg detached pink arrow, that is 5 km by ~1 km. In 2016 the snowline is again around 2200 m. From 2013 to 2016 the glacier retreated from Point B to Point C on the northern side and to Point E on the southern side this is a distance of 10.2 km in thirty years since 1987 or 340 m/year. In 2016 the Peninsula extending across the lake from Point C is 2.5 km long. The terminus is resting on this and adjacent shoals across 50% of its width.  The iceberg has diminished to 2.5 km long and 700 m wide, pink arrow.  The northern terminus extending west from Point B has changed little from 2013-2016. The 2018 image compares the 2010 position (yellow dots) with 2018 (orange dots), indicating an area of 45 km² lost.  The main terminus retreated 7 km. There are some small icebergs in 2018.  The ability to produce icebergs as large as in 2015 has been lost as the calving front has been restricted by the Peninsula which is now 3 km long, leaving less than a 3 km wide calving front.   The narrower calving front and reduced water depth should in the short term reduce retreat. The northern terminus near Point B has experienced limited retreat since 2013.

The glacier has thinned by more 200 m on average according to the preliminary thickness change maps from a U. Alaska-Fairbanks project (Truessel et al 2013) and updated by Truessel et al (2015). The Yakutat Glacier does not have a high accumulation zone and the recent increase in the snowline elevation and thinning of the glacier have led to a substantial shrinking of the accumulation zone and thinning of the glacier in the accumulation (Truessel et al 2013). This glacier does not have a persistent significant accumulation zone in 2015, 2016 and 2018 and cannot survive (Pelto, 2010).  Truessel et al (2015) modelling indicates a reduced rate of retreat from 2020-2030, which supports the expected reduced calving.  Their model also indicates the glacier will disappear between 2070 and 2110 depending on the warming scenario.  For a calving glacier to be in equilibrium it needs to have more than 60 % of its area snowcovered at the end of the summer, this was not achieved in 2015, 2016 or 2018.. The glacier is in the midst of a large ongoing retreat. The retreat rate and calving mechanism is similar to that of Grand Plateau GlacierAlsek Glacier and Gilkey Glacier. However, unlike these Yakutat Glacier lacks an accumulation zone, a better analog is East Novatak Glacier, which also has a lower elevation accumulation zone.

2010 image of the Yakutat Glacier terminus reach with blue arrows indicating rifts.

Landsat images from 2013 with terminus indicated by yellow dots. Point A indicates the 1987 terminus location. Note large area of melange and icebergs.

Landsat images from 2015 with terminus indicated by yellow dots. Point A indicates the 1987 terminus location.  Main terminus now extends south near Point C. Northern terminus extends west from Point B. Note large iceberg that calved in 2015, pink arrow.

Landsat images from 2016 with terminus indicated by yellow dots. Point A indicates the 1987 terminus location. Main terminus now extends south near Point C. Northern terminus extends west from Point B.Note large iceberg that calved in 2015, pink arrow.

Cordova Glacier, Alaska Loses a Lake & a Tributary

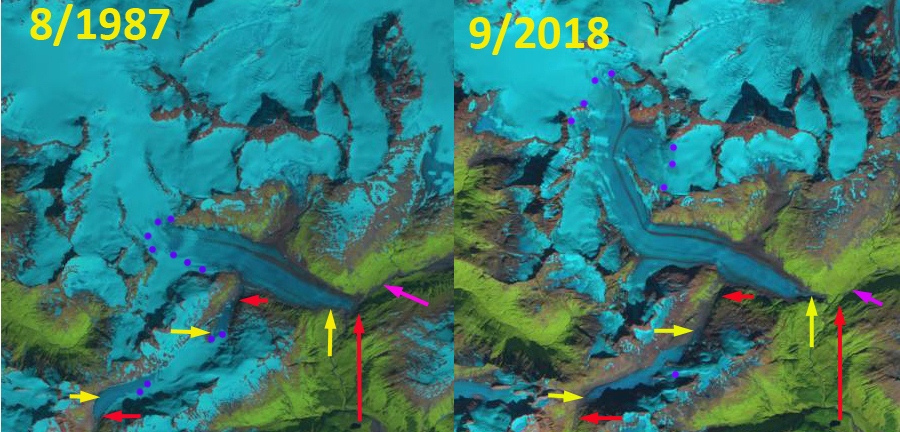
Cordova Glacier retreat and glacier separation revealed by Landsat images from 1987 and 2018, red arrow is the 1987 terminus position of main glacier and tributaries, yellow arrow is the 2018 terminus location.  Purple dots indicate the snowline and the pink arrow the former location of Rude Lake. 

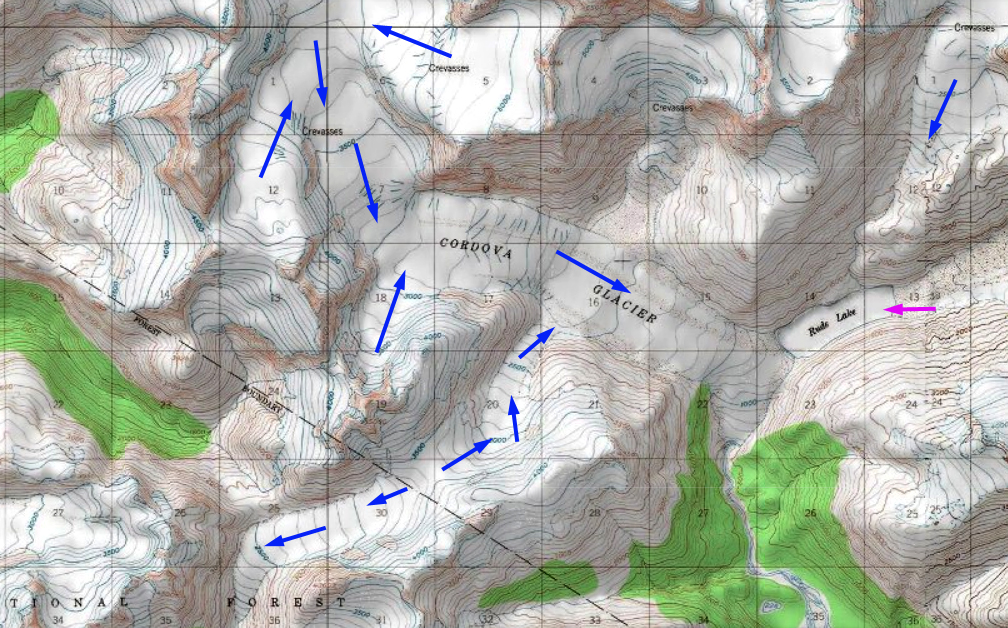
Cordova Glacier is located at the head of the western fork of the Rude River in the Chugach Mountains, Alaska. In USGS maps the glacier dams Rude Lake which is ~1.5 km long and 0.5 wide (see below).  Molnia (2008) noted the lake was gone in 2008 and the former bed was covered by vegetation indicating the lake had not recently drained for the last time. Here we examine changes in the glacier from 1987-2018 using Landsat imagery.

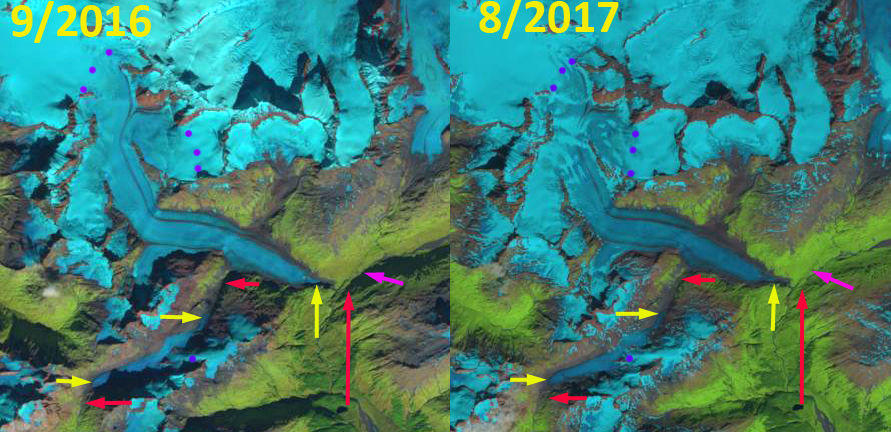
In the USGS map of the region from the 1950’s, Rude Lake is dammed by the terminus of Cordova Glacier, pink arrow.  There is a significant tributary entering from the southwest a short distance above the terminus. By 1987  Rude Lake has drained and much of the lake bottom has been occupied by vegetation.  The terminus does still extend to the bottom of the West Branch Rude River Valley. The tributary entering from the southwest has detached from Cordova Glacier.  The snowline is at 950 m in August 1987. In 9/2016 and 8/2017 the transient snowline is at 1400 m and 1350 m respectively. The former southwest tributary like the main glacier has limited retained snowcover that cannot maintain the glacier at it current size. In early September 2018 the snowline on Cordova Glacier is again at 1400 m.  The main terminus has retreated 800 m since 1987.  The southwest tributary has both a western and eastern terminus that have retreated 1100 m and 500 m respectively.  The total length of the southwest tributary declined from 6.1 km to 4.1 km in length the entire valley reach of the glacier has lost snowpack in 2016-2018.  That heralds that this section of the glacier will melt away.

The retreat of this glacier is less significant than many glaciers in the region including Alsek Glacier and Shoup Glacier.  The high snowline in 2018 indicative of high ablation, which was also noted on Lowell Glacier.

Alaska Topographic Map of Cordova Glacier indicating Rude Lake, pink arrow. 

Cordova Glacier terminus position and snowline revealed by Landsat images from 2016 and 2017, red arrow is the 1987 terminus position of main glacier and tributaries, yellow arrow is the 2018 terminus location.  Purple dots indicate the snowline and the pink arrow the former location of Rude Lake. 


Glaciers Abandon Farragut River Valley, Alaska

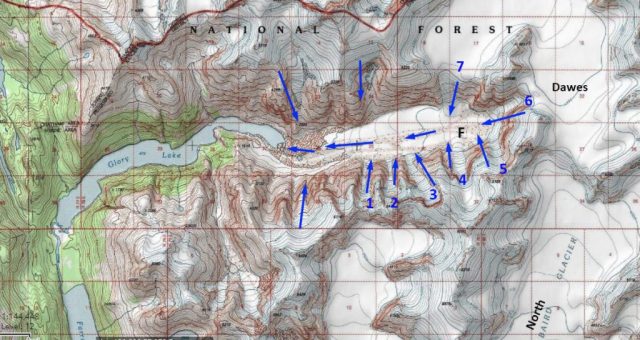
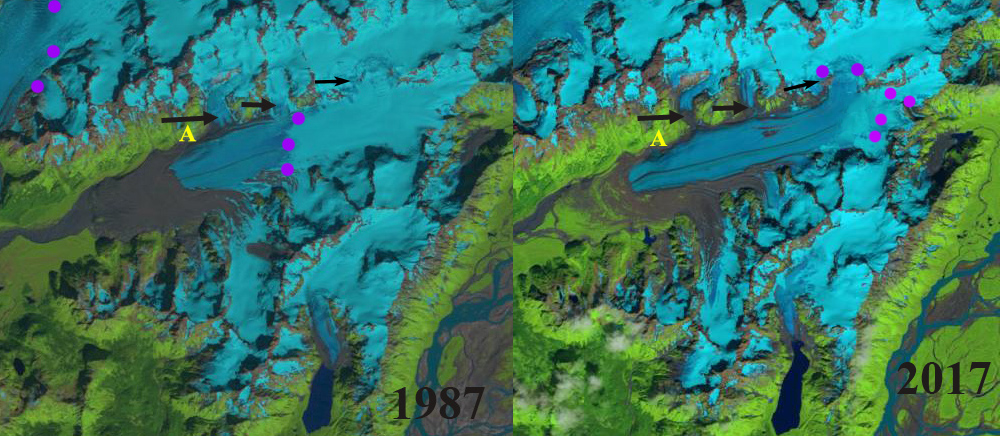
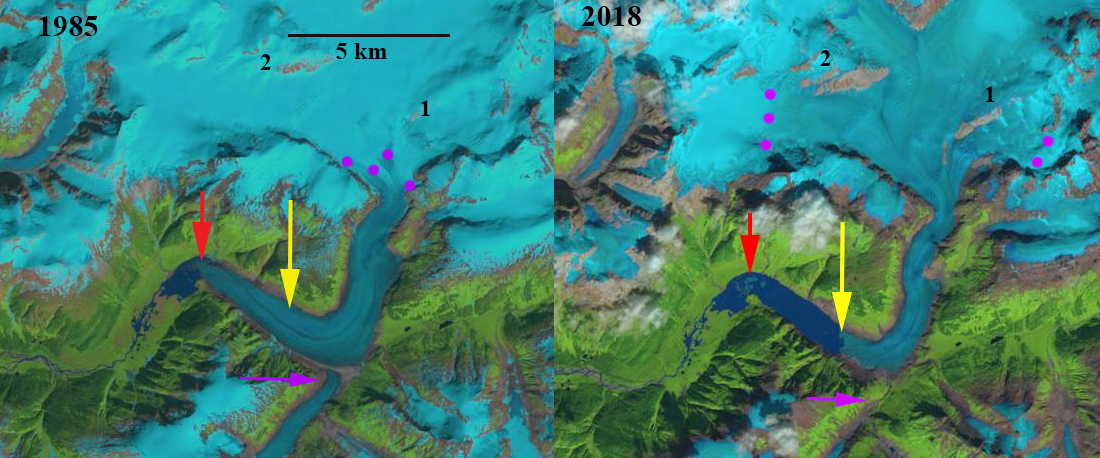
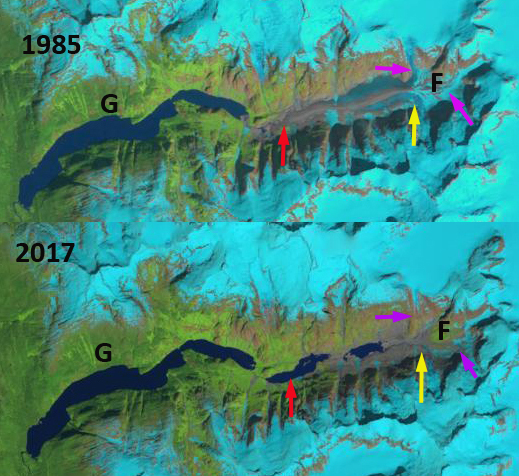
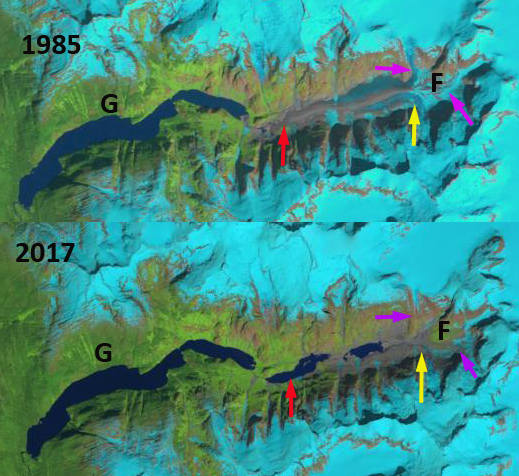
The Farragut Glacier  (F) in Landsat images in 1985 and 2017.  The red arrow indicates the 1985 terminus location, the yellow arrow the 2017 terminus location and the purple arrow, two tributaries in 1985 that now no longer connect to the former valley glacier. The glacier now terminates well short of Glory Lake (G) and two new lakes have formed. 

The Farragut River drains into Frederick Sound in Southeast Alaska.  The headwaters of this river in 1985 was a valley glacier, Farragut Glacier, fed by seven glaciers descending from peaks on the south wall of the valley or flowing down from the Stikine Icefield. The river is known for significant Pink and chinook salmon runs as well.  This valley is just to the north of Baird Glacier that has begun to retreat.

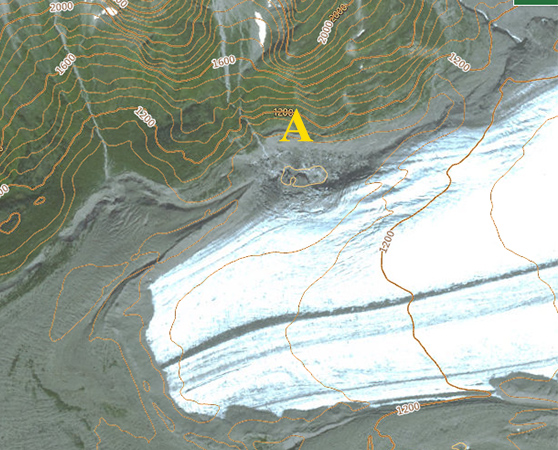
In the USGS map from 1975 there are seven glaciers that drain into the valley bottom contributing to the Farragut Glacier, see map below. The glacier at this time terminated in Glory Lake.  By 1985 the glacier had retreated 1.2 km from Glory Lake and was 7.2 km long. There was a medial moraine that had expanded in width and height indicating the glacier tongue was thinning rapidly. The overflow tributaries from Dawes and North Baird Glacier, purple arrows, still connected to the valley glacier.  By 1993 thinning and retreat had led to formation of a new lake.  The overflow tributaries from Dawes and North Baird Glacier no longer reach Farragut Glacier.  By 2016 vegetation there are two new lakes where the Farragut Glacier used to be.  New vegetation has developed where the tributary from Dawes and North Baird Glacier formerly joined the Farragut Glacier.  By 2017 there is only a single tributary that contributes to the Farragut Glacier, which occupies only a small segment of the valley floor.  The distance from this tributary to the terminus is 3.1 km.  The glacier has lost most of its length, six of its former glacier connections and two lakes have developed in 32 years of retreat and thinning.  The Farragut River valley has largely been abandoned by glaciers in the last three decades. The thinning and retreat is larger here than at Baird Glacier and Patterson Glacier

The Farragut Glacier  (F) in Landsat images in 1993 and 2016.  The red arrow indicates the 1985 terminus location, the yellow arrow the 2017 terminus location and the purple arrow, two tributaries in 1985 that now no longer connect to the former valley glacier.

USGS map indicating the seven glaciers that connect to make the Farragut Glacier in 1948.

Google Earth Image indicating the two lakes and the one tributary that reaches the Farragut River valley floor. 

Sherman Glacier, Alaska Diminishing Protective Blanket=Mass Loss

Sherman Glacier, Alaska in Landsat images from 1987 and 2017.  Black arrows indicate tributaries on north side. Purple dots indicate the snowline. Point A indicates a depression formed from lateral recession. Also notice how the debris cover has with glacier flow been shifted downglacier. 

Sherman Glacier is in the Chugach Mountains of southern Alaska and is famous for the large landslide triggered by the magnitude 9.0 Good Friday earthquake in 1964 that spread across a substantial portion of the glacier below 450 m. This debris insulated the ablation zone of the glacier from melting leading to a glacier advance.  The landslide average 1.6 m in thickness and covered 8.25 km2 (McSaveney, 1978).  Marangunic (1972) notes the glacier was retreating 25 m/year and thinning by 2 m/year prior to the landslide. By 1966 he notes the glacier had begun to advance.  This advance continued up to 2009 (Reznichenko et al (2010).    Here we utilize Landsat imagery to indicate the changes from 1987 to 2017 on Sherman Glacier.

The terminus of Sherman Glacier remains buried by a portion of the landslide debris and its position change at present is hard to discern, upglacier the changes are striking.  In 1987 their are three tributaries entering the glacier from the north.  The snowline is at 450 m.  The glacier at Point A extends the the valley wall.  In 1999 the three north side tributaries are still connected and the glacier extends to the valley wall at Point A.  The snowline is at 600 m.  In 2015 the snowline is at 850 m with only 30% of the glacier in the accumulation zone.  At Point A a circular depression has formed as the glacier has receded from the valley wall.  In 2016 the snolwine is again at 850 m.  The lowest tributary on the north side has detached from the main glacier.  The middle tributary has lost most of its connection.  The highest tributary is now connected across just half of its former width with a bedrock rib extending across the other half.  In 2017 the snowline is at 725 m with a month left in the melt season.  This sequence of years of high snowlines is indicative of what is causing the detachment of tributaries.  The glacier is thinning significantly up to at least 800 m in elevation.  This represents a mass loss across most of the glacier, which is leading to retreat of tributaries and marginal retreat in much of the ablation zone.  The lateral recesssion at Point A since 1987 is 250 m.  This volume loss belies the minor recent terminus retreat of the debris buried terminus. This glacier due to the landslide has not retreated as much as its neighboring glaciers such as Valdez Glacier.

Sherman Glacier, Alaska in Landsat images from 1999, 2015 and 2016.  Black arrows indicate tributaries on north side. Purple dots indicate the snowline. Point A indicates a depression formed from lateral recession.

Sherman Glacier in the National Map viewer, indicating depression below Point A and lateral recession.


Sherman Glacier tributary detachment, 275 m of retreat from main glacier in the National Map Viewer image from several years ago. 

Figure 12 from (Reznichenko et al (2010)  The rock avalanche caused by the 1964 Great Alaska Earthquake covered part of the ablation zone of Sherman Glacier. (a) The rock-avalanche cover after its emplacement in 1967. (b) The rock avalanche reached the terminus of the glacier in 2008 (pictures from Mauri McSaveney).

Popof Glacier Retreat, Alaska Features Tributary Separation

Popof Glacier comparison in 1986 and 2016 Landsat images. Red arrow is the 1986 terminus location, yellow arrows the 2016 terminus location, pink arrows indicate two key tributaries and purple dots indicate the snowline.

Popof Glacier is at the southern end of the Stiking Icefield in southeast Alaska.  In 1948 the glacier had two terminus sections  that separated around Mount Basargin and then rejoined.  By 1979 the glacier termini were separated (Molnia, 2008).  Here we examine Landsat imagery from 1986-2016 to identify changes in the glacier.

In 1986 both glacier termini were located at the far end of a basin, with no proglacial lakes in existence.  The  termini were separated from each other by 400 m after nearly wrapping all the way around Mount Barsargin. The first tributary to join main glacier from both the west and east were connected to the main glacier, pink arrows.  The snowline in 1986 was at 800 m.  By 1999 the northern terminus tongue had disintegrated extending only a few hundred meters from the main glacier and forming a new lake.  A fringing proglacial lake had developed at the main or southern terminus. The snowline was at 750-800 m.  The first  tributaries entering from east and west still reach the main glacier.  In 2015 the snowline is nearly at the summit of the glacier at 925 m. The main terminus has retreated from the proglacial lake that formed in the 1990’s. The first  tributaries entering from east and west no longer reach the main glacier.  In 2016 the snowline is  at 950 m, even higher than in 2015, with less than 5% of the glacier retaining snowcover.  The main terminus has retreated 700 m from 1986 to 2016 and the northern terminus 1.7 km from 1986-2016.  The retreat is less spectacular than the nearby Shakes Glacier and Great Glacier, though both of those glaciers have retained a substantial accumulation zone.  The Popof Glacier cannot survive with snowlines as high as those seen in 2015 and 2016.

Popof Glacier comparison in 1999 and 2015 Landsat images. Red arrow is the 1986 terminus location, yellow arrows the 2016 terminus location, pink arrows indicate two key tributaries and purple dots indicate the snowline.

Popof Glacier in 1979 USGS map of the region, indicating flow directions.