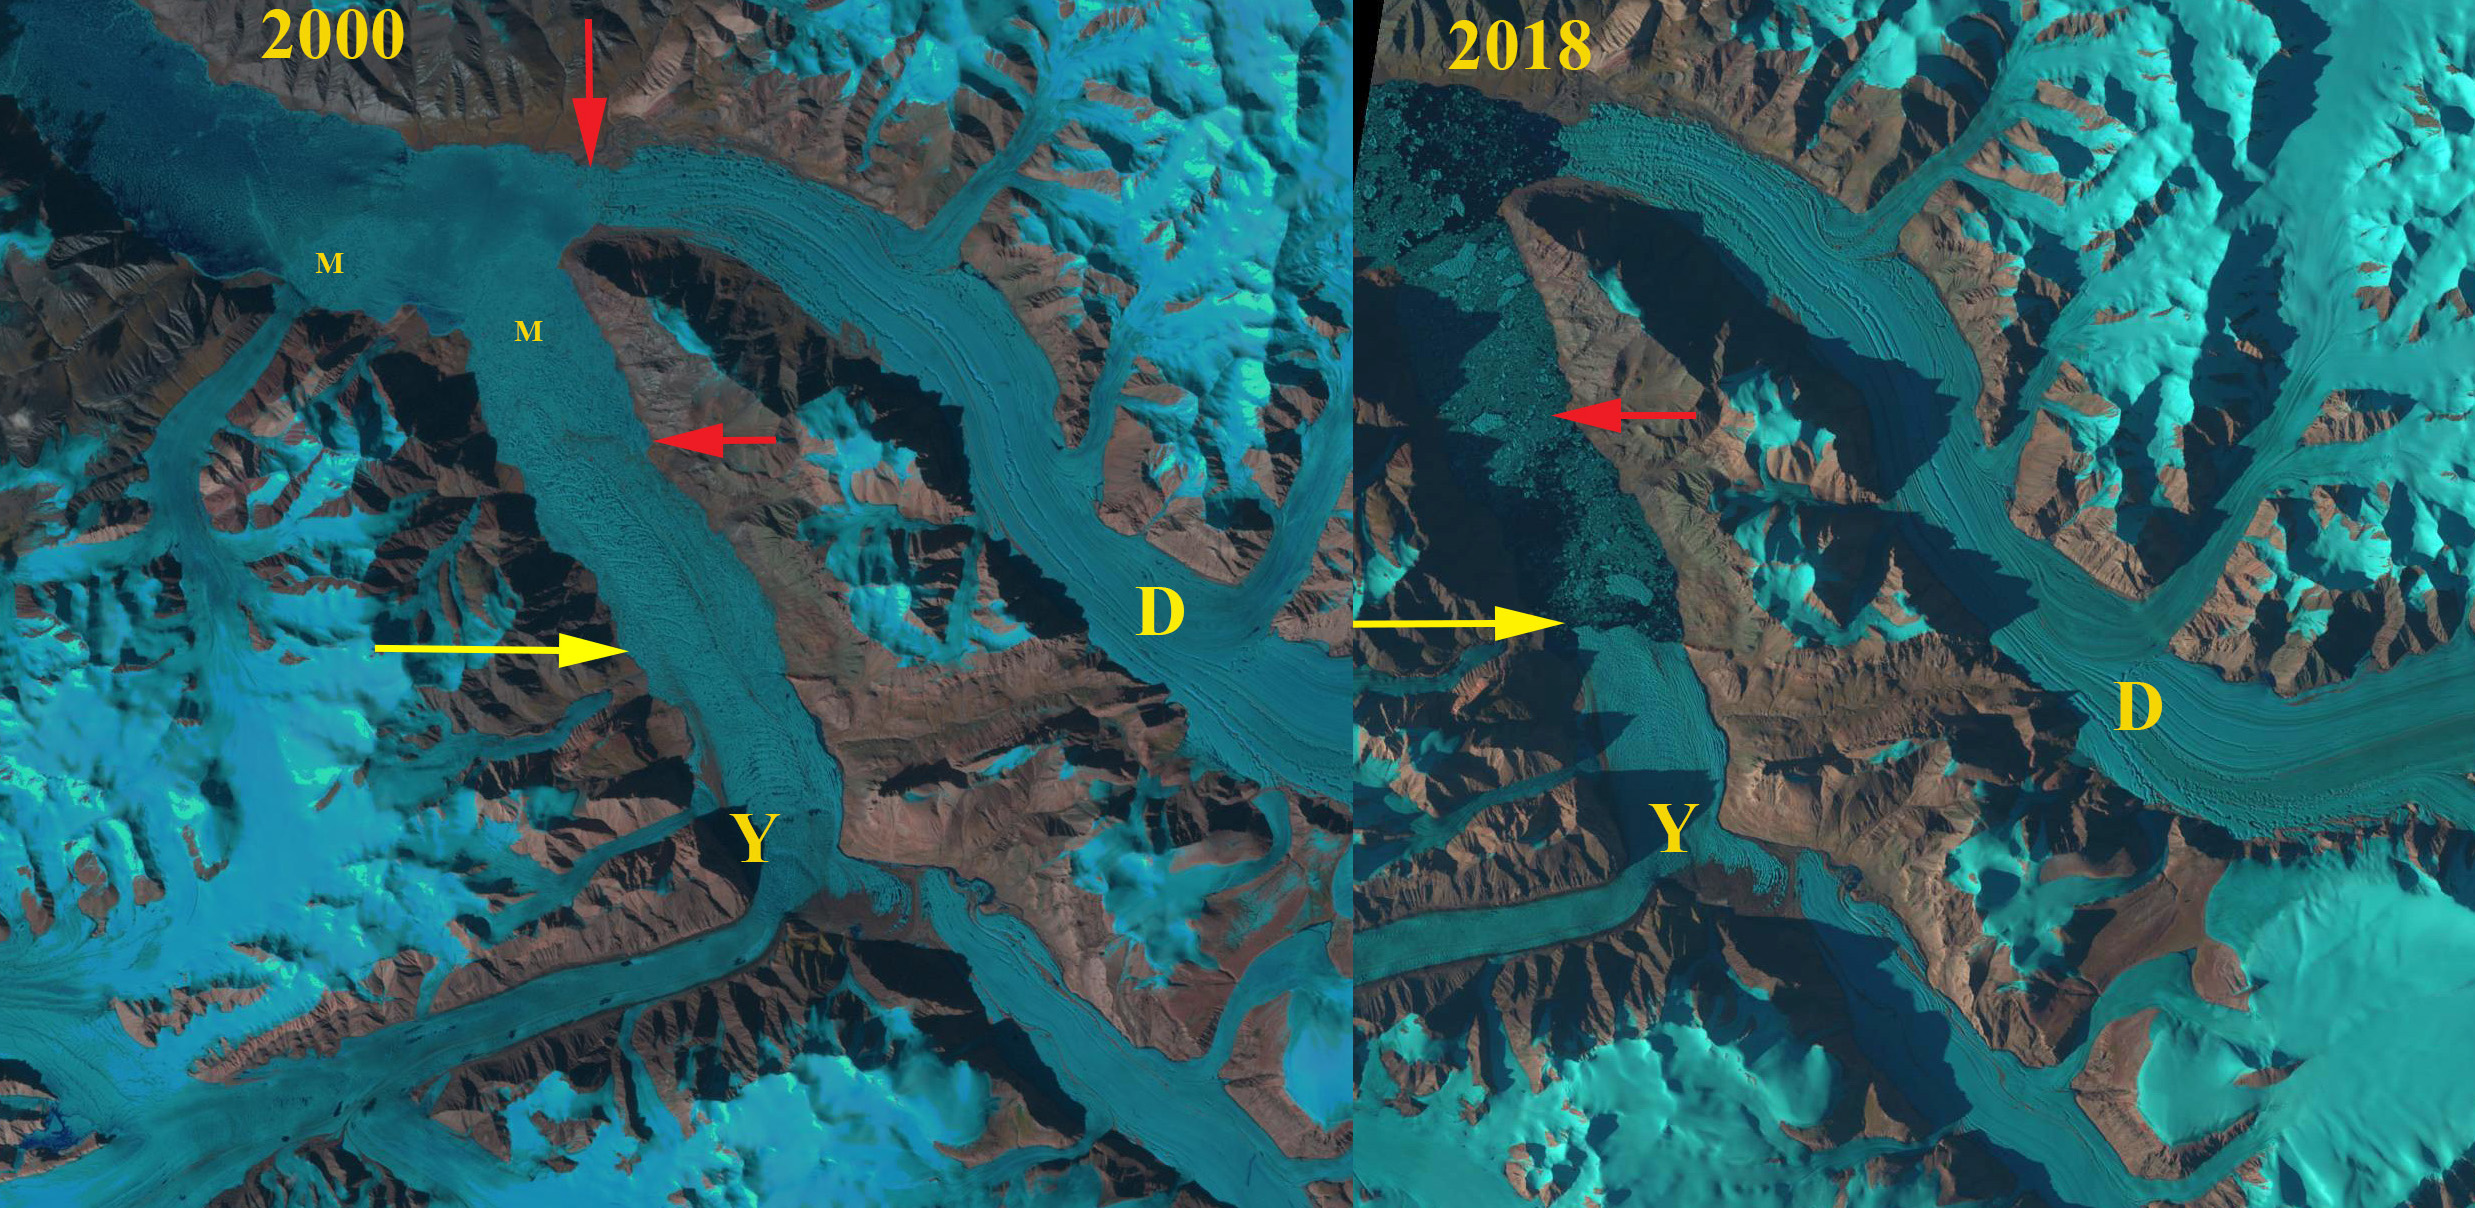
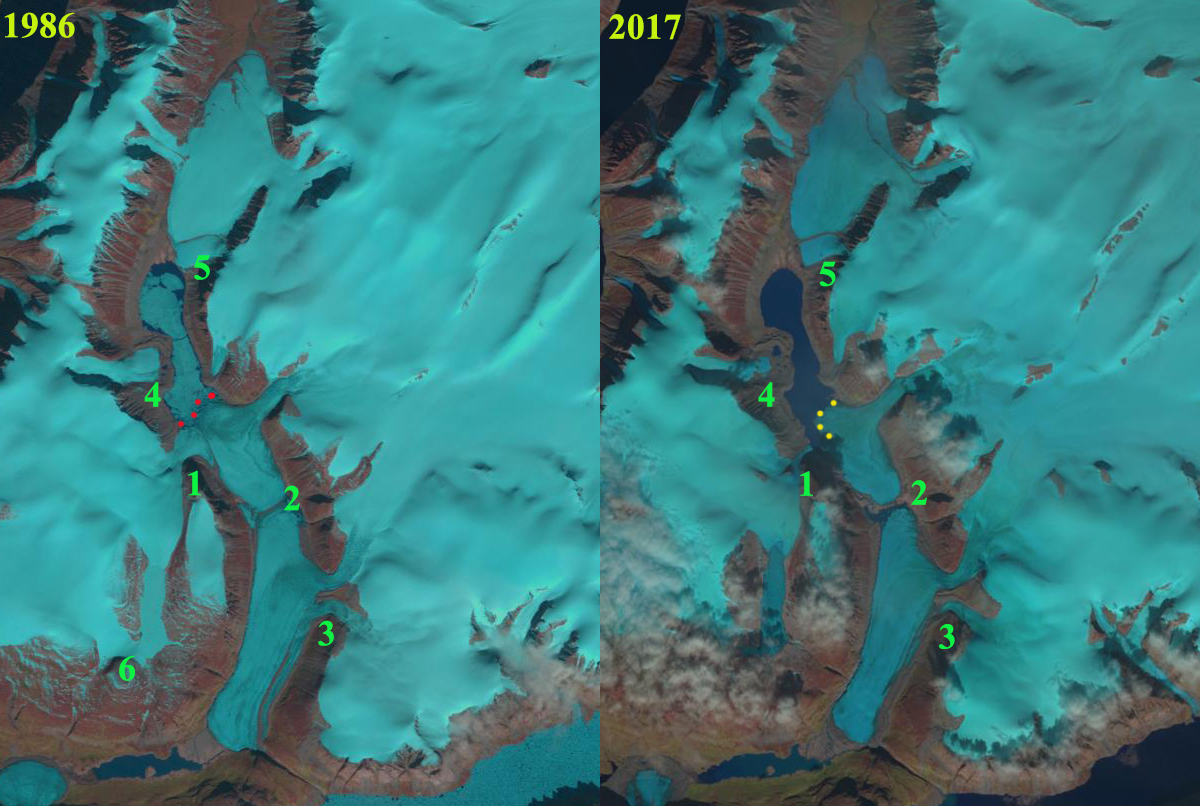
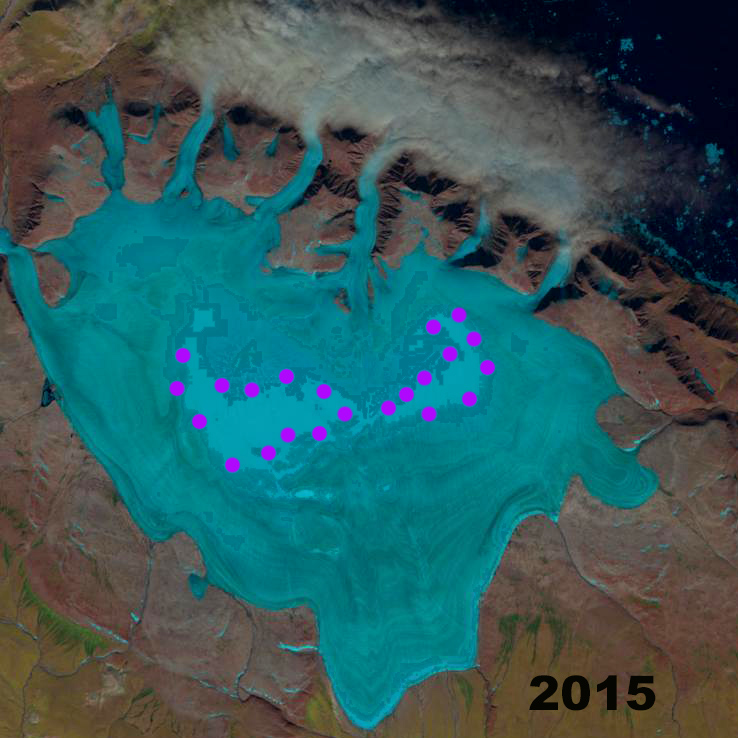
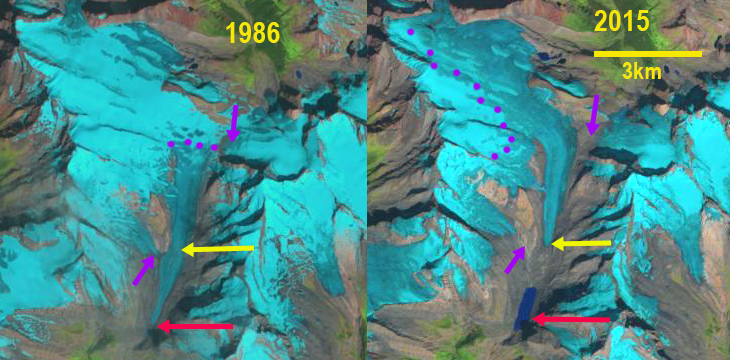
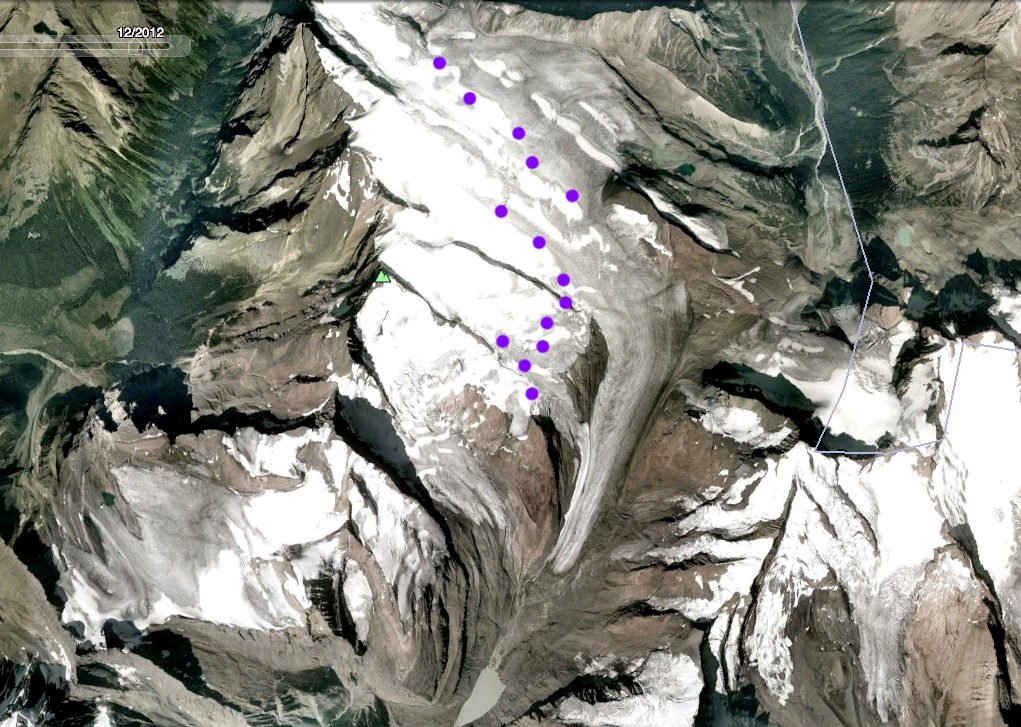
The Northwest (NW) and Northnorthwest (NNW) outlet of the Penny Ice Cap in 1991 and 2019 Landsat images. Red arrow indicates the 1991 terminus location. Point 1 is a large proglacial, Point 2-4 are areas of emerging and expanding bedrock amidst the ice cap.
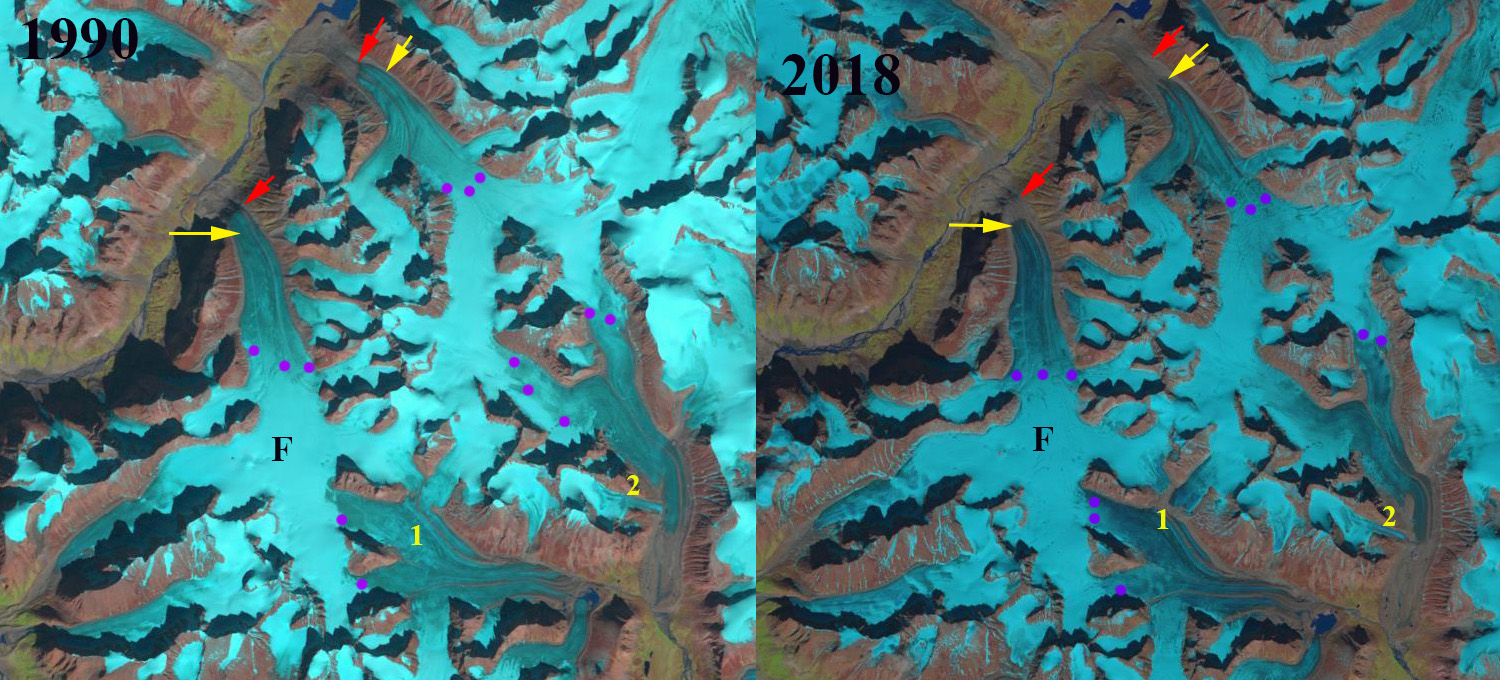
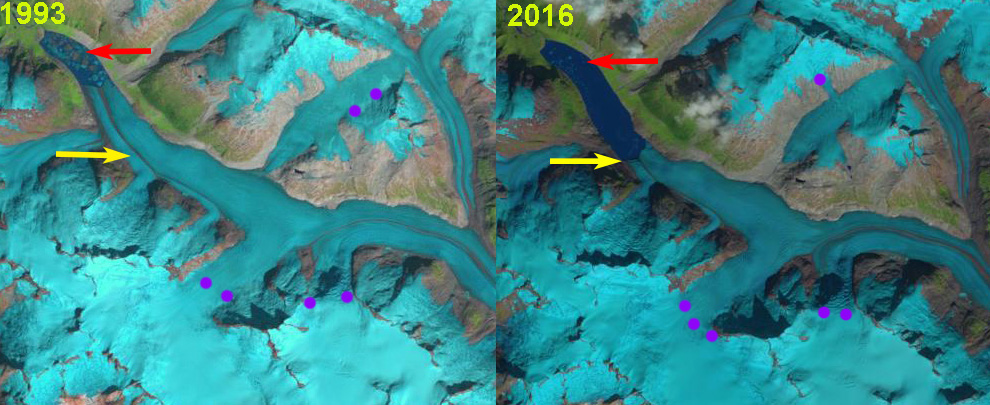
The two largest outlet glaciers of the NW quadrant of the Penny Ice Cap feed the Isurtuq River. In 1991 both outlet glaciers terminated at 600 m. Schaffer et al. (2017) noted a substantial reduction in velocity of the six largest outlet glaciers of the Penny Ice Cap from 1985-2011, 12% per decade. This is driven by mass balance losses, which drive thinning and retreat as well. Here we examine the changes from 1991-2019 of the Northwest (NW) and Northnorthwest (NNW) outlet of the Penny Ice Cap. The summer of 2019 is shaping up to feature substantial mass balance losses.
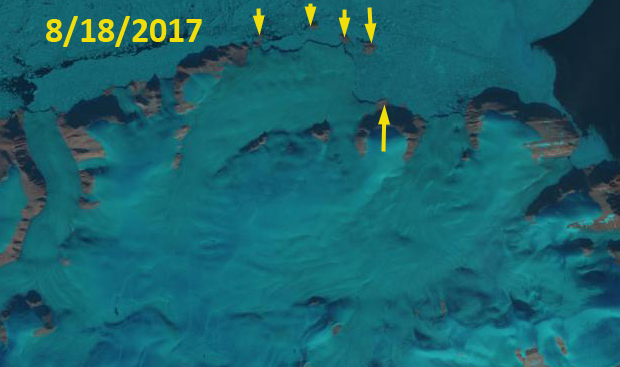
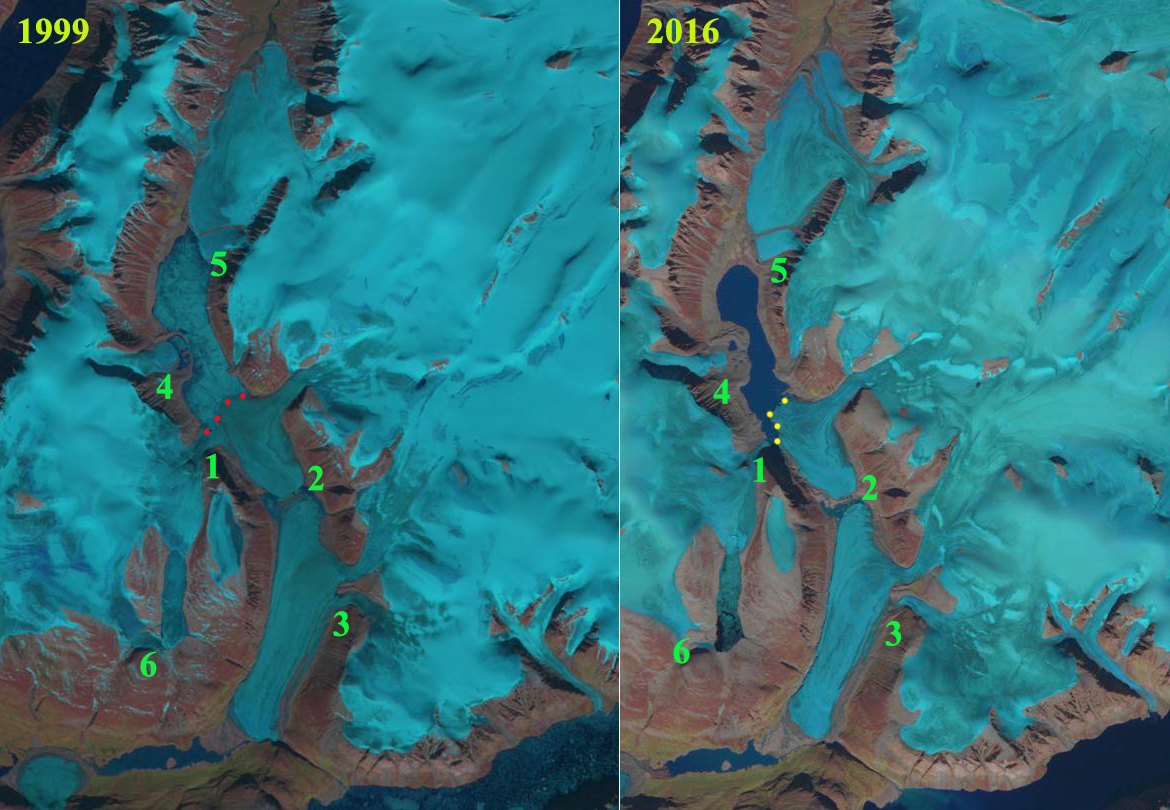
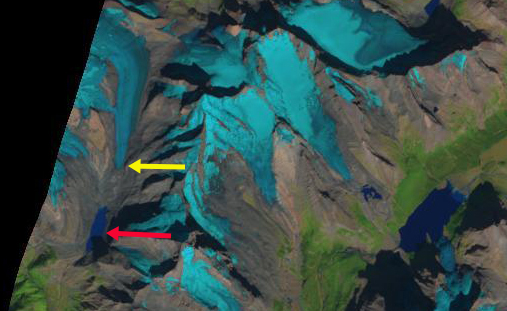
In the 1991 Landsat image the NW outlet reaches the Isurtuq River. The large 7 km2 proglacial lake #1 is impounded by the glacier, it is mostly covered by lake ice in this image. At Point #3 there is no bedrock that has emerged. The NNW outlet terminates 1 km south of the Isurtuq River, upglacier Point #2 is a single bedrock outcrop and Point #4 is barely evident. In 2000 the NW outlet has receded from the river, the proglacial lake is still 7 km2 and Point #3 has no evident bedrock. The NNW outlet has receded 100-200 m and bedrock at Point #2 and 4 are more evident. In 2016 the proglacial lake has diminished and now is several small lakes. At Point 3 bedrock is evident. At Point #2 there are two areas of bedrock covering 0.25 km2. The snowline in 2016 is above this portion of the icecap. In 2019 the NW outlet has retreated 500 m, proglacial lake #1 has three separate parts that total less than 2 km2. Bedrock at Point #2-4 has expanded significantly indicating ice cap thinning. On June 30 2019 the snowline is already above this section of the ice cap, +1100 m with two months of melting to come. Point #2 has an exposed bedrock area of 0.8 km2. Look for a merging of the bedrock at Point 2 and further expansion at 3 and 4. The high snowline at +1100 m, for this early in the summer was also observed at Fork Beard Glacier just east of Penny Ice Cap and is due to very warm temperatures in June in the region.
Way (2015) noted that the Grinnell Ice Cap also on Baffin Island, has lost 18% of its area from 1974 to 2013 and that the rate of loss has greatly accelerated due so summer warming. Grinnell Ice Cap also has seen a loss of snowpack even at its crest.

The Northwest and Northnorthwest outlet of the Penny Ice Cap in 2000 and 2016 Landsat images. Red arrow indicates the 1991 terminus location. Point 1 is a large proglacial, Point 2-4 are areas of emerging and expanding bedrock amidst the ice cap.

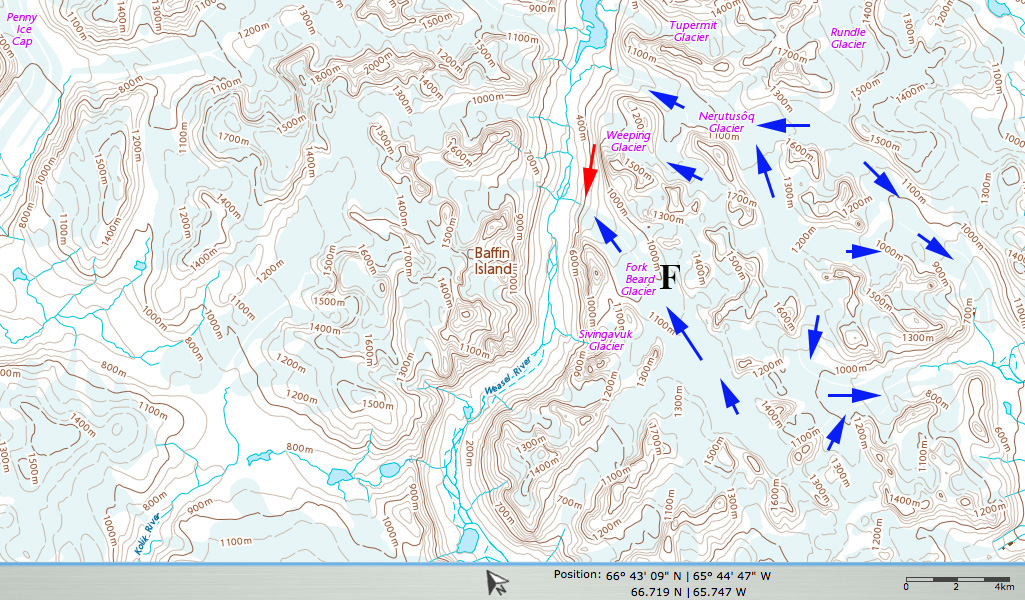
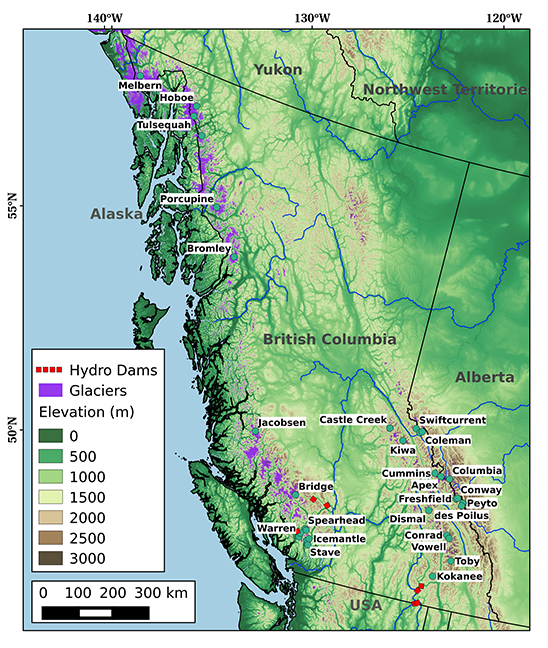
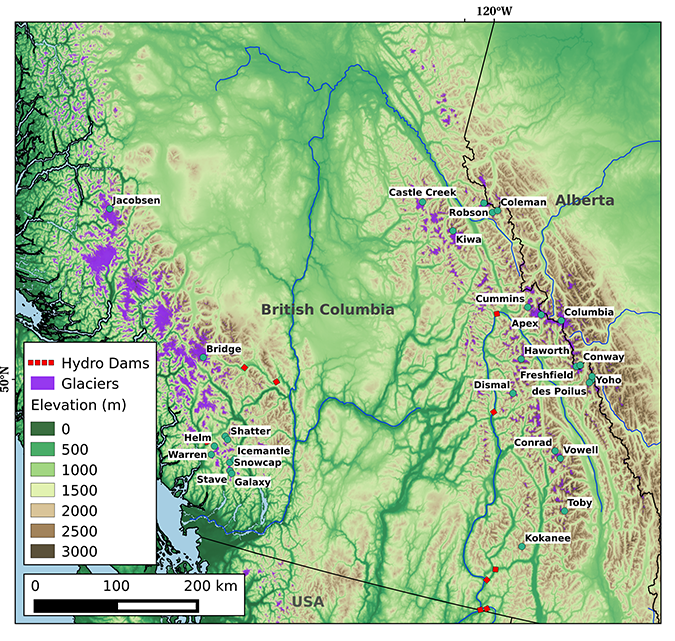
Map of the region