Snow Deficit on Grinnell Ice Cap, Baffin Island, Canada

The Grinnell Ice Cap Is located on the Terra Incognita Peninsula on Baffin Island. The name suggests the reality that this is a not often visited or studied region. Two recent studies have changed our level of knowledge. Way (2015) notes that the ice cap has lost 18% of its area from 1974 to 2013 and that the rate of loss has greatly accelarated and is due to summer warming, declining from 134 km2 in 1973-1975 imagery to 110 square kilometers in 2010-2013 images. Papasodoro et al (2015) report the area in 2014 at 107 km2 with a maximum of elevation of close to 800 m. The location on a peninsula on the southern part of the island leads to higher precipitation and cool summer temperatures allowing fairly low elevation ice caps to have formed and persisted. Way (2015) in the figure below indicates the cool summer temperatures have warmed more than 1 C after 1990. Recent satellite imagery of snowcover and ICESat elevation mapping suggest little snow is being retained on the Grinnell Ice Cap since 2004. Papasodoro et al (2015) identify a longer mass loss rate of -0.37 meters per year from 1952-2014, not exceptionally different from many alpine glaciers. They further observed that from 2004-2014 this rate has accelerated to over -1 meter per year, including a thinning rate above 1.5 meters along the crest of ice cap. This can only be generated by net melting not ice dynamics. Further such rapid losses will prevent retaining even superimposed ice. Here we examine Landsat imagery from 1994 to 2014 to illustrate glacier response.

grinnell ice cap ge
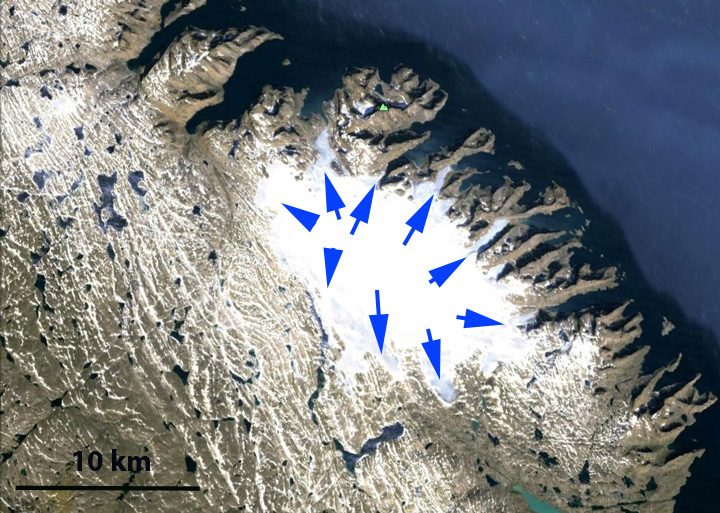
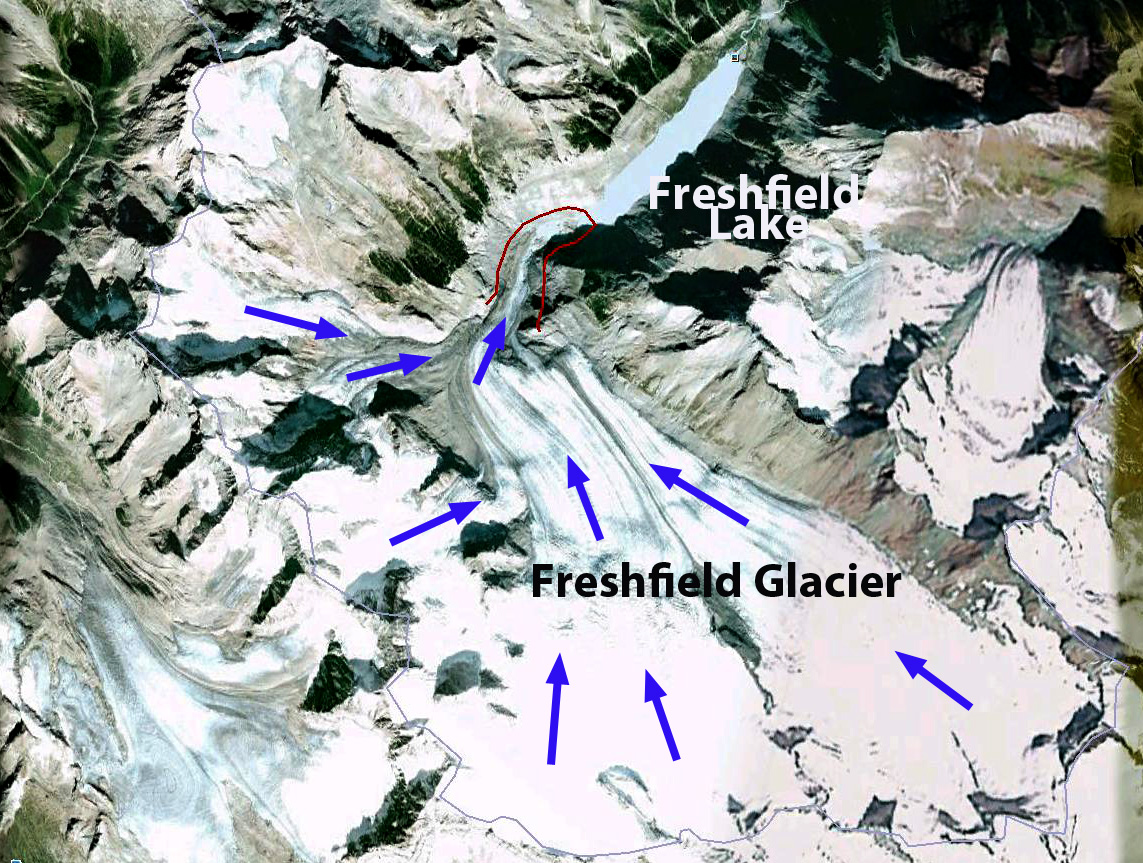
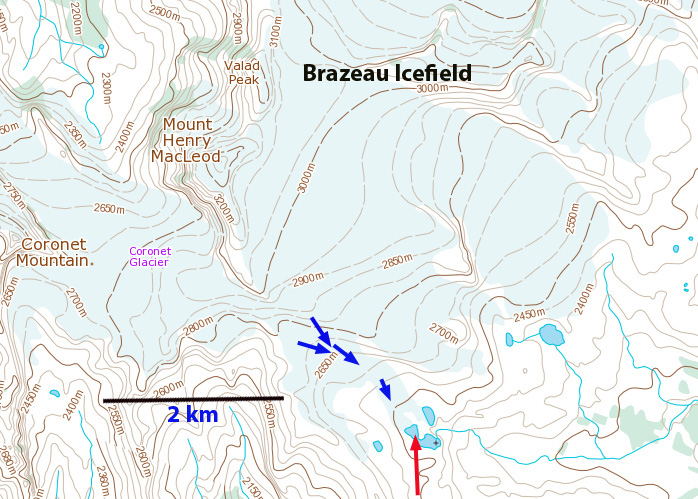
Grinnell Ice Cap in Google Earth

gic summer climate
From Way (2015)

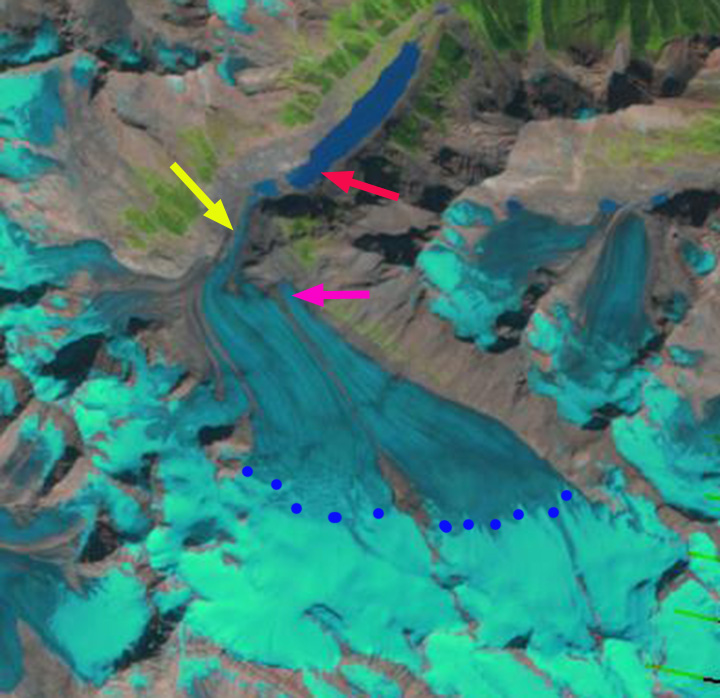
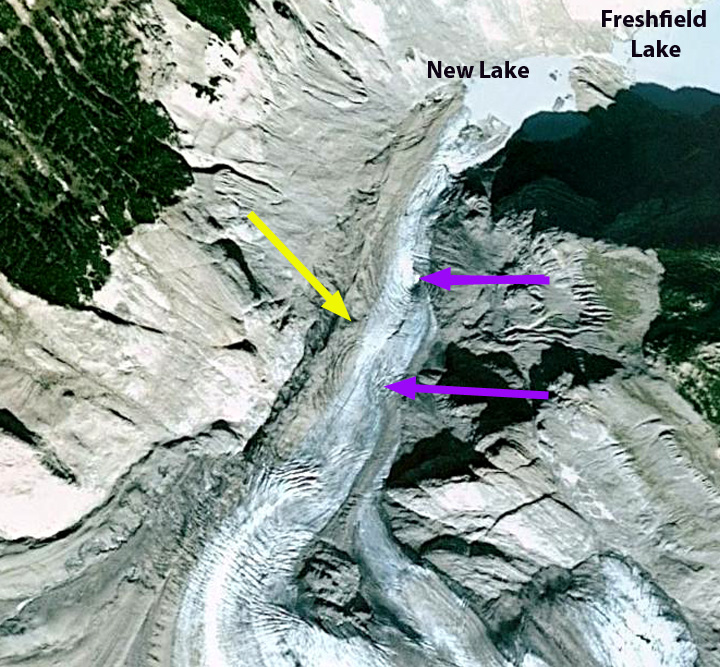
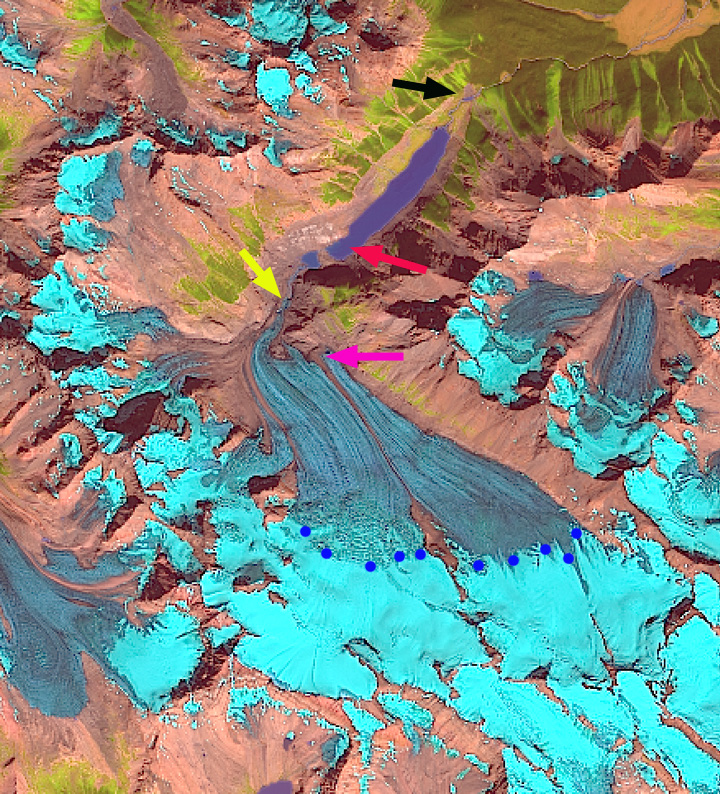
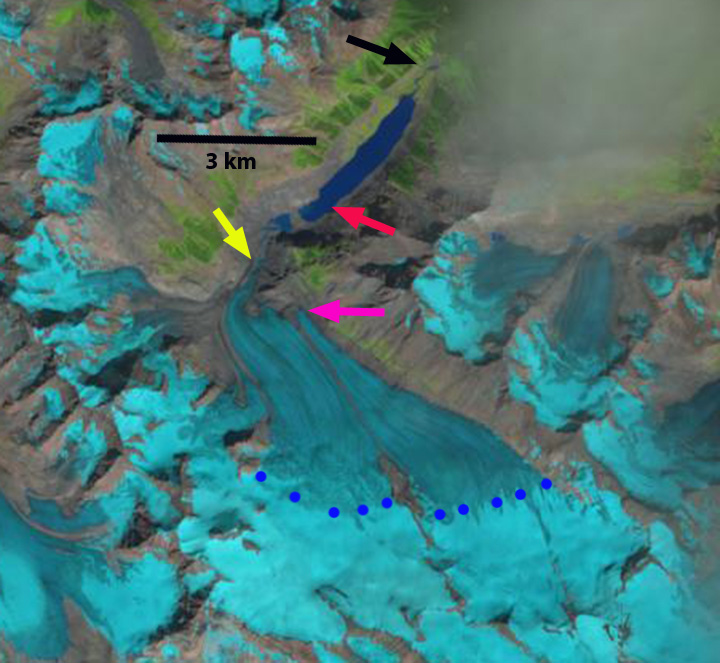
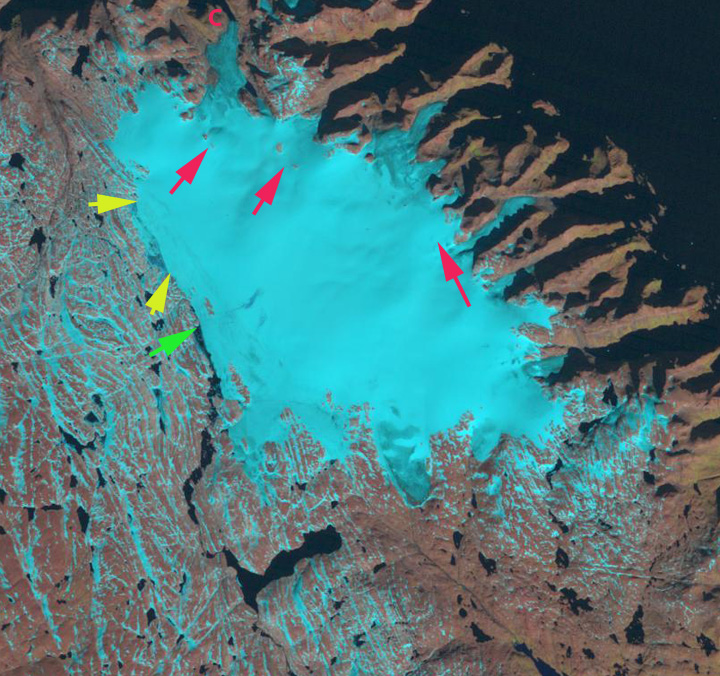
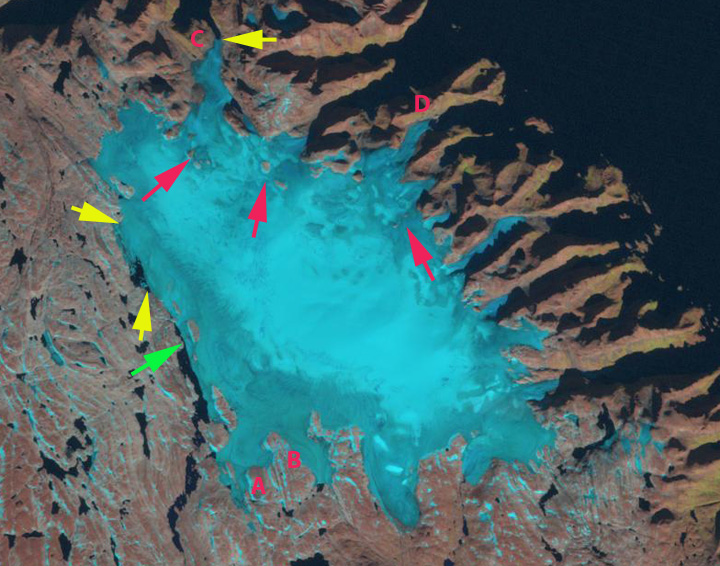
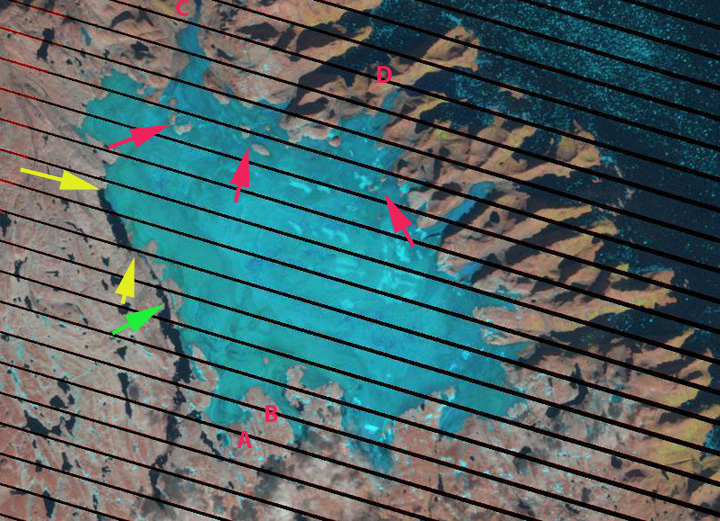
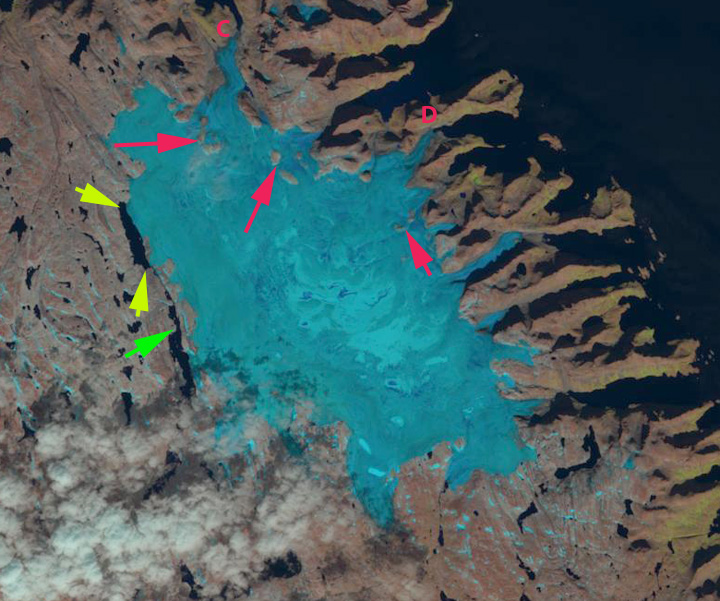
The red arrows in each image indicate areas of small nunataks that have begun to expand in the last decade. The yellow and green arrows indicate specific locations on the western margin of the ice cap where lakes are developing. Point A-D note specific locations adjacent to ice cap outlet glaciers. In 1994 the late August image indicates snowcover across most of the ice cap. The green arrow is at the northern end of a narrow lake. The yellows arrows are at the northern and southern end of a narrow ice filled depression. The nunatak area exposed at the red arrows is limited. At Point C the terminus is tidewater. In 2000 snow pack covers 40% of the ice cap. A small lake is developing at the yellow arrows. The glacier reaches the ocean at Point C and D. The glacier extends south of Point A and the outlet glacier at Point B is over a 1.2 km wide. In 2012 a warm summer led to the loss of all but snowpack on the glacier. At the red arrows the nunataks have doubled in size. At the yellow arrows a 2.5 km long lake has developed. At the green arrow a lake that has developed, is now separated from the glacier margin by bedrock. The glacier now terminates north of Point A. In 2014 again snowcover is minimal with two weeks left in the melt season. The outlet glaciers at Point C and D are no longer significantly tidewater. At Point B the outlet glacier is less than 0.5 km wide. The lake at the yellow arrows is 3 km long and 400 m wide. Some nunataks are coalescing with each other or the ice cap margin. The majority of the western margin of the ice cap has retreated 300-500 m. This retreat is surpassed at outlet glaciers by Point A and C. What is of greatest concern is the loss in thickness of over 1.5 per year on the highest portions of the ice cap, indicating no consistent accumulation zone. This results from the persistent loss of nearly all snowcover in the summer. This pattern of limited end of summer retained snowcover seen in most years since 2004, is a snow deficit that this ice cap cannot survive in our current warmer climate (Pelto, 2010). Way (2015) projects that that if the observed ice decline continues to AD 2100, the total area covered by ice at present will be reduced by more than 57%. Given the recent increases and lack of retained snowcover, suggests an even faster rate is likely.

GIC 1994
1994 Landsat image

gic 2000
2000 Landsat image

gic 2012 late2
2012 Landsat image

gic 2014 late2
2014 Landsat image

Rapid Retreat of Freshfield Glacier, Alberta 1964-2014

The Freshfield Glacier is a large glacier southeast of the Columbia Icefield in the Canadian Rockies where recent retreat  has exposed a new glacier lake.  Today the glacier is 9.8 km long beginning at 3070 meters and ending at 2000 m near the shore of the less than 5 year old lake. This glacier during the Little Ice Age stretched 14.3 km, one of the longest in the entire range extending beyond Freshfield Lake, which was a glacier filled basin. By 1964 the glacier had retreated 1900 meters exposing Freshfield Lake. From 1964-1986 the glacier retreated up this lake basin losing another 1200 meters of length. A comparison of a 1964 photograph from Austin Post and as close to the same view as I could get in Google Earth illustrates the 50 years of retreat. The red line halfway up the lake is the 1964 terminus and the red line at the edge of the lake the terminus location in the topographic map from the 1980’s.  Here we examine Landsat images from 1986 to 2014 to further illustrate the changes. Clarke et al (2015) published this week indicates that it is likely that 70% of glacier volume in western Canada will be lost by 2100. In their Figure 4, three of the four scenarios show Freshfield Glacier as surviving to 2100. The adjacent Conway Glacier is also retreating leading to new lake formation. freshfield total
Freshfield Glacier Google Earth view
 
1964 image of Freshfield Glacier from Austin Post
freshfield compare
Google Earth view of Freshfield Glacier, indicating 1964, 1986 and 2014 terminus positions.

In each image the red arrow indicates the 1986 terminus position, the yellow arrow the 2014 terminus, pink arrow terminus of the eastern portion of the glacier in 2014, and blue dots the snow line on the date of the images.  In 1986 the glacier still reaches the western end of Freshfield Lake, the snowline is at 2600 m and the eastern terminus reaches a bedrock step beyond the pink arrow.  By 1994 the glacier had retreated to the southwest shore of the now fully formed Freshfield Lake, the snowline was between 2600 and 2700 meters.  By 1998 has retreated several hundred meters from the shore of Freshfield Lake into a new basin terminating 600 m from the 1986 terminus location. The snowline is again near 2600 m.  The eastern terminus has retreated from the bedrock step.

By 2009 the terminus has retreated from the basin where it terminated in 1998 exposing a new lake that is 300 m long the terminus no longer reaches.  The lower 1000 meters of the glacier has a thin width suggesting the glacier terminus ice thickness is also thin.  A Google Earth image from 2005 indicates two  basins, circular depressions above the terminus that indicate the collapsing and stagnant nature of the lower portion of the glacier.  The narrowness of the terminus reach is also evident.   By 2013 the glacier has further retreated from the new lake and now ends near the base of the bedrock step.  The eastern terminus has retreated to the pink arrow.  The snowline in this Sept. 22, 2013 image is at 2700 m and is close to the end of the melt season position, the equilibrium line altitude. In 2014 the terminus has retreated 1700 m from the 1986 position and 2900 m from 1964.  This is a rate of approximately 60 m year over a span of  50 years. The glacier remains nearly 50% snowcovered both in 2013 and 2014, indicating a persistent and consistent accumulation zone. The glacier terminus is nearing a bedrock step, with active crevassing on this step. This suggests that the retreat rate should slow in the short term. This glacier remains large and is not in danger of disappearing with present climate. Its behavior mirrors that of the Apex Glacier and Columbia Glacier  but is less dramatic in terms of area loss than or the disappearing Helm Glacier. Glaciers in Alberta as a whole are losing a much greater percentage of their area than Freshfield Glacier as reported by Bolch et al (2010)freshfield glacier 1986
1986 Landsat image

freshfield glacier 1994
1994 Landsat image

freshfield glacier 1998
1998 Landsat image

freshfield glacier 2009
2009 Landsat image
freshfield ge terminus
2005 Google Earth image

Red Channel|Green Channel|Blue Channel
2013 Landsat image

freshfield glacier 2014
2014 Landsat image

Conway Glacier Separation and Retreat, Alberta

Conway Glacier drains east from the border with British Columbia into the Howse River. The Howse River joins the Saskatchewan River upstream of the Bighorn Hydropower project, which impounds Lake Abraham and produces 120 MW of power. The map of this area was updated based on 1990 images which indicate Conway Glacier is comprised of two lobes that join near the terminus.   An inventory of glaciers in the Canadian Rockies indicate area loss of 15% from 1985 to 2005 (Bolch et al, 2010).  The more famous Columbia Icefield, 50 km north, has lost 23 % of its area from 1919-2009 with ice loss at a minimum during the 1970′s (Tennant and Menounos, 2013)Here we examine Landsat imagery from 1986 to 2014 to see the impact of recent climate change.

conway glacier map

Map of Conway Glacier area from 1990 image.

In 1986 the two glaciers are still joined, with a surface lateral moraine at their junction, orange dots indicate this narrow surface rock band eroded from the ridge between the two lobes. The yellow arrow in each image indicates the 1986 terminus location of the northern lobe, the red arrow indicates a bedrock step near the southern lobe terminus, green arrow indicates an ice filled basin, and the purple arrow a small tributary joining the main glacier.  In 1986 the southern lobe extends 300 meters beyond the bedrock step.  By 1994 a small lake is developing at the basin indicated by the green arrow and the northern lobe is reduced in width.  Overall less than 40% of the glacier is snowcovered.  By 1998 the southern lobe has retreated to the bedrock step and the northern lobe has retreated from the end of the lateral moraine.  The glacier again is less than 40% snowcovered.  The 2013 image has better resolution thanks to the better Landsat 8 imagery, and has been sharpened using a higher resolution panchromatic image layer by Ben Pelto (Technique will be explained in a future post).  The glaciers are no longer joined.  The northern lobe has retreated 500-550 m since 1986 and a small lake has formed at the 1986 terminus location, another yellow arrow indicates 2013 terminus.  The northern lobe has retreated above the bedrock step, a total retreat of 500-600 m since 1986.  Two additional red arrows have been added to indicate 1986 and 2013 terminus location.  The small lake at the green arrow has expanded.  The tributary connection at the purple arrow is nearly severed.   Retained snowpack on the glacier is also limited in area with most of the glacier in 2013 being bare glacier ice. This indicates that snow was not retained in recent previous years either.  For a glacier to be in equilibrium it needs more than 50% of its area to be covered by snow at the end of the melt season, not  35% with a few weeks left in the melt season. as in 2013. This glaciers retreat and volume loss mirrors that of the region including Saskatchewan Glacier and Fraser Glacier.   Peyto Glacier is the nearest glacier, just 20 km southeast, with a long term mass balance record, which indicates a cumulative loss or over 28 m w.e or 30 m of glacier thickness.

conway glacier 1986a

1986 Landsat image

conway glacier 1994

1994 Landsat image

conway glacier 1998

1998 Landsat Image

Red Channel|Green Channel|Blue Channel 2013 Landsat image-Pan sharpened by Ben Pelto (Univ. Northern British Columbia)

Southwest Brazeau Icefield Retreat, Alberta

The Brazeau Icefield straddles high peaks southeast of Jasper, Alberta.  The northern outlet glaciers drain into Maligne Lake and the southern outlet glaciers drain in to Brazeau Lake and the Brazeau River.  The Brazeau River flows into Brazeau Reservoir a 355 MW hydropower facility, before joining the Saskatchewan River. An inventory of glaciers in the Canadian Rockies indicate area loss of 15% from 1985 to 2005 (Bolch et al, 2010).  The more famous Columbia Icefield to the west has lost 23 % of its area from 1919-2009 with ice loss at a minimum during the 1970’s (Tennant and Menounos, 2013). Here we examine an unnamed outlet glacier at the southwest corner of the Brazeau Icefield from 1995 to 2014 using Landsat imagery.

brazeau Icefield map

In 1995 the glacier terminated at the red arrow and was 1900 m long, orange dots mark the upper boundary.  The glacier had limited retained snowpack in 1995.  The poor clarity is do to forest fire smoke in the region.  In 1998 the proglacial lake where the glacier terminates is much clearer, snowpack is again limited, but more extensive than in 1995.  In 2002 retreat is evident as the lake is expanding as the glacier retreats.  The glacier still ends in the lake and still has limited snowcover.  In 2013 the glacier has retreated completely from the lake and snowcover is again limited.  The lack of snowcover is persistent in the satellite images which are typically not from the end of the melt season, hence even more snowcover will be lost.  Lack of a significant persistent snowcover area indicates a glacier that will not survive (Pelto, 2010). In 2014 the area experienced considerable forest fires, which leads to poor image clarity.  The glacier terminus is now significantly separated from the lake and terminates at the yellow arrow.  The distance from the yellow to the red arrow represents a 350-400 m retreat in 20 years.  The glacier has lost 20% of its length in this period.  This retreat is similar to that of Fraser Glacier and more significant given the small size of the glacier than for Saskcatchewan Glacier

brazeau icefield 1995

1995 Landsat image

brazeau icefield 1998

1998 Landsat image

brazeau sw 2002

2002 Landsat image

braeau sw 2013

2013 Landsat image

brazeau sw 2014

2014 Landsat image

Bridge Glacier Retreat Acceleration, BC, Canada

Bridge Glacier is an 17 km long outlet glacier of the Lilloet Icefield in British Columbia. The glacier ends in a rapidly expanding glacial lake with 1100 meters of retreat from 2005-2010. This 200+ m per year retreat is a substantial acceleration over the observed retreat rate of 30 m per year from 1981-2005 by Allen and Smith (2007). They examined the dendrolchronology of Holocene advances of the glacier and found up to 2005 a 3.3 kilometer advance from the primary terminal moraine band, with the most extensive advances being early in the Little Ice Age. The glacier currently ends at 1400 m and in 2010 had a late summer snowline of 2000 m. . The glacier terminus in 1970 is shown in map form, and is indicated by a brown line. The 2003 terminus position from a Landsat image, second image, is next with a red line marking the terminus. The normal Google Earth image, third image, is from 2005 and has a green line. An image from Geoeye from August 2010, last image, terminus purple line indicates the rapid acceleration of retreat. Retreat from 1970-2003 was 48 m per year. The retreat from 2003 to 2010 is 1400 meters, 200 m per year. This continued retreat and area loss will lead to glacier runoff decline in summer. This is crucial to the large Bridge River Hydro complex. This complex managed by BC Hydro can produce 490 MW of power. Stahl et al (2008) note in their modeling study of the glacier that ,”The model results revealed that Bridge Glacier is significantly out of equilibrium with the current climate, and even when a continuation of current climate is assumed, the glacier decreases in area by 20% over the next 50 to100 years. This retreat is accompanied by a similar decreasein summer streamflow.” This parallels our findings on the Skykomish River in the North Cascades, Washington Pelto (2008) and Pelto (2011).

Helm Glacier Melting Away-2014 Video Update

It is clear that the business model for glaciers in our current climate is not working. The Helm Glacier in the Coast Mountains of southwest British Columbia is an example of this.  Helm Glacier has been the focus of annual mass balance surveys since 1967. During the 1984-2013 period its mass balance losses have been the greatest of any of the 16 glaciers monitored in North America. The mass balance loss has been about 32 m of water equivalent, about 35 m of ice thickness lost. This is less than losses on other nearby glaciers like Spearhead Glacier but more than others such as Warren Glacier. The regional volume loss has impacted even the large glaciers Bridge Glacier and small glaciers. The loss is more than 30% of the Helm lost in just 25 years, and the trend mirrors that of all glaciers in the Pacific Northwest. Helm Glacier also fits into the pattern of glacier retreat across Canada, Canadian Glacier Retreat index.  NAM ba 2013The glacier had an area of 4.3 square kilometers in 1928. Today the area has declined by 78% to 0.92 square kilometers. In 1928 the glacier is not too distant from its Little Ice Age moraines. The trimlines of recently deglaciated terrain are clear. The glacier has two termini, one draining north and the other west. Today in the picture from Johannes Koch, there is a vast expanse of newly deglaciated terrain that as yet lacks significant vegetation. The western terminus is gone.
Remainder of post and updates moved to
Helm Glacier