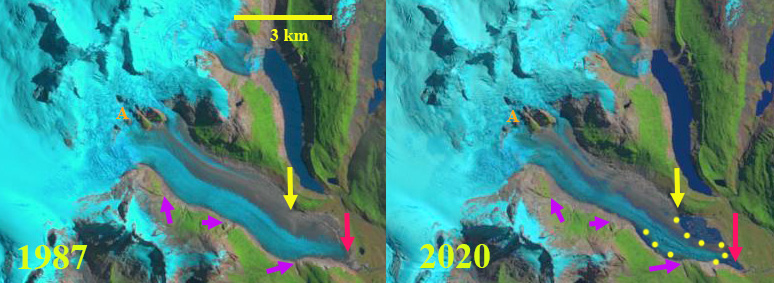
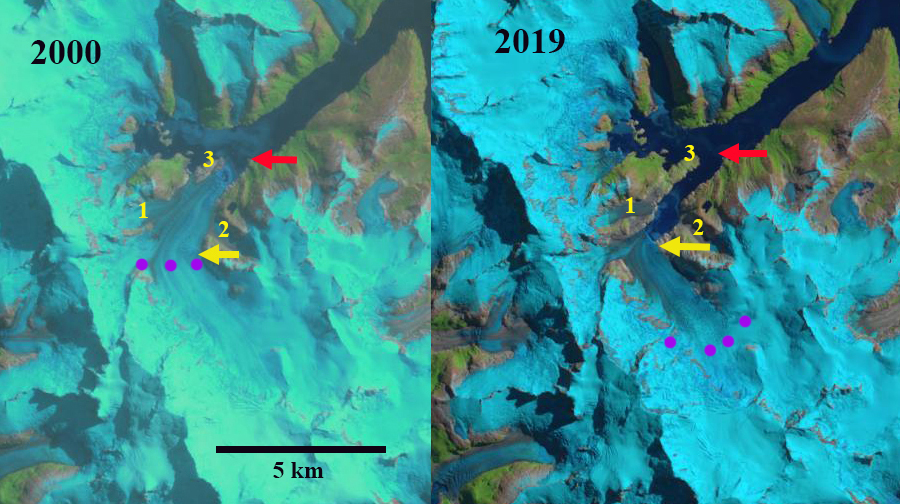
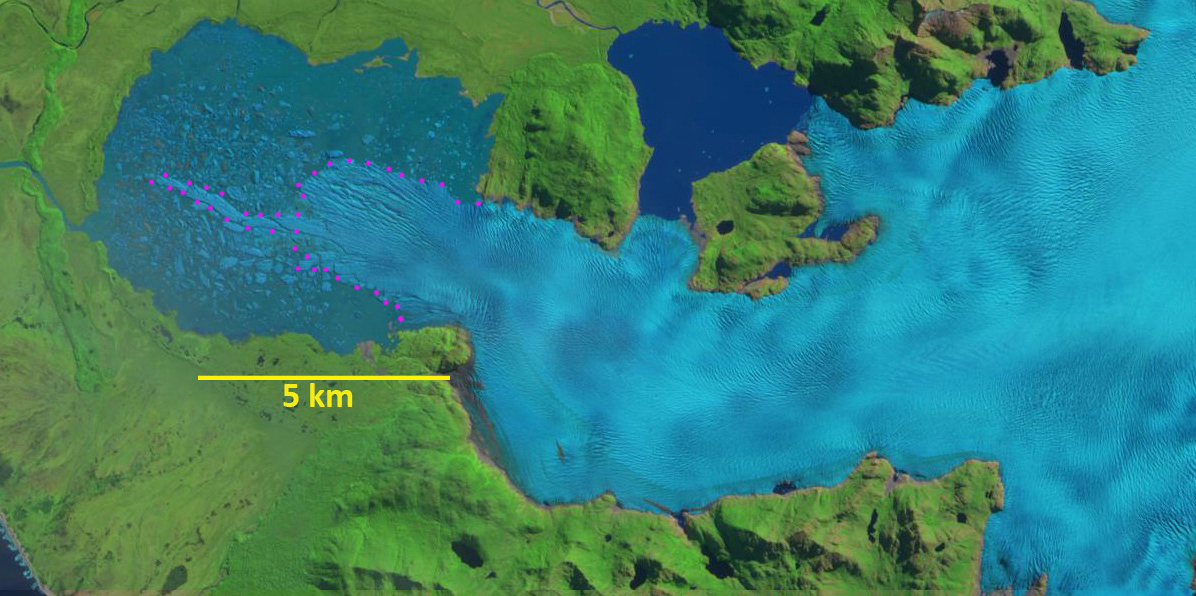
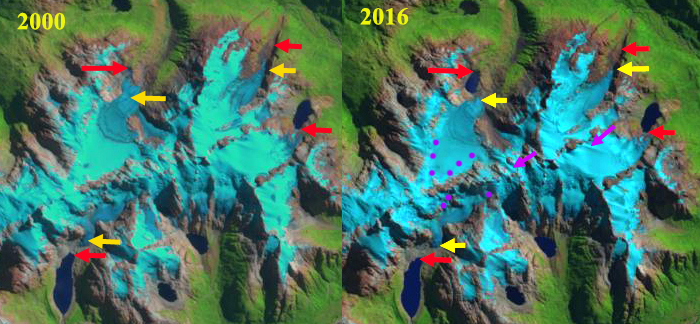
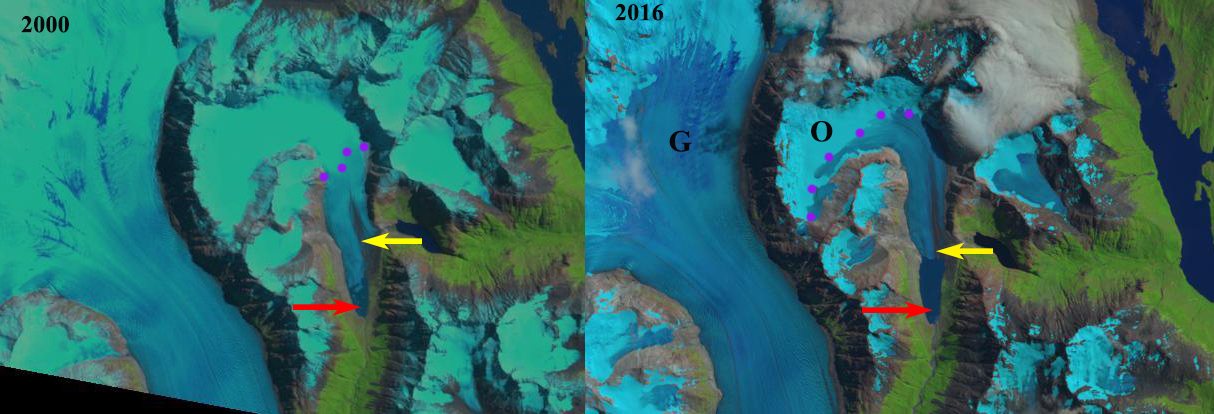
Tres Puntas Glacier, Chile in 1999 and 2021 Landsat imagery. Red arrow is 1999 terminus location, yellow arrow the 2021 location, Point A is where tributaries joined in 1999 and Point B is where an adjacent glacier drains west.
Tres Puntas Glacier flow south from Cerro Tres Puntas draining south into Lago O’Higgins in Patagonia. The icefield is east of the Patagonia icefields where Davies and Glasser (2012) noted the nearby (50 km se) Lago Del Desierto glaciers lost 0.6% of its glacier area from 2001-2011, a much higher rate than from 1986-2000.
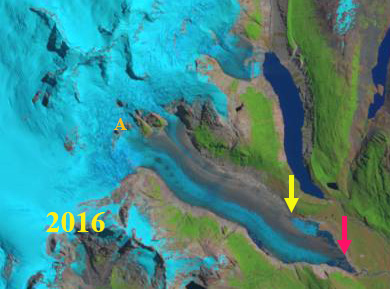
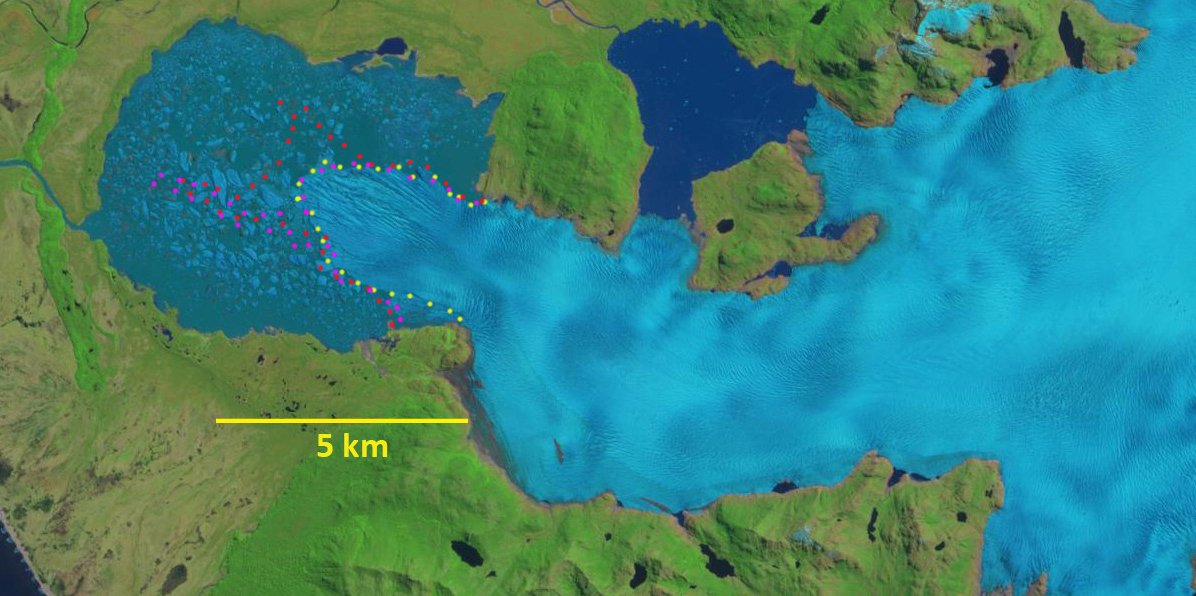
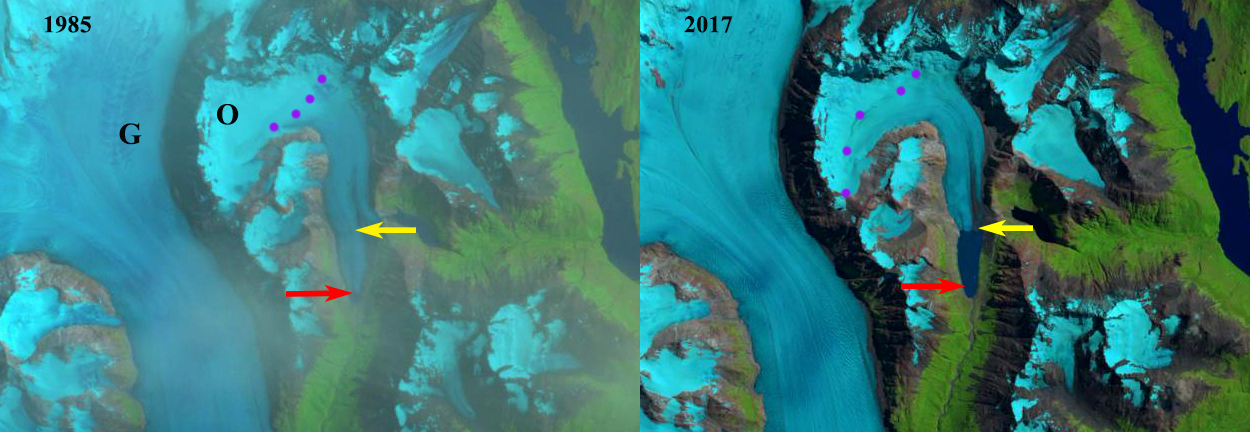
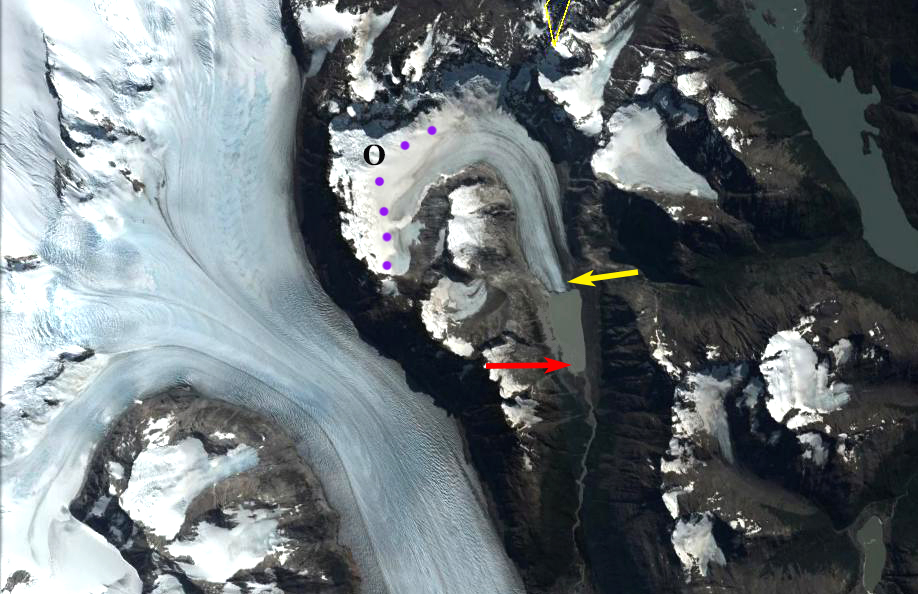
In 1999 the glacier is 5.6 km long with two significant tributaries joining at 850 m (Point A) before terminating in a proglacial lake at 600 m. The glacier shares a broad divide near Point B with glacier flowing west. In 2002 the snowline is at 1100 m, the terminus is still terminating in the proglacial lake. By 2020 the glacier tributaries have separated and now terminates at 900 m, above Point A. At Point B there is a separation between this glacier and the glacier draining west. By mid-February of 2021 the west tributary has retreated 2.8 km, 50% of its 1999 length, while the eastern tributary has retreated 2.4 km of its 5.0 km length. The snowline in mid-February of 2020 and 2021 has been at 1200 m, above the median glacier elevation. Further retreat of the eastern arm should lead to an additional alpine lake forming.
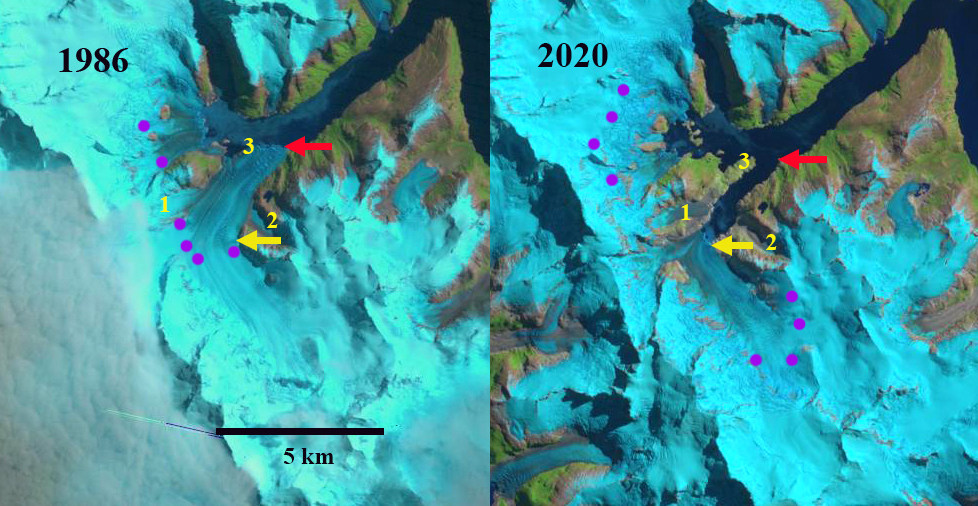
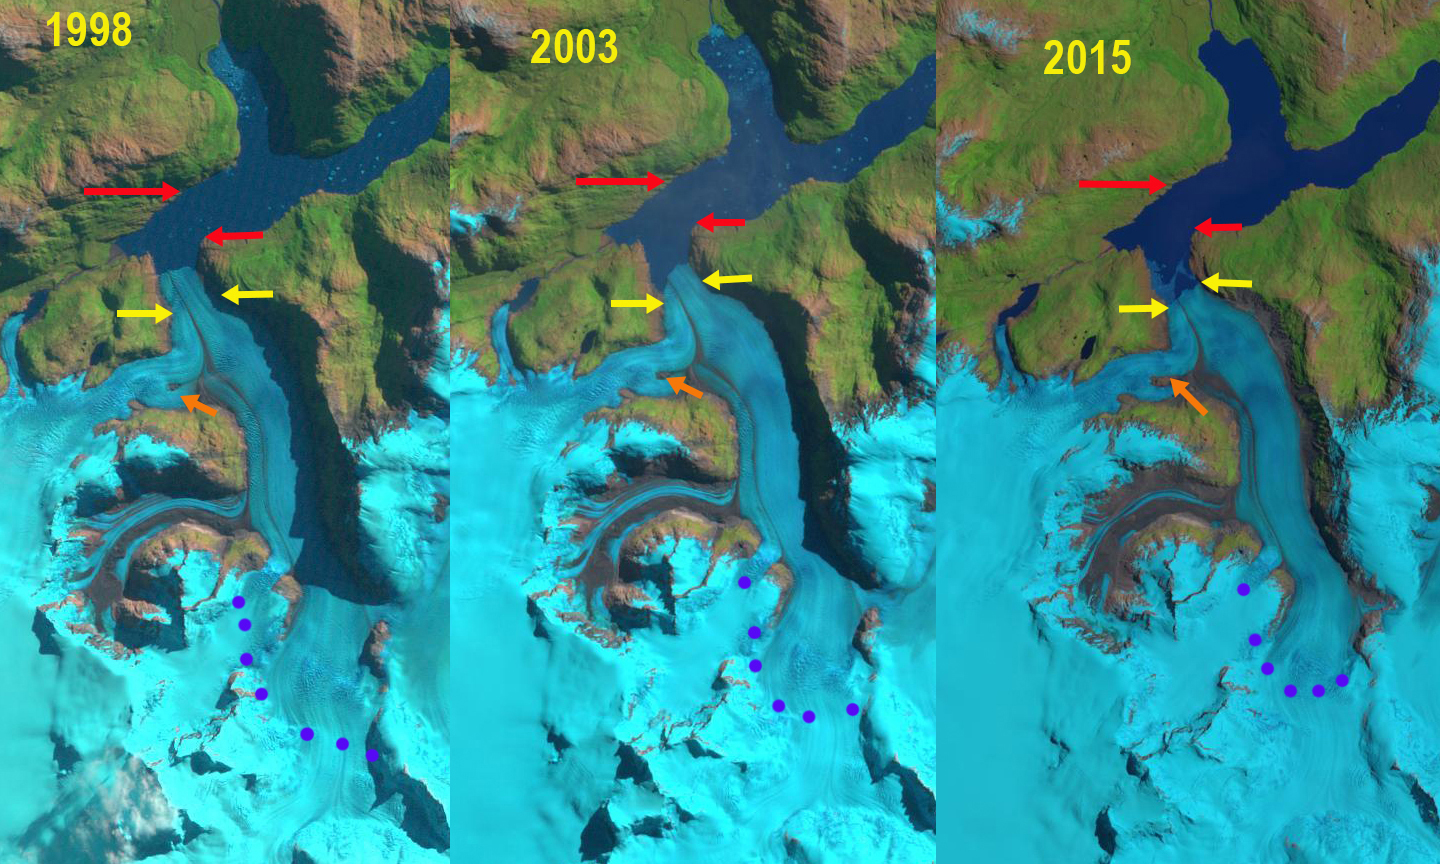
The retreat of this glacier is more extensive than that of the nearby Sierra Sangra glaciers, Argentina. The retreat from an expanding proglacial lake also has played out at Cordillera Lago General Carrera Icefield, Chile

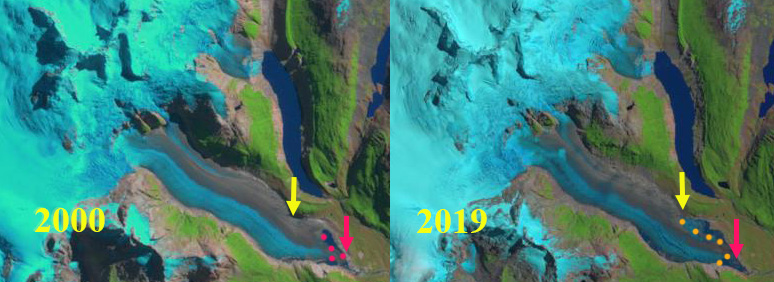
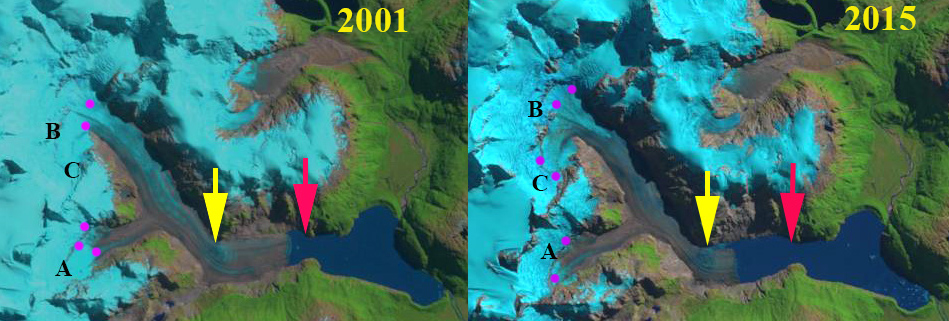
Tres Puntas Glacier, Chile in 2002 and 2020 Landsat imagery. Red arrow is 1999 terminus location, yellow arrow the 2021 location, Point A is where tributaries joined in 1999 and Point B is where an adjacent glacier drains west.