Cachalote Glacier, Chile Retreats From Lake and Separates

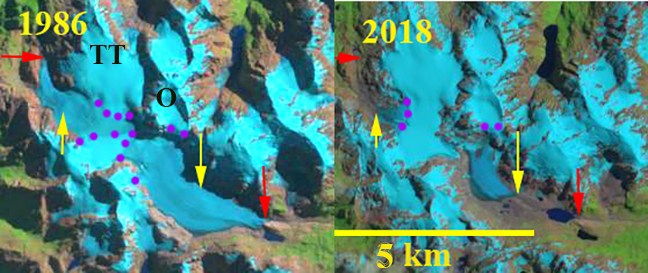
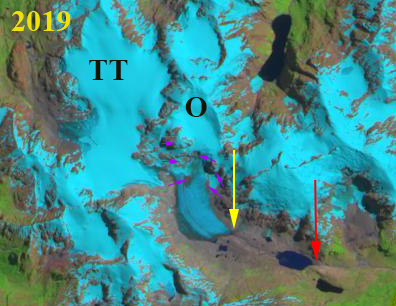
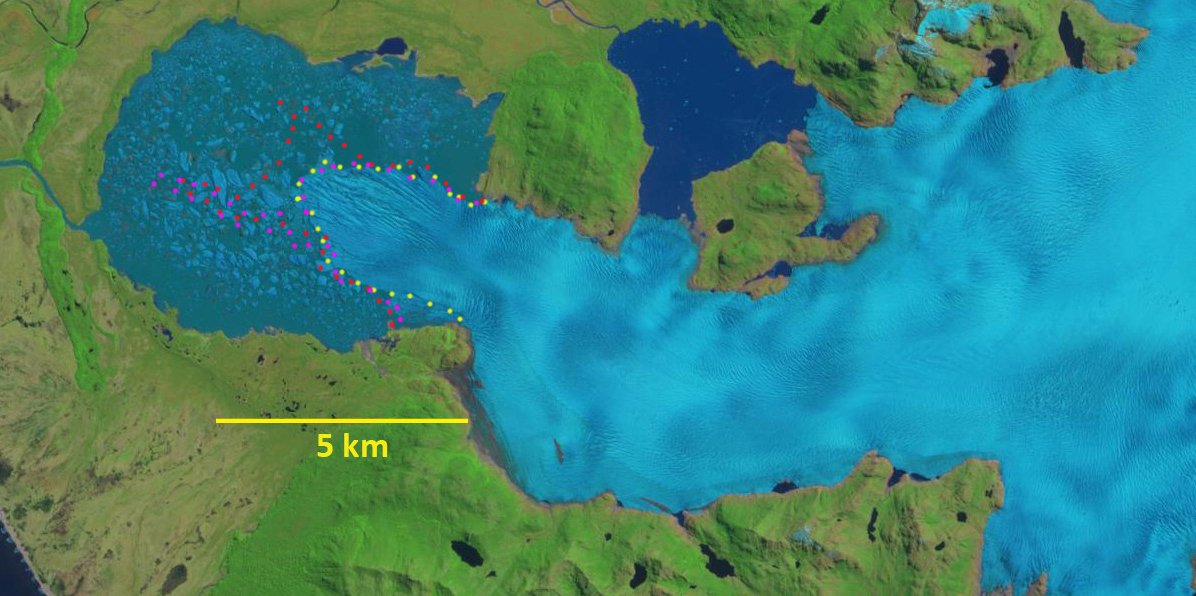
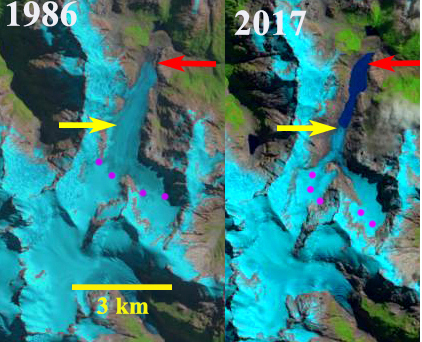
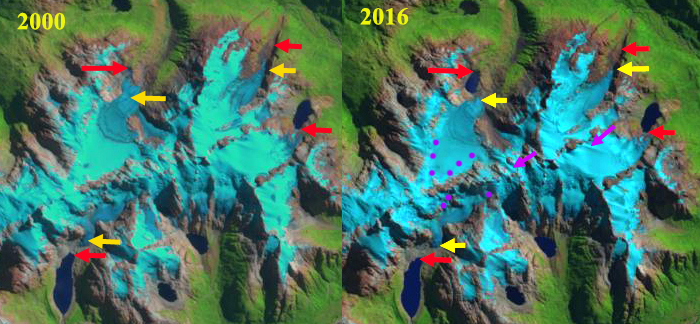
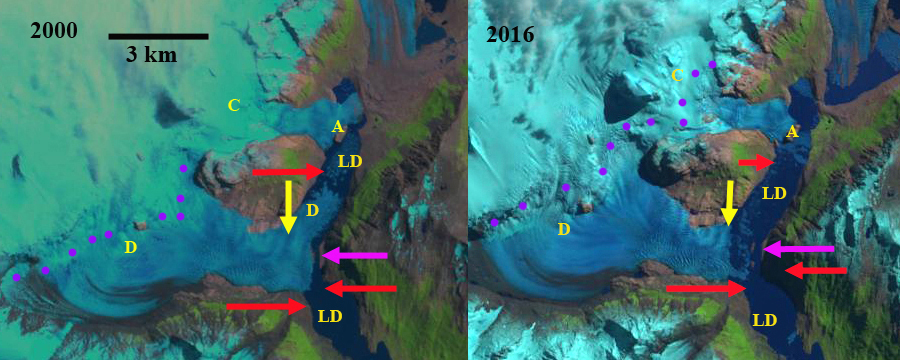
Cachalote Glacier in a 1984 Landsat image and 2019 Sentinel Image.  Red arrow is 1984 terminus location, yellow arrow the 2019 terminus location and the pink arrow a tributary to the glacier in 1984 that separates.

Cachalote Glacier is on the western edge of the Southern Patagonia Icefield, Chile. The glacier is not fed by the main icefield, but is connected to glaciers that are.  The glaciers of the SPI have been experiencing significant mass loss and overall retreat. Willis et al (2012) observed significant mass loss from 2000-2012 of −20.0  Gt per year. Davies and Glasser (2012) indicate this area had its most rapid retreat of the 1870-2011 period after 1986.

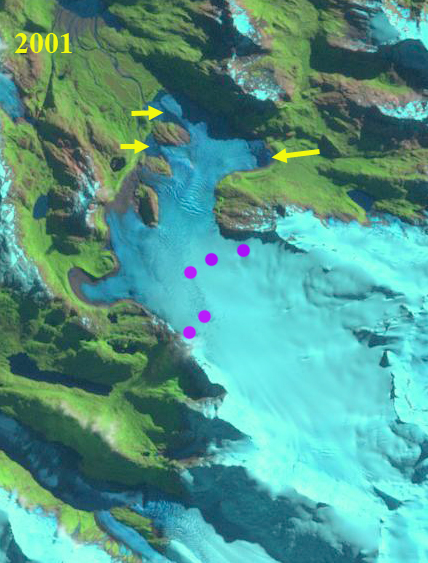
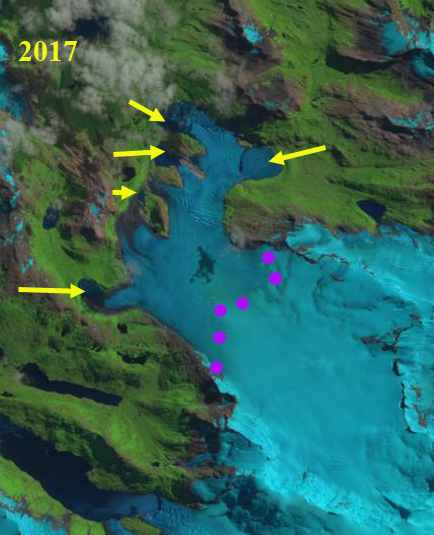
In 1984 Cachalote Glacier terminated in a proglacial that was ~600 m long, red arrow.  The glacier was joined by a tributary from the west ~1 km from the terminus, pink arrow.  By 2001 the tributary had separated from the main glacier. The glacier still terminated in the proglacial lake, but had retreated 1.5 km and the proglacial lake was now just over 2 km long.  In 2017 the glacier no longer reached the proglacial lake. In 2019 the glacier has retreated 2.6 km from its 1984 position, 30% of its entire length lost in the span of 35 years. The glacier no longer terminates in a lake and ends near the top of a steep slope, both suggest that retreat should decline for the near future.

This is a less spectacular retreat than at HPS-12 Glacier which is a short distance to the norther and is the fastest retreating glacier in the region or Dickson Glacier on the east side of the icefield, but as a percent of glacier length lost is as substantial.

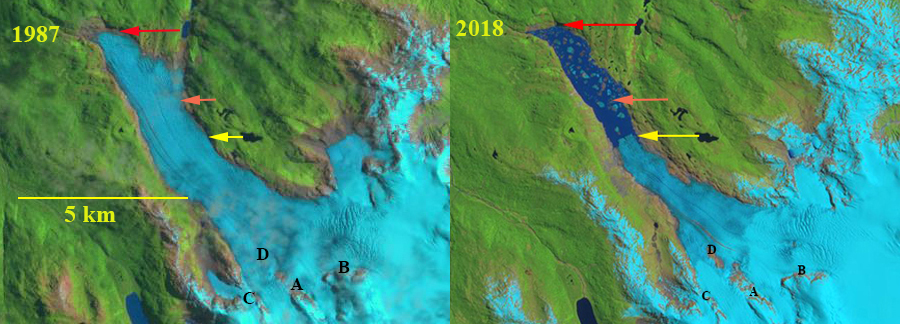
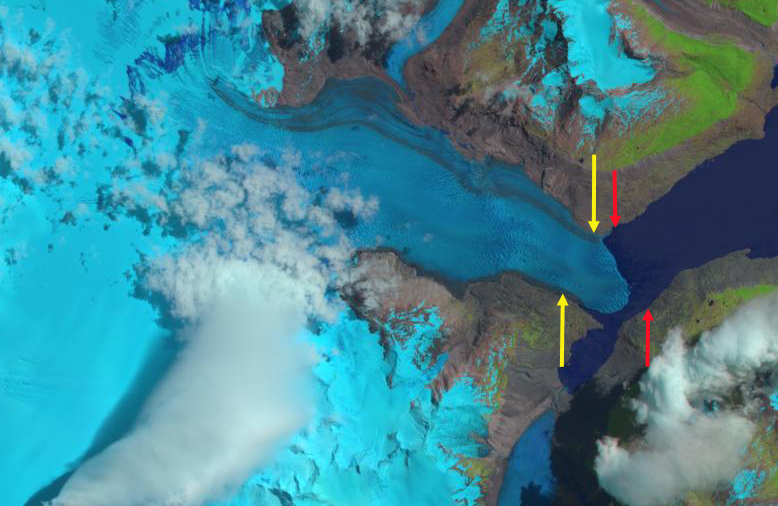
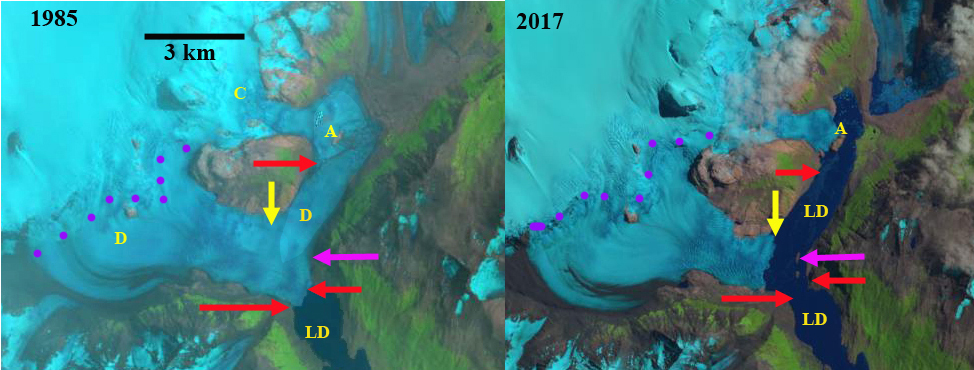
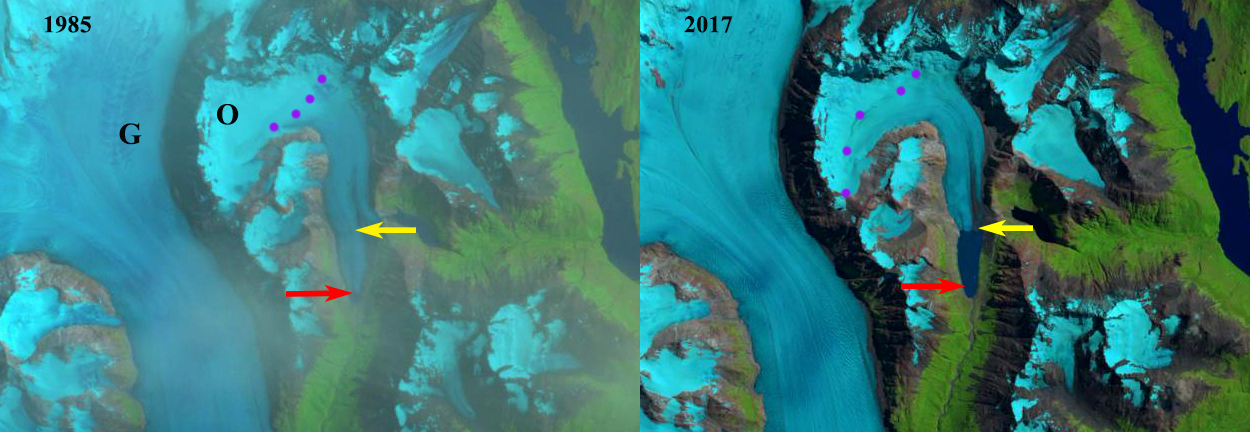
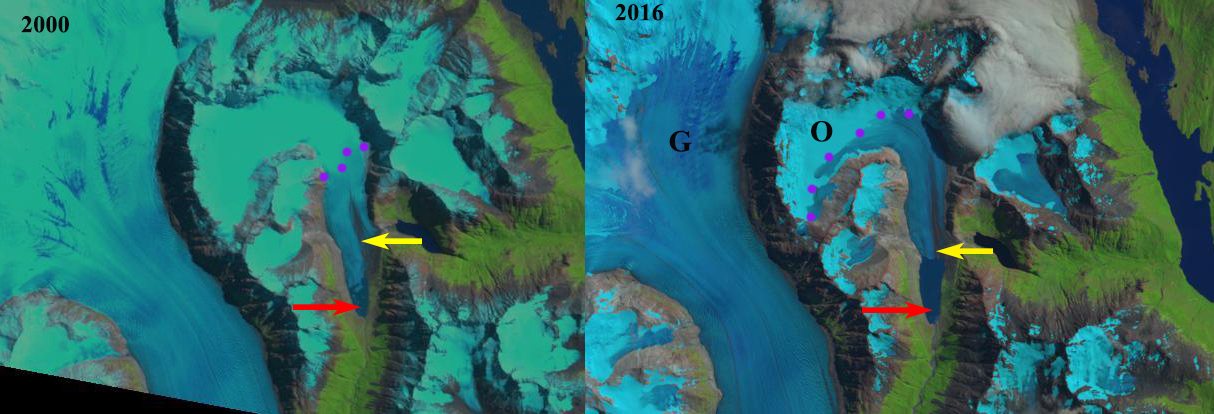
Cachalote Glacier in a 2001 and 2017 Landsat images.  Red arrow is 1984 terminus location, yellow arrow the 2019 terminus location and the pink arrow a tributary to the glacier in 1984 that separates by 2001.

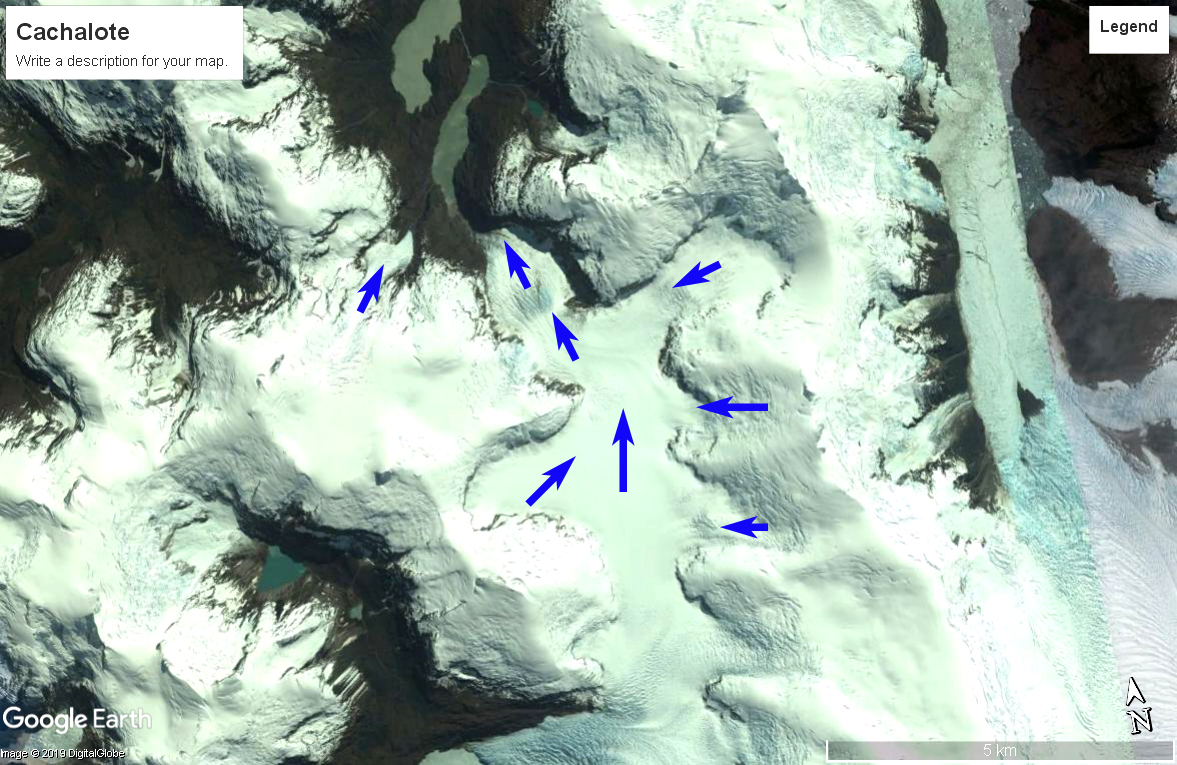
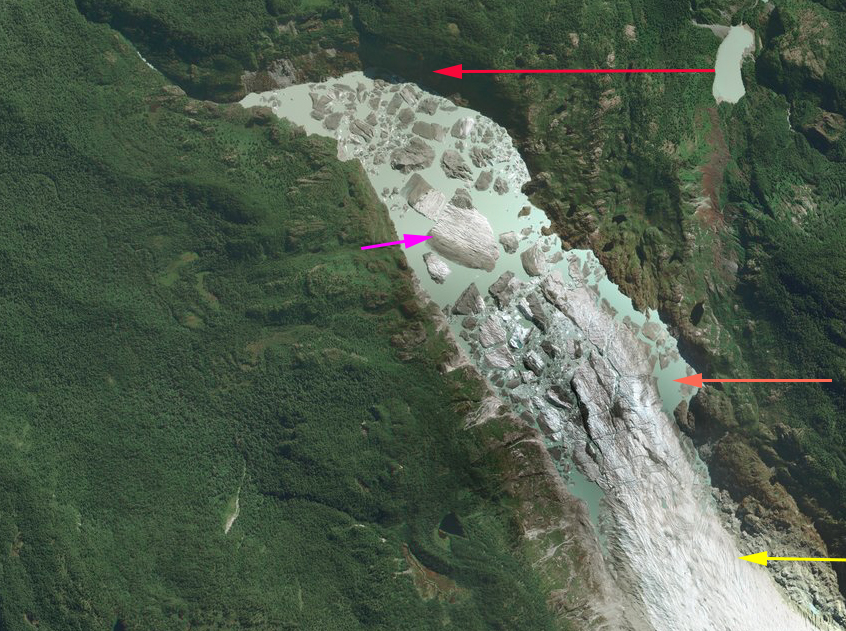
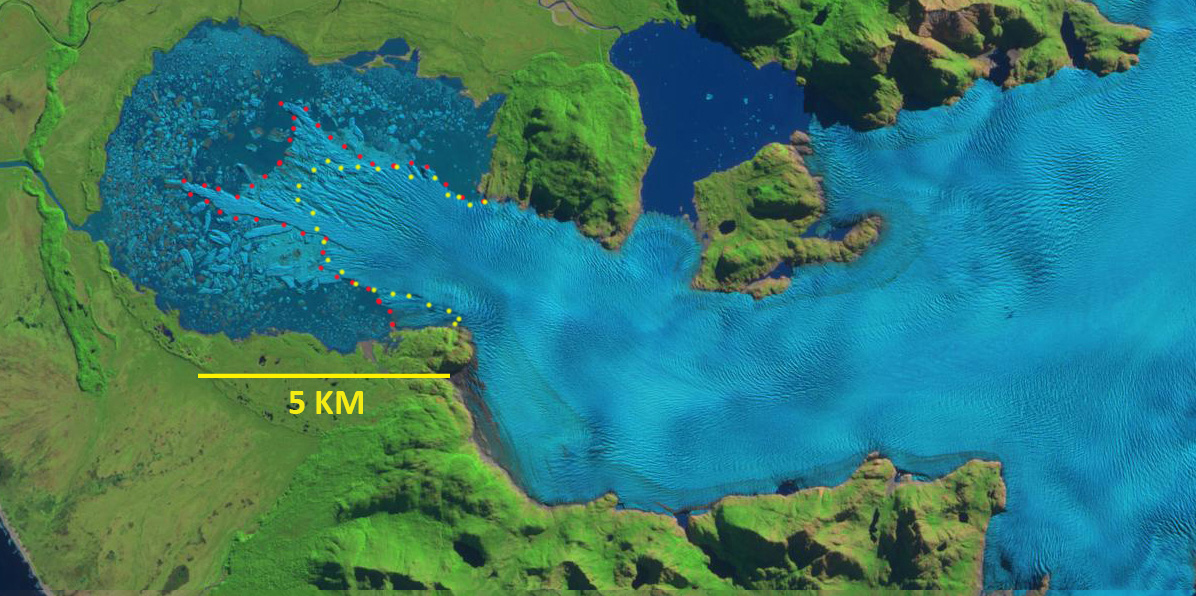
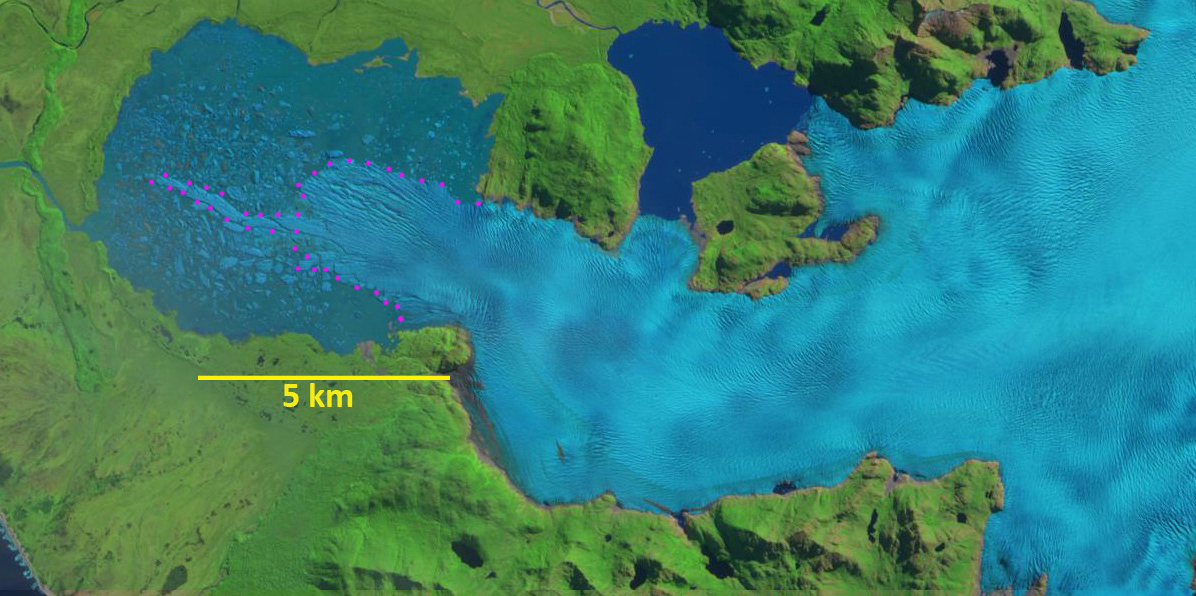
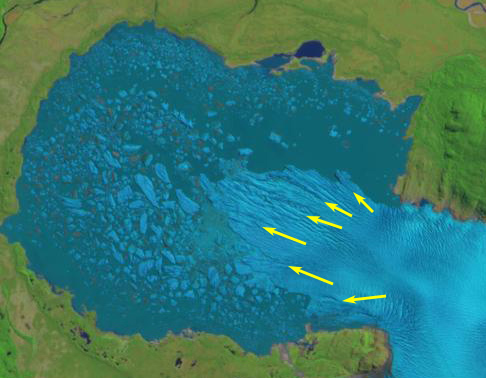
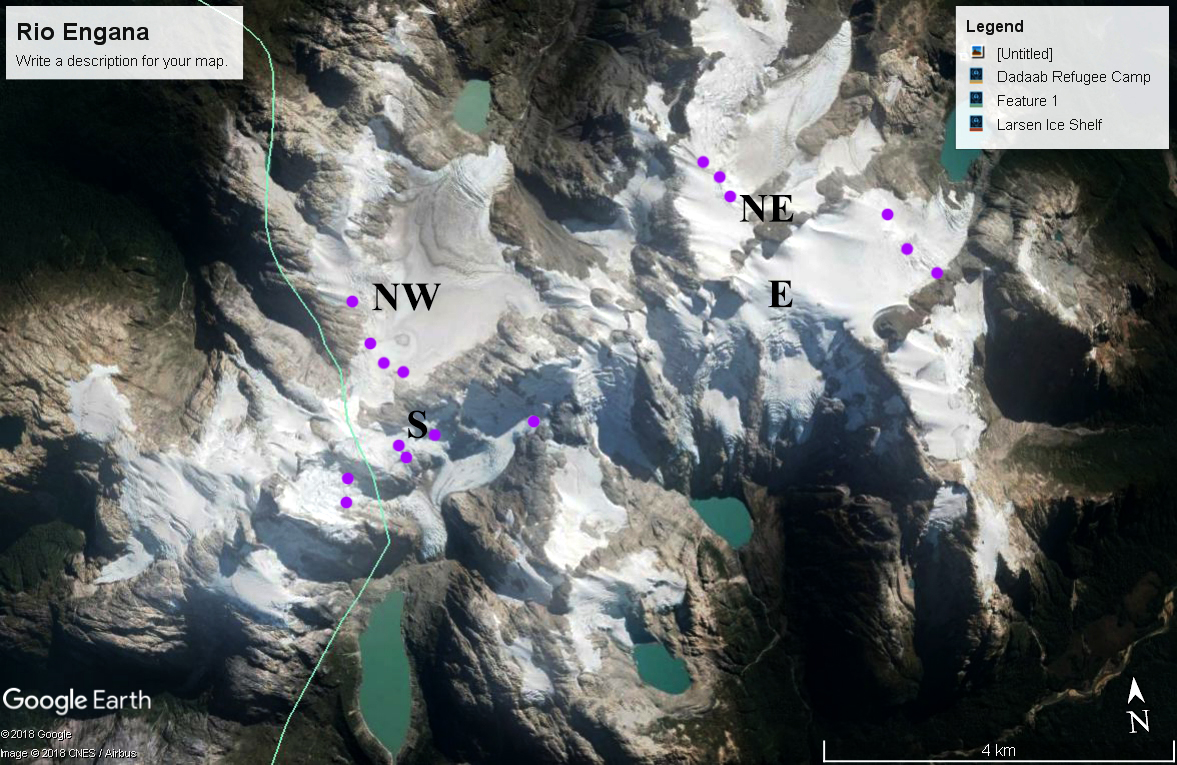
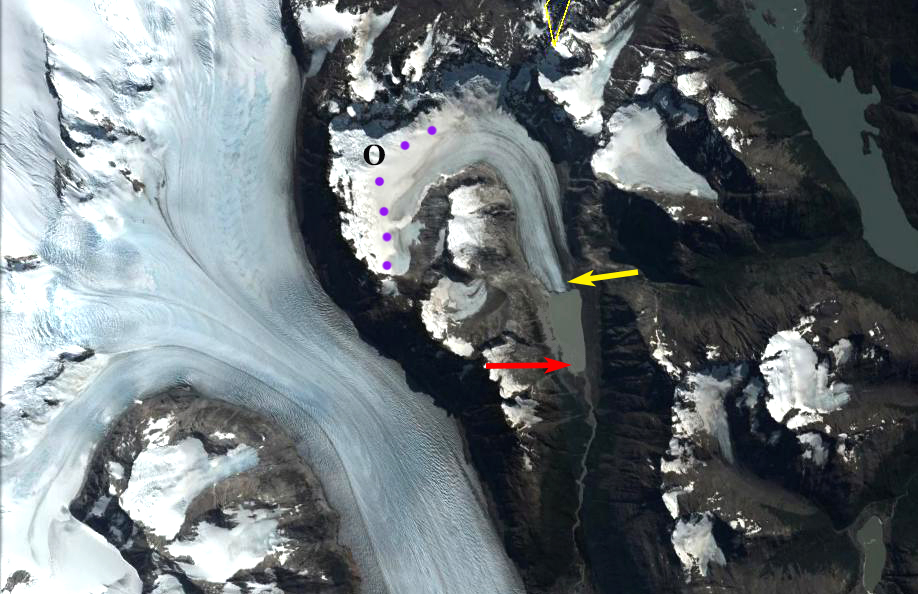
Cachalote Glacier with flow lines indicated. 

Tic Toc Glacier, Chile Rapid Losses with Time 1986-2019

Tic Toc Glacier (TT) and Oeste Glacier (O) in 1986 and 2018 Landsat images.  Red arrow is the 1986 terminus, yellow arrow is the 2018 terminus location, purple dots the snowline.

Tic Toc Glacier at the headwaters of the Rio Tic Toc and the adjacent Rio Oeste headwater glacier Oeste Glacier are in the Parque Nacionale Corcovado of Palena Province of Chile.  Davies and Glasser (2012) noted that overall glaciers in this region lost 14% of their area from 1986 to 2011. Carrivick et al (2016) reported the glaciers in the region had an average thickness of 41 m, this is relatively thin. Here we examine glacier change from 1986 to 2018 using Landsat imagery, with a 2019 Sentinel image for further visual identification of features.

In 1986 Oeste Glacier extended downvalley terminating beyond the east end of a basin, near the west end of an adjacent bedrock knob to its south. The glacier has a 3 km long, 1 km wide valley tongue fed by a higher accumulation zone to the north.  Tic Toc Glacier has a terminus tongue that turns from west to north  extending 800 m downvalley. This glacier has a larger accumulation zone than Oeste Glacier, the snowline in 1986 is at 1350 m the divide between the glaciers. By 1999 Oeste Glacier has retreated from the bedrock knob and a small fringing lake is developing.  Tic Toc Glacier has lost much of the northern terminus tongue.  The snowline in 1999 is at 1500 m.  By 2016 Oeste Glacier has retreated upvalley revealing a new lake.  Tic Toc Glacier has retreated out of the north trending valley that it had terminated in. The divide between the glacier is now mostly bedrock indicating it is consistently above the snowline.  The snowline in 206 is above 1500. By 2018 Oeste Glacier has retreated 1700 m losing the majority of its valley tongue.  It is poorly connected to the upper snowfield as revealed by both Digital Globe imagery and 2019 Sentinel imagery below, indicating the lack of a substantial contributing accumulation zone. Tic Toc Glacier has retreated 1500 m since 1986, most of its valley length. There is still a significant accumulation zone for this glacier. In both cases the majority of the valley portion of these glaciers has been lost since 1986 and the substantial divide connection has been severed. The large scale loss of these two glaciers is typical for the region as noted by the references above and by the examples of Erasmo Glacier and Hornopiren Glacier.


Tic Toc Glacier (TT) and Oeste Glacier (O) in 1999 and 2016 Landsat images.  Red arrow is the 1986 terminus, yellow arrow is the 2018 terminus location, purple dots the snowline and purple arrow the divide.
Digital Glacier image indicating Tic Toc Glacier and Oeste Glacier.  Red arrows indicate 1986 terminus locations, far from the current terminus location.
A 2019 Sentinel image of Tic Toc and Oeste Glacier.  Red arrow 1986 terminus, yellow arrow 2018 terminus and purple arrows bedrock areas separating Oeste Glacier from the accumulation zone.

Erasmo Glacier, Chile Terminus Collapse and Aquaculture

Erasmo Glacier retreat in Landsat image from 1987 and Sentinel image from 2018. Red arrow is 1987 terminus, orange arrow 2016 terminus and yellow arrow 2018 terminus. Points A-D mark areas of expanding bedrock exposure.

Cerro Erasmo at 46 degrees South latitude is a short distance north of the Northern Patagonia Icefield and is host to a number of glaciers the largest of which flows northwest from the mountain. This is referred to as Erasmo Glacier with an area of ~40 square kilometers.   Meltwater from this glacier enters Cupquelan Fjord, which is host to a large aquaculture project for Atlantic salmon, producing ~18,000 tons annually. This remote location allows Cooke Aquaculture to protect its farm from environmental contamination. Runoff from Erasmo Glacier is a key input to the fjord, while Rio Exploradores large inflow near the fjord mouth limits inflow from the south.  Davies and Glasser (2012) mapped the area of these glaciers and noted a 7% decline in glacier area from 1986-2011 of Cerro Erasmo. The recent retreat of the largest glacier in the Cerro Erasmo massif indicates this area retreat rate has increased since 2011. Meier et al (2018) note a 48% reduction in glacier area in the Cerro Erasmo and Cerro Hudson region, since 1870 with half of that occurring since 1986.

In 1987 Erasmo Glacier had a land based terminus at the end of a 6 km long low sloped valley tongue.  The snowline was at 1100 m.  In 1998 there is thinning, but limited retreat and the snowline is at 1250 m.  By 2013 a proglacial lake had formed and there are numerous icebergs visible in the lake, note Digital Globe image below.  The snowline is at 1200-1250 m in 2013 at the top of the main icefall. By 2016 a large lake had formed and the snowline is at 1200 m again at the top of the icefall.  By 2016 the terminus has retreated 2.9 km since 1987 generating a lake of the same length. The snowline in 2016 was at 1200 m at the top of the icefall  From 2016 to 2018 a further 0.9 km retreat occurred.  The 3.8 km retreat from 1998 to 2018 is a rate of ~200 m/year.  Thinning upglacier to the expanding ridge from Point A-D is evident. Thinning at Point C has eliminated the overflow into the distributary glacier that had existed. The collapse is ongoing as indicated by the number of icebergs in the lake in 2018.  there is an increased glacier surface slope 1 km behind the 2018 glacier front, suggesting the lake will not extend passed this point. The retreat is consistent with retreat documented at Reichert GlacierHornopirén Glacier and Cordillera Lago General Carrera Glacier. The impact on inflow to Cupquelan Fjord due to glacier retreat will be increased stream runoff during the wet winter season and reduced flow during the drier summer period December-February.  The summer season is still relatively wet.

Breakup of Erasmo Glacier terminus in Digital Globe image from 2013. Purple arrow indicates largest iceberg.

Erasmo Glacier retreat in Landsat image from 1998 and 2016. Red arrow is 1987 terminus, orange arrow 2016 terminus and yellow arrow 2018 terminus. 

Videla Glacier Retreat, Tierra del Fuego, Chile Generates New and Expanding Lakes

Videla Glacier, Chile in 1997 and 2018 Landsat images. Red dots mark the 1997 terminus locations, yellow dots the 2018 terminus position and purple dots the snowline. 

Videla Glacier is a land terminating glacier in the northwest portion of the Cordillera Darwin Icefield (CDI). The glacier has terminates in several expanding proglacial lakes each in front of a different tongue of the glacier. The glacier flows northwest from Cerro Ambience towards Fiordo Profundo.  Meier et al (2018) identified area change of Patagonia glaciers from 1870-2016 with a ~16% area loss of CDI, with more than half of the loss occurring since 1985. They also noted that CDI glaciers were retreating fastest between 1986 and 2005; afterwards the rate of retreat has decreased. The retreat has been largest on tidewater glaciers such as Marinelli Glacier and Ventisquero Grande Glacier.

In 1997 of Videla Glacier’s six main terminus lobes, five did not exhibit a proglacial lake, only the two northern most lobes ended in a proglacial lake.  The northwestern lobe terminates in a 800 m long calving front, the northeastern lobe in the same basin exhibits a small fringing proglacial lake on its northern margin. The snowline in 1997 is at 600 m.  In 2001 the proglacial lake has expanded at both the northwestern and northeastern lobe.  A second proglacial lake has developed at the next most northern lobe.  The snowline in 2001 is at 550 m.  By 2017 Videla Glacier terminates in five expanding proglacial lakes and the snowline is the highest observed at 650 m. In December 2018 the terminus change from 1997 is evident at each lobe.  The main terminus is the northernmost that has both a northwestern and northeastern terminus.  In a Digital Globe image below the green arrows indicate areas where the terminus is rifted indicating partial flotation.  By 2018 the rifted terminus tongue of the northwestern lobe has been lost.  This image also reveals at the orange arrows newly exposed bedrock. The retreat has been 1.1 km for the northeastern lobe, 1.2 km for the northwestern lobe, 0.9 km for the next lobe to the south, and 0.7 km for the southern lobe. The initiation of significant retreat from the Little Ice Age maximum which led to moraine development impounding the most northern and southern proglacial lakes, was slow in this area. There has been more retreat since 1997 than since 1870.

Videla Glacier in 2001 Landsat image indicating proglacial lakes and the snowline.

Videla Glacier in 2017 Landsat image indicating proglacial lakes and the snowline.


Videla Glacier in a Digital Globe image indicating upglacier limit of weak rifted areas of the northeastern and northwestern lobe, green arrows.  Orange arrows indicate newly exposed bedrock.


San Quintin Glacier High Calving Rate Observations in 2018

San Quintin Glacier in 4-16-2017 Sentinel image, red dots indicate terminus location then. Yellow dots the terminus location  on 11-10-2018.

San Quintin Glacier in 3-20-2018 Sentinel image, pink dots indicate terminus position. 

San Quintin Glacier in 11-10-2018 Sentinel image. Yellow dots the terminus location  on 11-10-2018, pink dots from 3-30-2018 and red dots from 4-16-2017. 

San Quintin is the largest glacier of the NPI at 790 km2 in .  The glacier extends 50 km from the ice divide in the center of the ice cap.  The peak velocity is 1100 m/year near the ELA (Rivera et al 2007), declining below 350 m/year in the terminus region.  San Quintin Glacier terminated largely on land until 1991 (Davies and Glasser, 2012). The velocity at the terminus has increased from 1987 to 2014 as the glacier has retreated into the proglacial lake (Mouginot and Rignot, 2015).  The high velocity zone extends more than 40 km inland an even greater distance than at San Rafael (Mouginot and Rignot, 2015).  Thinning rates in the ablation zone of the glacier are 2.3 m/year (Willis et al, 2012).  The glacier has a low slope rising 700 m in the first 22 km.

In 1987 it is a piedmont lobe with evident minimal marginal proglacial lake development beginning (Pelto, 2016).  Progressive retreat of the glacier into the expanding proglacial lake has led to an increasingly chaotic, disintegrating front of the glacier (Willis et al, 2012).  The large evident crevasses/rifts perpendicular to the front suggest the terminus tongue is largely afloat.  Here we examine Sentinel Images from April 2017 to November 2o18 to identify changes. NASA’s Earth Observatory has high resolution images indicating the terminus in June 2014 and April 2017

On April 16, 2017 there were four icebergs with an area greater than 0.1 kmin the San Quintin Lagoon. The narrow terminus tongue extending from the main terminus had an area of 0.6 km2 and extended to within 3.3 km of the lagoons western shore. On March 20, 2018 this tongue remains tenuously connected to the main terminus, and has extended to within 1.5 km of the western shore.  There are six icebergs with an area greater than 0.1 km2.  By November 10, 2018 this narrow tongue had disintegrated.  There are eight icebergs with an area greater than 0.1 km2.  The icebergs are slow to melt in the lagoon compared to a fjord setting. The overall terminus area loss from April 2017 to November 2018 is 1.8 to 2.0  km2. There has been additional detachment on the southern shore where the glacier enters the main lagoon basin.  This should further destabilize the glacier tongue.  In  the coming years the lagoon will continue to expand to a size of at least 40 square kilometers.

As Pelto (2017) noted 19 of the 24 main outlet glaciers of the Northern Patagonia Icefield ended in a lake in 2015, all the lake termini retreated significantly in part because of calving losses. Glasser et al (2016) observed that proglacial and ice-proximal lakes of NPI increased from 112 to 198 km2. A collapse of the terminus tongue on Steffen, Gualas and Reichert Glacier are examples.

October 31, 2018 Sentinel image indicating extensive rifts that have developed and are areas of weakness for further calving.

Landsat comparison of San Quintin Glacier in 1987 and 2015: red arrow indicates 1987 terminus location, yellow arrow indicates 2015 terminus location of the three main termini, and the purple arrow indicates upglacier thinning.


Glacier O’Higgins Calving Front Changes 1986-2018

Glacier O’Higgins in 1986 and 2018 Landsat images. Red arrow and line is the 1986 terminus position, pink line the 2002 terminus, green line the 2013 terminus, yellow arrows the 2018 terminus location, purple dots the snowline. Point A, B and C are locations at the margin of the glacier.

Glacier O’Higgins is a large outlet glacier of the Southern Patagonia Icefield (SPI) that terminates in Lago O’Higgins. Cassasa et al (1997) report on terminus changes from 1986 to 1995. In 1896 the glacier terminated on Isla Chica. By 1979 the glacier had retreated 13.8 km up an inlet of Lago O’Higgins.  The glacier was stable in this position through 1986 and had retreated 14.6 km by 1995. At this point the terminus had a 2.7 km east facing calving front, with the southern end of the terminus resting on the southern shore of the Lago O’Higgins Inlet. Meier et al (2018) note an 8 % area loss from 1985-2016 for the east side of the SPI.  Schaefer et al (2015) examined the mass balance of SPI and found Glacier O’Higgins had a calving flux of 2.15-2.97 cubic kilometers/year, and a calving front velocity of 2300 m/year. Malz et al (2018) note a mean elevation change of -1.04 m/year for Glacier O’Higgins from 2000-2016, with the greatest thinning near the terminus.  Here we use 1986-2018 Landsat imagery to identify changes.

In 1986 the terminus is firmly grounded on the south shore of the Lago O’Higgins inlet, with a 2.7 km long calving front, red arrows.  There is some melange in front of the south side of the terminus. There is debris covered ice between the terminus and tributary from the southwest that no longer quite reaches the main glacier.  By 2002 a new inlet has formed as the southwest tributary retreat and it debris covered terminus area melts away.  The southern margin has retreated into Lago O’Higgins and the calving front is now 3.5 km long.  In 2013 terminus retreat has been limited, but a narrow finger of open water has spread further along the southern margin of the glacier.  The calving front is now 4.0 km long.  In 2016 Google Earth imagery there is little change from 2013.  From 2016 to 2018 there is a substantial loss of terminus area as the glacier retreats 2500 m on the southern margin, 2100 m in the center and 1100 m on the north side. The calving front is now 2.6 km long.  The calving front is less vulnerable.  As the glacier retreats there is potential for the calving front to widen one kilometer upglacier of the calving front.  There also is an increase in crevassing and surface slope suggesting a reduction in water depth, which would reduce calving. At Point A you can see the expansion of the bedrock ridge that had been an isolated knob in 1986.  At Point B this area has been deglaciated as the tributary from the north has contracted.At Point C a narrow finger of glacier ice remained between bedrock and a knob, today it is just part of the ridge. The retreat of this glacier has been rapid from 2016 to 2018, but over the larger period the retreat is much less than the spectacular 13 km retreat of HSP-12 on the western side of the icefield or Onelli Glacier to the north.

Geoeye view of Glacier O’Higgins, yellow arrows indicate the 2018 terminus. Tr indicates the Little Ice Age trimline and IC is the Isla Chica where the glacier terminated in 1896.

Glacier O’Higgins in 2002 landsat image, red arrow is the 1986 terminus position and yellow arrows the 2018 terminus location.

Glacier O’Higgins in 2013 landsat image, red arrow is the 1986 terminus position and yellow arrows the 2018 terminus location.

Google Earth 2016 image of Glacier O’Higgins, note the extent of crevassing that indicates vigorous flow to the calving front in 2016. Several pockets of upwelling at the calving front.


Pico Alto Glacier, Chile Retreat New Lake Formed

Pico Alto Glacier, Chile in 1986 and 2017 Landsat images indicating the retreat.  Red arrow indciates 1986 terminus, yellow arrow the 2017 terminus,and purple dots the snowline. 

Pico Alto Glacier, Chile drains north from the Argentina-Chile border entering the Rio Puelo and eventually Lago Tagua. The glacier ongoing retreat is similar to the nearby Hornopiren Glacier and Erasmo Glacier.  Davies and Glasser (2012) mapped the glaciers in the Hornopiren region and found a 15 % area loss from 1986 to 2011.

In 1986 there was no lake at the terminus of the glacier and the snowline is near the main junction.  By 2000 the glacier had retreated 1200 m opening a new lake.  The eastern arm of the glacier did not retain significant accumulation. In 2016 the snowline again left the eastern tributary without retained accumulation.  In fact the connection to the larger western tributary has been greatly reduced.  By 2017 the glacier has retreated 2.4 km with a lake of nearly the same length having formed, this is 40% of the total glacier length lost in three decades.  The eastern tributary due to a lack of retained snowpack will continue to wither away.  The main glacier can survive in a reduced state with current climate. Wilson et al (2018) noted a substantial growth in the number of lakes in the central and Patagonian Andes due to the ongoing rapid retreat. Harrison et al (2018) also observed the number of glacier lake outburst floods have declined despite the increase in lakes.

Pico Alto Glacier, Chile in 2000 and 2016 Landsat images indicating the retreat.  Red arrow indicates 1986 terminus, yellow arrow the 2017 terminus,and purple dots the snowline.

Google Earth view of the Pico Alto Glacier (PA) indicating flow, blue arrows, 1986 terminus red arrow and 2017 terminus yellow arrow

Rio Engaño, Chile Headwater Glacier Retreat GLOF Threat Drops

Comparison of glaciers at the headwaters of Rio Engaño in 1984 and 2018 Landsat images. The 1984 terminus location with red arrows, yellow arrows the 2018 terminus location, purple arrows wind drift patterns.

Rio Engaño drains into Lago General Carrera and its headwaters is a group of alpine glaciers.  In March of 1977 one of the glaciers, generated a glacier lake outburst flood (GLOF) that reached a depth of 1.5 m  at the small village of Bahía Murta Viejo 25 km down river (Anacona, et al 2015).  Davies and Glasser (2012) observe that glaciers just northeast of the Northern Patagonia Icefield lost area at a rate of 0.2% per year from 1986-2011.  Paul and Molg (2014) observed a more rapid retreat of 25% total area lost from glaciers in northern Patagonia from 1985-2011, the study area was north of the Northern Patagonia Icefield, including the Cordillera Lago General Carrera icefield.

Here we examine changes of four glaciers at the headwaters of Rio Engaño using Landsat imagery for the 1984 to 2018 period.

In 1984 the Northwest (NW) glacier had two terminus tongues and no lake at the terminus, red arrow. The Northeast (NE) glacier had a length of 4 km. The East (E) glacier terminated at the margin of a proglacial lake. The South (S) Glacier which experienced the GLOF, terminated on the northern end of a proglacial lake. By 2000 the NW glacier had lost its eastern terminus and a small lake is forming at the western terminus. The NE glacier had retreated 400 m. The S glacier no longer reaches the proglacial lake. In 2016 the snowline is quite high on the NW and S glacier, purple dots. The wind features, purple arrow indicate the strong wind sculpted features from the west winds. In 2018 the NW glacier no longer reaches the proglacial lake that began forming after 1984, total retreat 800 m. The NE Glacier has retreated 700 m and is now 3.3 km long. The E glacier terminates at the base of a steep slope 200 m from the proglacial lake it reached in 1984. The S glacier has retreated 600 m from the lake it reached in 1984. The NE and E glacier have substantial areas above 1600 m and have retained snowpack each year over a significant portion of the glacier. The NW and S glaciers have little area above 1600 m and in several years have retained minimal snowpack and will continue a rapid retreat.

Wilson et al (2018)  documented a 43% increase in the number of glacial lakes and 7% in the area of lakes in the central and Patagonian Andes. In the Rio Engaño headwaters both the area and number of lakes has increased. The threat of GLOF in for these specific glaciers appears to be declining as the glaciers retreat further from the lakes.  Iribarren et al (2014) list that glacier contact and glacier steepness adjacent to the lake are variables that raise GLOF hazards, and these factors are declining at the Rio Engaño headwaters.  They also noted that the GLOF in 1977 had a volume of 7.36 million cubic meters the second largest in their record of 16 GLOF’s.

Comparison of glaciers at the headwaters of Rio Engaño in 2000 and 2016 Landsat images. The 1984 terminus location with red arrows, yellow arrows the 2018 terminus location, purple arrows wind drift patterns and purple dots the snowline in 2016.

Google Earth image from 2017 indicating the snowline leaving limited snowcovered area on NW and S glacier. 

Pared Nord Glacier, Chile Retreat & Landslide Transport 1987-2018

Pared Nord Glacier, Chile in 1987 and 2018 Landsat images.  The red arrow indicates the 1987 terminus location, yellow arrow the 2018 terminus location and purple arrows areas of expanding rock in the lower accumulation zone.  Point A is the front of a wide debris zone from a former landslide, Point B is the front of another landslide deposited debris zone. Point C is a recent landslide deposit on a an unnamed glacier.  The movement f debirs at Point A and B indicate glacier velocity

Pared Nord (Norte) Glacier is a southeast outlet glacier of the Northern Patagonia Icefield (NPI).  Davies and Glasser, (2012)  identify this region of the icefield as retreating faster from 1975-1986 than during any measured period since 1870, the retreat since 2001 has been relatively rapid.   Loriaux and Casassa (2013) examined the expansion of lakes of the Northern Patagonia Ice Cap. From 1945 to 2011 lake area expanded 65%, 66 square kilometers.   Glasser et al (2016) note on Pared Nord that ice-surface debris was transported and redistributed down-ice by glacier flow merging with marginal supraglacial debris.

In 1987 Pared Nord Glacier terminates at a narrow point in the proglacial lake, red arrow.  The debris band at Point A has just turned the corner south towards the terminus and the debris at Point B is near the snowline at the base of the icefall. By 2001 Point B had shifted 4 km downglacier entering the main glacial valley and Point A had shifted 2.5 km towards the terminus.  The terminus had retreated some but was still at the narrow pinning point of the valley.  In 2015 at Point C a landslide had spread across the unnamed glacier. The debris band at Point B had reached the head of a valley from the south side of  the glacier.  In 2018 the purple arrows indicate substantial expansion of bedrock areas near the snowline indicating a rising snowline and glacier thinning.  Glasser et al (2016) note the recent 100 m rise in snowline elevations for the NPI, which along with landslide transport explains the large increase in debris cover since 1987 on Pared Nord.  The main glacier terminus has retreated 1400-1500 m and is currently one kilometer from a widening of the valley, which should lead to an increased calving retreat. The glacier  in 2013 has numerous glacial drainage features, purple arrow in Google Earth image below and substantial crevassing which will lead to calving at the terminus, green arrow. The movement of Point B has been ~4.8 km in 31 years, and of Point A ~3.3 km in 31 years, a velocity of 160 m/year and ~100 m/year respectively.

The retreat of this glacier is less than that of Colonia Glacier to the north and  more than HPN4 glacier to the west.  All the outlet glaciers of NPI have retreated in the last 30 years most leading to expanding proglacial lakes (Pelto, 2017).

Pared Nord Glacier, Chile in 2001 and 2015 Landsat images.  The red arrow indicates the 1987 terminus location and yellow arrow the 2018 terminus location. Point A is the front of a wide debris zone from a former landslide, Point B is the front of another landslide deposited debris zone. Point C is a recent landslide deposit on a an unnamed glacier.  The movement of debris at Point A and B indicate glacier velocity.

Pared Nord terminus in 2013 Google Earth image.  Purple arrows indicate relict glacial drainage features and green arrow large crevasses near the calving front.

Dickson Glacier, Argentina/Chile Retreat, Separation &Lake Opening

Dickson Glacier (D) retreat illustrated by 1985 and 2017 Landsat images. Red arrows the 1985 terminus position, yellow arrows the 2017 terminus position, C=Cubo Glacier, A=Island, pink arrow indicates where islands form, purple dots indicate snowline and LD=Lago Dickson.

Dickson Glacier is located in Southern Patagonian Icefield (SPI) in Torres del Paine National Park straddling the Argentina and Chile border.  The glacier in 1985 had both an eastern and southern terminus, the southern terminus was in Lago Dickson and the eastern terminus merged with Cubo Glacier (C). From 1986 to 1998, the glacier retreated on both fronts, the Lago Dickson in 1998 was same elevation as the newly forming glacier lake between Dickson and Cubo Glacier (Rivera et al, 2004).  In 1999 the lakes joined and in a bold voyage Andrés Rivera and Heiner Lange crossed by boat from Lago Dickson through the narrow channel in front of Dickson Glacier into the upper lake.  Between 1999 and 2003 Rivera et al (2004) notes that the Dickson Glacier front was relatively stable partly due to the appearance of rocks at the base of the front, see image below.  Here we examine the changes from 1985 to 2017 using Landsat imagery.

In 1985 Dickson Glacier descends from the icefield with the eastern margin merging at a lateral moraine with Cubo Glacier.  The southern terminus extends to the bend in the Lago Dickson basin with a 1.5 km wide calving front. By 2000 the eastern terminus had separated from Cubo Glacier, retreating 1.5 km from Cubo Glacier. This led to the expansion of Lago Dickson and connection to the main lake.  Cubo Glacier terminates on a bedrock island in 2000, Point A, with a small lobe going north and beyond this island.  The southern terminus has retreated and terminates on two islands, pink arrow.  The islands acted as stabilizing points for the southern terminus up to 2010. This kept the width of the lake connection at 250-300m.  By 2016 the eastern terminus had retreated to the Dickson Glacier valley extending NW  to the SPI. Cubo Glacier still terminates at the Island, Point A, but the northern lobe is now gone.  The southern terminus has retreated from the bedrock islands, pink arrow.  In 2016 the southern terminus had a narrow tongue extending almost to the islands, pink arrow.  By 2017 this unstable terminus tongue had disintegrated and the terminus of Dickson Glacier is now a single 1.6 km wide front across the mouth of the NW trending valley to the SPI. The eastern terminus has retreated 2.9 km since 1985 and the southern terminus has retreated 1 km since 1985. Lago Dickson had a length of 11 km in 1985 and in 2017 is 15 km long.  The Dickson Glacier has lost most of its low elevation terminus lobe, which will reduce ablation.  The calving front overall length had declined leading to less calving losses.  Both factors should lead to a reduced rate of retreat in the near future.  Cubo Glacier remains pinned on the island at Point A, retreat from this spot will lead to further expansion of Lago Dickson. The retreat of this glacier follows the pattern of other glaciers on the east side of the SPI Olvidado Glacier,  Onelli Glacier and Grey Glacier

.

Dickson Glacier (D) retreat illustrated by 2000 and 2016 Landsat images. Red arrows the 1985 terminus position, yellow arrows the 2017 terminus position, C=Cubo Glacier, A=Island, pink arrow indicates where islands will form, purple dots indicate snowline and LD=Lago Dickson.

Map of terminus change of Dickson, Cubo and Frias Glacier from Rivera et al (2004)

Glaciar Olvidado, Chile Retreat Lake Expansion 1985-2017

Glaciar Olvidado (O) retreat illustrated in 1985 and 2017 Landsat images.  Red arrow is 1985 terminus location, yellow arrow is 2017 terminus location and purple dots are the snowline.  This illustrates an 1800 m retreat. 

Glaciar Olvidado (G) is a glacier in the southeast portion of the Southern Patagonia Icefield (SPI), adjacent to Grey Glacier (G).  The glacier terminates in a proglacial lake. Rivera and Casassa (2004) report the glacier terminating in a newly formed lake in 1986 and retreating slowly from 1986 to 2000.  Here we examine changes in the glacier from 1985 to 2017 using Landsat imagery.

In 1985 the glacier terminates in small newly formed proglacial lake that is just 200 m long.  The snowline in 1985 is at 1050 m. In 2000 the lake has expanded to a length of 900 m.  The snowline in 2000 is at 950 m.  By 2016 the proglacial lake has expanded to  a length of 2 km.  The snowline in 2016 is at 1100 m.  In 2017 the glacier has retreated 1800 m since 1986.  The snowline is at the base of the steep slopes at 1150 m.  The high snowline leaves less than 30% of the glacier in the accumulation zone.  The high snowlines indicate a limited accumulation zone, which generates a negative mass balance and drives retreat.  The glacier continues to calve into this terminus lake adding to the negative mass balance and consequent retreat.  This glacier adds to the growth of proglacial lakes seen in the Northern Patagonia Icefield  (Glasser et al 2016) and SPI (Iribarren et al 2014).  Olvidado Glacier retreat in terms of distance is similar to the adjacent Grey Glacier, but does represent 20% of its total length.  The retreat is much less than the HPS-12 glacier on the west side of the SPI. 

Glaciar Olvidado retreat illustrated in 2000 and 2016 Landsat images.  Red arrow is 1985 terminus location, yellow arrow is 2017 terminus location and purple dots are the snowline. 

Olvidado Glacier in 2016 Google Earth image. 


Queulat Norte Glacier, Chile Retreat Creates Two Lakes

 Queulat Norte Glacier in 1987, 2000 and 2016 Landsat images indicating retreat from 1987 (red arrow) to 2016 (yellow arrow). Green arrow indicates former tributary, orange arrow area of  new bedrock exposure and pink arrow expanding medial moraine. Two new lakes have formed due to the 1950 m retreat. 

Nevado Queulat, Chile is the centerpiece of the Queulat National Park in the Aysen Region.  The largest glacier draining the substantial ice cap on this mountain flows north draining into Lago Rosselot and then the Rio Palena.  Here we examine 1987 to 2016 Landsat imagery to identify changes in this glacier.    Paul and Molg (2014) observed a rapid retreat in general of 25% total area lost from glaciers in the Palena district of northern Patagonia from 1985-2011.

In 1987 the glacier terminates against the valley where the valley turns to the east, red arrow.  There is no lake at the terminus. The tributary at the green arrow connects to the main glacier.  There is no evident medial moraine at pink arrow.  There is no exposed bedrock in the accumulation zone at orange arrow.  In 2000 glacier retreat has exposed a new lake that is 900 m across.  The tributary at the green arrow is no longer connected.  A medial moraine s evident at the pink arrow and bedrock is exposed at orange arrow. By 2016 the glacier has retreated south of a second lake that is 700 m across.  Total retreat from 1987-2016 has been 1950 m, 65 m per year.  This is the loss of  15% of the entire glacier length.  The medial moraine has expanded up and downglacier indicating greater melting and an upward shift of the snowline.  The area at the orange arrow is a significant band of bedrock, indicating that this is no longer an accumulation zone. This bedrock is at 1700 m, the current terminus is at 600 m and the top of the glacier is at 2000 m, leaving only a 300 m elevation band in the accumulation zone. Examination of the region just above the terminus indicates significant ablation hollows/depressions indicative of stagnant ice, green arrows.  There is also an area of debris from a subglacial stream emerging at the surface yellow arrow. The retreat is as significant as that of Erasmo Glacier as a percentage of glacier size.


2016 Google Earth image of Queulat Norte Glacier indicating retreat from 1987 (red arrow) to 2016 (yellow arrow). Green arrow indicates former tributary, orange arrow area of  new bedrock exposure and blue arrows indicating flow. 

Stagnant nature of the lower glacier in 2016 with ablation hollows/depressions at green arrows and yellow arrow indicating sub-glacial stream that emerges at surface and deposits debris.