Duiya Glacier, China Retreat Drives Lake Expansion

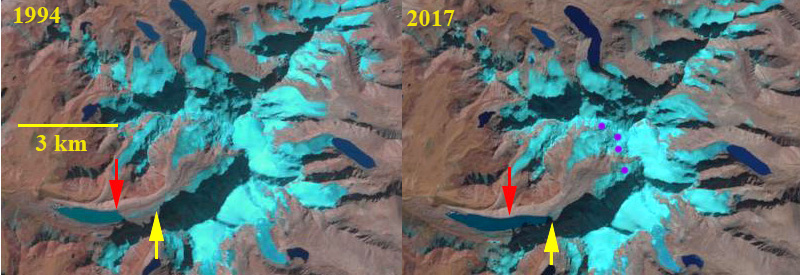
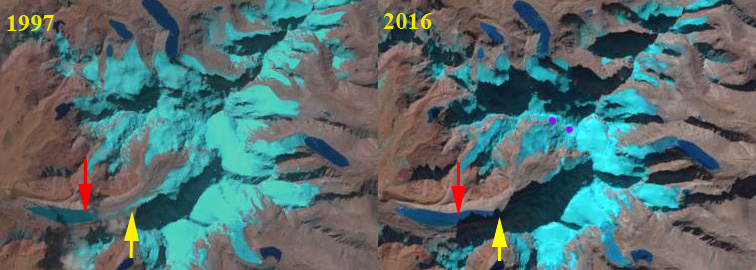
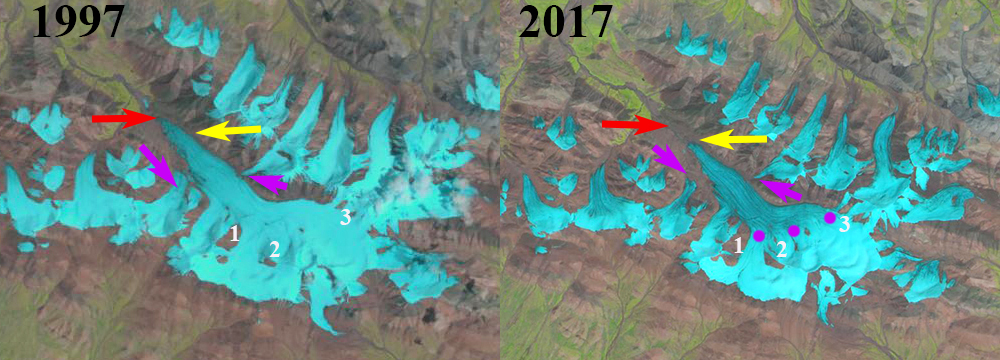
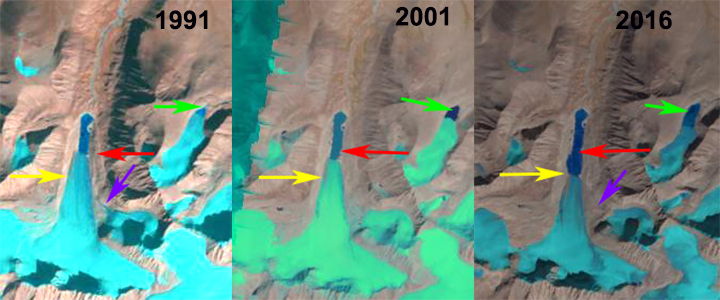
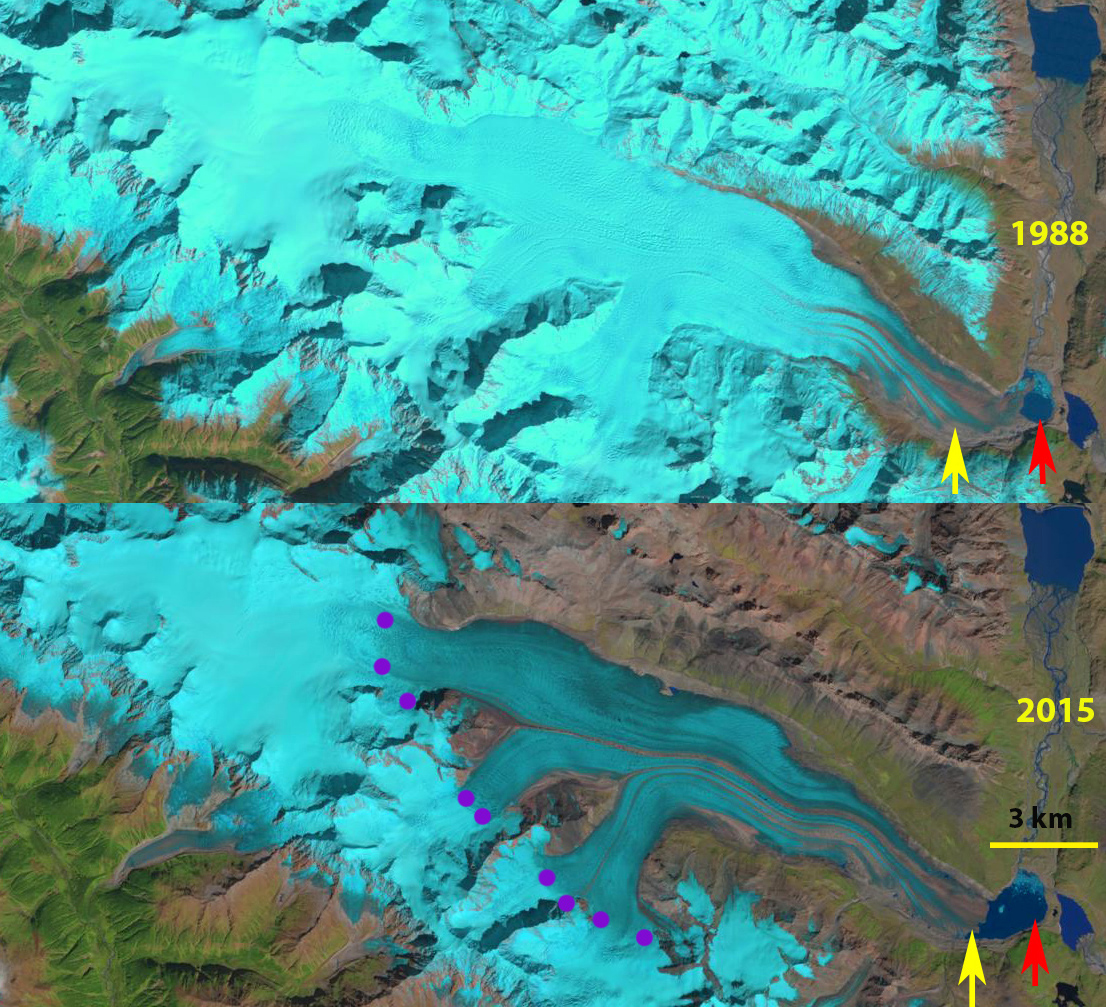
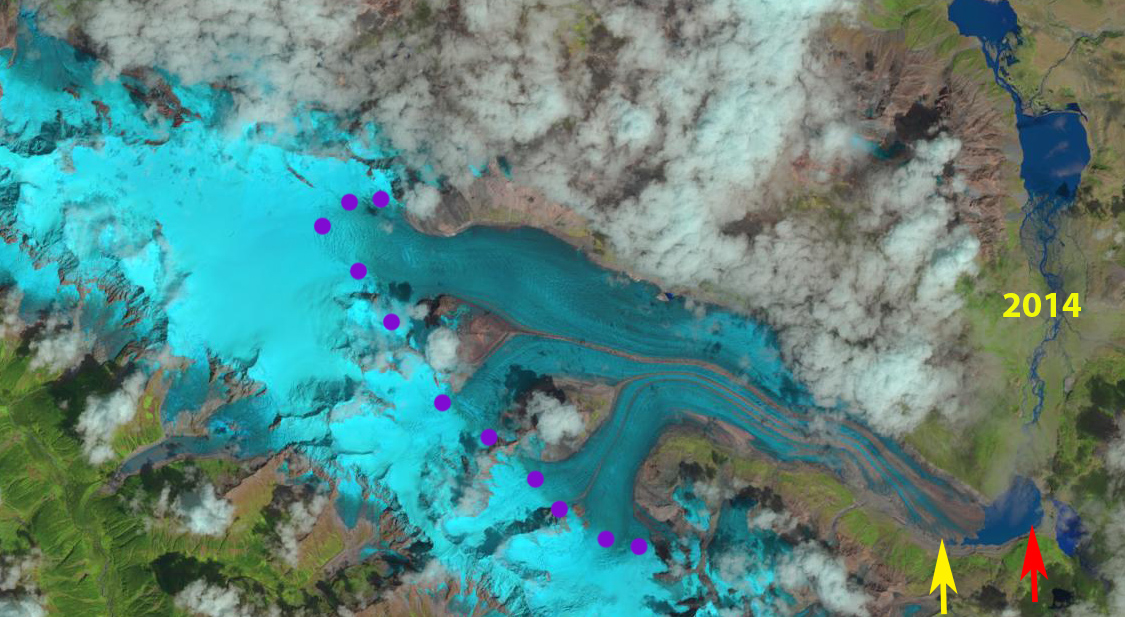
Duiya Glacier, China in 1990 and 2017 Landsat images.  Red arrow indicates 1990 terminus, yellow arrow the 2017 terminus, pink arrow the terminus area of Duosangpuxi purple dots the snowline

Duiya Glacier, China is in the Pumqu Basin northwest of Mount Everest.  The glacier terminates in an expanding lake.  King et al (2018) report the proglacial lake is dammed by a full moraine loop, and the glacier loses mass via calving as and surface melt.  Here we use Landsat imagery to identify changes from 1990-2018. The Pumqu River becomes the Arun River in Nepal , which has a proposed 900 MW hydropower plant under development .

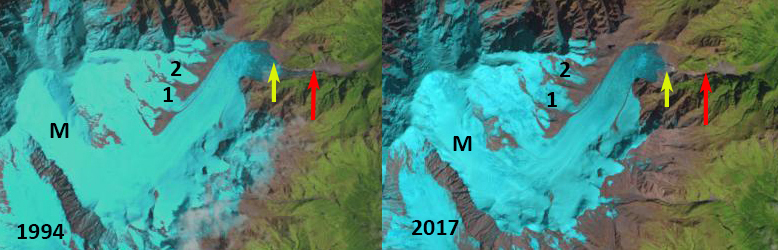
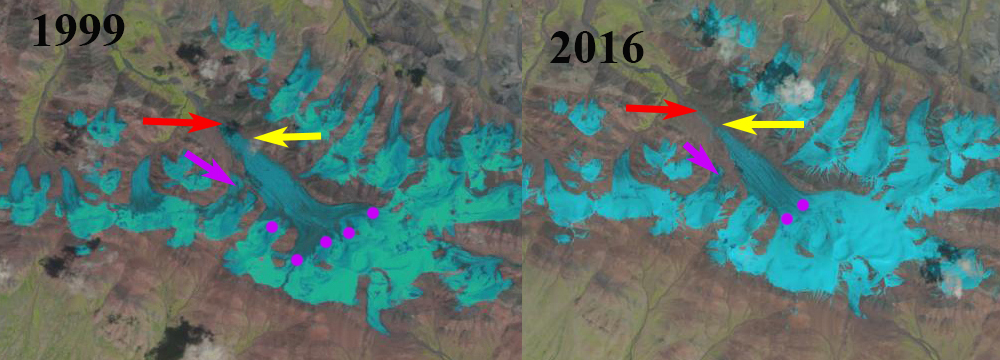
In 1990 the glacier terminated in a small proglacial lake, 500 m across at 5500 m.  The snowline in 1990 was at 6000 m.  The Duosangpuxi Glacier to the east also terminates in a proglacial lake.  In 2000 the lake has expanded to 800 m in length due to retreat.  The glacier snowline is at 6000 m again.   The Duosangpuxi Glacier to the east has retreated from the lake it formerly terminated in.  By 2017 the glacier had retreated 1020 m a rate of 37 m/year. The lake is now over 1.5 km long.  The snowline in 2017 is at 6200 m.  In September 2018 the snowline has likely not reached its highest elevation but is just below 6200 m.  The terminus is obscured by clouds, but has not changed significantly from 2017.  There icebergs in the lake indicating calving continues.  The high snowline in recent years indicate continued mass loss that will drive further retreat.

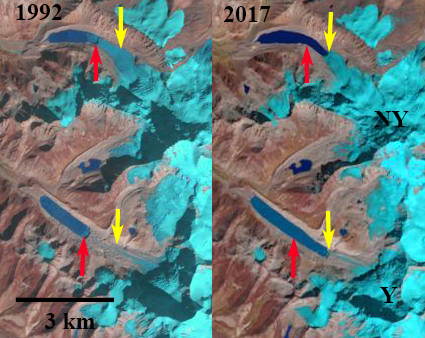
King et al (2017) examined the mass balance of 32 glaciers in the Everest region for the 2000-2015 period including the Duiya and found a mass loss of ~0.5 m/year, with the loss of lake terminating glaciers at ~-0.7 m/year.  The retreat of this glacier is like that of Yanong Glacier and Chaxiqudong Glacier whereas Rongbuk Glacier has experienced supraglacial lake expansion, and thinning without as much retreat.

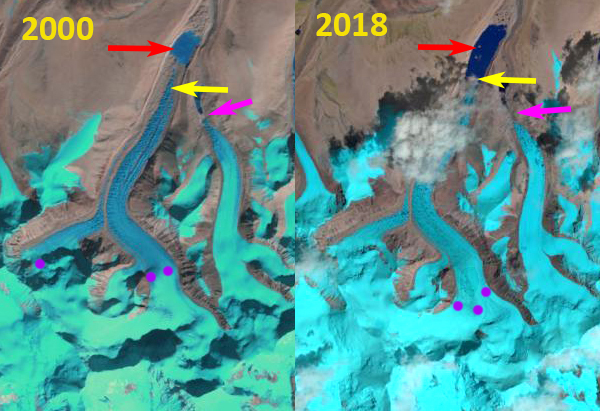
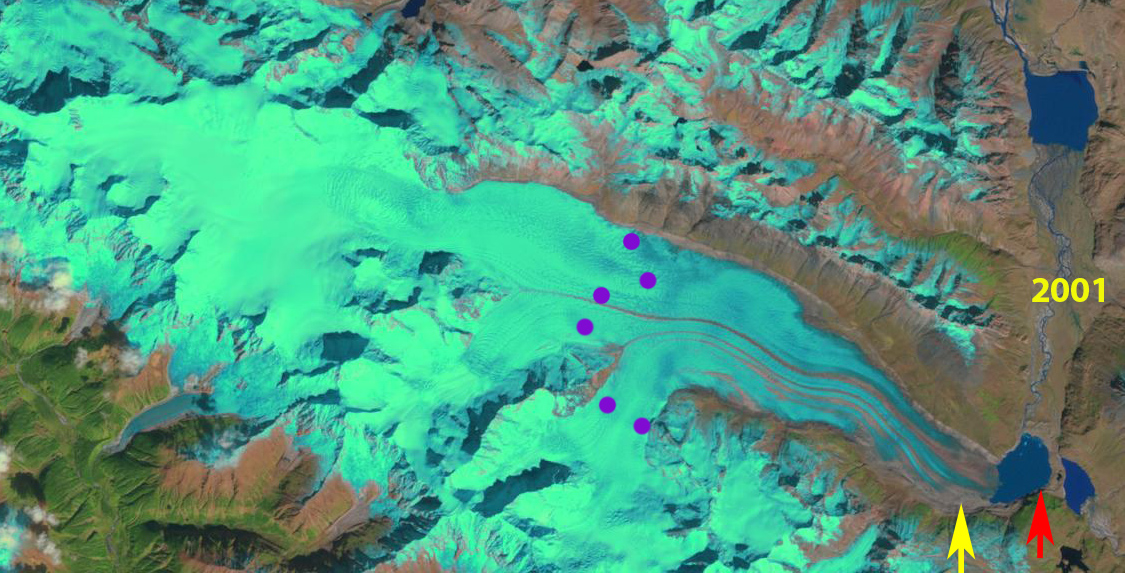
Duiya Glacier, China in 2000 and 2018 Landsat images.  Red arrow indicates 1990 terminus, yellow arrow the 2017 terminus, pink arrow the terminus area of Duosangpuxi purple dots the snowline.

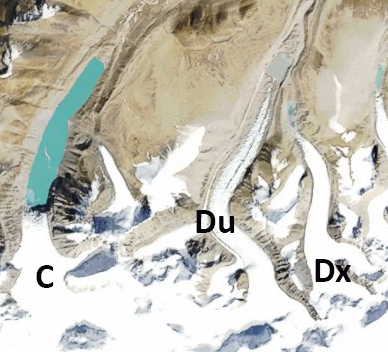
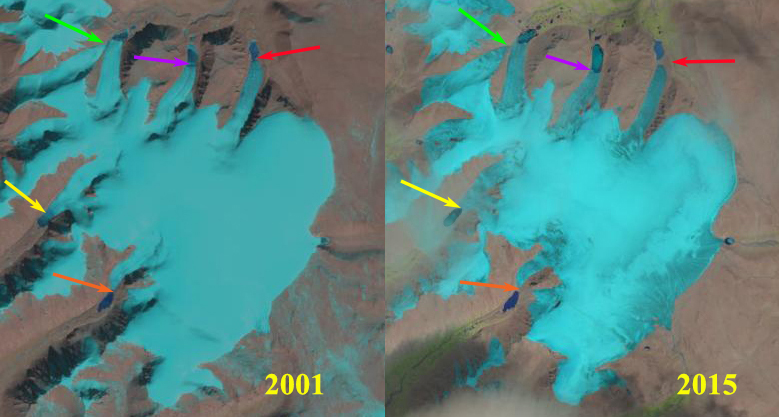
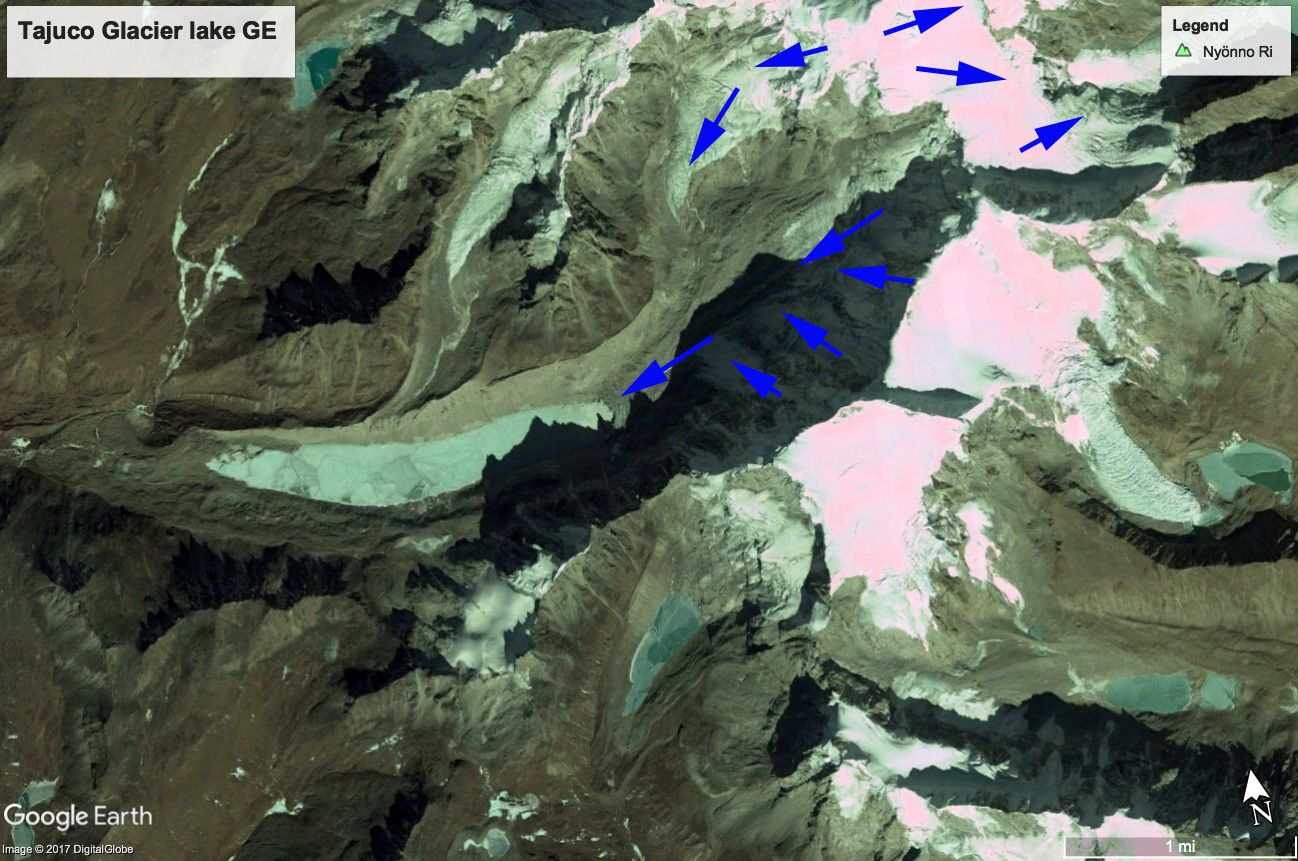
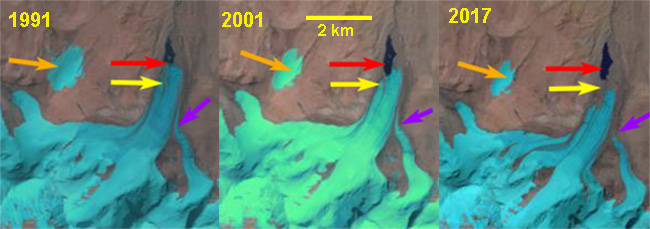
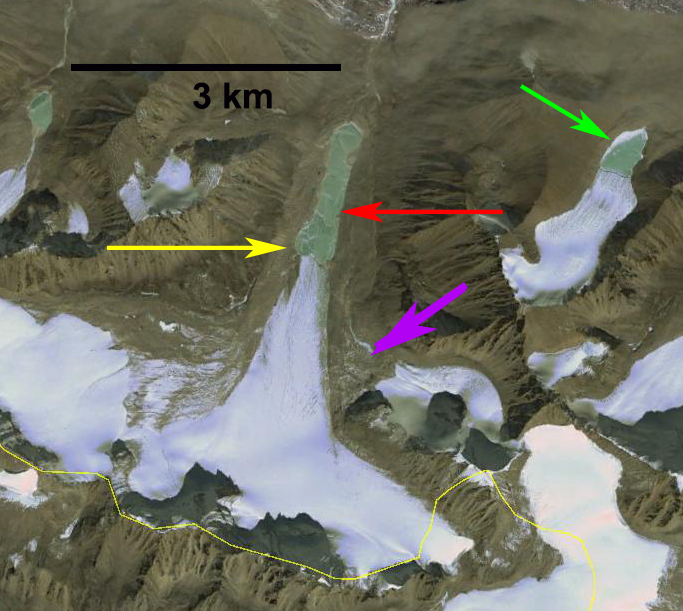
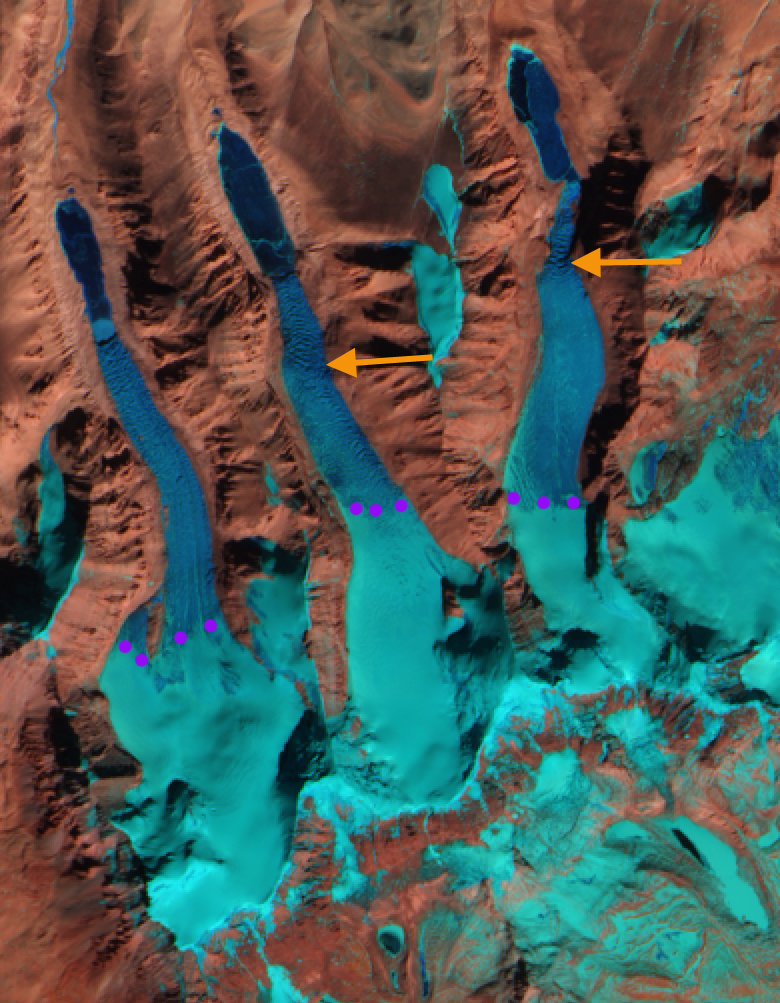
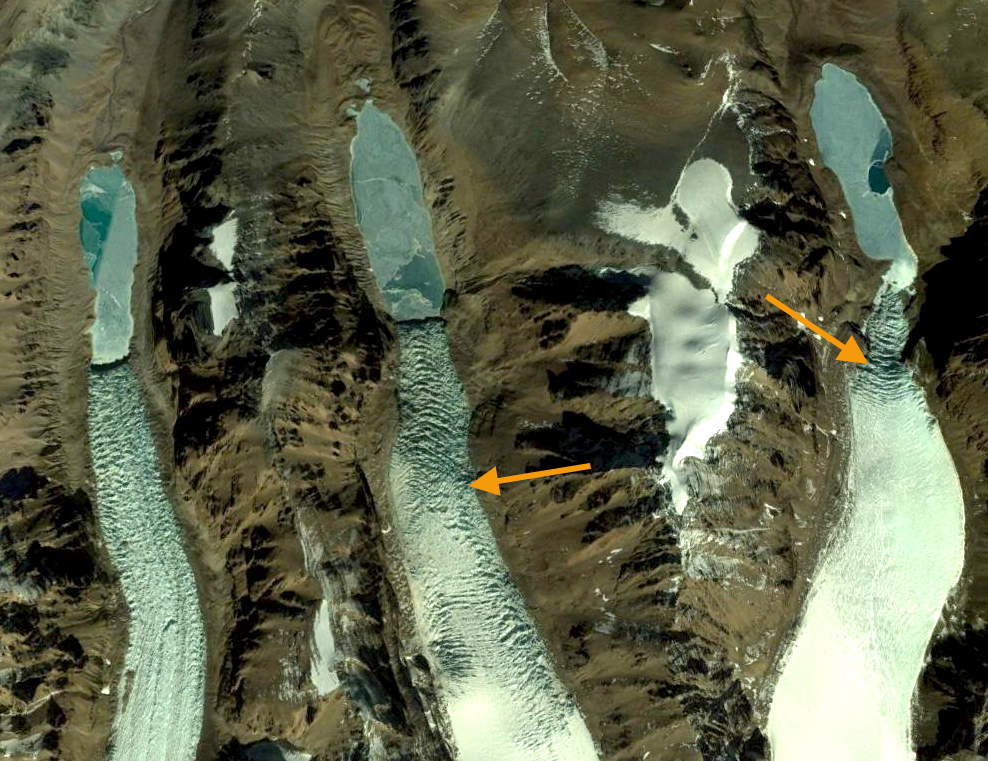
Broader view of the Duiya Glacier (Du) and neighboring glaciers Cuolangma (C) and Duosangpuxi (Dx), each terminating in a lake in 1990. 

Mount Tanggula Glaciers, China Thin and Separate

Changes in outlet glaciers of Tanggula Shan in Landsat images from 1993 and 2015. 

The Tanggula Shan is in the Qinghai-Tibet Plateau at the headwaters of the Yangtze River and host approximately 1000 square kilometers of glaciers. Ke et al (2017)  examined glaciers in the Dongkemadi Region of the Qinghai-Tibet Plateau revealed glacier thinning of 0.56 m/year from 2003-2008.  The area loss of  −0.31 km2/ year from 1976-2013, a 13% change int total area of the glaciers.  Chao et al (2017) examined glaciers in the Geladandong region of the Qinghai-Tibet Plateau and found thinning rates of 0.16 m/year from 2003-2009.  The thinning was a consequent of temperature increases. Inglis (2016)  reported on the ongoing retreats impact on water resources for the Yangtze River.

Here we examine Landsat imagery from 1993-2017 to identify changes at five locations around the Tanggula Icefield. In 1993 outlet glaciers merge at Point 1 and 2. At Point 2 there is a narrow separation between two outlet glaciers. At Point 4 and 5 there is considerable terminus recession of the stagnant hummocky ice (developed in a sublimating environment). Below is a Google Earth image of the glacier at Point #1 illustrating the hummocky nature, Inglis (2016)  also provide imagery of this hummocky ice. In 2015 the snowline is high at 5900 m,  in this early November image.  The terminus of most glaciers is at 5400 m and the head of the glaciers at 6100 m. In November of 2017 the snowline is at 5600 m.  The retreat has been significant, but not rapid in this area. This is similar to the retreat of the Suhai Hu Ice Cap in the Qilian Mountains.

Changes in outlet glaciers of Tanggula Shan in Landsat images from 1995 and 2017. 

Google Earth image of Tanggula Glacier outlet, Point #1. 

Mozigou Glacier Meltwater Pays High Hydropower Dividend

Mozigou Glacier is a valley glacier in the Gongga Mountains, Sichuan Province, China that drains into the Dadu River.  In the first 250 km after leaving the glacier this meltwater travels through seven hydropower projects that have a collective capacity of  over 9000 MW. Pan et al (2012) noted that the glaciers of the Gongga Shan have lost 11% of their area since 1966.  They further reported a 300 m retreat of Mozigou Glacier from 1994-2009. The glacier unlike its neighbor Hailuoguo Glacier does not have a debris covered terminus.  Liu et al (2010) report that the main change in the region affecting the glaciers is rising temperature.  The Gongga Shan glaciers are summer accumulation type with the majority of the accumulating snow occurring at the same time that ablation is at a peak lower on the glacier. They also report a steep precipitation gradient, which is key to glacier formation here. Here we examine Landsat imagery from 1994-2017 to indicate retreat of the glacier and Google Earth images of the hydropower projects to underscore the economic output of the runoff.

In 1994 the Mozigou Glacier had a thin terminus tongue extending downslope from the wide terminus area, red arrow.  The snowline is not far above the terminus. In 1995 the thin terminus tongue extending downvalley to the red arrow is still evident.  The snowline remains not far above the terminus.  By 2016 the thin 900 m long terminus tongue has melted away.  In 2017 the two lowest tributaries have been reduced in width. The  terminus is now on a lower sloped region and has extensive crevassing right to the terminus, see Google Earth image below. Both the reduced slope at the terminus and the rapid flow as indicated by the terminus suggest a glacier fed by high accumulation and one where retreat should diminish.

After a drop of water leaves the glacier it flows tinto the Dadu River where it pays dividends at the following: 35 km downstream is the Dagangshan Hydropower Station 2600 MW, 50 km downstream is the Longtoushi Hydorpower station is 700 MW, 115 km downstream is Pubugou Hydropower Station 3300 MW, 190 km downstream is  the Gongzui Hydropower Station 600 MW, 215 km downstream is the Tongjiezi Hydropower Station 700 MW,  225 km downstream is the  Shawan Hydropower station 480 MW and,  250 km downstream is the Angu Hydropower station 770 MW.

Suhai Hu Ice Cap, China Outlet Glacier Retreat

Suhai Hu, Quilian Mountains Ice Cap in 1999 and 2016 Landsat image indicating five different outlet glacier termini that all ended in proglacial lakes in 1999 and all retreated significantly by 2016. 

Here we examine an unnamed icecap that I refer to as the “Suhai Hu” Ice Cap and five of its largest outlet glaciers in the Qilian Mountains in northwest China, with Landsat imagery from 1999-2016.  The northern outlet glaciers drain into the Suhai Hu and the southern outlet glaciers into Quidam Hu. Glaciers in the Gansu Province have shrunk by 36 square kilometers, a 4.2 percent loss, during the past decade Quiang (2016).  Tian et al (2014) report Qilian Mountain glacier area shrank by 30% from 1956 to 2010 and the shrinkage accelerated remarkably in the past two decades.  Yang et al (2015)  Results show that mountain glaciers in China are very vulnerable to climate change with 41% of glaciers having had a high vulnerability in the period 1961–2007.

In 1999 all five outlets, indicated by arrows terminate in proglacial lakes, with the northwest outlet comprise of two tributaries that join just above the terminus.  In 2001 the outlets still terminate in glacier lakes.  By 2015 two of the outlet glaciers at the orange and red arrow have retreated from the proglacial lakes they had terminated in.  The northwest outlet glacier, green arrow, the tributaries had separated.  From 1999 to 2016 the proglacial lake at the purple arrow has expanded from 600 m in length to 850 m.  The lake at the yellow arrow expanded from 450 m in length to 850 m in length from 1999-2016. each of the five outlet glaciers has retreated significantly from 1999-2016.  All 8 summer Landsat images examined indicate the ice cap always has substantial retained snowcover, and will not disappear with current climate. In a close up view of the terminus of the yellow outlet glacier there are prominent crevasses near the calving ice front, green arrow and supraglacial streams , blue arrows. The retreat here is similar to but less than that observed at Gangg’er Glacier in the Shule River Basin, Qilian Mountains. 

Suhai Hu, Quilian Mountains Ice Cap in 2001 and 2015 Landsat image indicating five different outlet glacier termini that all ended in proglacial lakes in 2001 and all retreated significantly by 2015.


Google Earth image at the yellow outlet glacier. Green arrow indicates crevassing near front and blue arrows supraglacial streams. 

Qiaqing Glacier Retreat & Lake Expansion, China

Qiaqing Glacier in 1992 and 2017 Landsat images indicating flow, blue arrows, 1992 terminus at red arrow and 2017 terminus at yellow arrow. tributaries A, B and C. 

“Qiaqing” Glacier drains southeast from the Kona Kangri Massif at the eastern part of the Nyainqentanglha Shan. The glacier ends in a lake before feeding into the Parlung Zangbo and then Yarlung Tsanpo. This glacier feeds the Parlung Zangbo which is the site of numerous planned hydropower projects, last image, before joining the Yarlung Tsanpo which becomes the Brahmaputra River. The Zangmu Dam went online in 2015, this hydropower facility will produce 2.5 billion kilowatt-hours of electricity a year.  Wu et al. (2016) examined glacier change in the Nyainqentanglha Range from 1970-2014 noting an accelerating shrinkage of glaciers,with glacier area decreasing by 244  km2 or ~27%, with the western part of the range faring worse.  Wang and others (2011) note in the nearby Boshula Range that glacial lakes have expanded from 1970-2009 by 19% and the area that is glacier covered has decline by 13% during the 1970-2009 period.

Here we examine Landsat images from 1992 to 2017 to identify changes of Qiaqing Glacier. In 1992 the glacier terminated in a 1.5 km long proglaical lake with tributary A just separated from the glacier and tributary B and C joining the glacier on a wide front. In 1999 the snowline is at 5200 m the glacier has retreated several hundred meters and the blue ice of tributary B and C still reach the main glacier.  In 2015 the snowline is at  5000 m.  In 2016 the snowline is at 5200 m, a few icebergs are visible in the lake and tributary B and C  are disconnecting from the glacier, and the terminus has retreated upvalley from the former location of connection with tributary A.  By 2017 the terminus has retreated  1700 m since 1992, a rate of ~68 m/year.  The proglacial lake is now over 3 km long. The retreat is enhanced by the lake, but not driven by it.  The high snowlines above 5000 m leave an insufficient accumulation zone to maintain the current glacier size. The retreat here is similar to that of Thong Wuk Glacier and Jiongla Glacier.

Qiaqing Glacier in 1999, 2015 and 2016 Landsat images; 1992 terminus at red arrow and 2017 terminus at yellow arrow.  Purple dots indicate the snowline. 

Tajuco Glacier Lake, China Expands with Glacier Retreat

Tajuco Glacier terminating in Tajuco Lake retreat in 1994 and 2017 Landsat comparison. Red arrow is 1997 terminus location, yellow arrow is the 2017 terminus location and the purple dots are the snowline in 2017. 

Tajuco Glacier Lake is a moraine dammed glacier lake in the Tingri district of China.  It drains into the Amur River which flows south into Nepal. Shijin et al (2015) reported on the expansion of the lake from 1990 to 2010 expanding from 0.65 square kilometers to 1.14 square kilometers.  They further reported that the Chinese Himalaya had 329 moraine dammed glacier lakes greater than 0.02 square kilometers in area, 116 of these posing a potential hazard, average size of 0.4 square kilometers. The number of lakes across the region is increasing (Kathmandu Post, 2017), though the number of GLOF’s has not.  The greater volume of expanding lakes puts more pressure on the moraine, the moraines if they have any ice core or permafrost can also weaken,  The moraines with time and distance from the glacier also can consolidate and become more stable.

In 1994 Tajuco Lake was 1.85 km long and had an area of about 0.7 square kilometers.  The snowline was at 6400 m.  In 1997 glacier retreat had led to an expansion of the lake to 2.05 km.  By 2016 the glacier retreat had led to expansion of the lake to a length of 3 km.  The snowline is at 6500 m near the crest of the glacier.  By 2017 the glacier had retreated 1200 m from 1994 to 2017, a rate of 24 m/year. The snowline was again at 6500 m near the crest of the glacier.  The high snowline indicates a glacier that will not survive. retreat will continue to expand the lake.  It is likely based on the Google Earth imagery below that the lake will not increase by more than 500 m in length, area in 2017 is 1.20 square kilometers. The retreat and lake expansion is similar to that of other glaciers on the north side of the Himalaya Range in China; Chaxiqudong Glacier, Chutanjima Glacier and Yanong Glacier. The high snowlines have been observed on nearby Rongbuk Glacier at Nup La and on Gangotri Glacier.

Tajuco Glacier terminating in Tajuco Lake retreat in 1997 and 2016 Landsat comparison. Red arrow is 1994 terminus location, yellow arrow is the 2017 terminus location and the purple dots are the snowline in 2016. 

Google Earth image of Tajuco Glacier illustrating flow. 

Yanong Glacier, Tibet Retreat Lake Expansion 1992-2017

Yanong Glacier and North Yanong glacier in Landsat images form 1992 and 2017.  Red arrows indicate 1992 terminus and yellow arrows the 2017 terminus. 

Yanong Glacier  and North Yanong Glacier drain northwest from the western flank of Cho Oyu on the Nepal-China border and are in the Tama Khosi watershed.  The glacier terminates in an expanding proglacial lake like a number of neighboring glaciers Drogpa NagtsangRongbuk Glacier and Lumding Glacier King et al (2017) observe that both Yanong and North Yanong have had large negative balances of -.76 m/year and -0.62 m/year respectively.  They also note surface lowering of 3 m per year in the lower ablation zone.  Zhang et al (2010) observed the loss of glacier area and lake expansion in the region from 1976-2006. Here we examine Landsat imagery from 1992 to 2017 to observe changes.

In 1992 the Yanong Glacier and North Yanong Glcier terminate at the red arrows.  The proglacial lake at Yanong is 1.7 km long and is 1.3 km long at North Yanong. By 2001 significant retreat of 200-200 m has occurred on each glacier.  By 2015 Yanong Glacier has retreated east of the a former tributary from the north. The North Yanong glacier is now wider at the terminus than in 2001. In 2017 the proglacial lake at Yanong Glacier is 2.8 km long indicating a retreat since 1992 of 1100 m.  The North Yanong Glacier proglacial lake is 2.1 km long indicating a retreat since 1992 of 800 m.  The steep crevassed nature of North Yanong Glacier right to the terminus suggests the glacier is nearing the end of the lake basin.  The Yanong Glacier has a low slope terminus area that suggests the lake will continue to expand.  The Upper Tamakoshi Hydropower project is a 456 MW peaking run of river  is a hydropower project on the Tamakoshi that is just to be finished in 2018.

Yanong Glacier and North Yanong glacier in Landsat images form 2001 and 2015.  Red arrows indicate 1992 terminus and yellow arrows the 2017 terminus. 

Digital Globe image of Yanong Glacier note the low slope terminus tongue below steep crevassed icefall section, red arrows.

Digital Globe image of  North Yanong Glacier note the l steep crevassed icefall section, red arrows that leads right to the terminus. 

Gangge’er Glacier, Retreat & Tributary Separation Qilian Mt. China

Gangge’er Glacier, Qilian Mt., China comparison in 1997 and 2017 Landsat Images.  Yellow arrows indicates 2017 terminus, red arrows the 1990 terminus, and purple arrows tributaries that have detached.  The snowline is  purple dots and Points 1-3 indicate bare rock areas amidst the glacier.

The largest glacier in the Gangge’er Xiaoheli Shan range of the the Qilian Mountains in China, here referred to as Gangge’er Glacier, drains northwest into the Shule River.   Glaciers in the Qilian Mountains in northwest China’s Gansu Province have shrunk by 36 square kilometers, a 4.2 percent loss, during the past decade Quiang (2016).  Tian et al (2014) report Qilian Mountain glacier area shrank by 30% from 1956 to 2010 and the shrinkage accelerated remarkably in the past two decades.  Yang et al (2015)  Results show that mountain glaciers in China are very vulnerable to climate change with 41% of glaciers having had a high vulnerability in the period 1961–2007. For the Upper Shule Basin the impact of glaciers on the overall water resource is not known as Li  and Yang (2017) observe that  that the basic features of precipitation in the upper reaches of the Shule River were unexplored prior to their study and there is no national weather station in the basin.  They found that most of the precipitation occurred during the summer. 

What is apparent in a comparison of Landsat images from 1997-2017 is the changes in the glacier.  In 1997 the glacier is joined by three main tributaries from the south and four from the north.  The western most from the north and south are noted by the purple arrow.  The glacier terminates at the red arrow and the snowline is low on the glacier at 4600 m, likely after a summer snowstorm. The areas of bedrock amidst the glacier at Points 1-3 are limited.  In 1999 the snowline is above the main stem of the glacier at 4800 m.  There has been limited change since 1997, there is a small cloud causing a ground shadow right at the terminus.  By 2016 and 2017 the westernmost tributary from the north and south have detached from the glacier , purple arrows.  The areas of bedrock amidst the glacier at Point 1-3 have all expanded indicating upglacier thinning.  The terminus has retreated to the yellow arrow a distance of 900 m in 20 years.  In the digital globe image below extensive surface streams indicate significant meltwater drainage up to 4900 m, above the snowline in both images. The surface streams indicate a cold layer of ice preventing surface meltwater infiltration.  


Gangge’er Glacier, Qilian Mt., China comparison in 1999 and 2016 Landsat Images.  Yellow arrows indicates 2017 terminus, red arrows the 1990 terminus, and purple arrow tributary that has detached.   Points 1-3 indicate bare rock areas amidst the glacier.


Google Earth image of the glacier indicating flow directions dark blue arrows, surface streams light blue arrows and separated tributaries purple arrows.

Chako Glacier, Tibet Retreats From Proglacial Lake

Chako Glacier, Tibet in Landsat images from 1991, 2001 and 2017.  Red arrow indicates 1991 terminus, yellow arrow 2017 terminus, purple tributary glacier connection and orange arrow nearby icecap.

Chako Glacier flows north from Chako Peak on the Nepal-Tibet, China border, in the Lugula Himal.  Glacier runoff eventually reaches the Yarlung Tsangpo and then the Brahmaputra River. Gardelle et al, (2013) identified this glacier as part of their West Nepal region, which experienced mass loss averaging -0.32 m/year from 1999-2011. This mass loss has driven wide spread retreat of glaciers along the border ranges between India/Nepal and Tibet.  In Tibet west and east of Chako Glacier are the retreating Menlung Glacier, West Ganglung Glacier and Chutenjima Glacier.

In 1991 the glacier terminated in a proglacial lake at 5450 m red arrow, with a key tributary entering from the east, purple arrow. An ice cap just west of the glacier has a width of 700 m. In 1994 there is little evident change. By 2001 the glacier has retreated to the southern end of the lake basin, with the eastern tributary still connected.  In 2005 the terminus remains heavily crevassed and still in contact with the lake.  By 2016 the eastern tributary no longer connected with Chako Glacier and the glacier no longer reaches the lake.  In 2017 the glacier has retreated 600-700 m since 1991 with limited crevassing at the terminus.  The terminus is notably thinner as well.  The loss of crevassing and connection with the tributary from the east indicates retreat is ongoing. The icecap to the west has been reduced in area, the width being 450 m in 2017. The images are typically from September-November and do not show the snowline at the highest elevation. The expansion of three bedrock areas separating tributaries and generating lateral moraines indicate upglacier thinning as well.


Chako Glacier, Tibet in Landsat images from 1994 and 2016.  Red arrow indicates 1991 terminus, yellow arrow 2017 terminus, purple tributary glacier connection and orange arrow nearby icecap.

Google Earth image of Chako Galcier terminus in 2005 and 2017.  Note difference in crevassing.  red arrow 2005 terminus and yellow arrow 2017 terminus.

Chako Glacier, with Chako Peak indicated by green triangle.

West Ganglung Glacier, Tibet Glacier Loses 20% of Length

Landsat image comparison from 1991, 2001 and 2016 of West Ganglung Glacier, red arrow is the 1991 terminus, yellow arrow the 2016 terminus, green arrow the eastern glacier proglacial terminus lake and purple arrow expanding zone between a former tributary and West Ganglung Glacier

West Ganglung Glacier is on the China-India border 6 km west of Ganglun Grangri Peak meltwater enters the Sultej River and then Mapam Tso.  the glacier terminates in a proglacial lake at 5200 m with its head on the border at 5750 m. This region is part of the Indus Basin, the second China glacier inventory noted a 23% decline in glacier area from 1970 to 2007 (Guo et al 2015) Assessing the sensitivity of the Sutlej River basin to climate change Miller et al (2012) noted that with a warmer climate melt contributions from lower parts are reduced because of decreased snow cover and a shorter melting season.  Significant glacier area loss will also lead to less runoff despite an increase in rate. Singh et al (2012) noted a decline in runoff from the Sutlej basin after 2000, whereas there had been a rise before that. 

Here we examine teh unnamed West Ganglung Glacier change from 1991 to 2016 in a series of Landsat images. In 1991 the glacier terminates at the red arrow, and the lake is 1050 m long. At the glacier just to the east there is a small proglacial lake 200 m long. By 2001 glacier retreat had led to lake expansion to 1400 m long. The proglacial lake at the end of the eastern glacier is now 350 m long. By 2016 the proglacial lake at the terminus had expanded to a length of 1850 m, a retreat of 800 m in 27 years.  The proglacial lake at the terminus of the eastern glacier in 2016 is 650 m long, indicating a retreat of 450 m.  In both case the retreat is a significant loss of overall glacier length, ~20%.  The purple arrow indicates the increasing separation between a tributary and the West Ganglung Glacier glacier.

Google Earth image of West Ganglung Glacier, red arrow is the 1991 terminus, yellow arrow the 2016 terminus, green arrow the eastern glacier proglacil terminus lake and purple arrow expanding zone between a former tributary and West Ganglung Glacier


Landsat image from2014 of West Ganglung Glacier, red arrow is the 1991 terminus, yellow arrow the 2016 terminus, and green arrow the eastern glacier proglacial terminus lake.

Laigu Glacier, China Retreat Lake Expansion

laigu-compare

Landsat image comparison of the Laigu Glacier in 1988 and 2015.  The red arrow indicates the 1988 terminus and the yellow arrow the 2015 terminus location.  The purple dots in 2015 indicate the snowline.

Laigu (Lhagu) Glacier, China is in the Kangri Karpo Mountains of the Southeast Tibet Plateau and drains into the Salween River.  This is the largest glacier in its region at 32 km in length.  The glacier terminates in an expanding proglacial lake, Laigu Lake.  Here we examine changes in Landsat imagery from 1988 to 2015 to identify response to climate change. Wang and others (2011) note that glacial lakes have expanded from 1970-2009 by 19% and the area that is glacier covered has decline by 13% during the 1970-2009 period in the nearby Boshula Range. At the AGU this week research based on Landsat imagery indicates a 20% per decade velocity decline on the glacier (Landsat Science, 2016).

In 1988 Laigu Glacier terminated in the proglacial lake that was 2 km across from north to south and 1.3 km from east to west. By 2001 the lake had expanded to 1.6 km from east to west.  The transient snow line is at 4300 m.  In November, 2014 the snowline is at 4700 m. In October, 2015 the snowline is at 4700 m again.  The glacier has retreated 1900 m from its 1988 terminus along the southern shore of the expanding lake and 900 m along the northern shore.  The expansion of the lake along the southern shore is evident in the 2004 and 2014 Google Earth segmented image below, note the pink arrows.  The high snowline indicate a reduced accumulation, which reduces the flux into the ablation zone, this is evident in the reduced glacier velocity noted by Dehecq (2016).  The reduced velocity will lead to a continued retreat of the glacier and expansion of the lake. This region has experienced a sustained rise in summer temperatures (Wang and others, 2011).  The snowlines remaining high into November indicates warmer conditions in the post summer monsoon season also.  The high snowlines and lake expansion due to glacier retreat is a familar story in the region, Chutanjima Glacier and Menlung Glacier.

laigu-2001

Landsat image comparison of the Laigu Glacier in 2001.  The red arrow indicates the 1988 terminus and the yellow arrow the 2015 terminus location. The purple dots in 2001 indicate the snowline.

laigu-2014

Landsat image comparison of the Laigu Glacier in 2014.  The red arrow indicates the 1988 terminus and the yellow arrow the 2015 terminus location.  The purple dots in 2014 indicate the snowline.

laigu-ge

Google Earth image of the region indicating the lake expanding from the pink arrow at right to the pink arrow at left from 2004 to 2014.boshula-climate

Summer temperature rise form Wang and others (2011)

Chutanjima Glacier Retreat & High Snowline, Tibet, China 1991-2015

mugunong glacier tibet compare

A comparison of three Tibet glaciers in 1988, 1991 and 2015 Landsat images. Red arrows are the 1988 terminus position, yellow arrow the 2015 terminus location and purple dots the snowline in late October 2015.  U=unnamed, CH=Chutanjima Glacier and MO=Mogunong Glacier: which did not retreat significantly and lacks a red arrow.

A recent European Space Agency Sentinel-2A image of southern Tibet, China and Sikkim illustrated three very similar glaciers extending north from the Himalayan divide on the China-India Border. We examine these three glacier in this post. The three glaciers all drain into the Pumqu River basin, which becomes the Arun River. The largest is unnamed the two easternmost are Chutanjima and Mogunong Glacier.The glaciers all have similar top elevations of 6100 -6200 m and terminus elevations of 5260-5280 m.  All three are summer accumulation type glaciers with most of the snow accumulating during the summer monsoon, though this is also the dominant melt period on the lower glacier.  Wang et al (2015) examined moraine dammed glacier lakes in Tibet and those that posed a hazard, none of the three here were identified as hazardous.  The number of glacier lakes in the Pumqu Basin has increased from 199 to 254 since the 1970’s with less than 10% deemed dangerous, but that still leaves a substantial and growing number (Che et al, 2014). Here we compare Landsat images from 1988, 1992  and 2015 to identify their response to climate change.   The second Chinese Glacier inventory (Wei et al. 2014) indicated a 21% loss in glacier area in this region from 1970 to 2009.The pattern of retreat and lake expansion is quite common as is evidenced by other area glaciers, such as Gelhaipuco, Thong Wuk, Baillang Glacier and Longbashaba Glacier.

In the 1988 image all three glaciers terminate at the southern end of a proglacial lake with seasonal lake ice cover, red arrows.  In 1991 the lakes are ice free and have some icebergs in them.  By 2015 the retreat has been 500 m for the easternmost glacier, 400 m for Chutanjima Glacier and 100 m at most for Mogunong Glacier. Each glacier has remained extensively crevassed to the terminus indicating they remain vigorous.  The retreat is greatest for the two ending in expanding lakes.  Mogunong Glacier appears to be near the upper limit of the lake, and is not calving, which likely led to less retreat. An icefall is apparent 700 m from the front of Mogunong Glacier.  The width of the glacier below this point has diminished considerably from 1988 to 2015, though retreat has been minor, indicating a negative mass balance.  There is an icefall 1 km from the icefront of Chutanjima, indicating the maximum length the lake would reach.

The Sentinel image indicates an important characteristic and trend in the region.  This is an early February image and the snowline is quite high on the glacier in the midst of winter.  The snowline is at 5850-5900 m nearly the same elevation as in late October of 2015 seen above. This illustrates the lack of winter accumulation that occurs on these summer accumulation glaciers.  It also indicates a trend toward ablation processes remaining active, though limited from November-February.  The lack of snowcover on the lower glaciers as the melt season begins hastens ablation zone thinning, mass balance loss and retreat.

mugunong glacier 2016

Europenan Space Agency, Sentinel-2A image from 1 February 2016. Orange arrow indicates icefalls and purple dots the snowline.

mogunong ge
2014 Google Earth image of the region. Orange arrows indicate icefalls, note the crevassing extending to glacier front.