Fourpeaked Glacier drains east from the volcano of the same name in the Katmai region of southern Alaksa. The Park Service in a report (Giffen et al 2008) noted that the glacier retreated 3.4 km across a broad proglacial lake that the glacier terminates in from 1951-2986, a rate of 95 m/year. From 1986-2000 they noted a retreat of 163 m, or 13 m/year. In a more recent report with the Park Service Arendt and Larsen (2012) provide a map of the change in glacier extent from 1956-2009, Figure 4, but note the poor data overall on historic changes of Fourpeaked. Here we utilize Landsat imagery to examine retreat from 1981 to July 2014.

Google Earth image
A Landsat 2 image from 1981 with relatively low resolution indicates much of the proglacial lake still occupied by ice, but much of this is floating icebergs detached from glacier, which is hard to distinguish in this image. In each image the red arrow is the 1985 terminus and the yellow arrow is 2013-2014 terminus. In 1985 the terminus is at the red arrow, with considerable floating ice still evident that is not part of the glacier. The snowline, purple dots, is at 750-800 m though this is not near the end of the summer. By 2000 the floating ice is gone, and the terminus has retreated into a narrower inlet. The snowline is at 850 m. By 2013 the glacier has receded further up this inlet and the width of the lower glacier is less. This is a July image and the snowline is still relatively low. In the July 2014 image the snowline is quite high at 700 m, given that this is mid-summer. It is not apparent in the Landsat image, but the large local forest fires in the spring could reduce albedo and enhance melt this summer. The terminus has retreated 1.9 km from 1986 to 2014 a rate of 68 m/year. The retreat from 1981-2000 was fed by calving in a broad proglacial lake. From 2000-2014 the retreat has continued despite the narrowing of the calving front. That the glacier has narrowed even more and thinned in the lower reach is indicative of a retreat that will continue. This glacier is behaving like other Katmai area glaciers, Giffen et al (2008) noted that 19 of 20 are retreating. The glacier retreat has led to formation and expansion of a large lake much like other glaciers in the region; Bear Glacier, Excelsior Glacier and Pedersen Glacier. The last image is an animated gif created by Espen Olsen illustrating the change in the glacier. 
1981 Landsat image
Category: Glacier Observations
Chilung Glacier Retreat, India
East of the Chilung La and 20 km northwest of Durung Drung Glacier draining into the Sankpo (Suru) River is an unnamed glacier, here referred to as Chilung Glacier. The Suru River flows northwest from Pensi La, while the Zanskar River flows southeast from the Pensi La. The Suru River has a 44 MW hydropower project at Chutak. The glacier is 6 km long starting at 5400 m and terminating at 4400 m.

Topographic map of region
An examination of Landsat imagery from 1998-2013 indicate the expansion of a proglacial lake at the terminus and glacier retreat. The 1998 terminus is marked by a pink arrow in each image. The yellow and green arrow indicate adjacent small glaciers. In 1998 the proglacial lake is 1100 m long and in 2000 it is 1200 m long. By 2005 the glacier has retreated 200 m and the lake is 1400 m long. In 2013 the lake is 1650 m long, and the glacier has retreated 400-450 m since 1998. The retreat rate of 30 m/year is slightly faster than on Durung Drung. A comparison of the adjacent small glaciers on the slopes above Chilung Glacier, yellow and green arrows, from 2000 to 2013 indicate a loss in area of these glaciers as well. Google Earth imagery in 2000 indicates that lower 900 m of the glacier is uncrevassed and relatively stagnant, by 2013 half of this area has been lost. The lake is shallow and may not expand much further as the glacier retreats. The consistent nature of the retreat in this area was noted by Kulkarni (2014)indicating retreat of 12 of the 13 observed glaciers in the region during recent decades. Glacier thinning has exceeded the rate of retreat on many glaciers in this area, indicating that retreat is likely to increase. 
1998 Landsat image
Alpine Glaciers-BAMS State of the Climate 2013
The post below is the chapter from the BAMS State of the climate 2013, that I author each year.
Full report which is the most comprehensive assessment of climate in 2013.
Alpine Glaciers – Mauri S. Pelto
The World Glacier Monitoring Service (WGMS) record of mass balance and terminus behavior (WGMS, 2013) provides a global index for alpine glacier behavior. Mass balance was -638 mm in 2012, negative for the 22nd consecutive year. Preliminary data for 2013 from Austria, Canada, Nepal, New Zealand, Norway, and United States indicate it is highly likely that 2013 will be the 23rd consecutive year of negative annual balances. The loss of glacier area is leading to declining glacier runoff, since globally 370 million people live in river basins where glaciers contribute at least 10% of river discharge on a seasonal basis (Schaner et al, 2012).

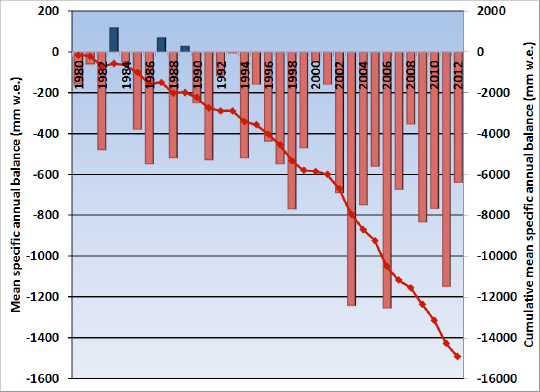
Figure 1: The mean annual balance reported for the 30 reference glaciers to the WGMS. And the cumulative annual balance for the reference glaciers 1980-2012.
Alpine glaciers have been studied as sensitive indicators of climate for more than a century, most commonly focusing on changes in terminus position and mass balance. The worldwide retreat of mountain glaciers is one of the clearest signals of ongoing climate change (Haeberli et al, 2000). The retreat is a reflection of strongly negative mass balances over the last 30 years (WGMS, 2013). Glacier mass balance is the difference between accumulation and ablation.
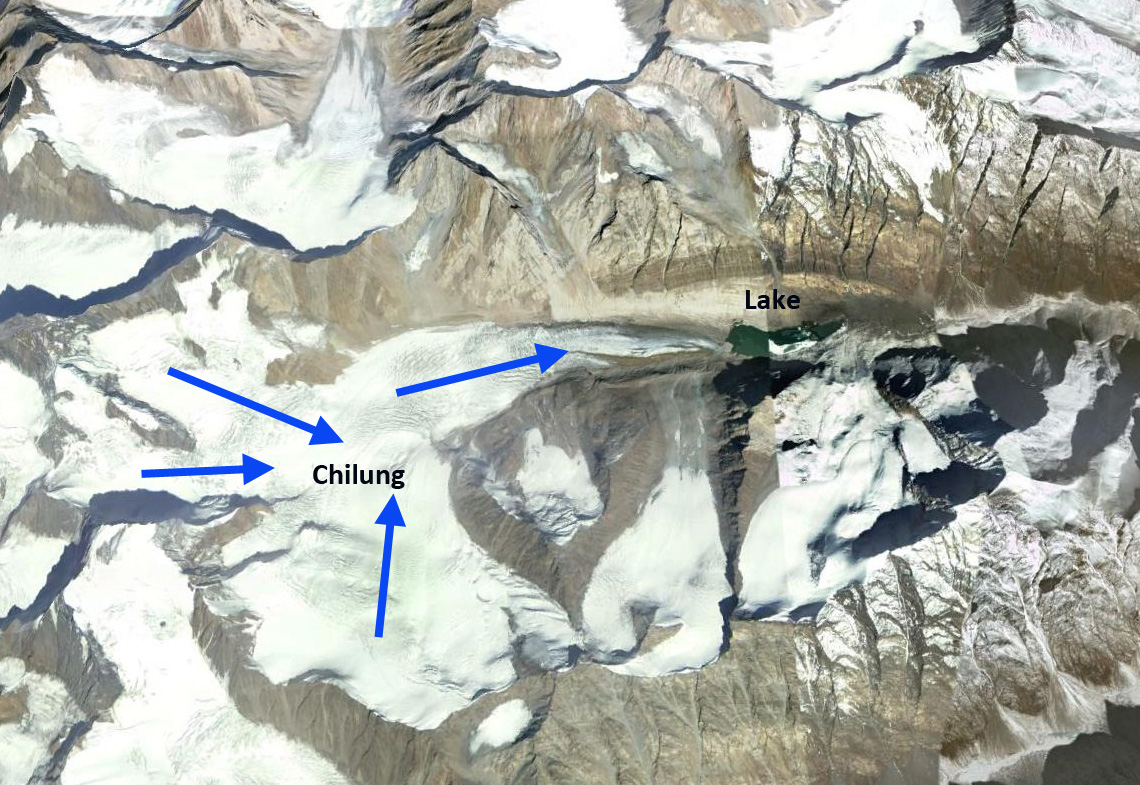
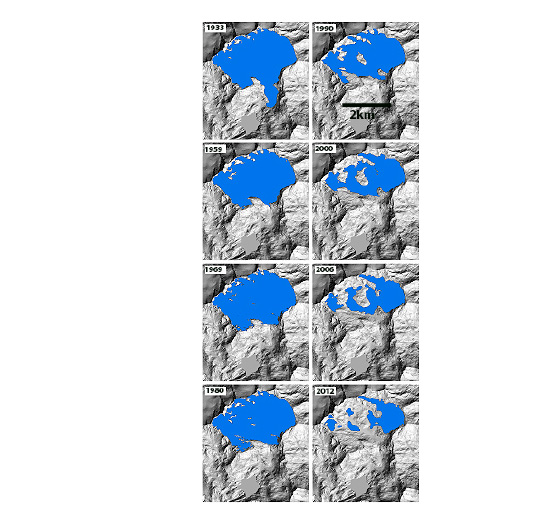
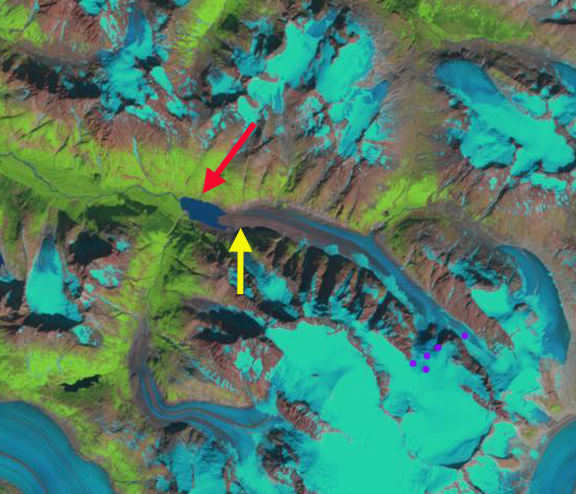
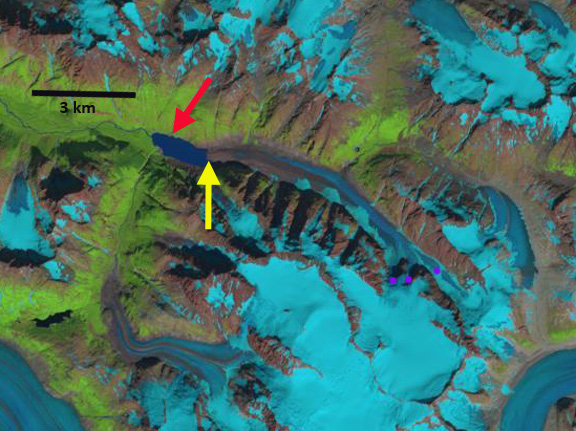
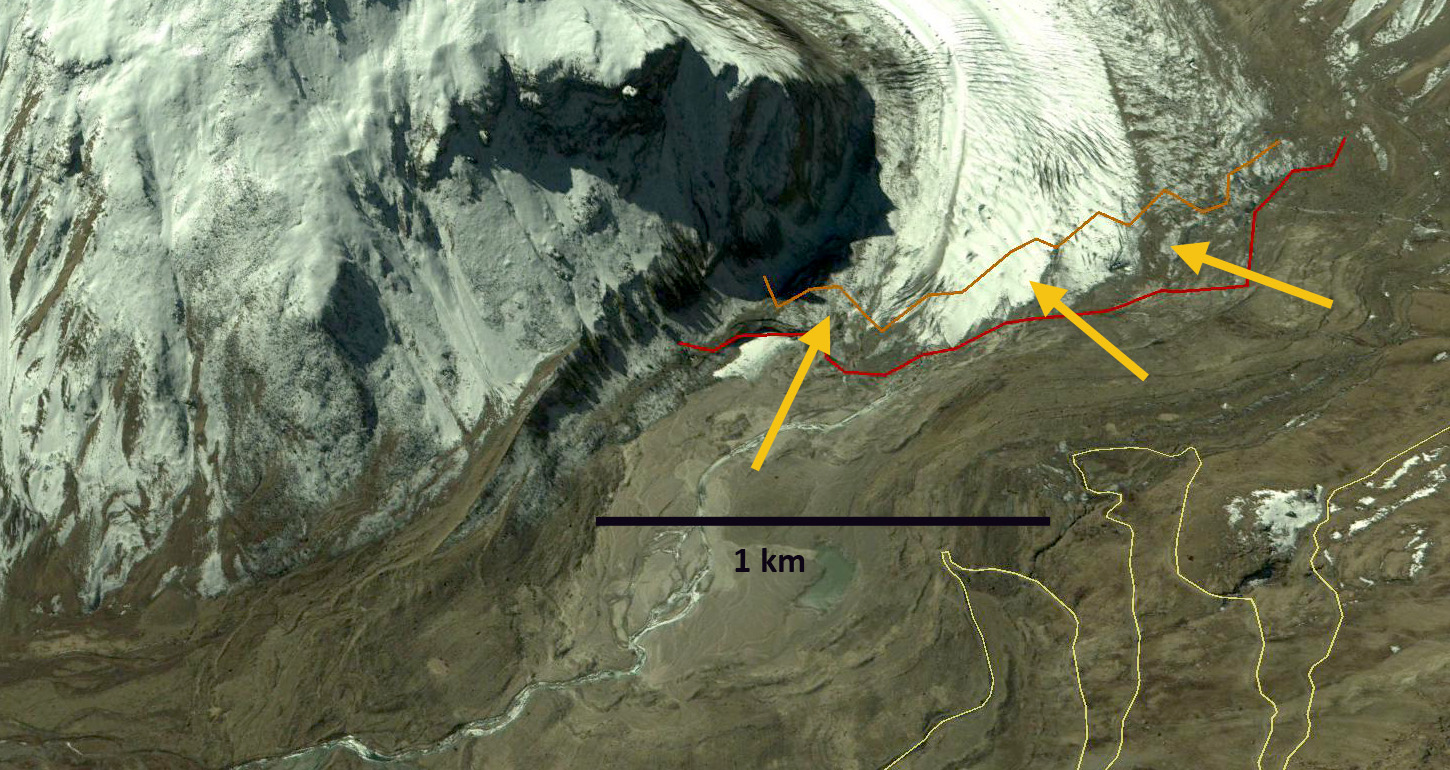
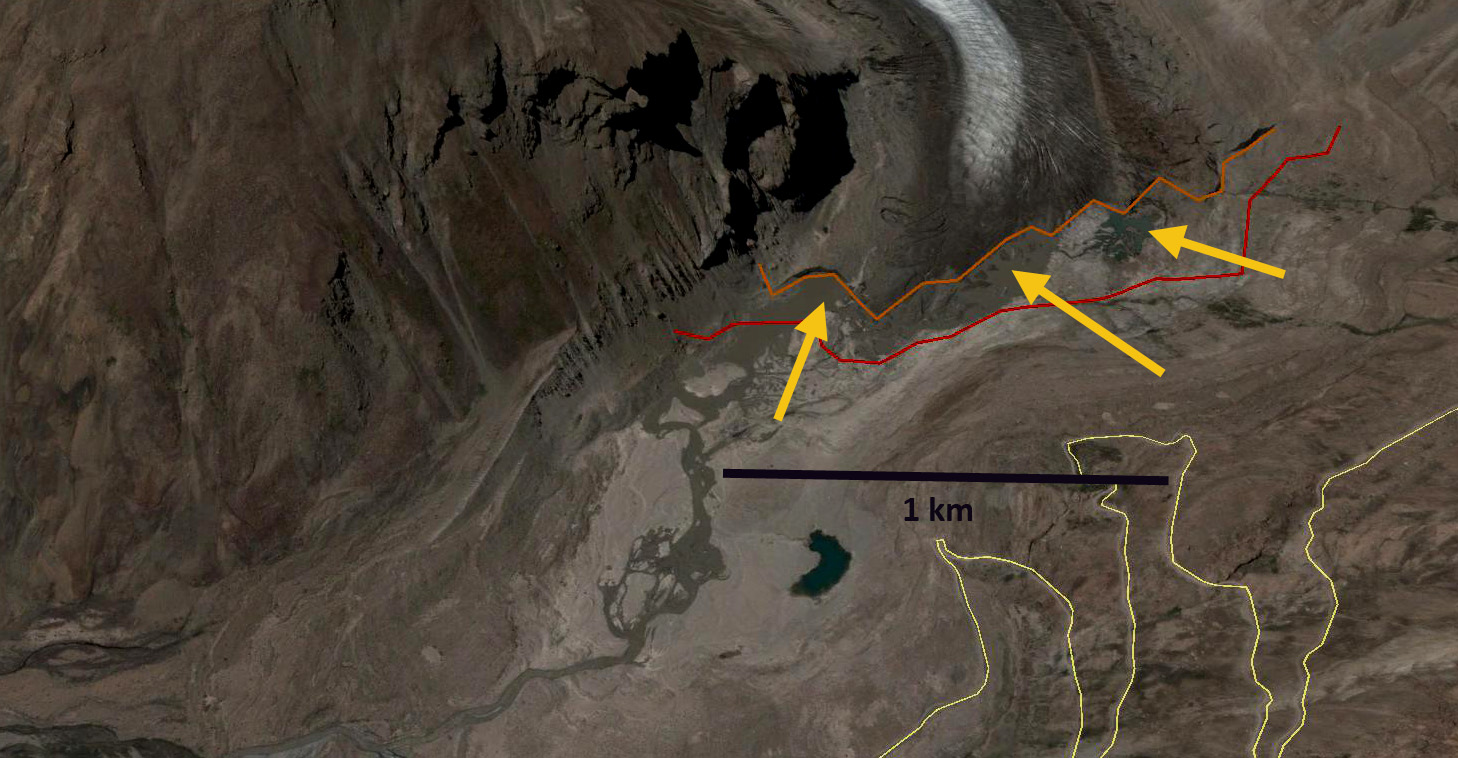
The cumulative mass balance loss since 1980 is 14.9 m w.e. the equivalent of cutting a 16.5 m thick slice off the top of the average glacier (Figure 1). The trend is remarkably consistent from region to region (WGMS, 2011). WGMS mass balance results based on 30 reference glaciers with 30 years of record is not appreciably different, -15.1 m w.e. The decadal mean annual mass balance was -198 mm in the 1980’s, -382 mm in the 1990’s, and –740 mm for 2000’s. The declining mass balance trend during a period of retreat indicates alpine glaciers are not approaching equilibrium and retreat will continue to be the dominant terminus response. The recent rapid retreat and prolonged negative balances has led to some glaciers disappearing and others fragmenting (Figure 2)(Pelto, 2010; Carturan et al; 2013).

Figure 2. Disintegration of Careser Glacier, Italy 1933-2012, glacier in blue. (Carturan et al, 2013)
In 2013 The Austrian Glacier inventory in examined 96 glaciers, 93 were in retreat, 1 was advancing and 2 were stationary, average terminus change was -17 m. Mass balance in 2013 was slightly negative on three glaciers with completed data. A 170 m increase in annual equilibrium line altitude on 43 glaciers in the Alps from 1984-2010, is driving the ongoing retreat (Rabatel et al, 2013).
In Norway terminus fluctuation data from 33 glaciers for 2013 with ongoing assessment indicate, 26 retreating, 4 stable and 3 advancing. The average terminus change was -12.5 m (Elverhoi, 2013). Mass balance surveys with completed results are available for six glaciers, all have negative mass balances with an average loss exceeding 1 m w.e. (Andreassen, 2013).
In the North Cascades, Washington the 2013 winter accumulation season featured 93% of mean snowpack (1984-2013). The melt season was exceptional with the mean June-September temperature tied with the highest for the 1989-2013 period and had the highest average minimum daily temperatures. The result was significant negative balances on all ten glaciers observed, with an average of -1 m w.e. (Pelto, 2013). In British Columbia end of summer snowlines were quite high and annual mass balance significantly negative. In Alaska all four glaciers with mass balance assessed had significant negative mass balances (Pelto, 2013).
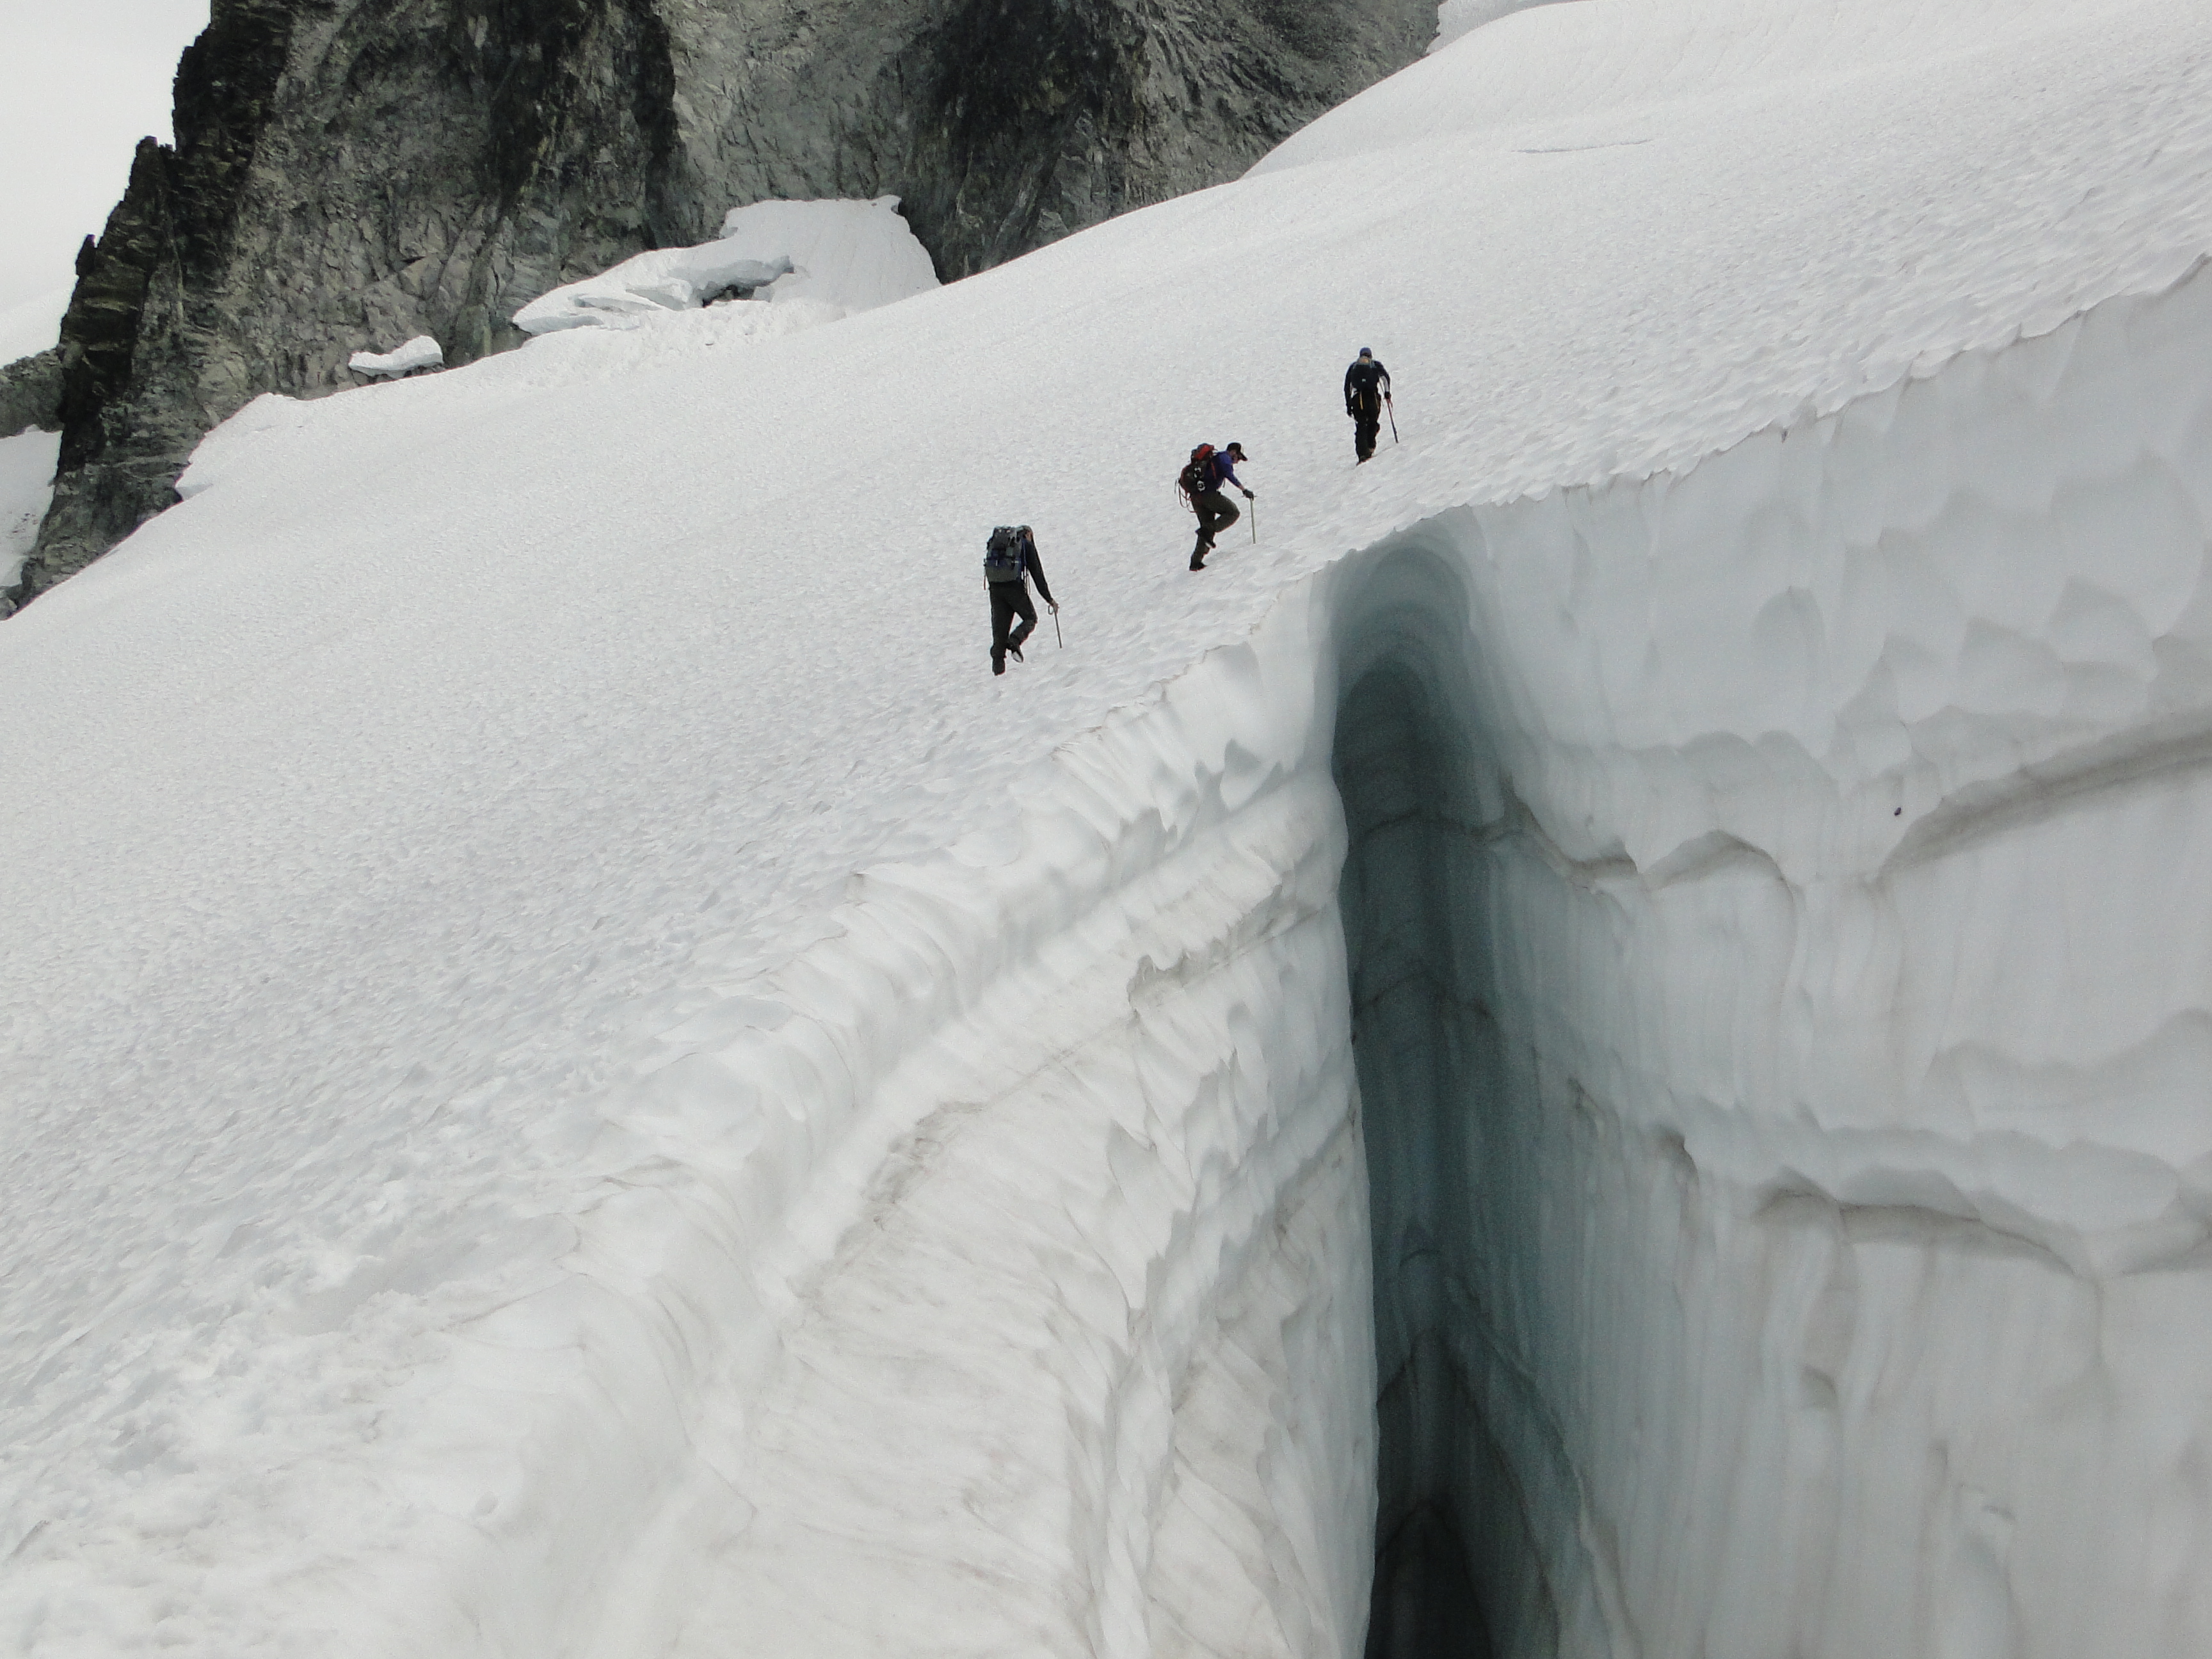
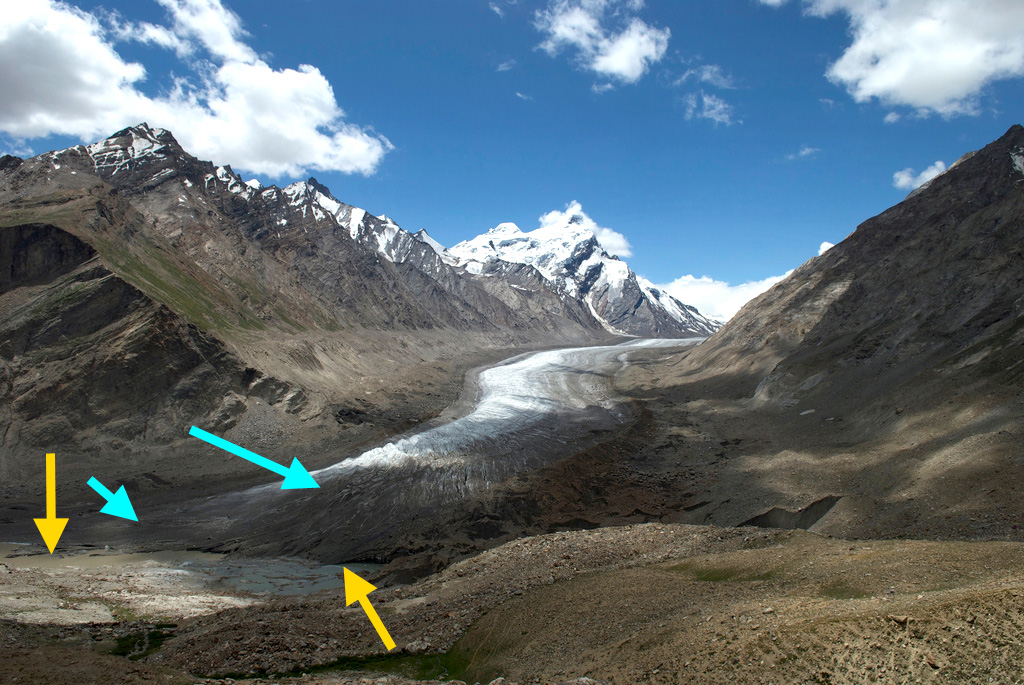
Figure 3 Assessing snow depth in crevasse Lynch Glacier, North Cascades.
In New Zealand the annual end of summer snowline survey on 50 glaciers found snowlines that were slightly above the elevation for glacier equilibrium. Heavy snow accumulation during October was offset by a warm and dry summer with high ablation (NIWA, 2013).
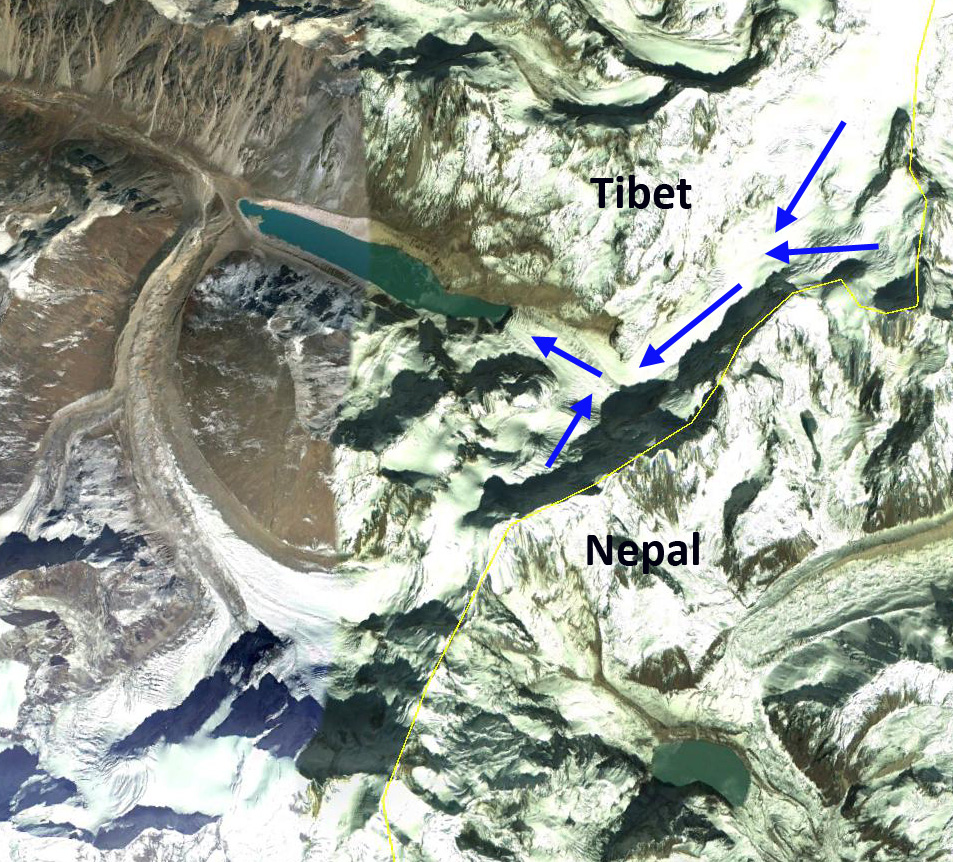
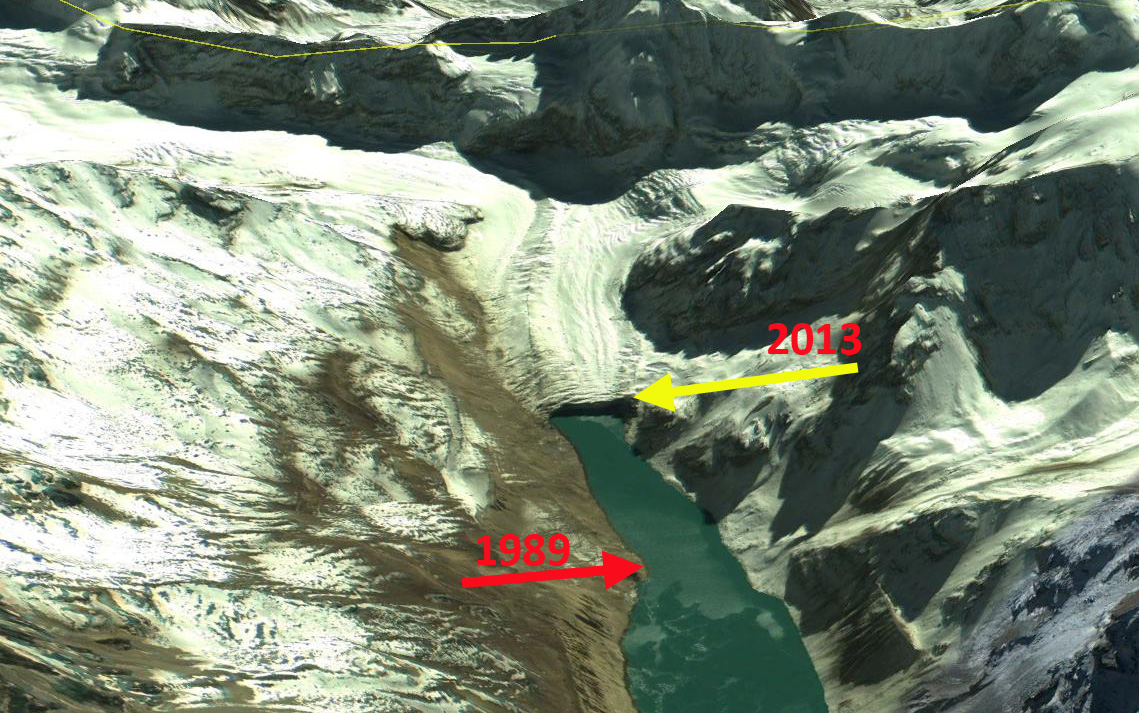
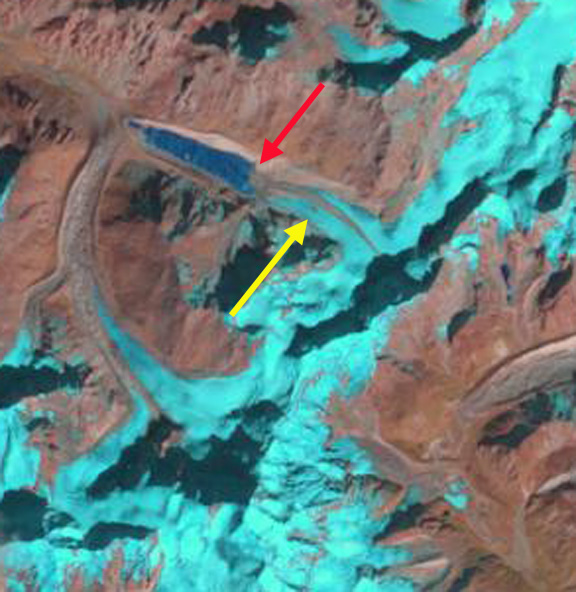
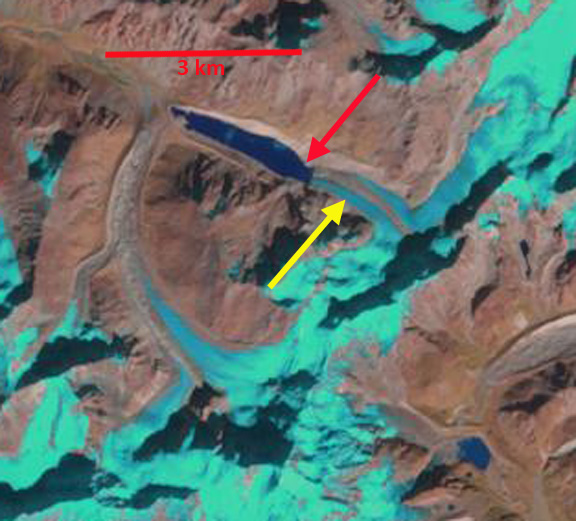
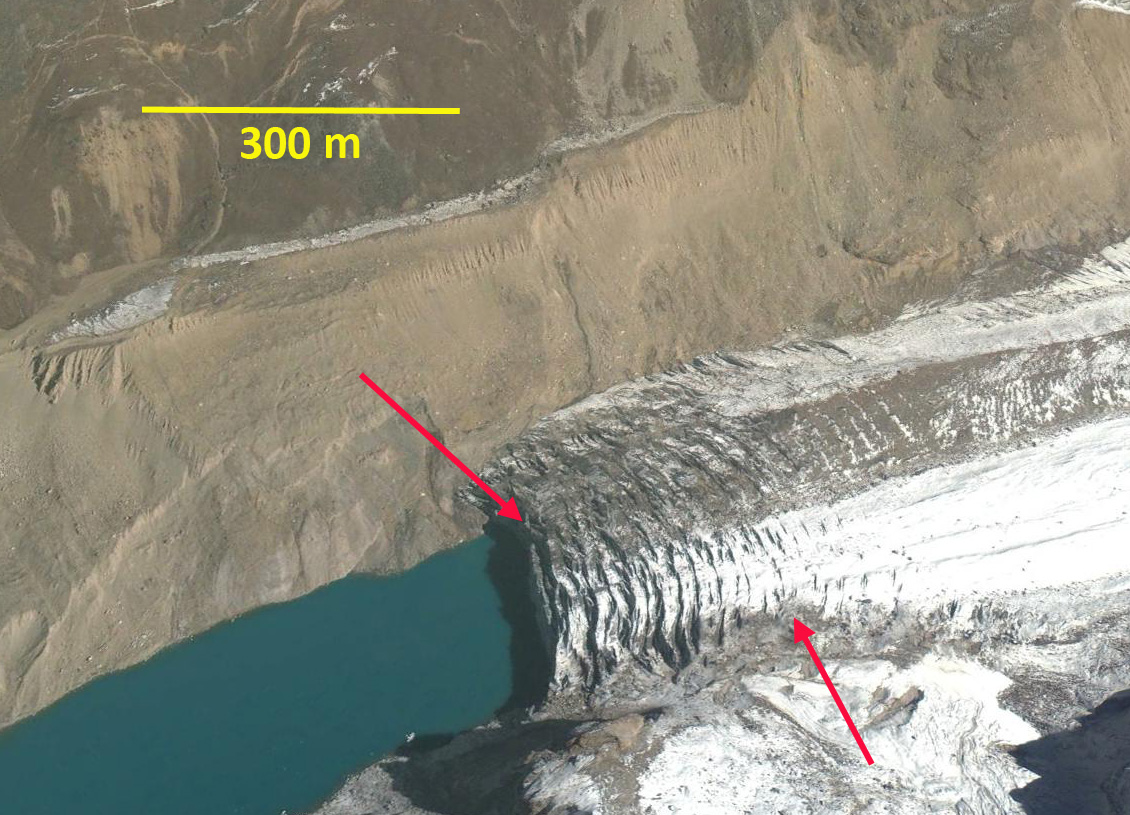
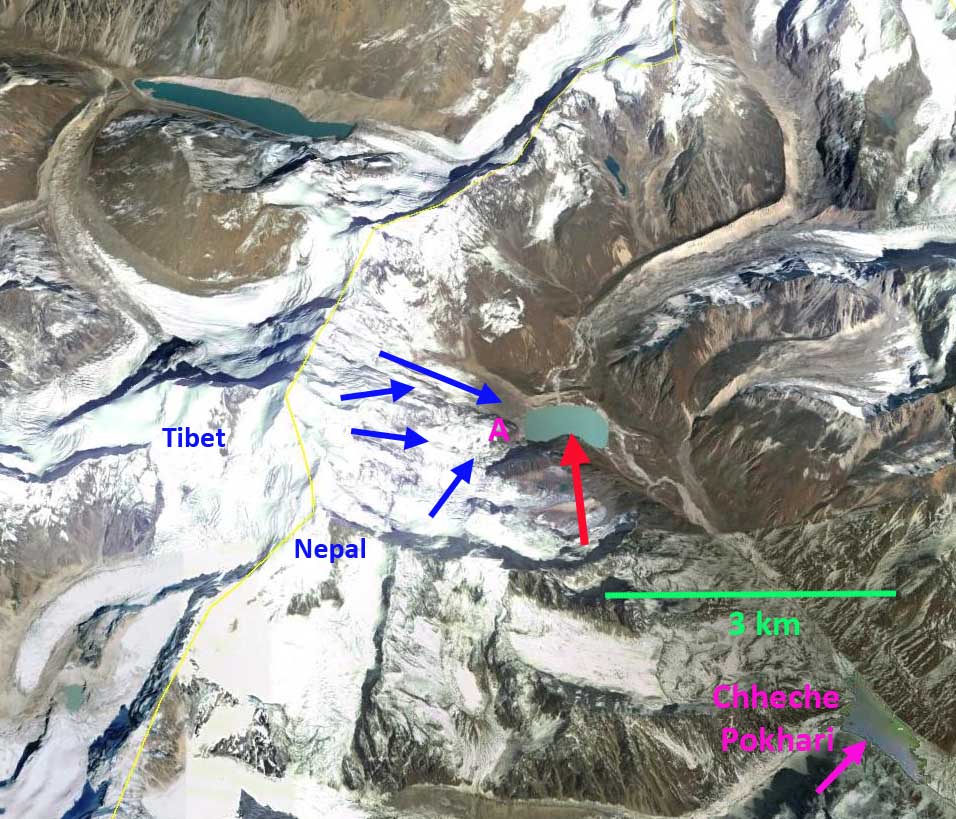
In Nepal the mass balance of Yala, Mera and Pokalde Glacier were near equilibrium. Accumulation was the highest of the last seven years, with particularly heavy snow from extratropical storm Phailin (ICIMOD, 2013).
References:
Andreassen, L., 2013: Cyroclim/NVE. http://glacier.nve.no/viewer/CI/en/cc/
Carturan, L., Baroni, C., Becker, M., Bellin, A., Cainelli, O., Carton, A., Casarotto, C., Dalla Fontana, G., Godio, A., Martinelli, T., Salvatore, M. C., and Seppi, R. 2013: Decay of a long-term monitored glacier: Careser Glacier (Ortles-Cevedale, European Alps). The Cryosphere, 7, 1819-1838, doi:10.5194/tc-7-1819-2013.
Elverhoi, H., 2013: Norwegian water resources and energy directorate 2013 glacier length change Table.http://www.nve.no/Global/Vann%20og%20vassdrag/Hydrologi/Bre/Nedlastinger/Length_Change_Table_2000-2013.pdf?epslanguage=en.
Fischer, A. 2013: Gletscherbericht 2011/2012. http://www.alpenverein.at/portal_wAssets/docs/service/presse/2013/PA_Alpenverein_Gletscherbericht_Bergauf-2-2013.pdf
Haeberli, W., J. Cihlar and R. Barry 2000: Glacier monitoring within the Global Climate Observing System. Ann. Glaciol, 31, 241-246.
ICIMOD, 2013: Students learn glacier mass balance measurement. http://www.icimod.org/?q=12401
NIWA, 2013: State of the Climate 2013. NIWA. http://www.niwa.co.nz/climate/state-of-the-climate/state-of-the-climate-2013
Pelto, M. 2010: Forecasting temperate alpine glacier survival from accumulation zone observations. The Cryosphere,4, 67–75.
Pelto, M. 2013: Pacific Northwest 2013 Glacier Assessment. https://glacierchange.wordpress.com/2014/02/20/pacific-northwest-glacier-mass-balance-2013/
Rabatel, A., Letréguilly, A., Dedieu, J.-P., and Eckert, N.: Changes in glacier equilibrium-line altitude in the western Alps from 1984 to 2010: evaluation by remote sensing and modeling of the morpho-topographic and climate controls, The Cryosphere, 7, 1455-1471, doi:10.5194/tc-7-1455-2013, 2013.
Schaner, N., Voisin, N., Nijssen, B. and Lettenmaier, D. 2012: The Contribution of Glacier Melt to Streamflow. Environmental Research Letters 7 (doi:10.1088/1748-9326/7/3/034029.
WGMS, 2013: Glacier Mass Balance Bulletin No. 12 (2010–2011). Zemp, M., Nussbaumer, S. U., GärtnerRoer, I., Hoelzle, M., Paul, F., and Haeberli, W. (eds.), ICSU(WDS)/IUGG(IACS)/UNEP/UNESCO-WMO, World Glacier Monitoring Service, Zurich, Switzerland.
Himalayan Glacier Change Index
Himalaya Range Glacier Change Below is a list of individual glaciers in the Himalaya that illustrate what is happening glacier by glacier. In addition to the individual sample glaciers we tie the individual glaciers to the large scale changes of approximately 10,000 glaciers that have been examined in repeat satellite image inventories. In the Himalayan Range, stretching from the Karokaram Range in NW India east south east to the border region of Bhutan and China, detailed glacier mapping inventories, from GLIMS: (Global Land Ice Measurements from Space), ICIMOD (International Centre for Integrated Mountain Development), ISRO ( Indian Space Research Organisation) and Chinese National Committee for International Association of Cryospheric Science (IACS) of thousands of glaciers have indicated increased strong thinning and area loss since 1990 throughout the the Himalayan Range. The inventories rely on repeat imagery from ASTER, Corona, Landsat, IKONOS and SPOT imagery. It is simply not possible to make observations on this number of glaciers in the field. This is an update to the assessment by Pelto (2012) in the BAMS State of the Climate, which was the source of a Skeptical Science article as well
Kali Gandaki Headwaters, Nepal——–Ngozumpa Glacier, Nepal
Khumbu Glacier, Nepal ———— West Barun Glacier, Nepal
Imja Glacier, Nepal ——– Nobuk Glacier, Nepal
Milam Glacier, India———— Samudra Tupa, India
Ratangrian Glacier, India———– Khatling Glacier, India
Satopanth Glacier, India———- Durung Drung Glacier, India
Gangotri Glacier, India———— Warwan Basin, India
Sara Umaga Glacier, India—– Malana Glacier, India
Jaonli Glacier, India——– Kalabaland Glacier, India
Jaundhar Barak, India———– Burphu Glacier, India
Changsang Glacier, Sikkim—– Zemu Glacier, Sikkim
South Lhonak Glacier, Sikkim——North Lhonak Glacier, Sikkim
Theri Kang Glacier, Bhutan———-Luggi Glacier, Bhutan
Mangde Chu Glacier, Bhutan——–Thorthormi Glacier, Bhutan
Menlung Glacier, Tibet———- Yejyumaro Glacier, Tibet
Lumding Glacier, Tibet—- Rongbuk Glacier, Tibet
Sepu Kangri, China———– Longbasba Glacier, Tibet
Jiongla Glacier, Tibet———- Bode Zanbo Headwaters, Tibet
Zayul Chu Headwaters, Tibet— Boshula Glaciers, Tibet
Matsang Tsanpo Gl, Tibet—– Reqiang Glacier, Tibet
In Garhwal Himalaya, India, of 58 glaciers examined from 1990-2006 area loss was 6% (Bhambri et al, 2011). They also noted the number of glaciers increased from 69 (1968) to 75 (2006) due to the disintegration of ice bodies. Examination of 466 glaciers in the Chenab, Parbati and Baspa Basin, India found a 21% decline in glacier area from 1962 to 2004 (Kulkarni, 2007). Glacier fragmentation was also observed in this study, which for some fragments represents a loss of the accumulation area, which means the glacier will not survive (Pelto, 2010). The India glacier inventory (ISRO, 2010) identified glacier area losses and frontal change on 2190 glaciers and found an area loss rate of 3.3% per decade and 76% of glaciers retreating. (Kulkarni, 2014) reports on Indian Himalyan glaciers that 79 of 80 with terminus change records have been receding.
In the Nepal Himalaya area loss of 3808 glaciers from 1963-2009 is nearly 20% (Bajracharya et al., 2011). The Langtang sub-basin is a small northeast-southwest elongated basin, tributary of Trishuli River north of Kathmandu and bordered with China to the north. The basin contained 192 km2 of glacier area in 1977, 171 km2 in 1988, 152 km2 in 2000 and 142 km2 in 2009. In 32 years from 1977 to 2009 the glacier area declined by 26% (Bajracharya et al., 2011). In the Khumbu region, Nepal volume losses increased from an average of 320 mm/yr 1962-2002 to 790 mm/yr from 2002-2007, including area losses at the highest elevation on the glaciers (Bolch et al., 2011). The Dudh Koshi basin is the largest glacierized basin in Nepal. It has 278 glaciers of which 40, amounting to 70% of the area, are valley-type. Almost all the glaciers are retreating at rates of 10–59 m/year and the rate has accelerated after 2001 (Bajracharya and Mool, 2009). ICIMOD (2013) completed an inventory of Nepal glaciers and found a 21% decline in area from the 1970’s to 2007/08. ICIMOD has developed an map viewer application for examining the changes through time.
An inventory of 308 glaciers in the Nam Co Basin, Tibet, noted an increased loss of area for the 2001-2009 period, 6% area loss (Bolch et al., 2010). Zhou et al (2009) looking at the Nianchu River basin southern Tibet found a 5% area loss. 1990-2005. In the Pumqu Basin, Tibet an inventory of 999 glacier from the 1974 & 1983 to 2001 indicated the loss of 9% of the glacier area and 10% of the glaciers disappeared (Jin et al, 2005). The high elevation loss is also noted in Tibet on Naimona’nyi Glacier which has not retained accumulation even at 6000 meters. This indicates a lack of high altitude snow-ice gain (Kehrwald et al, 2008).
A new means of assessing glacier volume is GRACE, which cannot look at specific changes of individual glaciers or watersheds. In the high mountains of Central Asia GRACE imagery found mass losses of -264 mm/a for the 2003-2009 period (Matsuo and Heki, 2010). This result is in relative agreement with the other satellite image assessments, but is at odds with the recent global assessment from GRACE, that estimated Himalayan glacier losses at 10% of that found in the aforementioned examples for volume loss for the 2003-2010 period (Jacobs et al, 2012). At this point the detailed glacier by glacier inventories inventories of thousands of glaciers are better validated and illustrate the widespread significant loss in glacier area and volume, though not all glaciers are retreating. This page will continue to be updated as new inventory data is published and new individual glaciers are examined herein. Yao et al (2012) in an examination of Tibetan glaciers observed substantial losses of 7090 glaciers. Bolch et al (2012) in a report on the “State and Fate of Himalayan Glaciers” noted that most Himalayan glacier are losing mass and retreating at rates similar to the rest of the globe. ICIMOD has also developed an application illustrating changes of glaciers in Bhutan.
Sittakanay Glacier Retreat, British Columbia
Sittankanay Glacier drains the north side of the small icefield that feeds the retreating Wright, Speel and West Speel Glacier. The 10 km long glacier is the headwaters of the Sittkanay River, a tributary to the Taku River. Here we utilize Landsat images from 1984-2013 to identify the recent changes in the glacier. The glacier begins at 2000 m and ends in a lake at 250 m, the terminus has heavy debris cover, which is unusual for this area. The Canadian Topographic map indicates a lake that is 400 m long.

Canada Topographic map
In 1984 the terminus of the glacier, red arrow is at the base of a steep gulch, yellow arrow marks the 2013 terminus. The lake has expanded to 600 m in length. The purple dots indicate the snowline is at 1500 m, which leaves limited snowpack for sustaining the glacier. In 1996 and 1999 the snowline was also at 1500 m, indicating negative mass balances that underlie the retreat. By 2013 the glacier the lake had expanded to 1700 m in length. The glacier has retreated 1100 m since 1984. The snowline is at 1400 m in the mid-August image, and will rise above 1500 m by the end of the melt season. A close up view of the terminus indicates the heavy debris cover has large uncrevassed sections that appear nearly stagnant, pink arrows. There is one feature in the 2006 Google Earth image that is 1.0 km from the terminus, a circular depression-red arrow, with concentric crevasses that indicates a subglacial lake that partially buoys the glacier. This also indicates that rapid retreat will continue. The retreat is enhanced by calving, but it is the insufficient size of the accumulation zone that is driving the retreat of this glacier and its neighbors.
Durung Drung Glacier Retreat, Zanskar, India
The Durung Drung Glacier (Drang Drung) is a frequently seen glacier from the unpaved Kargil-Leh road in the Zanskar, Lakdakh region of India that flows north from the slopes of Doda Peak. This road climbs up the Suru River valley from Kargil, crosses Pensi La Pass crosses the front of the Durung Drung Glacier and descends the Zanskar River valley to Nimoo. The Zanskar River joins the Indus River just above the village of Nimoo. The Nimoo Bazgo Hydroelectric Project opened in 2012 and provides 45 MW of power to the Ladakh Region. Chris Rubey has a nice image of this power plant. This is a run of river project, that does not alter the downstream flow, but it does have a reservoir that stores 120,000,000 gallons of water, as seen in a 2013 Landsat image.

1998 Landsat Image show flowlines fro Durung Drung Glacier

2013 Landsat image of the dam and reservoir for the Nimoo Bagzo Hydropower Project
There have a few inaccurate reports of late that this glacier is not currently retreating. Here we examine Landsat and Google Earth imagery from 1998 to 2013 to identify the magnitude of the recent retreat. In Landsat images in 1998 there were no evident proglacial lake at the terminus of the glacier, red arrow. By 2013 a series of proglacial lakes are evident in Landsat images at the terminus red arrow. Looking at the higher resolution Google Earth imagery from 2004 and 2013. The retreat and development of the lakes is apparent. In each image the red line is the 2004 terminus and the brown line the 2013 image, orange arrows indicate three lakes that have formed by 2013. The retreat is 200-250 m not large for a glacier of this size but significant for such a short period of time. More importantly the smooth low slope terminus with pieces breaking off into the proglacial lake in 2013 is indicative of a glacier that is thinning and retreating, note video. The lowest 1.2 km of the glacier is uncrevassed and has a low slope suggesting this area will continue to melt away. An image from a Zanskar River expedition indicates the lakes and icebergs in the lakes as well with the blue arrows indicating the low-sloped uncrevassed region. 
1998 Landsat of Durung Drung Glacier terminus

2013 Landsat of Durung Drung Glacier terminus

2004 Google Earth image of Durung Drung Terminus

2013 Google Earth image of Durung Drung Terminus
Landsat images from 2005 and 2013 indicate the snowline on the glacier as well as the change at the terminus. In 2005 and 2013 the snowline is at 5100 m, purple dots. Given that the glacier extends from 6000 m to 4100 m this is near the median elevation, but this is also likely not the date of highest snowline position. The retreat of Durung Drung Glacier is similar to the more debris covered Gangotri Glacier and Satopanth Glacier but slower than the similarly debris limited Malana Glacier and Samudra Tupa Glacier
Wright Glacier Retreat, Southeast Alaska
Wright Glacier is the main glacier draining a small icefield just south of the Taku River and the larger Juneau Icefield. Wright Glacier is 60 km east of Juneau and has ended in a lake since 1948. A picture of the glacier in 1948 from the NSIDC collection indicates the terminus mainly filling the lake, but breaking up. The glacier drains the same icefield as the retreating West Speel and Speel Glacier. The dark blue arrows indicate the flow vectors of Wright Glacier, light blue arrows flow vectors for adjacent glaciers. Despite being 30 km long this glacier has been given very little attention, maybe because it does not reach tidewater.

NSIDC Glacier Photograph Collection Photographer unknown.
In 1984 the glacier ended at a peninsula in the lake where the lake turns east. This was my view of this glacier during the summers of 1981-1984 from the Juneau Icefield with the Juneau Icefield Research Program. Our bad weather came from that direction so keeping an eye on that region during intervals between whiteout weather events, the norm, was prudent. Here we examine Landsat imagery from 1984-2013 to document the retreat of Wright Glacier and the elevation of the snowline on the glacier. The red arrow indicates the 2013 terminus, the red arrow the terminus at the time of the image and the red dots the snowline on the date of the imagery. In 1984 the lake had a length of 3.1 km extending northwest from the glacier terminus. The snowline in mid-August with a month left in the melt season was at 1150 m. By 1993 the glacier had retreated little on the north side of the lake and 200 m on the south side. The snowline in mid-September close to the end of the melt season was at 1150 m. In 1997 the fourth in a five year run of extensive mass balance losses and high equilibrium lines in the region, noted on the Juneau Icefield (Pelto et al, 2013), the snowline had risen to 1450 m. The terminus had retreated 200 m on the north side since 1984 and 600 m on the south side. In 2003 the snowline was at 1250 m with a month left in the melt season. The terminus retreat on the north side and south side since 1984 had now evened out with 900 m of retreat. In 2013 the snowline was at 1150 m in mid-August and 1350 m by the end of the melt season. The terminus had retreated 1300 m since 1984 and the lake is now 4.5 km long. The lower 2 km of the glacier has many stagnation features on it, suggesting continue retreat. It is unclear how far the basin that will be filled by the lake upon retreat extends, but it is not more than 2 km from the current terminus, as a small icefall reflecting a bedrock step occurs there. This glaciers retreat has accelerated since 1984. To be in equilibrium the glacier needs a minimum of 60% of its area to above the snowline at the end of the melt season. This is to offset the 10-12 m of melt that occurs at the terminus. This requires a snowline no higher than 1150 m. The snowline has been above this level in 1994-1998, 2003-2006 2009-2011 and in 2013, which suggest the glacier cannot maintain its current size and will continue to retreat. The glacier has a larger high elevation than the West Speel and Speel Glacier that originate from the same mountains. The glacier is following the pattern of retreat of all but one of the glaciers of the Juneau Icefield.
West Speel Glacier Retreat and Lake Formation, Southeast Alaska
West Speel Glacier is an unnamed glacier that drains the same icefield as the Wright and Speel Glacier 45 km southeast of Juneau, Alaska. Here we examine the changes in this glacier from 1984-2013 using Landsat imagery. 
Google Earth image
In 1984 the glacier ended on an outwash plain at the head of a branch of Speel River. The red arrow indicates the 1984 terminus for each image, the purple arrow the 2013 terminus and the yellow arrows tributary glaciers. In 1984 all three tributary glaciers fed West Speel Glacier and the glacier has no proglacial lake at the terminus. The eastern tributary pink arrow has some retained snowpack with three weeks left in the melt season. Each tributary indicated by yellow arrow is still contributing to the glacier. In 1997 a lake basin is beginning to develop, though it is still largely filled by ice. The eastern tributary pink arrow, has lost all of its snowpack. In 1999 the proglacial lake has formed and has length of 1 km, the lake has expanded south and north of the 1984 terminus position, and does not entirely represent glacier retreat. The noted tributaries are still all connected to the main glacier. In 2013 the glacier has retreated 1200 m from the 1984 position and the lake is still expanding. The yellow arrows indicate that none of the three tributaries are still connected to the main glacier. The glacier in a sense is losing its income flow from these subsidiaries. The eastern tributary has retained some snowcover with six weeks left in the melt season in 2013, but this is mostly gone a month later. The melt season is off to a quick start in 2014, which promises to be a poor year for this glacier. The retreat of this glacier is the same story as seen at nearby Speel, Gilkey and Norris Glacier. 
1984 Landsat image

1997 Landsat image
Long Peak Glacier, Southeast Alaska
“Long Peak” Glacier is an unnamed glacier southeast of Juneau, Alaska. The glacier occupies a narrow northeast oriented avalanche fed valley, light blue arrows indicate the avalanche feeding regions around the glacier. In 1948, as indicated in the USGS map,the glacier extended from 1600 m to 500 m, a small lake is shown at the terminus, with an overall length of 3.8 km. The glacier is a short distance southwest of the retreating Speel Glacier, and it does drain into the Speel River. Here we examine Landsat imagery of changes in this glacier from 1984 to 2013. This is a small, remote glacier that receives that has not attracted attention. It is close to the Long Lake Snotel snowpack measurement station operated by the USDA. I observed the glacier in 1998 from a helicopter and thought it did not look poised to survive our warming climate for long. 
Here we examine Landsat imagery from 1984-2013 to observe glacier retreat and lake expansion. By 1984 the lake had expanded to 750 m in length, with a glacier retreat of 500 m from the mapped terminus. The snowline is marked with purple dots, the 2013 terminus with a red arrow, and the orange arrow indicates a debris covered region of the glacier. Only 20% of the glacier is snowcovered and the melt season is not yet over in the 1984 image. This same pattern of snowcover remaining is seen in 1993, 1995, 1996, 1997 and 1998 for example. By 1999 the glacier has retreated an additional 300-350 m, the snowcovered area is greater but this is an August image. In 2013 a late June and a Late July image depict the loss of snowcover during a month. The overall length of the glacier is now 2.6 km, indicating a retreat of 1200 m since and a retreat of 700 m from 1984-2013. The glacier is still terminating in the lake that has expanded by the same amount. This glacier has not only retreated but also thinned and the slopes above the glacier have greened a bit particularly on the north side. This glacier cannot survive with the level of retained snowcover it has (Pelto, 2010). Ongoing mass balance work on the Lemon Creek Glacier of the Juneau Icefield, where the Juneau Icefield Research Program is beginning measurements next week, has thinned by 29 m during the 1955-2013 period (Pelto et al, 2013). In 2014 the Long Lake Snotel site at an elevation of 850 feet, lost its snowpack on June 11, a bit earlier than normal, indicating this glacier will lose most of its snowpack in 2014.
Yejyumaro Glacier Retreat Lake Expansion, Tibet, China
An unnamed glacier draining the west side of Yejyumaro Peak a Nepal-China border peak, into Tibet is referred to here as Yejyumaro Glacier. The glacier is at the headwaters of the Arun River, which crosses into Nepal at Kimathanka. A 335 MW hydropower plant is being planned for the Upper Arun River fed by this and other glaciers. The glacier is adjacent to Nobuk Glacier across the border in Nepal.
Google Earth images from 2002 and 2013 indicate both the glacier retreat and resulting lake expansion. Red arrow is the 1989 terminus position and yellow arrow 2013 terminus position. Notice the southern and northern arms joining and turning west. Both arms of the glacier are fed by the steep border peaks with considerable avalanching.

20002 Google Earth image

2013 Google Earth image
Landsat imagery from 1989 to 2013 is used to illustrate the response of this glacier to changing climate. In 1989 the glacier extended down the unnamed lake to a peninsula, with the lake being 2.3 km long. By 2000 the glacier had retreated from the peninsula, 150-200 m retreat since 1989. By October 2013 the glacier had retreated 700 m from the 1989 position into a narrower section of the lake. The lake is now 3 km long and still growing. A December 2013 image indicates how dry this region is during the early part of the winter with only a light snowcover across the glaciated areas and higher terrain. The last image is a the Google Earth closeup indicating the transverse crevasses that are above the terminus, the crevasses narrow moving up glacier away from the terminus and disappear 400 m above the terminus. These represent the acceleration near the calving front and the indicate that calving has helped accelerate glacier flow and glacier loss. This glaciers retreat is similar to so many in the area from Nepal such as the Nobuk Glacier that is adjacent to it in Nepal, and the many Tibetan glacier retreating along the the axis of expanding lakes, Reqiang, Matsang Tsanpo and Menlung Glacier.
Nobuk Glacier Retreat, Tamor Basin, Nepal
At the headwaters of the Tamor Basin in eastern Nepal is an unnamed glacier that terminates in an expanding glacial lake. The glacier is referred to as “Nobuk” Glacier here in reference to the nearby named peak on the map. The glacier is upstream of a Chheche Pokhari a lake formed by a glacier outburst flood in 1980. Two arms of the glacier both avalanche fed from the steep border peaks with Tibet. ICIMOD has recently finished a detailed inventory of glacier change in Nepal since 1980. In the Tamor basin they indicate glacier area from 2000 to 2010 has declined from 422 square kilometers to 386 square kilometers. 
Topographic map showing lake and glacier flow paths
Here the glacier is examined from 1989 to 2013 using Landsat images. In 1989 the lake had several developing areas amidst the decaying glacier ice, but the glacier still reached to the far eastern shore of the lake. By 2000 Nobuk Glacier terminates at a southeast turn on the south side of the glacial lake it terminates in, red arrow, 500 m from the 1989 terminus. The glacier is fed by two arms, the southern arm has a steeper icefall near the terminus and is narrower. The two arms of the glacier are separated by a buttress, marked with a Pink Point A. This buttress is 750 m from the debris covered ice front. By 2009 the glacier two arms of the glacier are separate and the southern arm no longer reaches the lake. The glacier front has retreated back to the base of the buttress at Point A. By 2013 the lake has more than doubled in length and area since 2000, red arrow at 2000 terminus in each image. The southern arm terminates 150 m from the lake and the debris covered northern arm, though still ending in the lake, it is a very thin low slope terminus that appears to be close to retreating from the lake basin that the glacier has carved. This is evident in the 2010 Google Earth image. The glacier has retreated 500 m from 2000 to 2013. The lake is now 1 km long and has an area of 0.4 square kilometers. The retreat matches that of most Nepal glaciers. This glacier was noted as shrinking from 2.3 to 1.4 square kilometers in area from 1980-2010 by the ICIMOD glacier inventory, they documented a 24% loss in area and 29% in volume during this interval For Nepal’s glaciers. Individual glacier such as Lumding, West Barun, Imja, and Ngozumpa.

1989 Landsat image

2000 Landsat image


