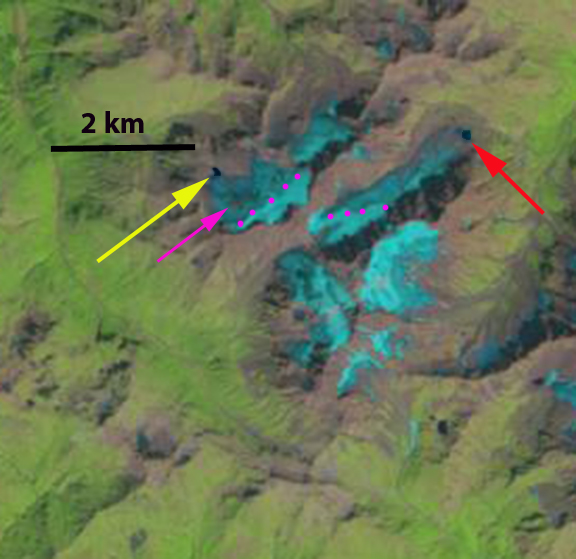
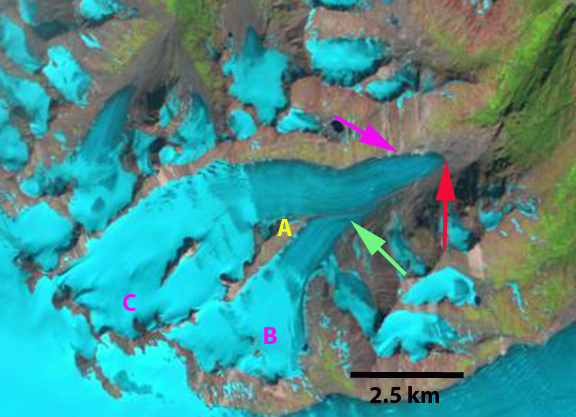
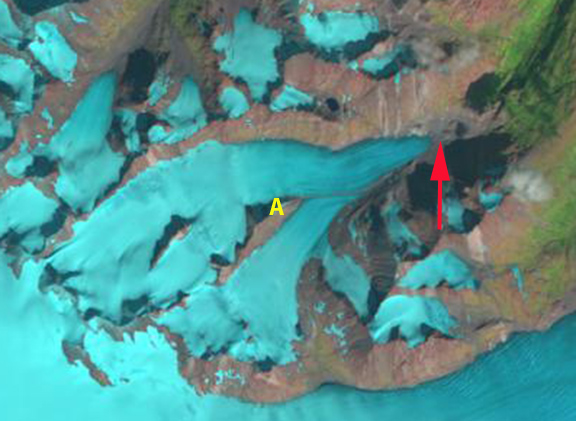
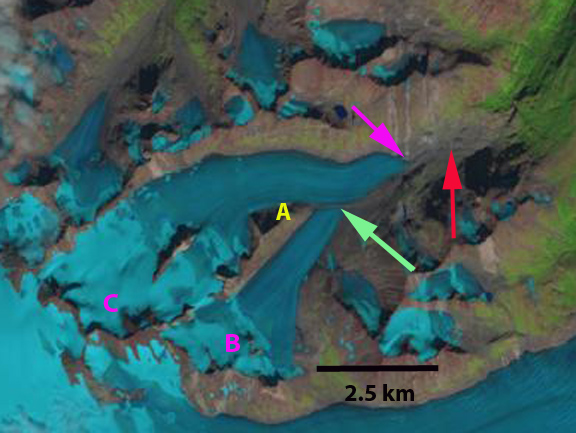
Kluhor (Klukhor) Glacier is in the Caucasus Mountains west of Mount Elbrus. It drains into the Teberda River and then the Kuban River and eventually Krasnodar Reservoir and the Black Sea. The Krasnodar Reservoir is primarily a flood control and irrigation management reservoir. Here we examine three glaciers each experiencing the familiar pattern in the Caucasus Mountains of retreat with expansion of proglacial lakes. As the area and number of glacier is reduced, the number and area of alpine lakes is increasing, note Khimsa Glacier, Georgia, Psysh Glaciers, Russia, and Gora Bashkara, Russia. Stokes et al (2006) note that 94% of Caucasus Mountain glaciers retreated from 1985 to 2000 and it is clear from the aforementioned that the trends continues.
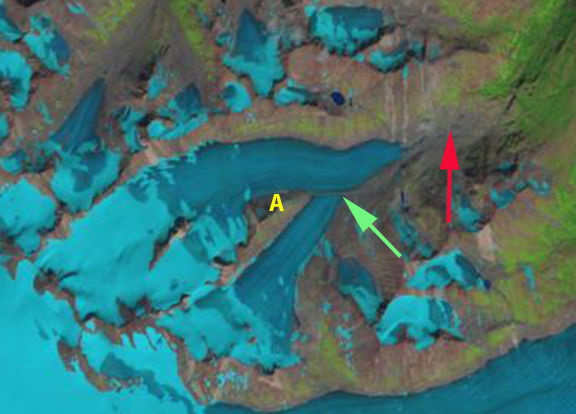
We examine Landsat imagery from 1998 and 2013 to identify the change. In each image the Kluhor Glacier terminus lake is indicated by the red arrow. The unnamed Glacier here named east Kluhor Glacier terminus lake is noted with a yellow arrow. Another unnamed glacier on Lednik Daut is identified here as north Daut Glacier is noted by pink and purple arrows. In 1998 there is small lake at the end of Upper Kluhor Glacier, 150 m long, and on east Kluhor Glacier, 50-100 m wide. At north Kluhor Glacier the glacier ends at the base of a steep icefall near a third lake, pink arrow. The purple arrow indicates the terminus of north Daut Glacier in each image. By 2013 Kluhor Glacier has retreated 300 m and the lake is 450-500 m long. The east Klhor Glacier has retreated 150 m and the lake is 250 m across. The north Daut Glacier has retreated to the top of the steep icefall slope, a 400 m retreat and is now quite distant from the lake below.
The 2007 Google Earth image of Kluhor Glacier there are a number of crevasses paralell to the ice front, indicating that some calving losses will continue to occur. The glacier overall extends from 2950 m to 3250 m, is narrow and has limited snowcover in both satellite images. The snowcover extent in the August satellite images, well before the end of the melt season is 30%, whereas typically 55-65% is necessary to sustain a glacier. In the 2007 Google Earth imagery the thin nature of the icefall at north Daut Glacier is evident, that has since melted away.
1998 Landsat image
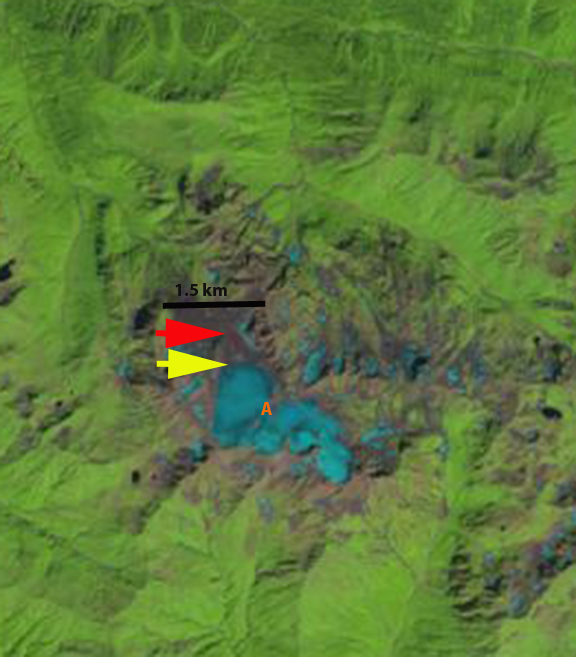
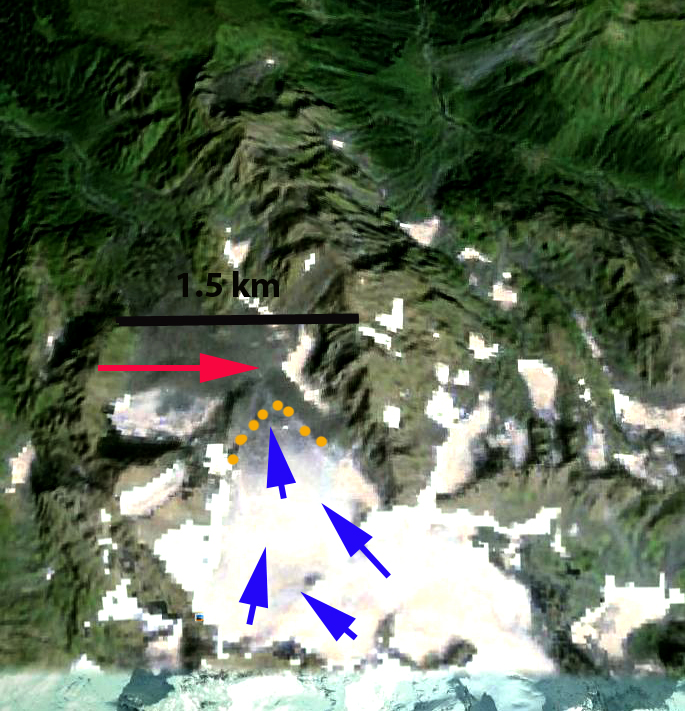
Khimsa Glacier is a rare significant glacier south of the main crest of the Caucasus Mountains in Georgia. The glacier drains north to the Bzyb River, and then the Black Sea. The rivers upper reach is quite undeveloped and there is no hydropower along the river to date. The glacier flows from an elevation of 3000 m to 2650 m. In 1998 the glacier was 1.6 km long with a narrow terminus at the red arrow. At the transition to the glacier’s upper eastern slopes at Point A, there is only one small rock exposure. By 2013 the glacier has retreated 400 m to the yellow arrow, having lost 25% of its length in 15 years. The area of bedrock exposed on the upper eastern slope, at Point A, is significant now indicating thinning even high on the glacier. The glacier will soon separate near Point A into an upper and a lower section. In the Google Earth image the current terminus is indicated with orange dots and the glacier flow with blue arrows. Like Psysh Mountain glaciers 25 km north Khimsa Glacier thinning high on the glacier indicates it cannot survive current climate. Caucasus Mountain glaciers are in a period of rapid retreat (Shagedenova et al, 2009), that is attributed mainly to rising summer temperatures. Khimsa Glacier’s retreat parallels that of glaciers along the main crest of the Caucasus such as Kirtisho or Azau Glacier, though as a percent of total area lost it is greater.
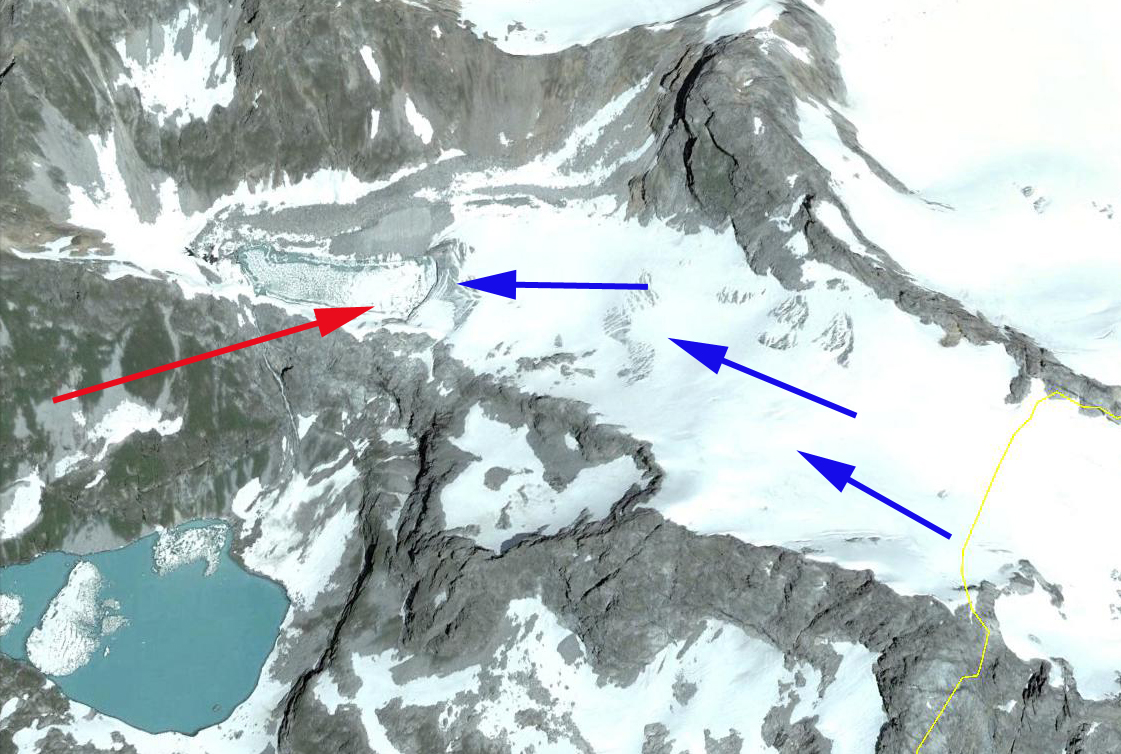
Psysh Mountain is in the western Caucasus just north of the Georgia-Russia border. This is the western most significant glacier complex in the Caucasus, here we focus on a glacier flowing east from the mountain and another on the north side. The east flowing glacier drains into the Psysh Valley and then to Arkhyz, while the north flowing glacier drains into the Zagedan River. The Caucasus region has been experiencing widespread significant retreat (Shahgedanova et al 2009), with average retreat of 8 m per year due in large part to increased summer temperatures. The larger glaciers of Mount Elbrus tend to garner most of the attention, but the retreat is widespread. This region has been an area of increased proglacial lake formation as well Stokes et al (2007). Psysh Mountain is 115 km east of Sochi, Russia. The glaciers mean elevation is 3000 m, more than 1000 m above the higher elevations of the Sochi Olympic skiing venues.
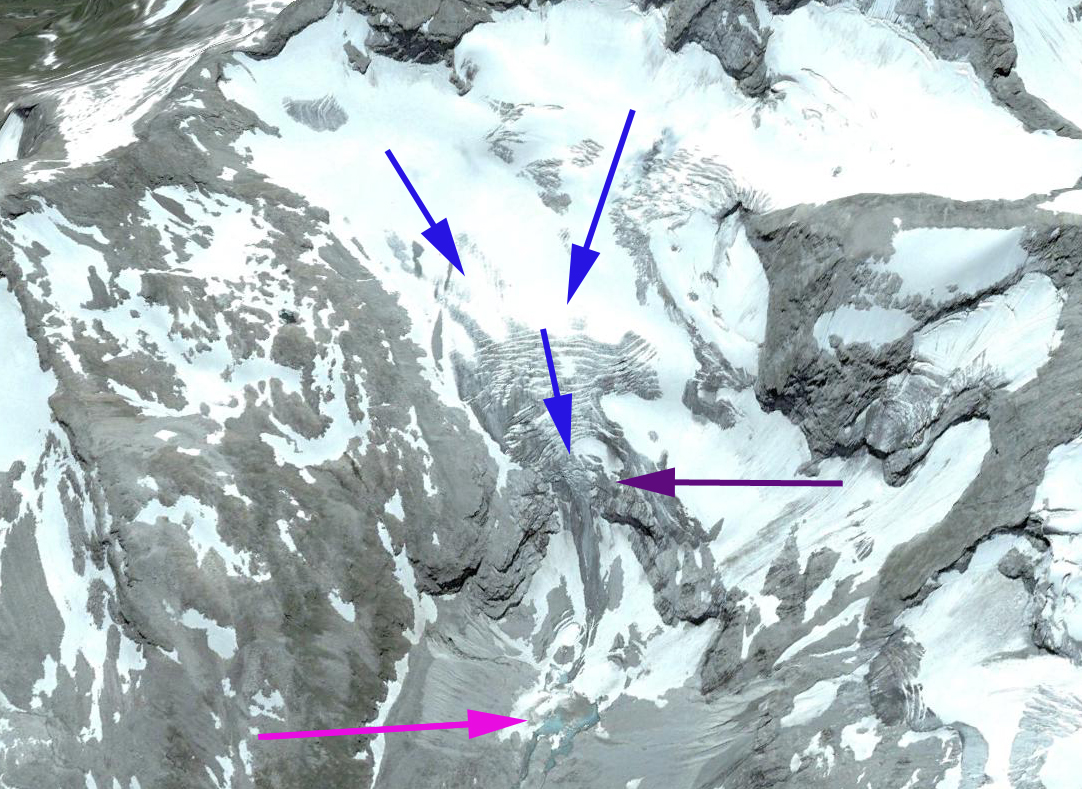
Here we examine the glacier retreat in Landsat imagery from 1998 to 2013. In 1998 the two glaciers of interest on the mountain ended in incipient proglacial lakes, less than 100 m across, yellow and red arrow. By 2013 the lake at the red arrow has expanded to a length of 400 m that the east flowing glacier ends in. The lake at the terminus of the north flowing glacier is now 350 m long. This indicates a retreat of 300 m for both glaciers. The pink arrow indicates the expansion of bedrock in the midst of the north flowing glacier. In the Google Earth image the most striking feature is how little of the glacier is above the snowline. In each image the snowline is indicated with pink dots. It is evident that neither glacier has a persistent significant accumulation area. These glaciers cannot survive without a persistent significant accumulation zone (Pelto, 2010). The blue arrow in the Google Earth image indicates an icefall in the east flowing glacier. Below the icefall the glacier has a low slope and is stagnant. This basin’s extent suggests the lake can expand another 1 km. The retreat of this glacier is similar to that of Gora Bashkara Glacier and Lednik Karugom.
North Cascades Climate Conditions:
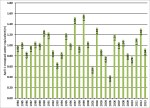
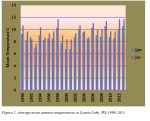
The 2013 winter accumulation season featured 93% of mean (1984-2013) winter snow accumulation at the long term USDA Snotel stations in the North Cascades, Washington (Figure 1). The melt season was exceptional by several measures. The mean summer temperature from June-September and July-September at Lyman Lake is tied with the highest for the 1989-2013 period (Figure 2). The average minimum temperature at Lyman Lake was the highest since 1989 for the July-September period, and tied with the highest for the June-September period (Figure 3). SeaTac airport minimums were high as well indicating the regional nature.
April First North Cascade Snowpack
Mean Summer temperature at Lyman Lake, WA
Mean minimum summer temperature at Lyman Lake, WA
Glacier Mass Balance:
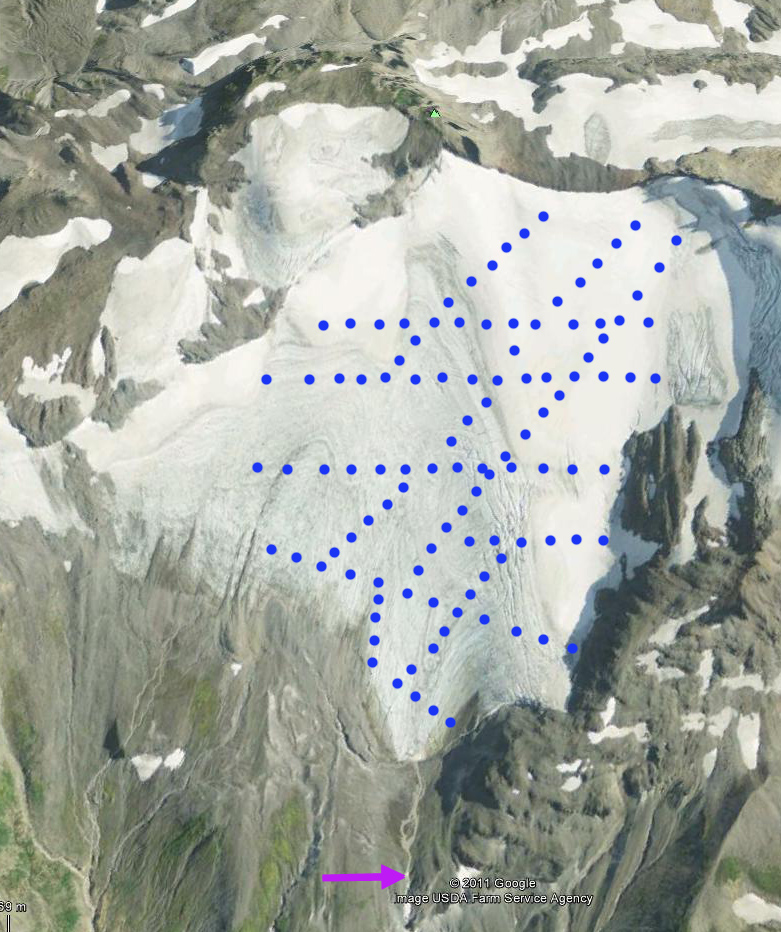
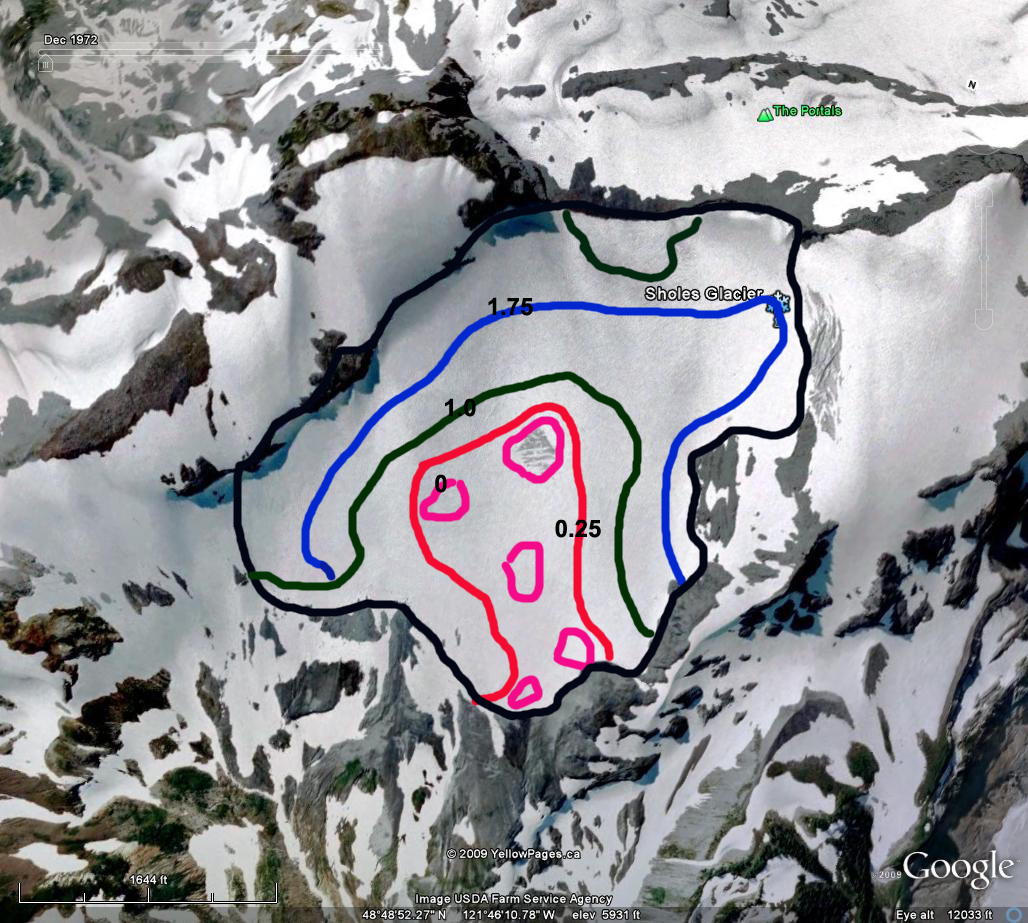
Snow depth was measured at a 30 m spacing across the entire glacier on August 4th. The position of the snowline indicates the location where snow depth is zero. Assessment of stakes emplaced in the glacier from Aug. 3-20 indicates mean ablation during the period of 7.8 cm/day. Assessment of ablation from remapping of the snowline on Sept. 1 indicates mean ablation of 7.5 cm/day during the August 4th-Sept. 1st period. A preliminary map of Sholes Glacier mass balance for Aug. 8th is seen below (Figure 6). The contours are in meters of water equivalent, which is the amount of water thickness that would be generated if the snow or ice was melted. Note the similarity of the 1.75 m contour and the Sept,. 12th snowline.The best measure of ablation over the period from August 4th to Sept. 12th is the shift in the snowline, as identified in satellite imagery (Figure 7 and 8). The snow depth at a particular location of the snowline on Sept. 12th indicates the snow ablation since August 4th. Observations of the snowline margin on Aug. 20, Sept. 1 and Sept. 12 indicated mean ablation of 7.4 cm per day from Aug. 4th to Sept. 12th.
Figure 4 Comparison of snowpack on Sholes Glacier on August 4th and September 1st, 2013
Figure 6. Snow depth distribution in snow water equivalent on Sholes Glacier on Aug. 8th, 2013.
Figure 7 August 4th satellite image showing snowline on Sholes Glacier from Landsat imagery.
Figure 8. September 12 snowline on Sholes Glacier from Landsat imagery
Snow depth observations on Easton Glacier on the bench below the main icefall at 2000 m, yielded an average depth of 3.1 m on Aug. 10th. The bench was completely snowcovered on Aug. 10th. GPS measurements of the snowline on Sept. 15th indicate ablation of 2.75 m since Aug. 10th. This is an ablation rate of 7.6 cm of snow melt per day. This is 0.2 cm/day higher than Sholes Glacier. The time period is not identical either. The southern orientation of Easton Glacier typically leads to higher ablation rates at specific elevations than on Sholes Glacier. Satellite observations of the change in snowline position compared to snow depth observations from Aug. 4th to Sept 12th indicate mean ablation of 7.2-8.0 cm/day.
On the four Mount Baker glaciers a total of 380 snow depth measurements were made on (Figure 9). The initial mass balance assessment is -0.78 m on Columbia Glacier. -1.58 m on Easton Glacier, -0.5 m on Foss Glacier, -0.76 m Ice Worm, -0.85 m on Lower Curtis Glacier, -0.40 m Lynch Glacier, -1.85 m on Rainbow Glacier, -1.7 m on Sholes Glacier and -1.15 m on Yawning Glacier.
Figure 9 Snow depth in crevasse on Easton Glacier.
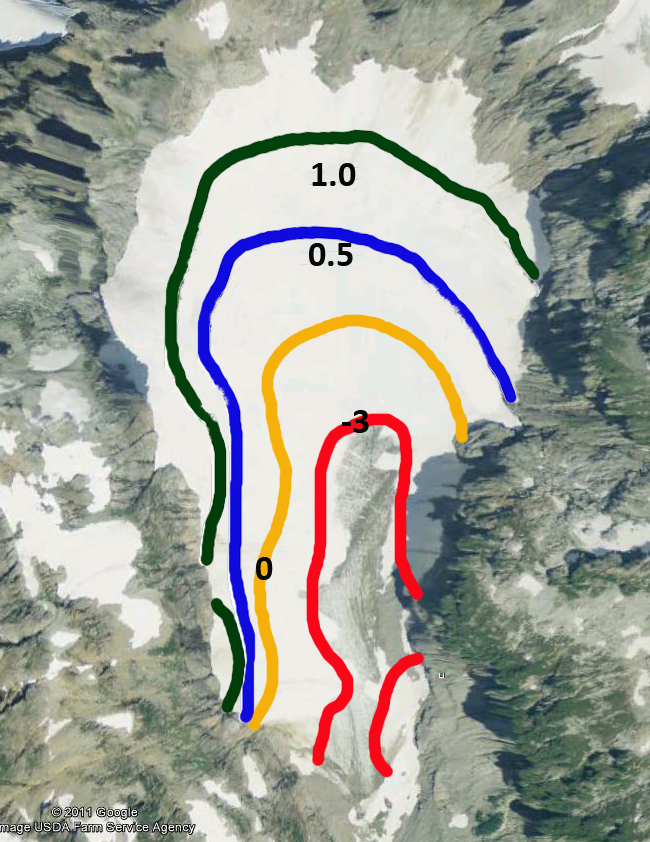
Figure 10 Mass balance map for Columbia Glacier in meters of water equivalent.
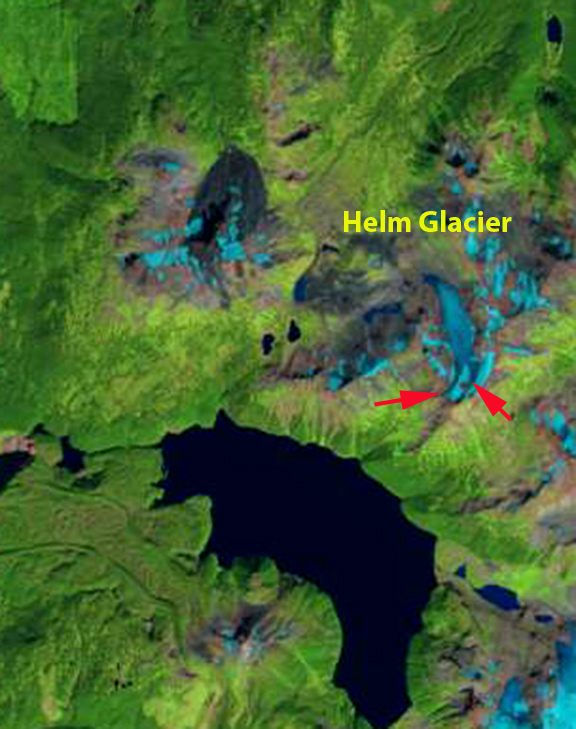
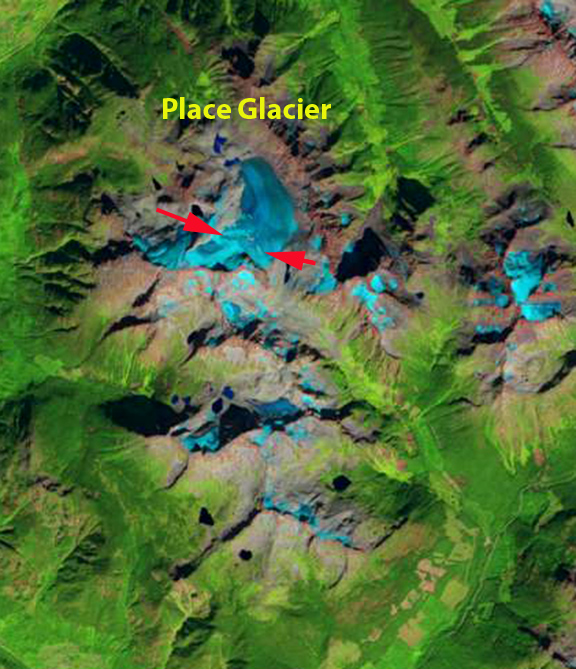
On the Juneau Icefield in southeast Alaska the ablation season was warmer and longer than normal. The result was snowlines rising above average at Lemon Creek and Taku Glacier, where the Juneau Icefield Research Program measures mass balance. For Taku Glacier the ELA was 1050 m, 75 m above an equilibrium snowline, and 1115 m, 100 m above an equilibrium snowline for Lemon Creek Glacier. The final mass balance for these glaciers will be in the -0.5 to -1.0 m range for both. Further north the USGS reports preliminary results, from there two Alaskan benchmark glaciers, which indicate that Gulkana Glacier in the Alaska Range, mass balance was the 5th most negative year. At Wolverine Glacier in the Kenai Mountains mass balance will likely be the most negative on record. In British Columbia both the Helm Glacier and Place Glacier are observed annually for mass balance. On Sept 12, 2013 Landsat imagery indicates limited remaining snowcover on both of these glaciers. The snowline is at 2050 m on Helm Glacier and 2300 m on Place Glacier, red arrows. The snowcovered area is less than 20% on Helm Glacier and 30% on Place Glacier, which will lead to large negative mass balances (Figure 11 and 12). Hence, all 16 glaciers examined here will have significant negative mass balances in 2013.
Figure 11. Landsat image indicating the snowline on Sept. 24, 2013 on Lemon Creek and Taku Glacier.
Figure 12 Helm Glacier in Landsat imagery 9-12-2013
Figure 13 Place Glacier in Landsat imagery 9-12-2013
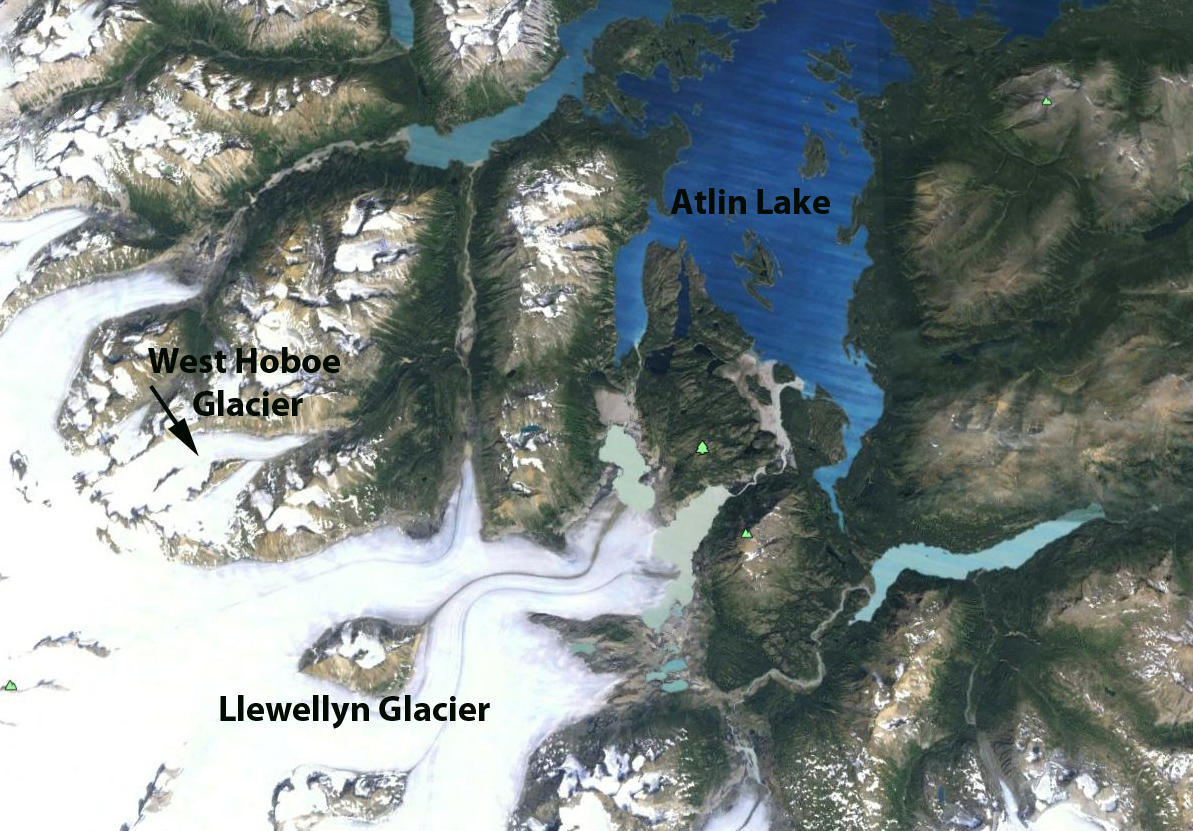
On the east margin of the Juneau Icefield is a small, compared to other glaciers, 7 km long unnamed valley glacier, here identified as West Hoboe Glacier. Here we use Landsat imagery to identify changes from 1984 to 2013. This glacier is just east of the retreating Hoboe Glacier and Llewellyn Glacier. The glacier flows from 2000 m down to 1250 m and drains into Atlin Lake at the headwaters of the Yukon River. In 2014 the Juneau Icefield research Program is planning to complete field measurements on this glacier for the first time.
Google Earth Image
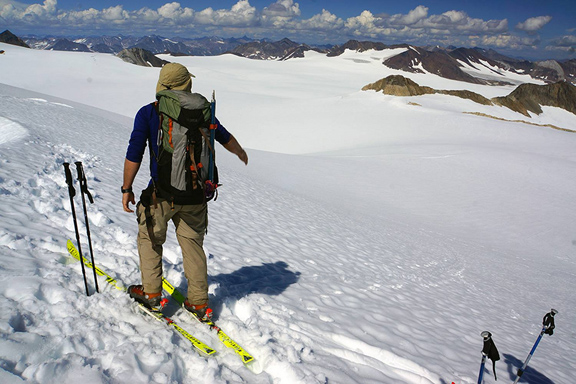
West Hoboe Glacier is in background of image from the Toby Dittrich led expedition to Mount Service in 2013.
In 1984 West Hoboe Glacier ended at the red arrow below a small cirque glacier south of the glacier. In each image the arrow and letters are in the same location, the pink arrow indicates the 2013 terminus position. Point A indicates a small ice filled basin connected to the West Hoboe Glacier in 1984. The green arrow indicates the junction of the two main arms of the glacier, which has a width of 1100 m. Point B and C are bedrock outcrops in the upper portion of the glacier. By 1993 the glacier has retreated a short distance from the 1984 terminus position, red arrow. By 2004 the glacier has continued to retreat from the 1984 position, red arrow, the tributary glacier junction, green arrow, has been reduced to 900 m. At Point A there is no longer ice in the basin. At Point B the bedrock outcrop exposure has expanded. Both indicate glacier thinning. In 2004 and 2009 snowcover is limited on the glacier. In 2013 a pair of Landsat images, August 1, 2013 and September 2, 2013 indicate that the glacier has retreated 850 m from 1984-2013, now ending at the base of a narrow landslide prone gully. The connection at the green arrow is 800 m, a 300 m reduction in width since 1984. The thinning of the glacier has led to bedrock expansion at Point B and C, this is a 12% reduction in total length. At Point A the separation between the basin and the glacier indicates both marginal retreat and thinning of the glacier. Notice that 70% of the glacier in early September has lost its snowcover. The thinning even at the top of this glacier indicates it will not survive current climate.
1984 Landsat image
1993 Landsat image
2004 Landsat image
2009 Landsat image
8-1-2013 Landsat image
White River Glacier in the North Cascades of Washington is on the southeast flank of Glacier Peak. From 1955-1967 White River Glacier had a stable though thinning terminus. In 1967 the glacier descended from the summit area of Kololo Peak separating into two terminus tongues ending in two basins. In both basins the glacier terminus filled the basins and flowed a short distance beyond the basins. During my first visit to the glacier in 1988 there was the fringe of a new lake for both the northern and southern arm of the glacier at the yellow and red arrow respectively, with retreat of both termini into the basin, 60 m of retreat. The southern terminus is fed by an icefall green arrow.
1967 Image from Austin Post (USGS)
1988 image
By 1995 when we returned the northern branch of the glacier, red arrow, had developed a lake that was 150 m across, and the terminus was in contact with the lake. The southern basin was still mostly ice filled, with 60 m of open water at the southeast corner. In 2002 we revisited the glacier the northern basin terminus had retreated 20 m from the lake. The southern basin was still filled with glacier ice, but this ice was now flat and floating in the water. There were numerous water filled cracks. The lake was 265 m across. By 2002 the terminus had retreated out of the southern lake basin ending at the base of the icefall slope. The lake is evident even with its floating glacier ice cover. In 2006 and 2009 Google Earth imagery the retreat of the southern terminus up the icefall slope is evident. In 2013 there is still floating glacier ice in the southern lake basin, image from Stefan Feller. The glacier retreat of the northern terminus from 1967-2013 has been 370 m, the southern terminus 450 m. The main issue for this glacier is that the upper part loses snowcover during many years. This means the glacier is having a disequilibrium response to climate and will not survive (Pelto and Hedlund, 2001). Thinning and retreat of the upper glacier indicates the lack of a persistent accumulation zone, hence the glacier cannot survive our greenhouse warmed climate, leaving mother nature less than pleased.
Mother Nature sketch from Megan Pelt-Savannah College of Art and Design
Winter is halfway done in terms of the accumulation season for glaciers in the Sierra Nevada-Cascades of Northern California to the Coast Range of Southern Alaska. The entire region has experienced a warm winter, with dryness most pronounced in California. This has been caused by a persistent blocking ridge along or just offshore of the west coast. The feature may disappear for a few days, but always has rebuilt. Image from GeoEnviromental Atmosphere
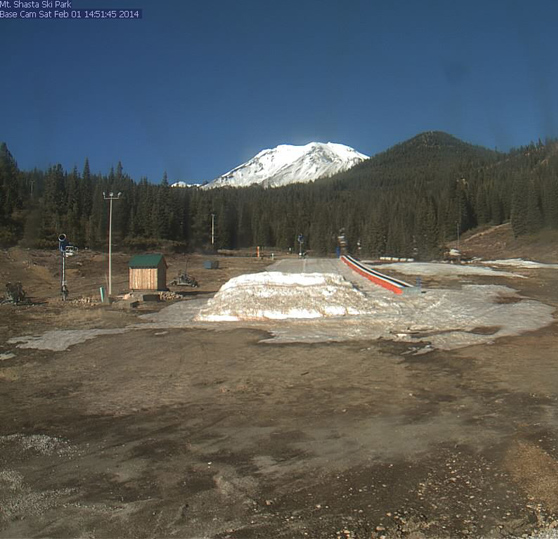
To the south the snowpack in the Sierra Nevada is 20% of normal and the lowest seen. Pictures like that of the Mount Shasta ski park look more like June 1 than February 1.
Mount Shasta Snow Park webcam images from Feb. 1 looking toward Mount Shasta, above and below.
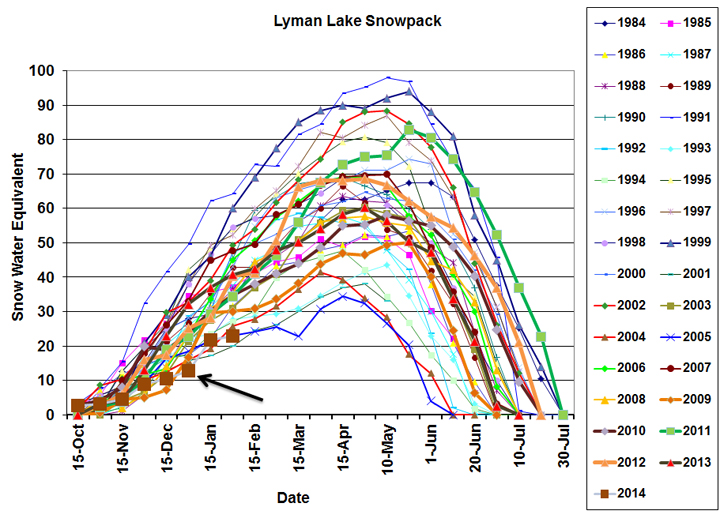
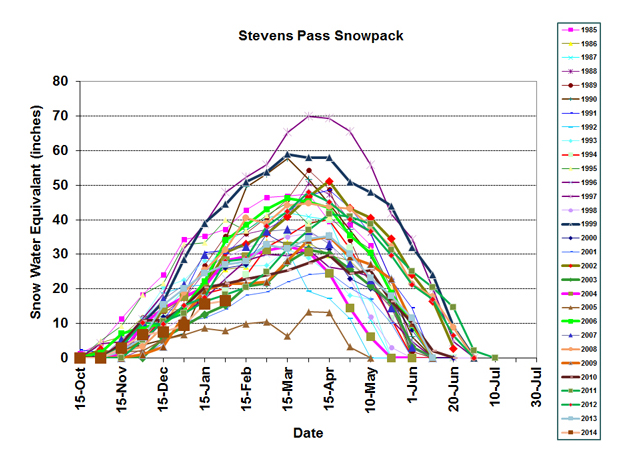
In the North Cascades of Washington where we have measured glacier mass balance every year for 30 years, the snowpack is better, but as seen in the comparison of snowpack at two USDA Snotel stations at Stevens Pass and Lyman Lake, snowpack is near the record low of the last 30 years. At the Snoqulamie Summit ski areas 70% of the terrain is open, but all nordic trails are closed due to lack of snow.
The result hikers heading into one of the glaciers we work at on Mt. Shuksan experienced late January snowpack the same as we saw in August of 2011 the best snow year since 2000. January 2014 pictures below are from Chad Straub posted at jebsjourneys.com, while the August 2011 images I took. Locations of images are along same trail in quite close proximity. Snow depth and snow water equivalent are 50% of normal. However, the deficit is 20 inches of water equivalent, which is an amount that just cannot be erased even by a wet late winter. The deficit increases at lower elevations as the view across Baker Lake from an elevation of 2500 feet in the Mountain Hemlock zone indicates, marginal snow until 3500 feet, last picture in gallery.
August 2011 Swift Creek
August 2011 Swift Creek
Swift Creek August 2011
Swift Creek January 2013
Swift Creek January 2013
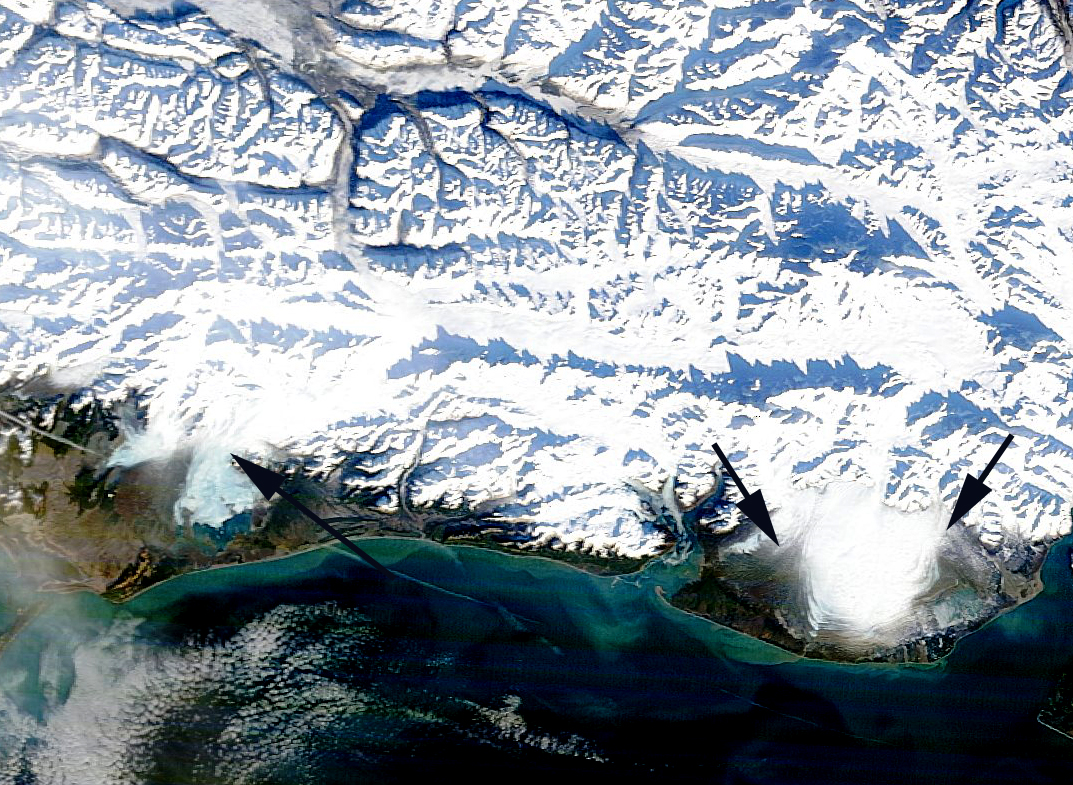
In the Vancouver area Grouse Mountain and Cypress Mountain ski areas have had just over 100 inches of snow, well below average. Further north into Alaska we have heard how warm it has been even to Nome. On Monday, January 27, the mercury in Nome hit 51°F under sunny and clear skies. With this astoundingly high temperature, Nome not only set the all-time high temperature record for any day in January since weather data keeping began in Nome in 1907, but also tied with a five-month high temperature record held on November 1, 1926 (Diana Haecker, Nome Nugget). However, it has not been as dry as storms have been diverted in north around the blocking ridge that has kept the west coast dry. Snowpack around Juneau, Alaska is low at the base of Eaglecrest ski area, leading to closure of the lower nordic loop, but not at the summit where the depth is 124 inches. At Alyeska Ski area near Anchorage the 295 inches of snow this year is good, but the warm temperatures have left only 2 inches at the base and a number of closed runs. This will lead to limited snowpack low on glaciers, but snowpack may be adequate higher on the glaciers. On Feb. 1 the snowline is evident on the two largest glaciers in Alaska, Malaspina and Bering Glacier (black arrows) in MODIS imagery at 600 m. My first year working on glaciers in 1981 was a warm low snow year in Juneau, but at 6000 feet on the Juneau Icefield snowpack was above average. It is evident from the Vancouver area south to the Sierra Nevada 2014 will not be a good year for glaciers, north from Vancouver it is not as clear yet.
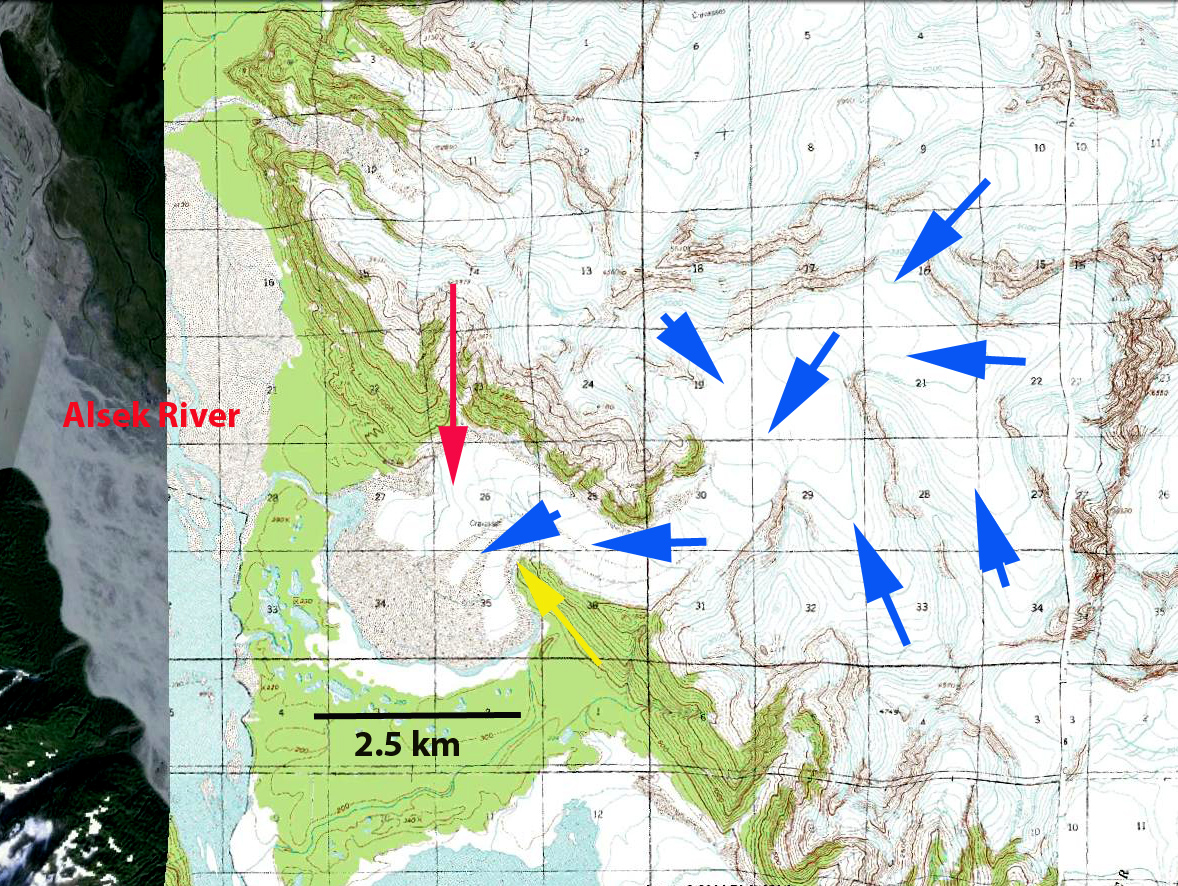
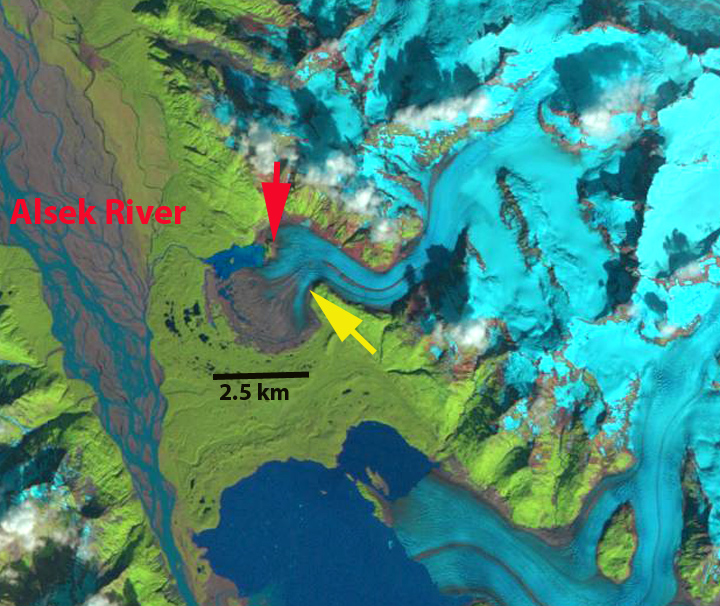
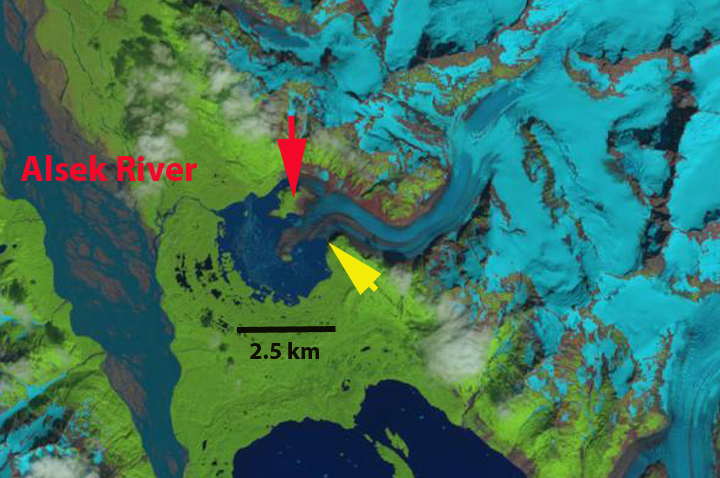
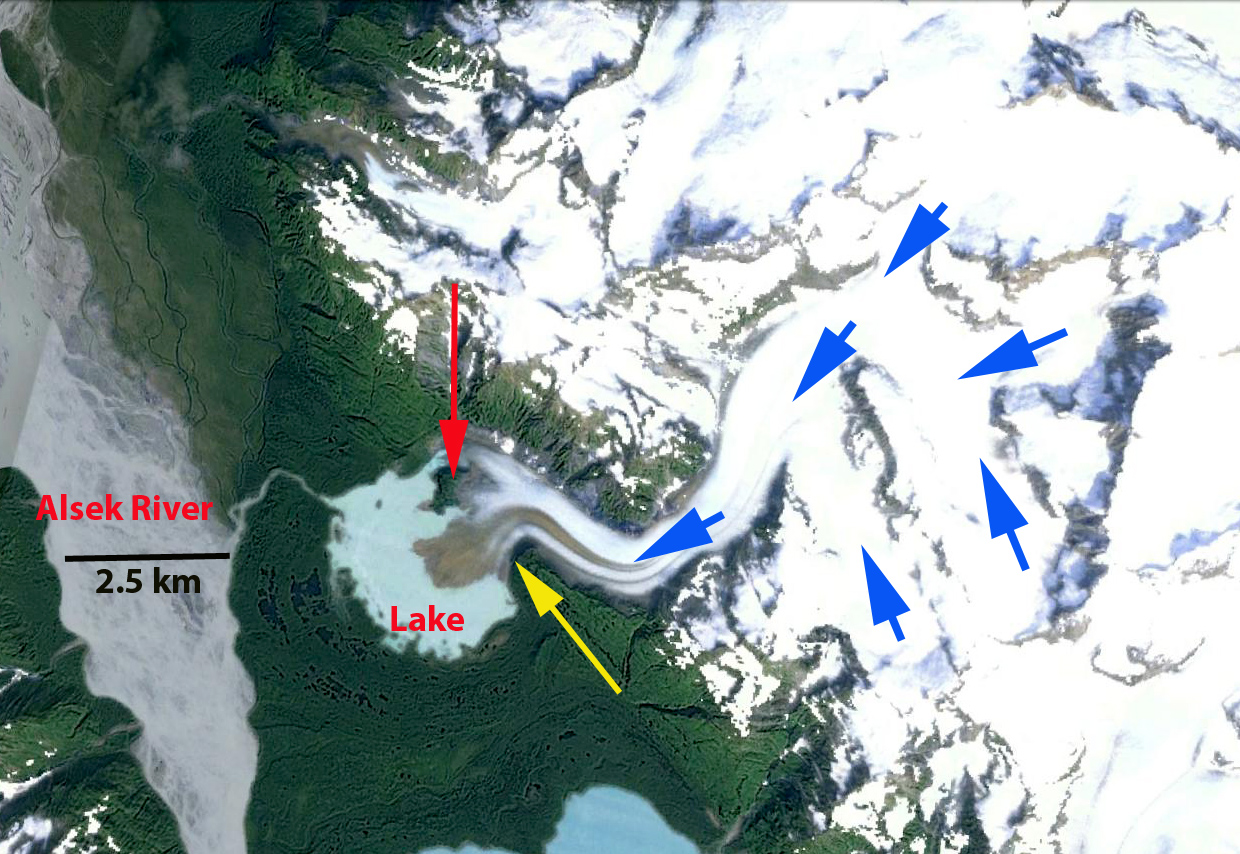
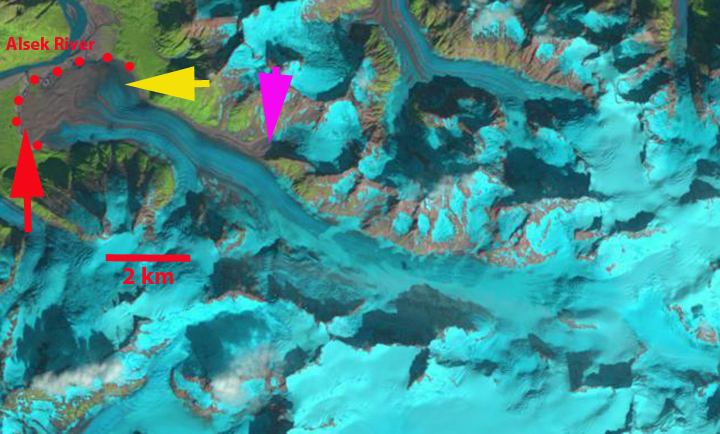
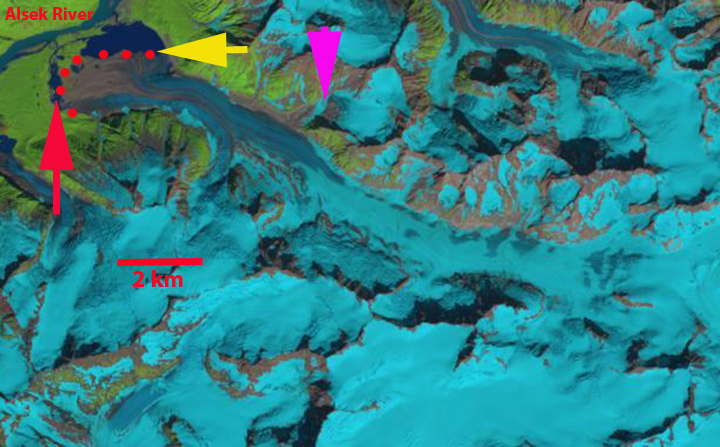
The Alsek Glacier is a large glacier draining into Alsek Lake and the Alsek River. The first glacier upriver of Alsek Glacier flowing from the east and ending on the Alsek River valley floor is an unnamed glacier, here named North Alsek Glacier. The USGS topographic map compiled from a 1958 aerial image indicates a piedmont lobe spread out on the Alsek River lowland, without a lake, and a series of moraine ridges between the glacier terminus and the Alsek River. This glacier drains a series of peaks of 2000 m in elevation and drains directly west toward the Alsek River, blue arrows indicate glacier flow.
USGS map indicating no lake at end of glacier.
Here we examine Landsat imagery to identify the change in terminus position of the glacier from 1984-2013. In 1984 a small lake has developed along the north shore of the lake that is 1000 m by 500 m. The glacier has retreated to a newly exposed knob, possilby and island, at the red arrow. The red arrow in each image indicates the location of this knob, the yellow arrow indicates the 2013 terminus location on the south side of the glacier near the end of a peninsula. There is no lake downglacier of the yellow arrow in 1984. By 2011 the glacier retreat has led to development of a substantial lake that is 2.5 km north to south and 1.1 to 1.5 km side from east to west. In 2013 the central tongue of the glacier has continued to thin and breakup. The northern margin has retreated 2300 m from 1958 to 2013, the central margin 1500 m and the southern margin 1400 m. The majority of the retreat at the northern margin occurred between 1958-1984, while nearly all the retreat occurred after 1984 for the central and southern portion of the glacier. The glacier will continue to retreat out of the lake basin. The retreat has been nearly identical to nearby Walker Glacier that also had a piedmont lobe, but less than the nearby East Novatak Glacier and Yakutat Glacier.
Walker Glacier terminates adjacent to the Alsek River, a popular rafting river route. Many rafting trips visit Walker Glacier since it is close to river, has a low slope and few crevasses.
Google Earth Image
In 1984 the glacier ended as a piedmont lobe separated from the river by meters. Today the terminus has retreated into a lake basin at the terminus. Here we examine Landsat imagery from 1984, 2011 and 2013 to identify retreat and lake development. In 1984 there is no lake at the terminus, red dots indicate glacier margin. The terminus particularly on the northwest side is debris covered. The yellow and red arrows indicate locations where the terminus is in 2013 and where new lakes have developed. The pink arrow indicates the end of a tributary that has fed the Walker Glacier. By 2004 the Google Earth imagery indicates a lake that is 400 m wide and 1500 m long. By 2011 the lake on the north side of the terminus is well developed, yellow arrow, but on the west side of the terminus no lake exists, red arrow. By 2013 the new lake is 750 m wide and 1800 m long. The glacier has retreated 800 m since 1984 on the north side, yellow arrow. A narrow lake has now developed on the west side. The combination of lakes indicates that the entire terminus lobe in the lake basin will soon be lost. The terminus remains quite debris covered, has a gentle slope and is relatively uncrevassed; hence, it is stagnant and will collapse-melt away. The last image is from Colorado River & Trail Expeditions , that shows low glacier slope looking north across new lake. This is similar to the collapse of glacier termini in proglacial lakes such as nearby East Novatak Glacier, Grand Plateau Glacier and Yakutat Glacier.
1984 Landsat image
2011 Landsat image
2013 Landsat image
Google Earth image from 2004
Colorado River & Trail Expeditions image-note low glacier slope looking north across new lake.
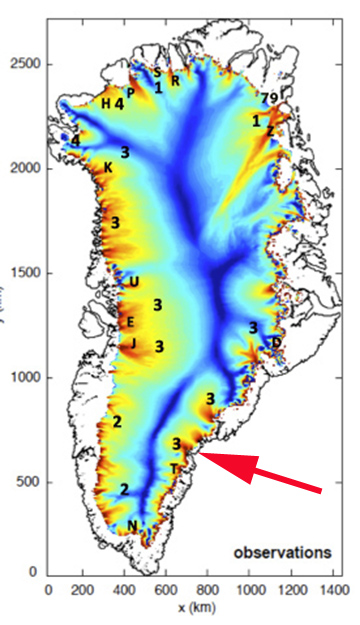
Koge Bugt Glacier is an outlet of the Greenland Ice Sheet on the southeast Coast. The glacier empties into the bay of the same name, and has three main calving fronts. This glacier is the the sweet spot for high snowfall and hence, despite its smaller size is one of the larger outlet glaciers in terms of volume. Koge Bugt Glacier is not an oft mentioned glacier it is not as fast as Helheim or Jakobshavn, does not have as long a calving front as Humboldt Glacier. Does not calve icebergs nearly as large as Petermann Glacier. Does not penetrate into the midst of the ice sheet as far as Zachariae Ice Stream or 79 Glacier. However, according to observations of Enderlin et al (2014), Koge Bugt has the second largest volume flow for the entire ice sheet. They further note that the glacier has had the third greatest volume anomaly since 2000, that is increase in discharge. Murray et al (2010) indicate Koge Bugt had accelerated and thinned in concert with other glaciers in the region. The second image below is Figure 1 from their paper indicating the 27,000 square kilometer drainage area of Koge Bugt.
Howat and Eddy (2011) examing 210 outlet glacier in Greenland noted that 191 retreated from 2000-2010 including 89% in SE Greenland. Howat and Eddy (2011) data indicated limited retreat of Koge Bugt Glacier before 2000. From 2000 to 2010 they noted a retreat of 2300 m of outlet C, 1650 m for outlet B and 300 m for outlet A. Each of these outlets has a heavily crevassed active calving front having widths of 5000 m for A, 3500 m for B and 3500 m for C. Outlet B has calved a large iceberg, and there is a substantial rift near the calving front.
Greenland Velocity map with Koge Bugt indicated by red arrow.
Koge Bugt Drainage area from Murray et al (2010)
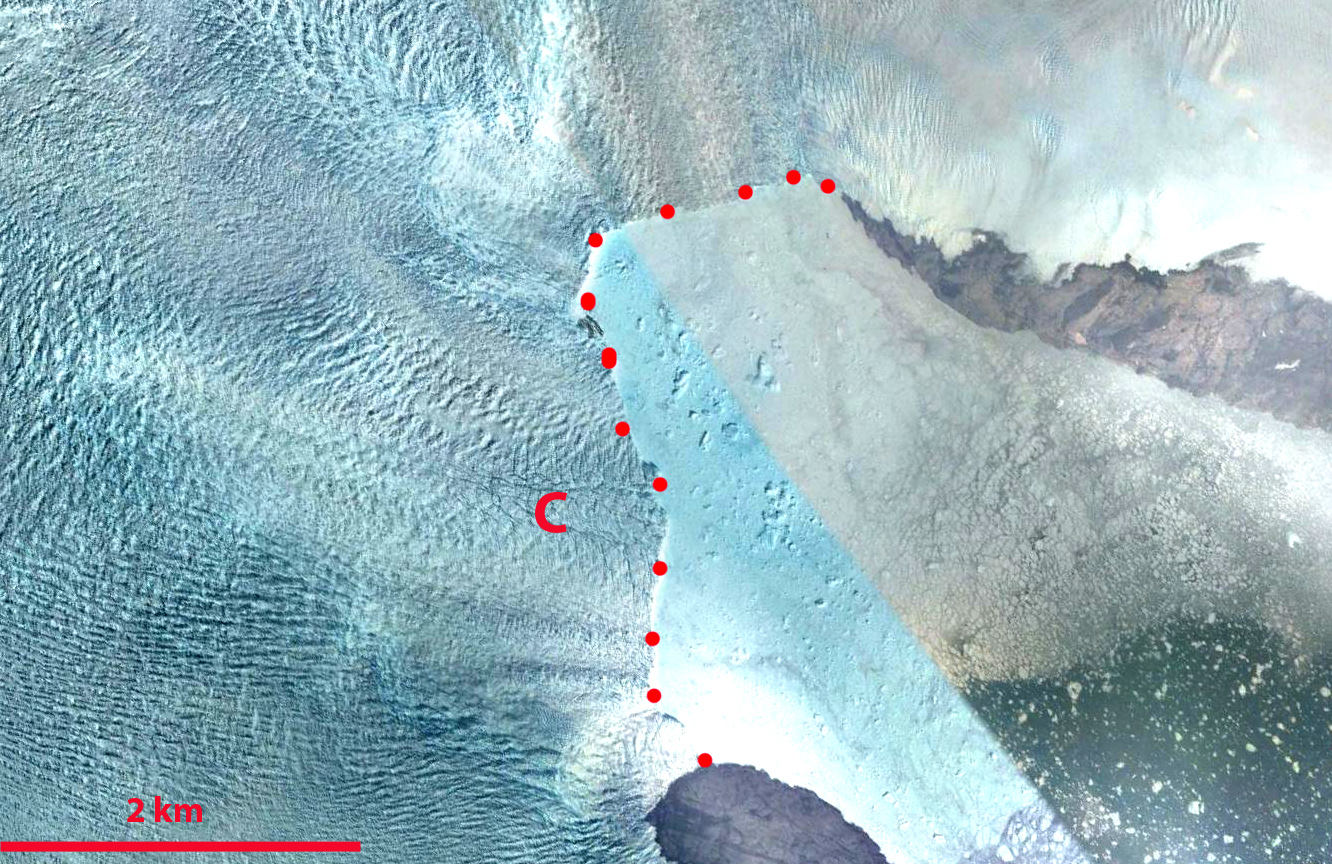
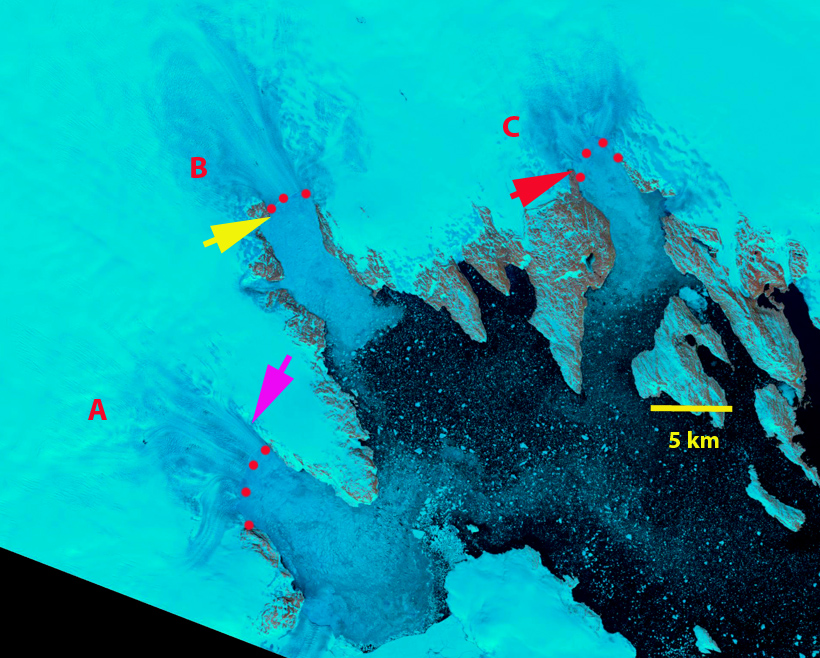
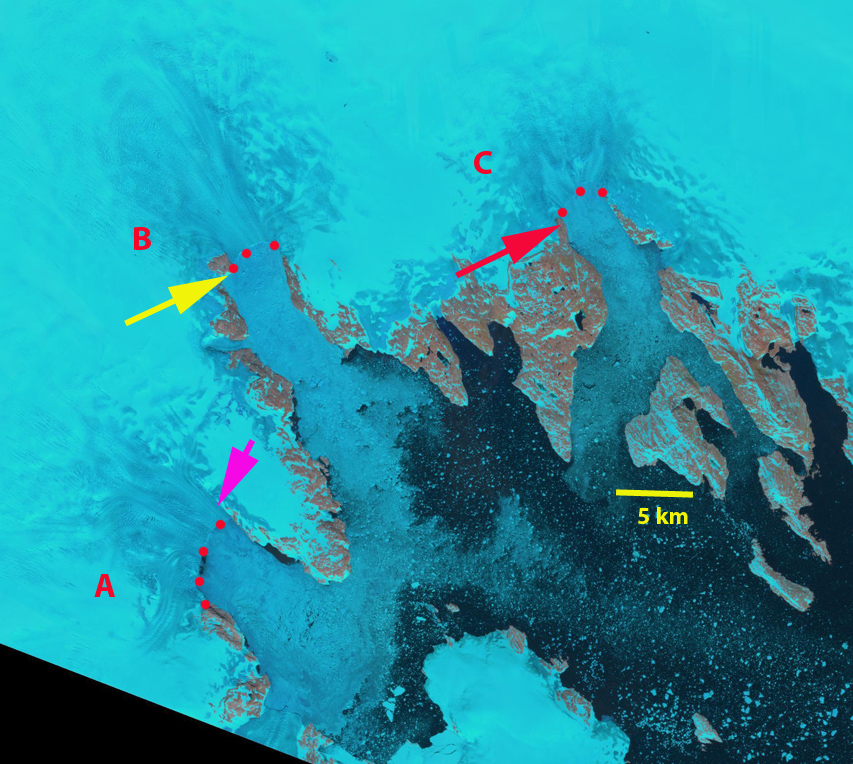
Below is a sequence of Landsat images from 2001-2013 of the Koge Bugt Glacier three main termini. In each case the red dots indicate the calving front, the purple arrow is at the same spot on the north side of terminus A, the yellow arrow at the same spot on the west side of terminus B and the red arrow at the same spot on the west side of terminus C. From 2001 to 2011 terminus A has retreated little on the south side, but has retreated 1.5 km on the north side. Terminus B has retreated from halfway along the island on the southwest side of the terminus to the north of this island by 2011, a retreat of 2.2 km. Terminus C has retreated beyond the north end of the Peninsula noted by the red arrow, a distance of 600 m. Given the size and velocity of Koge Bugt this is a minor retreat, that can be erased by a year with more limited calving. The melt zone in these July and August images indicates how limited the ablation zone is compared to the west side of the ice sheet, this also limits the occurrence of supraglacial lakes.
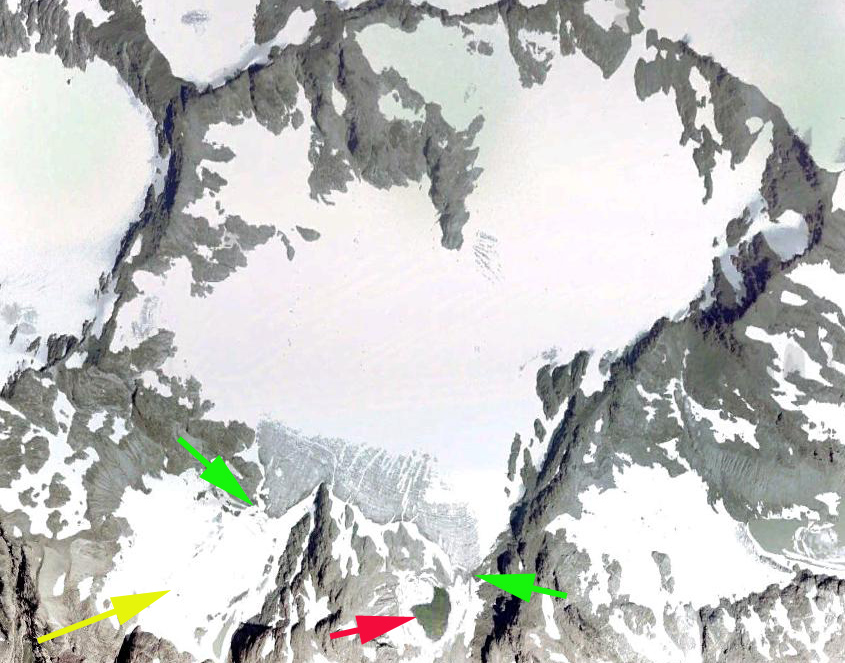
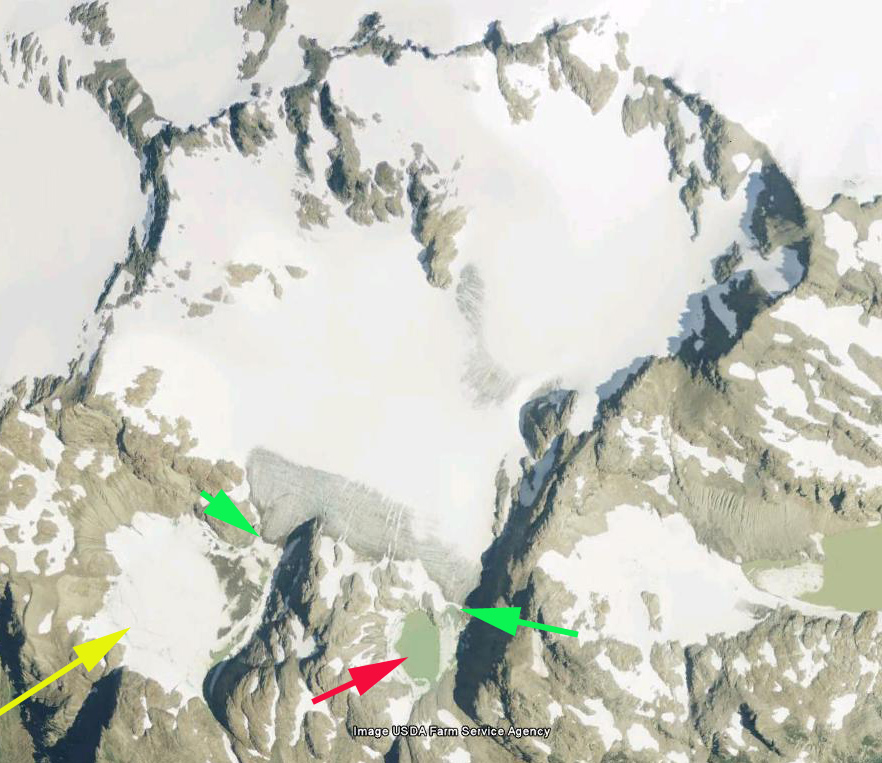
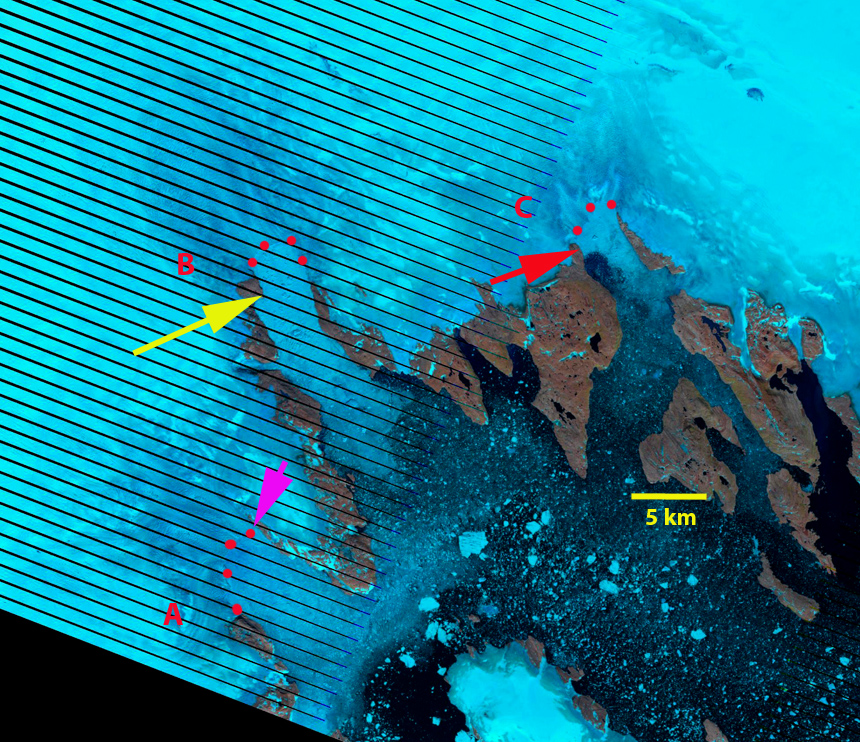
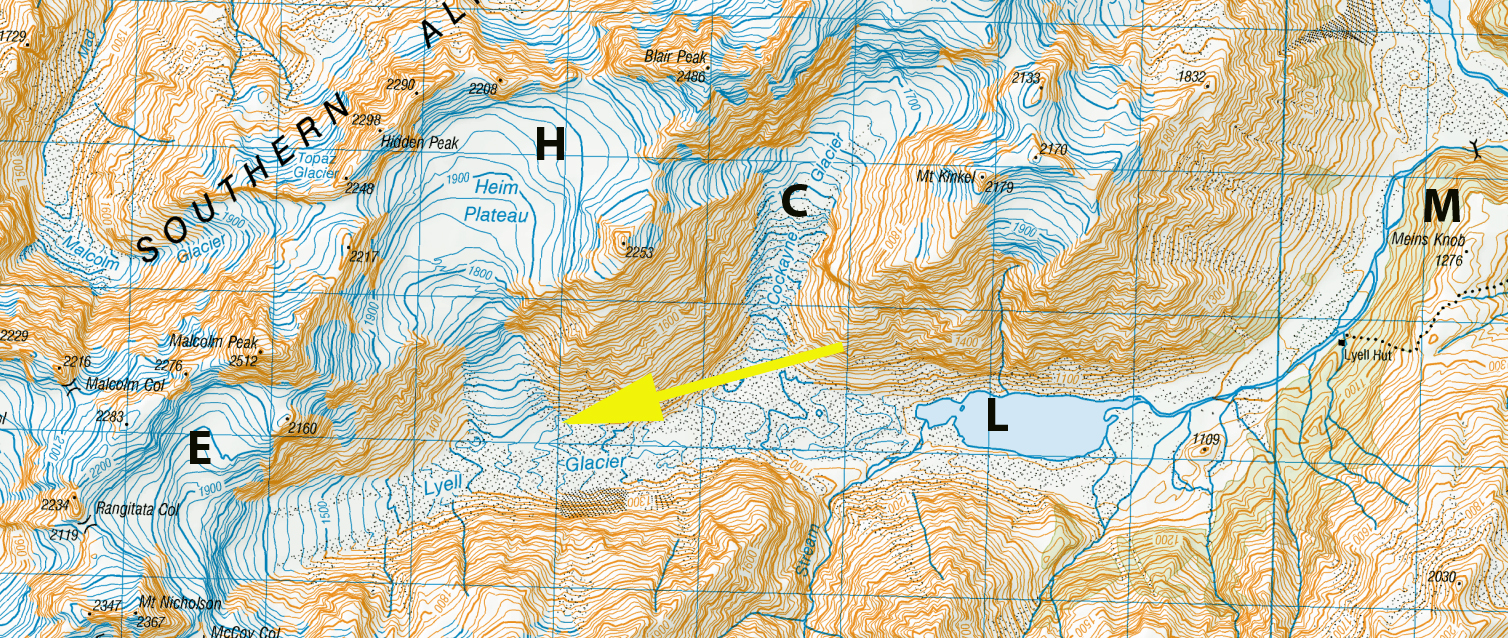
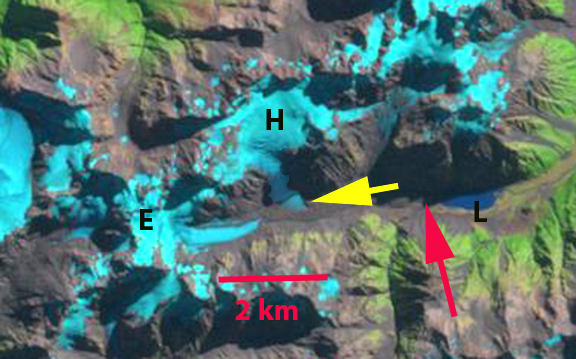
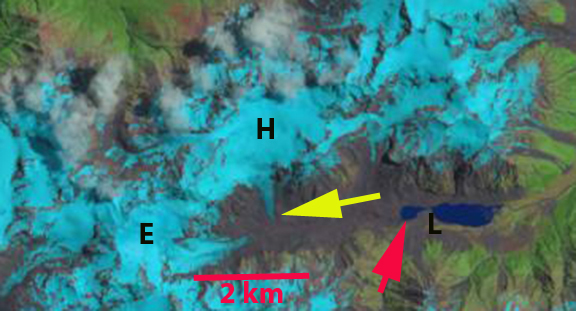
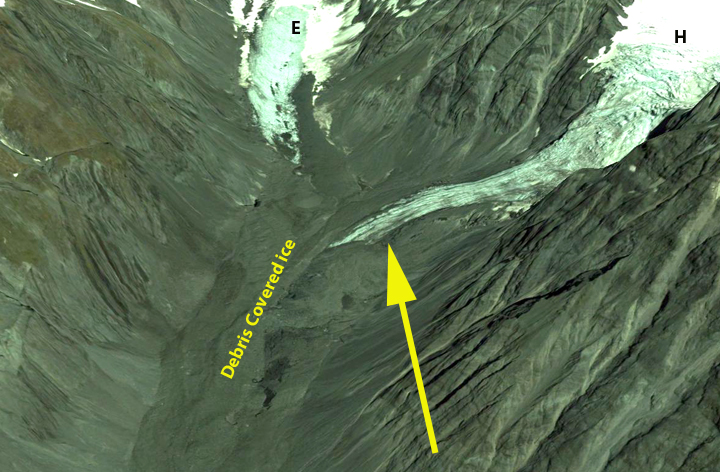
The Lyell and Ramsay Glaciers are the northernmost substantial valley glaciers in the Southern Alps of New Zealand. Their combined run-off is the chief source of the Rakaia River. The Lyell glacier was first observed by Dr.von Haast in 1862, from Mein’s Knob (M), at the time the glacier was 9 km long and ended close to Mein’s Knob. In 1949 Lyell glacier extended east from Rangiata Col some 7 km, and Lyell Lake (L) had not yet formed. (Gage, 1951). The Lyell Glacier has been the combined flow from the easterly tributary near Rangiata Col (E) and a northern tributary, Heim Plateau (H). Here we examine Google Earth Imagery and Landsat images from 2000-2013 to identify changes in the Lyell-Heim Glacier complex.
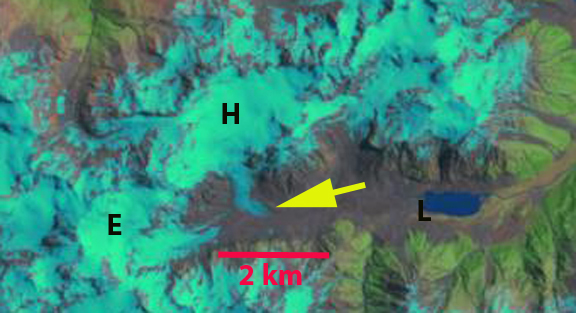
In 2000 the Heim Glacier (H) reached onto the Lyell Lake valley floor, yellow arrow. In 2001 this is evident along with the fact that Lyell Lake is a single lake. The terminus of the Lyell Glacier is obscured by thick glacier cover, and does end near Lyell Lake at the time, the end of the blue ice of the E tributary is not indicative of the terminus location. By 2013 Heim Glacier has retreated from the Lyell Valley and no longer is connected to the Lyell Glacier. A second small lake has formed as the terminus of Lyell Glacier has melted and retreated, red arrow. The terminus of Lyell Glacier does remain buried by debris, but it is stagnant and melting away. Both the Lyell Glacier and Heim Glacier have retreated 400 m from 2000-2013. The Lyell Glacier will likely experience a more rapid retreat in the near future as the debris covered tongue melts away. The 2013 austral winter featured record warmth, and the early melt season has also been warm in New Zealand, the impact on this glacier can be assessed in March or April as the melt season ends. The NIWA snowline surveys will document the impact on glaciers across New Zealand. The glaciers of New Zealand lost 15% of thier volume from 1976-2008 (Chinn et al, 2012). The retreat is like that of most all New Zealand glaciers today, Donne Glacier, Gunn Glacier, Tasman and Murchison Glacier
Novatak Glacier and a large unnamed south-flowing glacier to the east, here designated as East Novatak Glacier, were connected when first mapped by the International Border Commission in the 1906-08 period. By the 1950’s maps indicated the Novatak and East Novatak Glacier have separated, with a lake (A) developing between them. Here we examined 1984-2013 Landsat images to determined changes over the last 30 years.
Map of East Novatak Glacier area.
Google Earth image
East Novatak Glacier ended in a lake (B) in 1984, this lake then drained a short distance south to the Alsek River. The glacier was separated from the main Novatak Glacier by 3.5 km. In each image the 1984 terminus is marked by red arrow and 2013 image by yellow arrow, N marks the location of a nunatak that develops after 1984. In 1987 glacier retreat has connected the northern and southern half of B Lake. Lake A is still getting glacier runoff leading to a lighter blue color. By 2010 A Lake is no longer getting much glacier runoff and the water color is much darker than B Lake. A nunatak has emerged as well due to thinning ice. East Novatak Glacier has retreated out of the lake basin on the low lying plain, and into the mountain valley. In 2013 the terminus has narrowed and has retreated 2.5 to 3 km since 1984. The glacier is now separated from the retreating Novatak Glacier by 6 km. The tributary that used to connect to the main glacier and is partly obscured by the red arrow, now ends well short of the East Novatak Glacier. Most of the East Novatak Glacier is below 1000 m in elevation, which has been the recent snowline elevation. The retreat of this glacier like that of nearby Yakutat Glacier, indicates how suscpetible the Alaskan glaciers in the region with lower elevation accumulation zones are to our warming climate (Truessel et al, 2013). The retreat is similar to Grand Plateau Glacier, but that glacier does have high elevation accumulation areas, that will allow that glacier to survive.