
The Devon Ice Cap on Devon Island in the Canadian Arctic ice cap’s area has an area of 15,000 km2, with a volume of 3980 km3. The ice cap area decreased by 600 km2 (4%) between 1960 and 2000 (Sharp et al, in press). The ice cap has been the focus of an ongoing research program led by the University of Alberta Arctic and Alpine Research Group and Natural Resources Canada in Ottawa. The mass balance from 1960-2009 has been cumulatively -5.6 m, with nine of the eleven most negative years occurring since 1998. The Devon Ice Cap’s negative balance has been due to warming and greater ablation, as the upper part of the glacier has seen some increase in accumulation, which has been more than offset by increased melting ( Sharp et al, 2011). Belcher Glacier is the the principal outlet glacier calving up to 40% of the total iceberg volume from the ice cap.  Belcher Glacier and its neighbor Unnamed5 Glacier are the focus of this post. A recent study by Van Wychen et al (2012) focused on velocity changes of the Devon ice Cap. The fastest velocities of 200-250 meters/year are at the front of the Belcher Glacier. A comparison between Belcher Glacier’s velocity from the 1991-2000 period and 2009 indicate that Belcher Glacier velocity has declined at the glacier front recently, which has likely aided the glacier in slowing retreat, an excellent time lapse gives a sense of the dynamics. Here we used 1998 (top), 2008 (second image) and 2010 Landsat imagery(bottom image) combined with Geoeye imagery (third image)from 2010 to identify changes in glaciers adjacent to the Belcher Glacier. To the north of Belcher Glacier a small nunatak is evident at the red arrow. This nunatak is 500 meters inland from the terminus in 1998 and is at the terminus in 2010. The orange arrow indicates the terminus of a land terminating glacier which in 1998 reached a small inlet in the peninsula emerging from under the ice cap. By 2010 the glacier has pulled back 250 meters from this inlet. The yellow arrow indicates the terminus change of Unnamed5 Glacier. The glacier has pulled back to the base of a zone of intense crevassing between 1998 and 2010 a retreat of 500 m. The next glacier to the east in 1998 has a 600 meter wide margin in the ocean. By 2010 the glacier front is in contact with the ocean for less than half this length.


 . Further to the east from Belcher and Unnamed5 Glacier there is a set of three islands that are losing contact with the Devon Ice Cap between the 1998 Landsat and 2009 Geoeye imagery, violet arrows 2009. The losses paralell those from other Canadian Arctic glaciers, Penny Ice Cap.

Category: Glacier Observations
Post detailing changes in a glacier
Gietro Glacier Retreat and Hydropower, Switzerland
Gietro Glacier may sound like a type of italian dessert, but this glacier has a deadly history. During periods of advance the glacier blocked off the valley of Mauvoisin. Failure of the glacier ice dam led to large flood events in 1595 and 1818 that lead to the loss of many lives in the valley below. Today the Mauvoisin Dam one of the 10 largest concrete arch dams in the world not only provides hydropower but also protection against this hazard. In 1818, an advance of the Gietro glacier, now retreated high above the reservoir, generated ice avalanches which blocked the flow of the river. When the ice barrier was breached, 20 million cubic meters of flood water was released devastating the valley (Collins, 1991).There are several other large glaciers in the basin Otemma, Mont Durand and Brenay that provide runoff to power what is today a large hydropower project. The Mauvoisin Dam can produce 363 MW of power, and typically provides 1030 millionKWh of power each year. The reservoir can store 200 million cubic meters of water. Erosion largely from the glaciers in the watershed produce enough sediment to cover the lake bottom with 60 cm of sediment per year (Loizeau, et al. 2010). 
 Gietro Glacier is one of the glaciers where the terminus is monitored annually by the Swiss Glacier Monitoring Network (SCNAT). The glacier advanced 150 m from 1962-1985. Retreat from 1985 to 2000 was 110 m or 7.5 m/year, accelerating to 275 m from 2000-2010, 27.5 m/year. This post focuses on comparison of a 1988 Landsat image, 2001 terminus photograph from the SCNAT and 2009 Google Earth imagery. In 1988 the glacier terminates at the top of a steep cliff that is evident in the 1988 image, yellow arrow, dam is burgundy arrow. By 2001 the glacier has retreated to the first prominent joint feature, green arrow, on the north side of the glacier above the cliff, still yellow arrow. In 2009 the terminus is indicated by a blue arrow. A limited area above the terminus is stagnant an area that is 200 m by 150 m, red arrow. Above this point the glacier has been thinning, but still remains active as indicated by the crevassing.


 . The glacier in 2009 has very limited snowcover by the end of the summer. A glacier to thrive should be 60% snowcovered at the end of the melt season, in this case it is less than 20%, green dots mark the main snowline below. The lack of snowcover indicates a negative mass balance that is driving the retreat. If the glacier consistently loses most of the accumulation zone snowcover it cannot survive (Pelto, 2010). In the Swiss Glacier Inventory(Kääb et al, 2002), noted a 21% loss in glacier area from 1973-1998, with almost all the change occurring after 1985. The retreat if this glacier is similar to that of other Swiss glaciers, Ried Glacier and Triftgletscher
Jorge Montt Glacier Retreat
The Jorge Montt Glacier is one of the main tidewater glaciers of the Southern Patagonia Icefield. The glacier has been the focus of ongoing annual observations by the Laboratorio de Glaciologia at the Center for Scientific Studies, University of Chile. Two recent papers highlight the dramatic changes this glacier is undergoing. The glacier has retreated 19.5 km from 1898-2011 (Rivera et al, 2012a). A recent photograph of the terminus from Andrés Rivera indicates the extensive crevassing and calving of icebergs indicating the high very high velocities. . The velocities were determined from tracking of salient features for an 11 month period using time lapse photography and indicated a mean velocity of 13 meters/day, with maximum velocities of up to 33 meters/day, in the center of the glacier (Rivera et al, 2012b). These velocities rival the high velocities on the faster Greenland outlet glaciers and San Rafael Glacier, Chile. They did not observed seasonal velocity changes. This paper provides a nice visual of the velocity, top image. The velocity and retreat tend to increase when water depth increases. The mean water depth at the calving front has declined from over 260 m 1997-2003 to closer to 220 m 2003-2011, bottom image indicates the water depths from Rivera et al (2012a).
  .
.  . A map of the long term retreat of the glacier is provided in both papers, here we examine a closeup view of the lower glacier from Landsat imagery in 1997, 2003 and 2011. The glacier retreat peaked during the 1990-2000 period with 8.5 km of retreat. The lake widened and deepened at the calving front for that period. The yellow arrow indicates the 1997 terminus, burgundy arrow 2003 and orange arrow 2011. The green arrows point the expansion of exposed bedrock areas on the east margin of the glacier from 1997-2011. Retreat from 1997-2003 was 2250 m, 375 m/year. Retreat from 2003-2011 was 2000 meters, 250 m/year. In 2011 an additional nunatak has emerged as the glacier has thinned. The 2011 terminus is near a point where the lake appears it will widen again, the potential depth is hard to assess. The map from Rivera et al (2012a) indicates at least a short term deepening at the ice front, this is at the same point as a modest lake width reduction.


 . Below is a closeup of the changes 12-14 km upglacier of the terminus indicating the rapid thinning from 2003 to 2011 expanding the bedrock exposed at point B and exposing the new nunatak at Point C. The retreat of this glacier follows the regional pattern observed by the Laboratorio de Glaciologia on other glaciers such as Gualas Glacier, Nef Glacier, Alemania Glacier, Tyndall Glacier and Colonia Glacier.

Aguja and Ritacuba Blanco Peak Glacier Retreat, Colombia
The Sierra Nevada del Cocuy is the second largest concentration of glaciers in Colombia. The glaciated area in Colombia is at 6º30′ N and 72º20′ W and extends along the crest of this range.  Morris et al (2006) documented the decline in total area from 39.1 square kilometers to 16.3 square kilometers in 2003. Poveda and Pineda (2009) estimated glacier area of as 28.6 km2 in 1989, 22.9 km2in 2000, and 17.00 km2 in 2007. A 40% decline in area in two decades. This post follows up on an earlier post that examined changes in southern half of the glaciated range. This post looks at the glaciers at the northern edge of the range using Landsat images from 1988 and 2012 and a Geoeye image from 2009. The glaciers are on the flanks of Ritacuba Blanco Peak and Aguja Peak, inside the burgundy circle in the map below.
  The image below is a combined Landsat image with a 1988 image on top and a 2012 image below. Each arrow is a different color and number, pointing to the same glacier or feature. Glaciers 1-3 are on the east flank of Aguja Peak, Glacier 4 on the norhwest side of Ritacuba Blanco. In 1988 glaciers 1-4 have respective areas of: 1=0.3 km2, 2=0.4 km2, 3=1.1 km2 and 4=0.35 km2. By 2012 the areas are: 1=0.05 km2, 2=0.2 km2, 3=0.5 km2 and 4=0.08 km2. Glaciers 1 and 4 are nearly gone. Glacier 1 and 2 exhibit limited snowcover, lighter blue, indicating a lack of accumulation, and even short term survival is not possible (Pelto, 2010). Glacier number 5 and 6 are on the west side of Ritacuba Blanco. In 1988 the two main glaciers end near the margin of recently formed lakes indicated by the blue and orange arrows. By 2012 retreat from the the margin of these lakes exceeds 500 meter in both cases. For glaciers that were less than 1500 meters long, this is a substantial retreat.
 An additional view of the region is provided in Google Earth and Glacier 5 is seen at the northern edge of a Geoeye image from 2009. Indicating the distance of retreat from the lake near the 1988 glacier margin. Both glaciers on the west flank of Ritacuba Blanco exhibit consistent snowcover presence on their upper reaches above 5000 meters, indicating they have the potential to survive current climate at a reduced size. An expedition to the mountain and the glacier indicate what the area looks like. The bottom image is from a 2012 expedition to Ritacuba Blanco


Deming Glacier Terminus Retreat
The reduction in width and crevassing in the Deming Glacier Icefall indicates a reduced flow into the terminus reach of the Deming Glacier. This post examines the retreat of the Deming Glacier from 1984-2010. The glacier has retreated significantly as have all 47 glaciers we observe in the field. The retreat parallels that of other Mount Baker glaciers, Boulder Glacier and Easton Glacier (Pelto,2006). Each year since 1990 we have been able to observe the terminus of the Deming Glacier from afar at our survey point. Only in two years have we actually visited the terminus 1996 and 2002. The latter proved hazardous enough to discourage further attempts. Deming Glacier advanced dramatically during the 1950’s and did not retreat substantially until the late 1980’s. The first set of images are from the survey point in 2003, 2006, 2007, 2008 and 2010. The yellow arrows indicate the narrowing of the debris free section of ice in the middle of the glacier. The red arrows indicate the moraines from the advance ending around 1980 including the lateral moraines and two sets of terminal moraines. The closer set of terminal moraines is where the glacier ended in 1996 when we visited the glacier. Both the lateral and end moraines are indicated. The stream issuing from the glacier front feeds the Middle Fork Nooksack River, which supplies some of Bellingham, WA water supply. We conducted a


 . The next set of images include a 1979 Austin Post USGS image from 1979 and the rest are from the Google Earth showing in order the 1984 map position (blue), 1994 terminus (magenta), 2006 terminus (green) and 2011 terminus (yellow). Note similarity of blue line and 1979 terminus. The glacier retreated 160 m from 1984-1994, 16 meters/year. From 1994 to 2006 the glacier retreated 240 m, 20 meters/year. From 2006-2011 the glacier retreated 120 m, a rate of 24 meters/year. The rate is still on the increase.


 The top image in the sequence below is a view from 2002 showing the end of the glacier (survey point from red X. The front was still steep at the time and the width of the debris near the terminus limited, clean ice width is 200 m.. By 2011 the terminus is not nearly as steep and most of the glacier width is debris covered. The view in Google Earth imagery from 1998 and 2011 indicates the change and the survey point is indicated by the red x. The last image is a 2011 closeup view in Google Earth the debris free ice section is 40 meters wide. What is causing the narrowing of the debris free ice is the reduction in velocity, the increased thinning of the clean ice in the center compared to the insulated debris covered ice at the edges. As the elevation difference increases debris slides off the side of the developing debris covered ridge (Pelto, 2001: 35).


Deming Glacier Icefall Decline
This is the first of two posts focusing on Deming Glacier and will focus on the Deming Glacier Icefall, the next on the Deming Glacier terminus. The glacier drains from the southwest side of the summit of Mount Baker a stratovolcano in the North Cascades of Washington, with a massive icefall feeding the lower valley terminus reach of the glacier. The icefall begins at 2200 meters and descends to 1600 meters. The glacier feeds the Middle Fork Nooksack River which provides some of the water supply for Bellingham, WA. I first observed the Deming Icefall from the terminus area of the glacier in 1987. This visit demonstrated that it is not safe to hike to the terminus of this glacier each year. In 1990 we began annual observation of Deming Glacier. Each summer we monitor the adjacent Easton Glacier in detail as the surrogate for Deming Glacier, which is dangerous and difficult to work on. Annual observation of the change in areal extent of the Deming Glacier with elevation combined with mass balance assessment on Easton Glacier provides an annual assessment of the meltwater provided by the glacier to the Nooksack River system. The glacier advanced from 1950-1980, and has retreated since 1980. The icefall transitions the glacier from the accumulation zone to the ablation (melt) zone at the bottom of the icefall. Above the icefall at 2400-3000 meters the average snow depth left at the end of the summer based on several thousand crevasse stratigraphy measurments is 2.75 meters
 . The icefall sweeps around a bedrock with an east and a west arm splitting above and rejoining below the knob. In particular the east arm has experienced significant reduction in width and velocity.The sequence below starts with an Austin Post photograph from 1979, that illustrates the east arm, the west arm is hidden. The east arm has the same width descending the step of the icefall. This is followed by the icefall in 1988, the red arrow indicates a rib that begins to extend across the east arm as the glacier thins.

The rib continues to extend across the east arm as noted from our observations of the glacier from an observation point adjacent to the icefall. Views from this location from 2003, 2005, 2007, 2009 and 2011 are shown in that order below. 


 .
.
The next sequence examines the change in the icefall from Google Earth annotated imagery. The sequence begins with the 1984 map, the east arm is a nearly uniform 400 m in width. The sequence continues with 1993 and 2009. The red path is from 1993, and the blue path from 2009. In 1984 there is no bedrock rib, by 1993 it has begun to form but extends only 75 meters, by 2009 it extends 150 meters and by 2011 175 meters across the east arm. The width of the east arm has been reduced from 400 meters to 150 meters from 1984-2011. The sequence also indicates the lateral reduction in width after the two glaciers join at the base of the icefall from 1984 to 2009. In 1984 the glacier was 425 meters wide and in 2009 is 225 meters wide. 


West Barun Glacier Retreat Lake Expansion, Nepal
The West Barun Glacier flows southwest from Baruntse Peak at 7100 meters ending at Barun Khola (lake) at 4500 meters. Comparison of images from 1992, 2003 and 2009 indicate the retreat of the glacier and expansion of the lake. In the early 1990’s the lake was observed to be 1100 meters long with an area of 0.66 square kilometers (ICIMOD, 2010). In 2003 the lake was 1500 meters long. In 2009 the lake was 2000 meters long and had an area of 1.4 square kilometers having doubled in size. In 2013 the maximum length of the lake is 2700 m and the area 1.5 to 1.6 square kilometers. The importance of such lakes impounded in part by moraines, is the potential for glacier lake outburst floods (GLOF). The Barun Khola has no specific date for a GLOF observed, but does pose a risk and has produced floods as indicated by Pradeep Mool (2001) in Figure 1 of the ICIMOD (2010) report, reproduced here, Band C are Barun Khola. ICIMOD has examined this hazard extensively in Nepal and particularly the Dudh Khosi Basin. To date the Dudh Khosi does not have main stem hydropower, but a 210 MW plant is in development. An examination of Landsat imagery from 1992 and 2009 along with Google Earth imagery from 2003 and 2009 is used to identify the retreat. The red line in the Google earth images is the 1992 terminus, the orange line the 2003 terminus and the green line the 2009 terminus. The glacier is outlined in magenta in the Landsat images. The glacier retreated 270 meters, 25 m/year), from 1992 to 2003. From 2003 to 2009 the glacier retreated an additional 480 meter, 80 meters per year. In the 2013 Landsat image the southern portion of the terminus has not markedly retreated since 2009, but the lake expansion continues on the northern shore of the lake., pink arrow.
1992 Landsat image

2003 Google earth image

2009 Google Earth image

2009 Landsat image

2013 Landsat image
A closeup view of the terminus from Google Earth indicates lots of icebergs near the ice front, magenta arrows. The icebergs in the Landsat image later in 2009 have drifted further from the glacier. The angular nature of the icebergs indicates recent large calving event. There are also some small lakes on the surface of the glacier, yellow arrows. 
This glaciers retreat and lake expansion is like the nearby North Lhonak Glacier, Middle Lhonak Glacier, Imja Glacier and Nobuk Glacier.
Eel Glacier, Retreat Olympic Mts., Washington
The Eel Glacier flows north from the Mount Anderson massif in Olympic National Park. This post examines imagery of the glacier from 1961, 1990 and 2009. The glacier has retreated 180 meters from 1990 and 2009, approximately 10 meters/year. The retreat rate has accelerated from the 5 meters/year from 1960-1990. The glacier has lost half of its area since first photographed in 1927 (NPS). What is of greater concern than the terminal retreat is the upglacier thinning during this period. In 1990 the glacier was receiving considerable contributions from the east and west slope of the mountain, near blue arrows. By 2009 the main glacier is nearly separated from the flow from the east and west valley sides. There has been considerable expansion of the blue arrows of bare rock areas that had been underneath glacier ice in 1990. The orange line is 1990 terminus, green line 2009. 
 The loss of connection indicates thinning high up on glacier, that changes the very nature of the glacier from 1960 (top image) to 2009 (bottom image), the blue line is the 1960 terminus.
 . The retreat of this glacier is less severe than Anderson Glacier just over the pass, and is more like that of White Glacier. The mass loss follows that of North Cascade glaciers where thinning on most glacier has occurred from the terminus to the top of the glacier.
South Lhonak Glacier, Retreat Sikkim
The South Lhonak Glacier drains east from Lhonak Peak into Sikkim from the Nepal-Sikkim border. The glacier begins at the border at 6500 meter and ends in a lake at 5200 meters. In 1933 the Mount Everest Expedition led by Eric Shipton explored the area. They traversed across the border and down the Lhonak Glacier finding only moraine covered cover glacier and no lake. Comparison of Landsat and Google Earth images from 2000-2011 indicate the expansion of the lake as the glacier has retreated. The first three are Landsat images from 2000 (top), 2010 (middle) and 2011 (bottom), indicating the expansion of the lake and glacier retreat. 2013 Update A paper just published in Current Science by K. Babu Govindha Raj1, S.N. Remya andK. Vinod Kumar reports on this lake expanding by 1.9 km due to glacier retreat from 1962-2008.


The next set of three are from Google Earth with a Landsat image from 2000 overlain in GE (top), 2006 GE image (middle) and 2010 GE image (bottom). The 2010 terminus is marked by green line, 2006 orange line and 2000 magenta line. The glacier retreated 350 meters from 2000 to 2006 and 250 meters from 2006-2010. The net 600 meter retreat for the decade is 60 m/per year. The 2006 image has red arrows indicating the large moraine behind which the lake has formed, and which Shipton found the glacier pressed up against. The retreat from 1933-2010 is at least 1800 meters. Clearly the retreat in the last decade is much more rapid than previous. The specific hazard is identified by Babu Govindha Raj et al (2013), the lake outburst probability is a very high value of 42% and peak discharge estimated at 586 m3/s. The retreat fits the pattern of other glaciers in the area reported by Raina (2008) and including Zemu Glacier and Changsang Glacier. In Sikkim 26 glaciers examined were retreating at an average rate of 13.02 m per year from 1976 to 2005. An example of this kind of retreat from Bhutan is Theri Kang Glacierand Changsang Glacier in Sikkim is another example.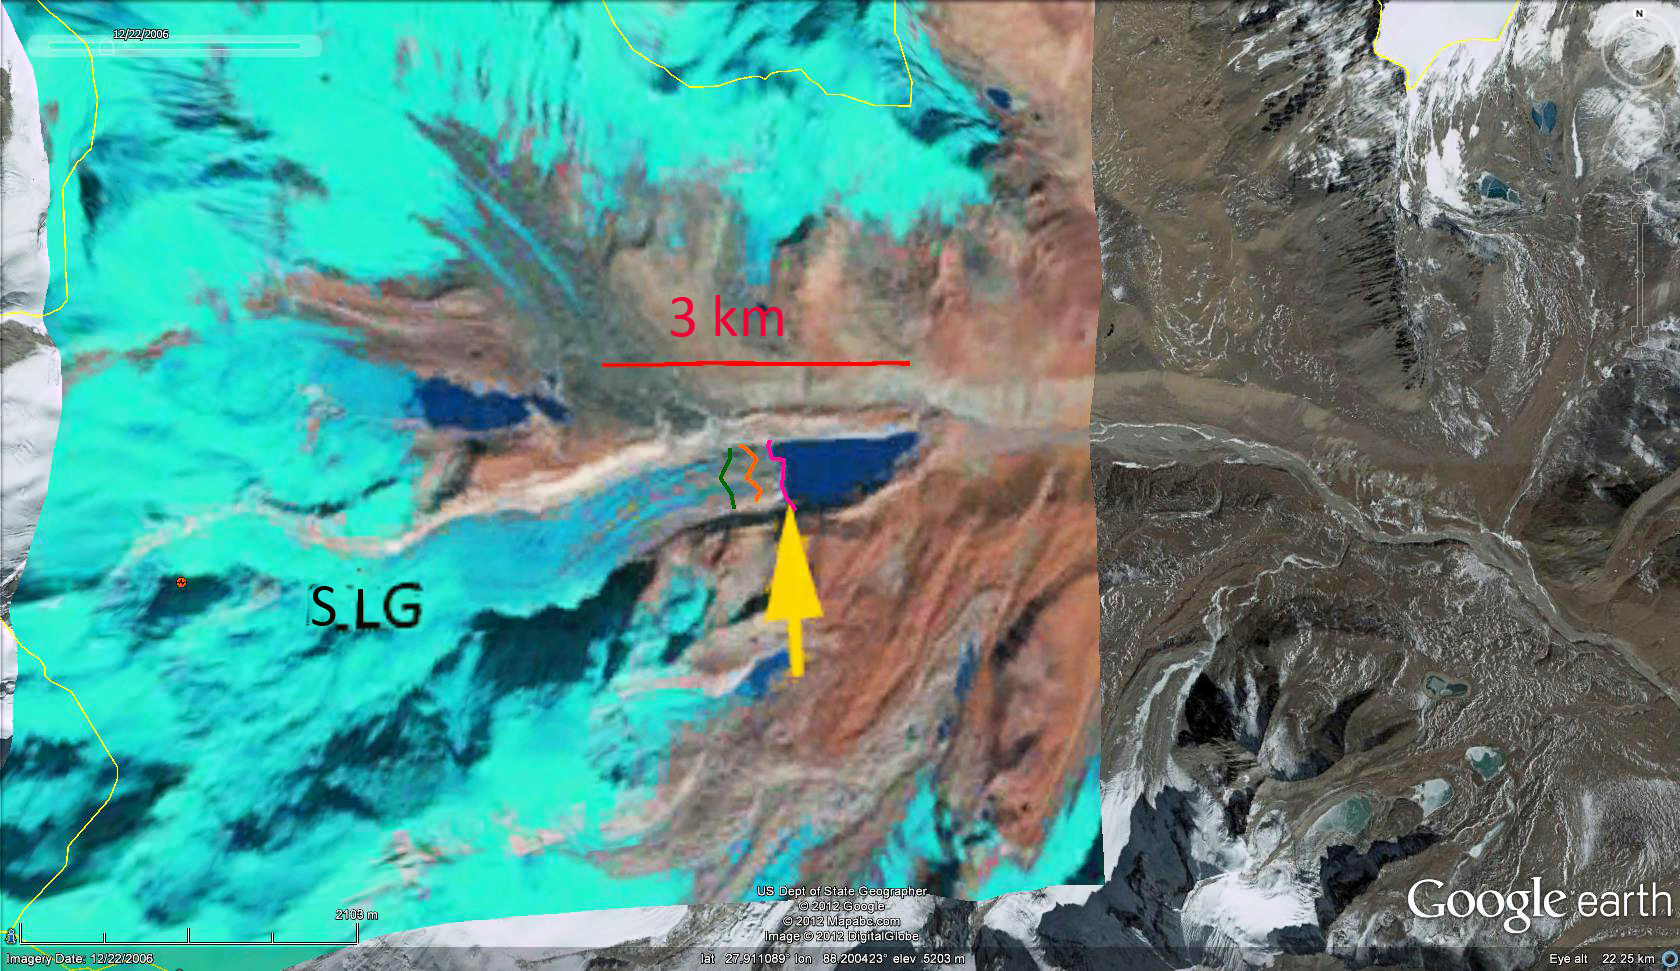

 A closeup examination of the terminus region of the Lhonak Glacier indicates a well incised supraglacial stream (on surface of glacier), indicating relative stagnation. Three areas where debris cover has protected the underlying ice leading to a prominent ridge on the glacier,(light blue arrows) again an indicator of stagnation. Finally the magenta arrow identifies a side stream valley that adjacent to the glacier and lower than the glacier, another indication of stagnation.
Index of Glacier posts June 2009-May 2012
Glacier Index List
Below is a list of the individual glacier posts examining our warming climates impact on each glacier. This represents the first 2.7 years of posts, 192 total posts, 180 different glaciers. I have worked directly on 41. The others are prompted by fine research that I had come across, cited in each post or inquiries from readers and other scientists. I then look at additional often more recent imagery to expand on that research. The imagery comes either from MODIS, Landsat, Geoeye or Google Earth.
United States
Columbia Glacier, Washington
Lyman Glacier, Washington
Boulder Glacier, Washington
Ptarmigan Ridge Glacier, Washington
Anderson Glacier, Washington
Milk Lake Glacier, Washington
Paradise Glacier, Washington
Easton Glacier, Washington
Redoubt Glacier, Washington
Honeycomb Glacier, Washington
Vista Glacier, Washington
Rainbow Glacier, Washington
Daniels Glacier, Washington
Colonial Glacier, Washington
Quien Sabe Glacier, Washington
Mazama Glacier
Fairchild Glacier, Washington
White Glacier, Washington
Banded Glacier, Washington
Borealis Glacier, Washington
Hinman Glacier, Washington
Lower Curtis Glacier, Washington
McAllister Glacier, Washington
Lewis Glacier, Washington
Kennedy Glacier, Washington
Fremont Glacier, Wyoming
Minor Glacier, Wyoming
Grasshopper Glacier, Wyoming
Grasshopper Glacier, Montana
Harrison Glacier, Montana
McDonald Glacier, Montana
Sperry Glacier, Montana
Hopper Glacier, Montana
Old Sun Glacier, Montana
Yakutat Glacier, Alaska
Grand Plateau Glacier, Alaska
Eagle Glacier, Alaska
Gilkey Glacier , Alaska
Gilkey Glacier ogives, Alaska
Lemon Creek Glacier, Alaska
Taku Glacier, Alaska
Bear Lake Glacier, Alaska
Chickamin Glacier, Alaska
Okpilak Glacier, Alaska
Sawyer Glacier, Alaska
Valdez Glacier, Alaska
Antler Glacier, Alaska
Field Glacier
East Taklanika Glacier, Alaska
Brady Glacier, Alaska
Brady Glacier Retreat lake expansion 2004-2010
Thiel Glacier, Alaska
Speel Glacier, Alaska
Romanzof Glacier, Alaska
Canada
Icemantle Glacier, BC
Bridge Glacier, British Columbia
Washmawapta Glacier, British Columbia
Bubagoo Glacier, British Columbia
Hector Glacier, Alberta
Helm Glacier, British Columbia
Melbern Glacier
Warren Glacier, British Columbia
Castle Creek Glacier, British Columbia
Hoboe Glacier, British Columbia
Tulsequah Glacier, British Columbia
Decker and Spearhead Glacier, British Columbia
Columbia Glacier, British Columbia
Freshfield Glacier, British Columbia
Apex Glacier, British Columbia
Devon Ice Cap, Nunavut
Penny ice Cap, Nunavut
Penny Ice Cap SW, Nunavut
Snowshoe Peak, Yukon
Petain Glacier, Alberta
New Zealand
Tasman Glacier
Murchison Glacier
Donne Glacier
Mueller Glacier, NZ
Gunn Glacier, NZ
Africa
Rwenzori Glaciers
Tyndall Glacier, Kenya
Himalaya
Ngozumpa Glacier, Nepal
Samudra Tupa, India
Zemu Glacier, Sikkim
Theri Kang Glacier, Bhutan
Zemestan Glacier, Afghanistan
Khumbu Glacier, Nepal
Imja Glacier, Nepal
Gangotri Glacier, India
Milam Glacier, India
Satopanth Glacier, India
Kali Gandaki Headwaters, Nepal
Menlung Glacier, Tibet
Boshula Glaciers, Tibet
Urumquihe Glacier, Tibet
Sara Umaga Glacier, India
Dzhungharia Alatau, Kazakhstan
Petrov Glacier,Kyrgyzstan
Hailuogou Glacier, China
Reqiang Glacier Retreat, Tibet
Himalaya Glacier Index
Europe
Taconnaz GLacier, France
Mer de Glace, France
Dargentiere Glacier, France
Grand Motte and Pramort Glacier Tignes Ski area, France
Saint Sorlin, France
Sommelier Glacier
Obeeraar Glacier, Austria
Ochsentaler Glacier, Austria
Pitzal Glacier, Austria
Dosde Glacier, Italy
Maladeta Glacier, Spain
Presena Glacier, Italy
Triftgletscher, Switzerland
Rotmoosferner, Austria
Stubai Glacier, Austria
Hallstatter Glacier, Austria
Ried Glacier, Switzerland
Cavagnoli Glacier, Switzerland
Chuebodengletscher and Ghiacciaio-del-Pizzo-Rotondo
Forni Glacier, Italy
Careser Glacier, Italy
Peridido Glacier, Spain
Engabreen, Norway
Midtdalsbreen, Norway
Tunsbergdalsbreen, Norway
TungnaarJokull, Iceland
Langjökull, Iceland
Gigjokull, Iceland
Skeidararjokull, Iceland
Kotlujokull, Iceland
Lednik Fytnargin, Russia
Rembesdalsskaka, Norway
Irik Glacier, Mount Elbrus, Russia
Greenland and European Arctic
Mittivakkat Glacier
Ryder Glacier
Humboldt Glacier
Petermann Glacier
Kuussuup Sermia
Jakobshavn Isbrae
Umiamako Glacier
Kong Oscar, Glacier
Upernavik Glacier
Epiq Sermia
Sortebrae Glacier, Greenland
Severnaya Zemlya, Russian Arctic
Hansbreen, Svalbard
Nannbreen, Svalbard
Hornbreen and Hambergbreen, Svalbard
Albrechtbreen, Svalbard
Roze and Sredniy Glacier, Novaya Zemyla
Nizkiy and Glazova Glacier, Novaya Zemyla
South America
Colonia Glacier, Chile
Artesonraju Glacier, Peru
Nef Glacier, Chile
Tyndall Glacier, Chile
Alemania Glacier, Chile
Zongo Glacier, Bolivia
Sierra Nevade del Cocuy Glaciers, Colombia
Llaca Glacier, Peru
Arhuey Glacier, Peru
Seco Glacier, Argentina
Onelli Glacier, Argentina
Quelccaya Ice Cap, Peru
Glacier Gualas, Chile
Antarctica and Circum Antarctic Islands
Pine Island Glacier
Fleming Glacier
Hariot Glacier
Smith Glacier, Antarctica
Amsler Island
Stephenson Glacier, Heard Island
Neumayer, South Georgia
Ampere, Kerguelen
Cook Ice Cap, Kerguelen Island
Nordenskjold Coast, Antarctic Peninsula
Prospect Glacier, Antarctic Peninsula
Ross Hindle Glacier, South Georgia
Vega Island Ice Cap
Rohss Bay, James Ross Island, Antarctica
North Cascade Glacier Climate Project Reports
Forecasting Glacier Survival
North Cascade Glacier Mass Balance 2010
Columbia Glacier Annual Time Lapse
North Cascade Glacier Climate Project 2009 field season
28th Field Season Schedule of the North Cascade Glacier Climate Project
North Cascade Glacier Climate Project 2011 Field Season
BAMS 2010
2011 Glacier mass balance North Cascades and Juneau Icefield
Taku Glacier TSL Paper
Sierra Nevada del Cocuy Glacier Retreat, Colombia
The Sierra Nevada del Cocuy is the second largest concentration of glaciers in Colombia. The glaciated area in Colombia is at 6º27′ N and 72º18′ W and extends along the crest of this range. Morris et al (2006) documented the decline in total area from 39.1 square kilometers to 16.3 square kilometers in 2003. Poveda and Pineda (2009) estimated glacier area of as 28.6 km2 in 1989, 22.9 km2in 2000, and 17.00 km2 in 2007. A 40% decline in area in two decades. This post examines Landsat images from 1988 and 2012 and a Geoeye image from 2010. In the first image from 1988 identifies key local geographic localities, Laguna Grande de la Sierra (LGS), Laguna Grande de la Plaza (LGP), Concavo (C) Pulipito del Diablo (PD). The purple arrow indicates the separation of the main ice mass on PD from the arm extending north in 2010 (middle) and 2012 (bottom). The yellow arrow indicates the retreat of the glacier descending from Concavo toward LGS, from 1988 to 2012 the retreat has been 300 meters from 1988 to 2012. The glacier has declined from 1500 meters to 1200 meters in length. The red arrows indicate the separation of the Concavo glaciated summit and the arm of the glacier that extended to the north. What we see is the separation of a continuous ice mass along the crest of the Sierra del Concuy. 

 Poveda and Pineda (2009) ask whether the glaciers will disappear during the 2010-2020 decade. Glaciers disappear because they lack a consistent and persistent accumulation zone (Pelto, 2010), we cannot just extrapolate onn glacier area decline. In this case the losses indicate continued segmentation and separation, but clearly there are several key areas that have substantial area and will not disappear within the decade. There is insufficient data to identify if any of the glacier retain sufficient snowcover to be sustained with current climate.
Albrectbreen, Svalbard retreat and thinning
Albrechtbreen is a glacier draining the northeast side of the Edgoya Ice Cap.  James et al (2012) report that the glacier retreated at a rate of 33 m/year from 1971-2000 and 64 m/year after 2000. The glacier terminates on an outwash plain at 50 meters, and begins from the ice cap at 300 meters. From 1971-2005 the ice cap has had a mass balance loss of -0.6 m/year (Nuth et al, 2010). The Albrechtbreen has had a more negative mass balance losing 34 m in thickness, essentially 1 m/year (James et al, 2012). The thinning has not been isolated to the margin of the glacier, with the greatest thinning occurring at 150 meters. The retreat and thinning is identified in the Figure from James et al (2012).
 In this post Landsat imgery from 2002, 2005 and 2010 is utilized to identify marginal changes and upglacier thinning. The blue dots in each image indicate the snowline, the yellow arrow a distinctive lake beyond the terminus that can be used to gage the retreat from 2002 to 2010, and the blue and violet arrows indicate locations where bedrock exposure has expanded as the glacier has thinned. The terminus in the vicinity of the lake has retreated 450 meters in eight years, 55 meters/year.

 . That the thinning extends to the highest areas of the Albrectbreen is not a good sign for its long term survival. The lack of snowcover can be a bit deceiving since much of the accumulation on this glacier is superimposed ice. That is meltwater that is refrozen before escaping the glacier.
