Mount Everest Region High Winter Glacier Snow Lines in 2024 and 2025.

The snow line on Mount Everest Region glaciers on Jan. 28, 2025 indicated by yellow dots on the Landsat image. Note t Nup La-5900 m is snow free. The average snow line is 6100 m, 150 m higher than on Dec. 11, 2024.

This is a update to a previous post examining persistent high snow lines through the winter on Mount Everest Region glaciers. Here we examine imagery from October 2023 through early January 2025 illustrating the rise in snow line through January in both 2024 and 2025. The persistent high snow line during winter indicate a lack of snow accumulation during the winter season. This is a dry season in the Himalayan region, yet typically an extensive snow cover develops, though not particularly deep. A combination of warmer and drier conditions have been more prevalent in recent winters including 2021, 2023, 2024 and 2025 (Kathmandu Post, 2025). These conditions are driving both reduced snow cover, higher elevation snow lines and increased forest fires (Nepali Times, 2025).

NASA FIRMS view of fire locations in Nepal on Jan. 23, 2025, each red dot is a fire, note most are at higher elevations including several near the Everest region.

There have been a few small snow events early in each winter, but the snow cover does not persist indicating that ablation has continued even above 6000 m on Mount Everest. Snow cover loss during winter at these altitudes is primarily the result of sublimation , with losses observed up to 2.5 mm per day (Tenzing et al 2023).

The 2024 winter season was different than the high snow lines in 2020/21 that resulted from extraordinary January heat wave, as there was not a noteworthy heat wave (Pelto et al 2021). Instead a lack of any significant precpipitation was critical with less than 25 mm of precipitation at Everest Base Camp from Jan.1-March 31, 2024 and above normal temperatures for significant periods. The high glacier snow lines persisted into the monsoon season of 2024. The post-monsoon season in 2024 was warm and wet, leading to above average snow line elevations in November 2024.

In December 2024, Nepal was 20-25% of normal with drier conditions in the east. This accompanied above average temperatures, though not as high as in December 2023, leading to extreme drought in several provinces including Koshi Province (Nepal DHM). January, 2025 has continued to be dry, with consistently warm conditions. This has enabled high glacier snow lines to persist and rise from early December into early February, 2025.

The snow line on Mount Everest Region glaciers on Dec. 11, 2024 indicated by yellow dots on the Landsat image. Note that Nangpa La and Nup La-two high passes (5800-5900 m) are snow covered. The average snow line is 5950 m.
The snow line on Mount Everest Region glaciers on Jan. 20, 2025 indicated by yellow dots on the Landsat image. Note that Nangpa La and Nup La-two high passes (5800-5900 m) both have a narrow band of snow cover. The average snow line is 6050 m.
The snow line on Mount Everest Region glaciers on May 1, 2024 indicated by yellow dots on the Landsat image. Note that Nangpa La and Nup La-two high passes (5800-5900 m) are both snow free. The average snow line is 6050 m.
The snow line on Mount Everest Region glaciers on March 14, 2024 indicated by yellow dots on the Landsat image. Note that Nangpa La and Nup La-two high passes (5800-5900 m) are both snow free. The average snow line is 5950 m.

The snow line on Mount Everest Region glaciers on Feb. 11, 2024 indicated by yellow dots on the Landsat image. Note that Nangpa La and Nup La-two high passes (5800-5900 m) are both snow free. The average snow line is 6000 m.

The snow line on Mount Everest Region glaciers on Jan. 10, 2024 indicated by yellow dots on the Landsat image. Note that Nangpa La and Nup La-two high passes are both snow free. The average snow line is 6000 m
The snow line on Mount Everest Region glaciers on Nov. 15, 2023 indicated by yellow dots on the Landsat image. Note that Nangpa La and Nup La-two high passes are both snow covered. The average snow line is 5800 m.
The snow line on Mount Everest Region glaciers on Oct. 30, 2023 indicated by yellow dots on the Landsat image. Note that Nangpa La and Nup La-two high passes are both snow covered. The average snow line is 5700 m.

Himalayan Glacier Snow Lines High and Rising November 2024

Mount Everest Region, Nepal glacier snow lines on Sentinel image from 11-12-2024. Mean elevation of snow lines is 5800 m.

As the post-monsoon period progresses, glacier snow lines have been rising in the Himalaya. Will this be similar to last year and in 2020/21 when the snow line on many glaciers remained high right through much of the winter? Here we examine Sentinel 2 imagery from Kanchenjunga Glacier on the eastern border of Nepal to the Gangotri Glacier in Uttarakhand, India. In November snow lines are averaging from 5500 m to 6000 m (yellow dots are snowline). In each location there is clear upward shift of the snow line since the beginning of October, 2024.

The rising snow lines indicate significant ablation is occurring at least up to that point. There has been a trend in the last decade where ablation conditions are extending into the winter season most years (Pelto et al 2022). Will the winter 2024/25 follow this trend?.

Kanchenjunga Glacier with the November 17, 2024 snow line averaging 6000 m.
Langtang Glacier, Nepal with the snow line on November, 17 2024 averaging 5500 m.
Gangotri, Satopanth and Bhagirath Kharak Glacier snow line on Sentinel 2 image from 11-06-2024. Mean elevation is 5500 m.

Kanchenjunga Glacier, Nepal High Snowlines Expanding Supraglacial Ponds in 2023

Screenshot

Kanchenjunga Glacier in Nov. 8, 2023 false color Sentinel image.  The flowlines of the six tributaries shown in green with the snowline on each at the purple dots. Percentage of glacier length above the snowline for each tributary shown as percentage. Two rapidly expanding supraglacial lakes shown at yellow arrows.

Kanchenjunga Glacier is the main glacier draining west from Kanchenjunga Peak draining into the Ghunsa River. Lamsal et al (2017). report a loss of -0.18 m/year from 1975-2010. They noted an increase in supraglacial ponds and that the glacier had decreased in thickness mainly between the terminus and 5500 m, with some thickness increases above 5850 m. The Kanchenjunga Region has produced 6 to 8 GLOF’s since the late 1960’s, but none from the Kanchenjunga Glacier which had lacked substantial proglacial or supraglacial lakes until now (Byers et al 2020). Here we examine Sentinel imagery indicating the high snowline in November 2020, January 2021 and November 2023.

Screenshot

Kanchenjunga Glacier in Jan,. 17, 2021 false color Sentinel image.  The snowline on each at the purple dots. Percentage of glacier length above the snowline for each tributary shown as percentage. Two rapidly expanding supraglacial lakes shown at yellow arrows.

A glacier needs a majority of its area to be in the accumulation zone to maintain its mass balance. In November 2020 the transient snow line averages 5800 m. By January 17, 2021 the snowline has risen to an average of 5950 m. Measuring the distance from the terminus to top of the glacier along the six main tributaries, and determining the percentage of this length above the snowline in the accumulation area, from 8-14% of the length is the accumulation area. This leaves a limited accumulation area. The January 2021 period had an unusually high snowline due to heat wave in January, that led to high snowlines on Mount Everest as well (Pelto et al 2021). In November 2023 the snowline averages 5900 m across the six tributaries, ranging from 10-17% of the length of the tributaries being above the snowline, mcuh too little to maintain equilibrium. The yellow arrows indicate one noteworthy change near the terminus the growth of new supraglacial ponds. The upper pond expanded from 20,000 m² in Nov. 2020 to 80,000 m² in Nov. 2023, the lower pond consisted of three discrete segments with an area of 50,000 m² in Nov. 2020 to 120,000 m² in Nov. 2023. These are the largest supraglacial lakes to appear on this glacier in the last several decades at least. These two ponds have a greater combined area than all ponds on the glacier in 2010 which Lamsal et al (2017) reported as 0.16 km². At that time the largest pond was 30,000 m².

Screenshot
Screenshot

Kanchenjunga Glacier terminus area supraglacial ponds in Nov. 8, 2023 false color Sentinel image.  Each has more than doubled in size in last three years, with areas of 80,000 and 120,000 m².

Screenshot
Screenshot

Kanchenjunga Glacier in Nov. 10, 2020 false color Sentinel image.  The snowline on each at the purple dots. Two rapidly expanding supraglacial lakes shown at yellow arrows.

Satopanth and Bhagirath Kharak Glacier, India Shrinking Accumulation Zone

Screenshot
Satopanth and Bhagirath Kharak Glacier snowline (blue dots) on Oct. 8, 2020 (Sentinel image) mean elevation is 5350 m. T=Terminus location and blue line is flowline with distance from terminus in km.

Satopanth and Bhagirath Kharak Glacier are located at the headwaters of the Alaknanda River, Uttarakhand, India and have until recently shared a terminus. Glacier runoff is an important contribution to the 400 MW Vishnuprayag and 330 MW Alaknanda Hydroproject. Recent glacier behavior summarized by Thapliyal et al (2023)indicates retreat rates For Satopanth of 23.5 m/year and for Bhagirath Kharak of 18.5 m/year from 1968-2017. They also report a reduction of snowcover during a period of warming from 2000-2020. They considered the accumulation zone to be from 4500 m to 5600 m. Here we examine Sentinel images from Oct. 8, 2020 and Oct. 8 2023 indicating the snowline at 5350 m and 5250 m respectively. On Satopanth Glacier the glacier is 14 km long with ~87% of that length in the ablation zone both years. On Bhagirath Kharak Glacier the glacier is 16.5 km long with ~90% of its length in the ablation zone both years. A glacier needs more than 50% of its area to be in the accumulation zone, which means a snowline in the 4600 m range. The higher snowlines in recent years will drive an increased glacier loss. Below 4600 m debris cover dominates. Shah et al (2019) estimated mean sub-debris ablation ranges between 1.5±0.2 to 1.7±0.3 cm/day leading to thinning of this zone of the glacier.

Screenshot
Screenshot

Satopanth and Bhagirath Kharak Glacier snowline (blue dots) on Oct. 8, 2023 (Sentinel image- mean elevation is 5250 m. T=Terminus location. 90% of the length of each glacier is in the ablation zone.

Screenshot
Screenshot

Vishnuprayag Hydropower Plant a 400 MW run of river project 18 km downstream of Satopanth Glacier.

North Annapurna Glacier, Nepal Retreat and Lake Development

North Annapurna Glacier in August 2022 Sentinel image. A=North Annapurna Base Camp, I=icefall base,  B= Prominent Knob, C=tributary that has separated by 2022. The green arrow marks the end of the active ice which is now 1.5 km upglacier of the terminus. Note Diki Cho (lake) is relatively free of icebergs that were plentiful in 2018.

North Annapurna Glacier drains the northeast side of Annapurna (8091 m). The North Annapurna climbers base camp (NABC) for the original ascent in 1950 was opened to trekking in 2020 via the new Maurice Herzog Trail. The NABC is located near the terminus of the North Annapurna Glacier, when first located there was no lake at the terminus of the glacier. Today glacier thinning and retreat has led to development of DikiCho. The glacier has also become stagnant in its lower reaches. Here we examine Landsat imagery from 1988-2022 to identify the long term changes, and Sentinel imagery from 2018-2022 along with trekking images from 2020-2021 to look at the lake development in details.

North Annapurna Glacier in 1988 and 2022 Landsat images.   Yellow arrow indicates 2022 terminus location. A=North Annapurna Base Camp, I=icefall base,  B= Prominent Knob, C=tributary that has separated.

In 1988 North Annapurna Glacier extended to the end of what has become Diki Cho (lake) and into the main north/south valley of the Miristi Khola. The tributary at Point C connects to the glacier above the icefall. The area of active blue ice extends 1.5 km beyond the icefall, including a series of ogives. The only evident change is the increase debris cover below the icefall. In 2001 the first sign of a lake at the terminus is evident and active blue ice extends beyond Point B. By 2018 Diki Cho has expanded to an area of 0.15 km² and has considerable stranded icebergs amidst the lake.  The area of active ice ends just below Point B.  By 2021 most of the ice amidst Diki Cho has melted. Tributary C no longer connects to the main glacier and the zone of blue ice extends just beyond the base of the icefall. The wam summer of 2022 led to further lake expansion particularly along the southern margin of the glacier, with an area of 0.27 km². The lower 1.5 km of the glacier is stagnant. North Annapurna Glacier has retreated 600 m from 1988-2022. The lower 1.5 km of the glacier is no longer being actively fed by the glacier and will be lost, though with thick debris cover this will not happen quickly. This section of the glacier also has a low surface gradient indicating that lake expansion will continue. The retreat here has been slower than at Lumding Glacier or Barun Glacier, but is increasing in the last decade.

North Annapurna Glacier in 1991 and 2022 Landsat images.   Yellow arrow indicates 2021 terminus location and green arrow the end of the blue ice. A=North Annapurna Base Camp, I=icefall base,  B= Prominent Knob, C=tributary that has separated.

North Annapurna Glacier in August 2018 Sentinel image. A=North Annapurna Base Camp, I=icefall base,  B= Prominent Knob, C=tributary that has separated. The green arrow marks the end of the active ice which is now 1.5 km upglacier of the terminus. Note Diki Cho has many icebergs.

Annotated image of Diki Cho from near the North Annapurna Base Camp, image from Nepal Trek Hub.

North Annapurna Glacier in 2001 Landsat image.   Yellow arrow indicates 2021 terminus location and green arrow the end of the blue ice. A=North Annapurna Base Camp, I=icefall base,  B= Prominent Knob, C=tributary that is separating.


Suru Basin, Ladakh India Glaciers Bare of Snowcover in August 2022

Suru Basin glaciers in 1998 and 2022 Landsat images.  Red arrow marks the 1998 terminus location, yellow arrow the 2022 terminus location. S=Shafat Glacier, D=Dilung Glacier. Glacier 1-4 are unnamed glaciers that lost almost all snowcover in 2022.

Glaciers of the Suru Basin, draining the Ladakh Range, a drier region of the Himalaya, was significantly by the 2022 pre-monsoon and monsoon season warmth. Here we focus on a group of glaciers near Shafat and Dilung Glacier that lost snowcover in 2022. We also look at the retreat of Shafat and Dilung Glacier.  Shafat Glacier occupies the northeast flank of Nun Kun Peak in Ladakh India and drains into the Suru valley. The main valley glacier has suffered from detached tributaries leading to terminus area stagnation (Pelto, 2021). Dilung Glacier retreat has led to an expanding proglacial lake.  Shukla et al (2020) identified an increase in annual temperature has driven a 6% loss in regional glacier area and a 62% expansion in debris cover from 1971-2017. Here we compare Landsat imagery from 1998-2022 to identify this glaciers response to climate change.

In 1998 the terminus of Shafat Glacier was at the red arrow near a junction with a key tributary, with clean active ice reaching to the terminus.  By 2022 the active ice is 2.5 km upglacier from this point at the yellow arrow, though there is stagnant debris covered ice below this point. Dilung Glacier in 1998 terminates in a 1.1 km long proglacial lake. By 2022 the glacier has retreated 900 m, resulting in a 2.0 km long lake.  Rashid and Majeed (2018) indicate nearby Drang Drung Glacier has retreated 925 m since 1971, with a sharp increase after 2014.

For an alpine glacier to have a balanced annual budget it has to be 50-60 snowcovered at the end of the melt season. On Sept. 1, 2022 there are four glaciers 1-4 in this region that have  0-10% snowcover left. The snowcover is above 5300 m. This is illustrative of significant mass losses in 2022. On Dilung Glacier and Shafat Glacier the snowcover is ~20% and is confined to the regions above 5300 m. There is some cloudcover over the top of the Shafat Glacier in the 9-1-2022 Landsat image.

Suru Basin glaciers in September 1, 2022 Landsat image. Glacier 1-4 are unnamed glaciers that lost almost all snowcover in 2022.  S=Shafat Glacier, D=Dilung Glacier. The snowline is above 5300 m. 

Bara Shigri Glacier, India Separation of Tributaries

Bara Shigri Glacier in 1993 and 2022 Landsat images indicating the separation of a number of tributaries. Purple dots mark the snowline 1993=5050 m and 2022=5600 m.

Bara Shigri Glacier, India is in Chandra Valley of the Western Himalaya. Chand et al (2017) report on the behavior of the glacier from the Little Ice Age to 2014 noting a retreat of 255 m from 1992-2002 and 168 m from 2002-2014. This 26 km long glacier had an average snowline maximum elevation of 5340 m for the 2000-2014 period.  The glacier has been fed by a number of significant tributaries feeding from the southwest, here labeled 1-9. The snowline has risen above 5400 m with increasing frequency resulting in a limited accumulation area as observed in Landsat images from 2002, 2016, 2020 and 2022.

In 1993 tributary 1, 3, 4, 5, 6, 8 and 9 feed the main stem, while tributary 2 does not reach the main stem and tributary 7 just meets it without apparent contribution. In 2002 the same tributaries continue to contribute ice to the main stem as in 1993.  The snowline is much higher at 5400 m. In 2022 tributaries 1, 4 and 5 no longer contribute to the mainstem of the glacier, leaving Only tributaries 3, 6, 8 and 9 connecting. The snowline in 2020 averaged 5600 m as well, with higher snow levels on the southwest tributaries and a lower snowline on the northeast arm of the glacier.

The detachment of tributaries illustrates mass balance loss of these glaciers and consequence decrease in volume flux into Bara Shigri Glacier which will lead to continued retreat. Patel et al (2021) noted a mass loss rate of -0.59 m w.e. per year from 2013-2019 indicating the basin wide nature of mass loss. This mass loss is also leading to retreat of nearby Samudra Tapu Glacier.

Bara Shigri Glacier in 2002 Landsat image indicating the separation of a number of tributaries. Purple dots mark the snowline 1993=5050 m and 2022=5400 m.

Bara Shigri Glacier in 2020 Landsat image indicating the separation of a number of tributaries. Purple dots mark the snowline 1993=5050 m and 2022=5600 m.

Changsang Glacier, Sikkim 2 km retreat and Lake Expansion 1989-2021

Changsang Glacier in Landsat images from 1989 and 2021, illustrating a 2.05 km retreat from 1989 terminus position-red arrow to the 2021 terminus position-yellow arrow.  Formation of a new lake is also evident. The snowline is marked by purple dots.

Changsang Glacier (Karda Glacier) is a valley glacier just north of Kanchengjunga, Nepal/Sikkim. A comparison of Landsat imagery from 1989 to 2021 identifies the formation of a lake at the end of the glacier.

The Changsang Glacier was reported to be retreating 22 m/year from 1976 to 2005 (Raina, 2009). Shukla et al (2018) inventoried lakes in Sikkim during the 1975-2017 period and found 35 proglacial lakes in contact with a glacier in 2017. The number and area of these lakes had increased 34% and 90% respectively during this period. One of the rapidly expanding lakes is at Changsang Glacier.

In 1989 there is no evidence of a significant lake either on top of the glacier-supraglacial or proglacial, at the end of the glacier. In 2000 there are a several small lakes beginning to develop with a combined area of 0.22 km2 (Shukla et al., 2018), the snowline is at 5650-5700 m. In 2002 the supraglacial lakes are noticably more connected, and the snowline is at 5700 m in mid-December . By 2011 the main lake is 1000 meters long and has one debris covered ridge that separates it from a second lake. By 2015 the lake has expanded incorporated the second lake and is now 1600 meters long with an area of 0.70 km2 .  The snowline is notably high at 6000 m in mid-October . On Christmas Day 2020 the snowline is particularly high at 6100 m, reflecting the warm post-monsoon early winter period observed at Mount Everest last year (Pelto et al , 2021). In December 2021 the proglacial lake at ~5400 m is 0.93 km2 and the glacier has retreated 2050 m since 1989. Lake expansion since 2015 has been slower. The lake is impounded by a 400 m wide moraine belt on the low slope valley floor beyond the lake margin, and does not appear to be a significant GLOF risk. The retreat of this glacier is similar to that of Kokthang Glacier and Middle Lhonak Glacier.

Changsang Glacier in Landsat images from 2000 and 2020 illustrating retreat from 1989 terminus position-red arrow to the 2021 terminus position-yellow arrow.  Transition from small supraglacial lakes to a single proglacial Lake is evident. The snowline is marked by purple dots, which in late Deember 2020 reached 6100 m.

Changsang Glacier in Landsat images from 2002 and 2015 illustrating retreat from 1989 terminus position-red arrow to the 2021 terminus position-yellow arrow.  Coalescing supraglacial lakes into a single proglacial lake is evident. The snowline is marked by purple dots which in October 2015 reached 6000 m.

Mena Kang West Glacier retreat and lake expansion, Tibet, China


Mena Kang West Glacier in 2002, 2020 and 2021 Landsat images.  Red arrow is the 2000 terminus location, yellow arrow the 2021 terminus location and pink dots the snowline.

“Mena Kang West” Glacier is an unnamed glacier that is to the west of Mena Kang (6140 m) at 28 N, 91.6 W in Tibet, China. The glacier drains into the Nyamjang Chu, which flows south in Arunachal Pradesh, India.  This region has seen the rapid expansion of many proglacial lakes due to glacier retreat. Allen et al (2019) mapped 1291 glacial lakes with an area greater than 0.1 km2, of these 204 posed a glacial lake outburst (GLOF) threat. Nyamjang Chu is not a basin that has experienced a significant GLOF.  This basin does have a proposed hydropower project downstream in Arunachal Pradesh, but the project has not yet begun.  Glacier retreat led to a 20% increase in the number of glacier lakes in the Pumqu region, the adjacent basin to the west (Che et al, 2014).

In 2000 the glacier terminates, at ~4820 m, in a 400 m long glacial lake with an area of 1.6 km2. The snowline is near the top of an icefall at 5300 m. In late October 2002, the snowline is at 5100 m, the lake area is 1.7 km2. By 2016 the glacial lake has expanded to 1000 m in length, the terminus is just below a crevassed area (C), indicating the calving front is leading to an acceleration of the glacier near its terminus. The snowline is at the top of the icefall at ~5300 m. In October 2020 a snowstorm has lowered the snowline to 5000 m.  A warm dry early winter and particularly January throughout the region (NASA, 2021), has led to the snowline have risen and remained high at 5300-5400 m from January 16 -January 28, 2021. This is a summer accumulation glacier receiving the bulk of its snowfall in summer, but winter is supposed to be a period with some snowcover and limited ablation.  That was not the case in the snow free winter to the end of January in 2020/21 (Pelto, 2021). By 2020 the glacier has retreated 600 m since 2000 and the lake area has expanded to 0.3 km2. The high snowlines in recent years have been driving further retreat as noted at other glaciers in the area; Shie Glacier and Bailang Glacier.

Digital Globe imagery  from 2018 of Mena Kang West Glacier illustrating the Icefall (I) at ~5300 m, the terminus crevasse zone (C), flow directions (blue arrows), snowline (pink dots) and recessional moraines (M). 

Mena Kang West Glacier in 2000 and 2018 Landsat images and a 2021 Sentinel image.  Red arrow is the 2000 terminus location, yellow arrow the 2021 terminus location and pink dots the snowline.


Bailang and Angge Glacier, China Retreat and Lake Expansion 1995-2020

Bailang (B) and Angge Glacier (A) in 1995 and 2020 Landsat images indicating retreat and lake expansion. Red arrow is the 1995 terminus location, yellow arrow the 2020 terminus location, purple arrow rock ridges that expand separating tributaries. Chubda Glacier (C) to the south and an unnamed glacier Point D between Angge and Bailang.

Bailang Glacier and Angge Glacier, China are adjacent to the Chubda Glacier, Bhutan, They drain north from Chura Kang and are summer accumulation type glaciers that end in proglacial lakes. The glacier runoff feeds the Xung Qu River a tributary of the Kuri Chhu in Bhutan that powers the Kurichhu Hydropower plant a 60 mw run of river plant in Eastern Bhutan. Both lakes are impounded by broad moraines that show no sign of instability for glacier lake outburst flood. The number of glacier lakes in the adjacent Pumqu Basin to the west has increased from 199 to 254 since the 1970’s with less than 10% deemed dangerous (Che et al, 2014).  In the Yi’ong Zangbo basin to the east  Hongyu et al (2020) observed that from 1970 to 2016 total area of glaciers in the basin  decreased by 35%, whereas the number of glacial lakes increased by 86. Here we compare Landsat images from 1995 and 2020 to identify their response to climate change.

Bailang Glacier in 1995 terminated in a proglacial lake that was 2.1 km long at an elevation of ~5170 m, red arrow. Angge Glacier terminated in a lake that was 1 km long at an elevation of ~5020 m. Between the two is an unnamed glacier labeled “D” here that does not end in a proglacial lake.  By 2001 both glaciers experienced minor retreat of less than 250 m.  By 2014  Bailang Glacier had retreated  800-900 m and the lake was now 3 km long and had no change in water level.  A key tributary on the west side near the purple arrow had also detached. Angge Glacier retreat from 1995 to 2015 was 700 to 800 m, with the glacier retreating to a westward bend in the lake basin.  The glacier has an icefall just above the current terminus suggesting the lake basin will soon end, which should slow retreat.  The D Glacier between them has developed a proglacial lake as well. By 2020 the Bailang Glacier has retreated 1300 m since 1985 and has lost connection with tributaries on either side of the ridge on the west side of the glacier noted by the purple arrow. Angge Glacier has retreated 1100 m since 1995 and has a very narrow connection to the lake, which is now ~2 km long. The glacier in between Bailang and Angge, D Glacier, has developed a 900 m long proglacial lake which also matches the retreat during the last 25 years. This glacier has lost contact with its western tributary as well at western purple arrow.

The reduced lake contact at Angge Glacier is similar to that seen at Shie Glacier, while the lake expansion at Bailang Glacier is similar to that at Daishapu Glacier and Drogpa Nagtsang Glacier.

Bailang (B) and Angge Glacier (A) in 2001 and 2014 Landsat images indicating retreat and lake expansion. Red arrow is the 1995 terminus location, yellow arrow the 2020 terminus location, purple arrow rock ridges that expand separating tributaries. Chubda Glacier (C) to the south and an unnamed glacier Point D between Angge and Bailang.

January 2021 Thaw on Mount Everest Region Generates Ablation, Rolwaling Glacier, Nepal

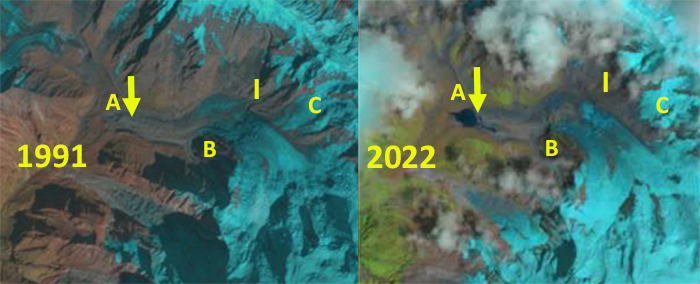
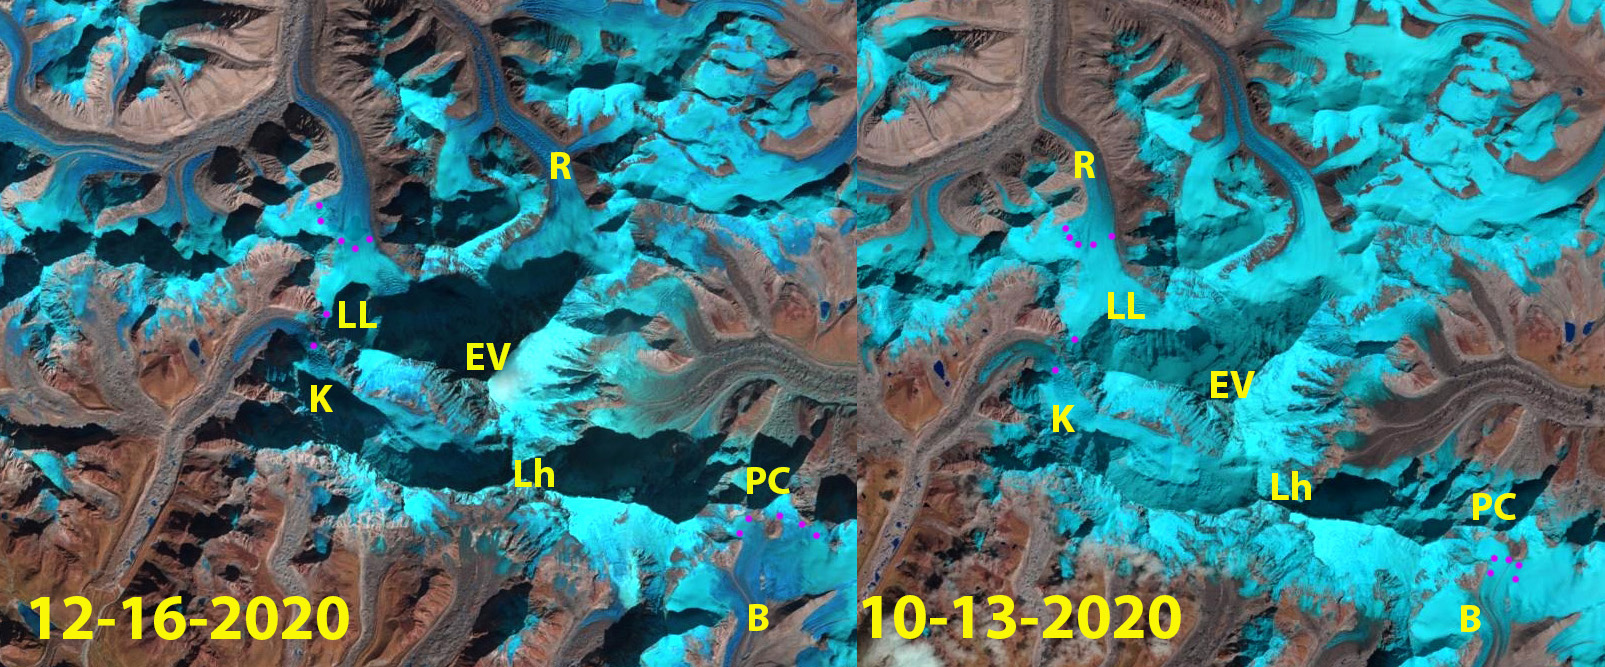
Rolwaling Glacier in October 13, 2020, December 16, 2020 and January 17, 2021 Landsat imagery indicating the snow line rise that has persisted into mid- winter. Snow line indicated by yellow dots.

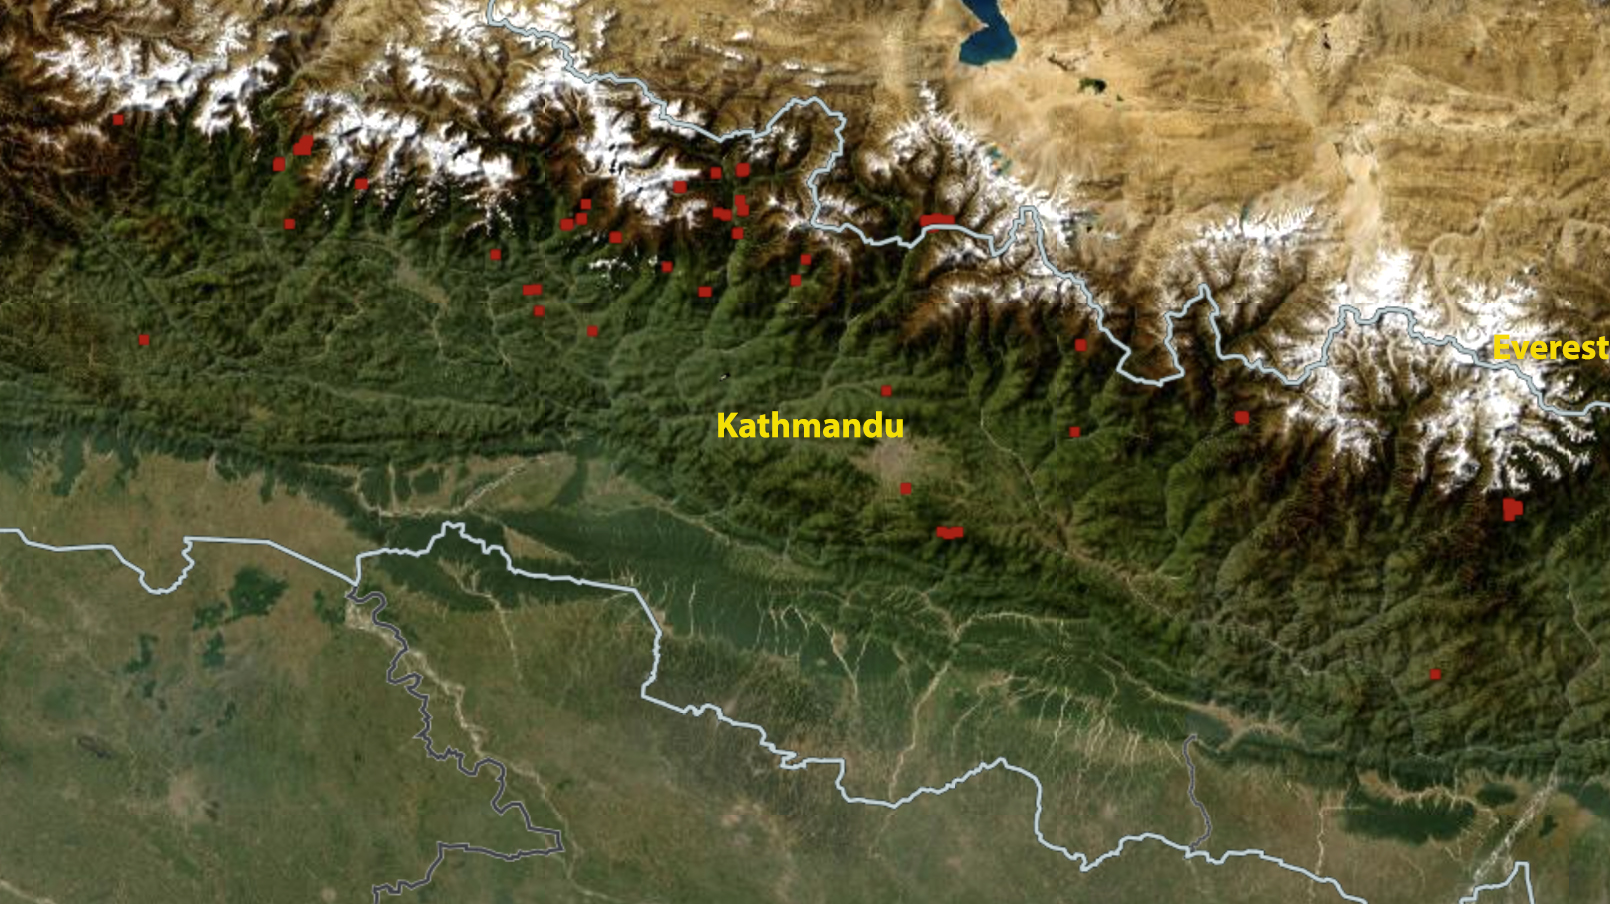
Recent observations of rising snow lines on glaciers during the October- 2020-January 2021 period in Landsat imagery indicates that once again there is significant ablation occurring  on Himalayan glaciers, as has been the case in several recent years (Pelto, 2017; 2019). For the first time we now have weather stations providing real time data in the Everest region that are high enough to transect the region of post monsoon snow line elevations, emplaced by the Rolex National Geographic Perpetual Planet expedition, with the Base Camp station at 5315 m and the South Col station at 6464 m (Matthews et al 2020). Combining the in-situ weather records and remote sensing data provides a unique opportunity to examine the impact of the warm and dry conditions during the 2020 post monsoon through 2020/2021 winter on Everest region glaciers. The ablation season is ongoing as of January 22, 2021, when will it end? How significant has ablation been during this interval? (For more information See NASA Earth Observatory and paper published by Pelto et al 2021)

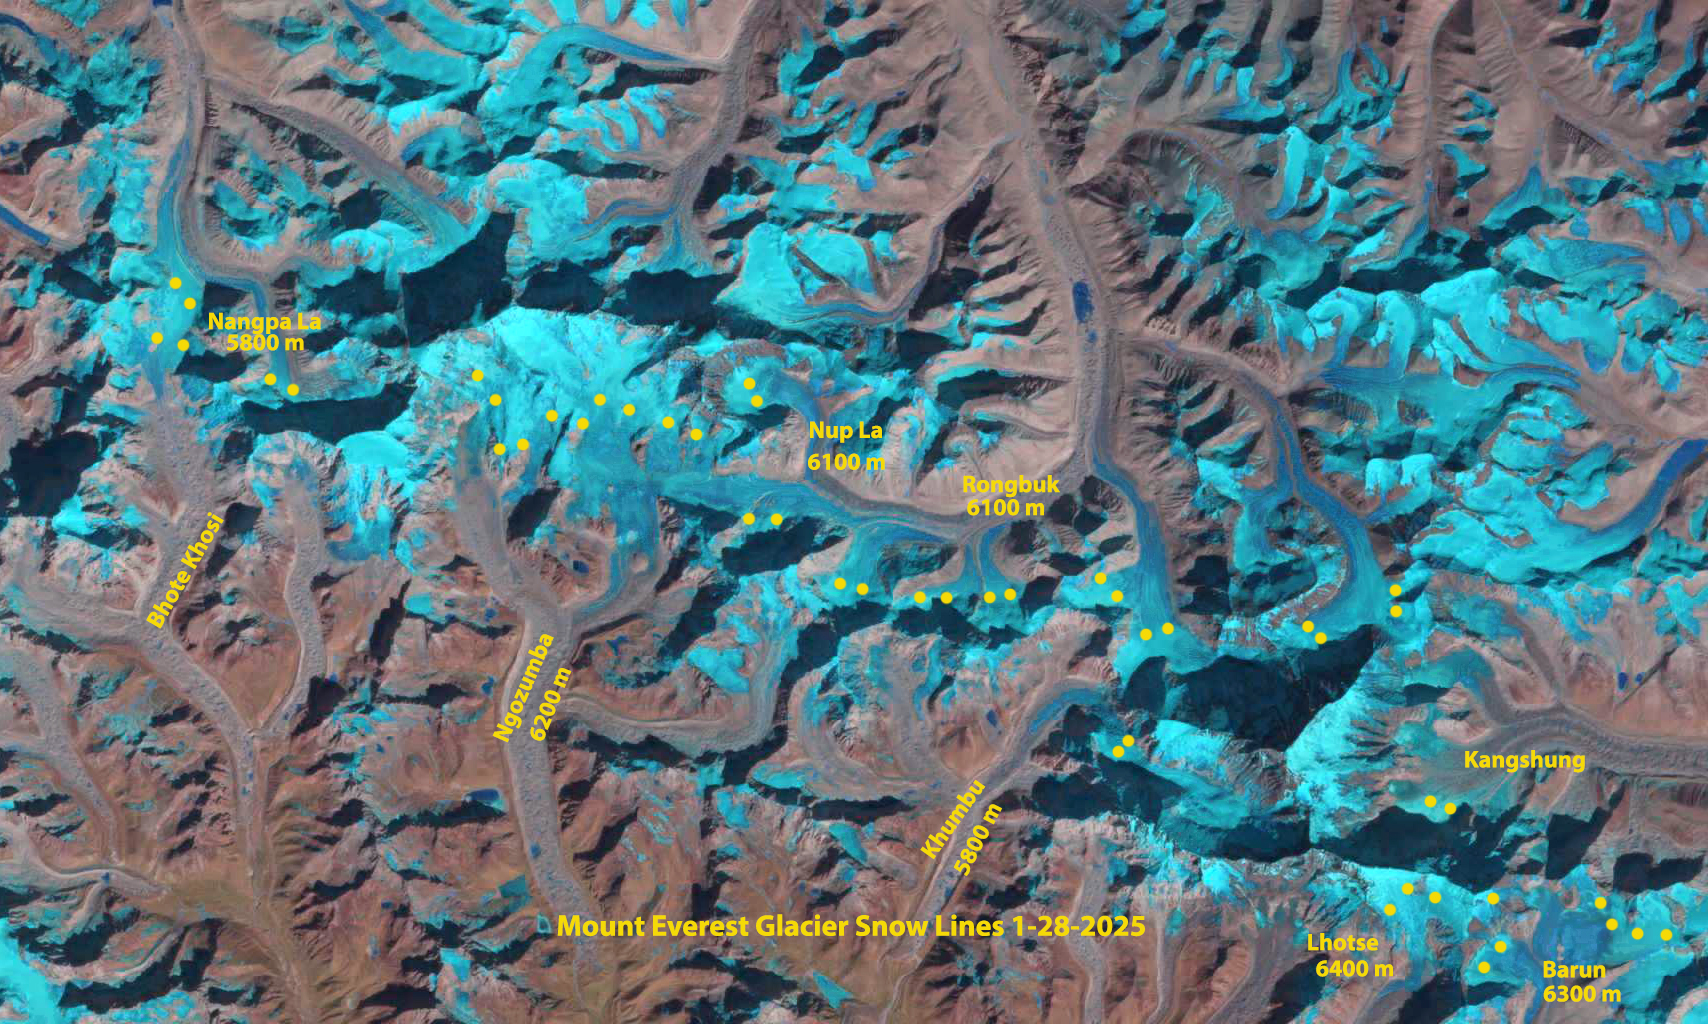
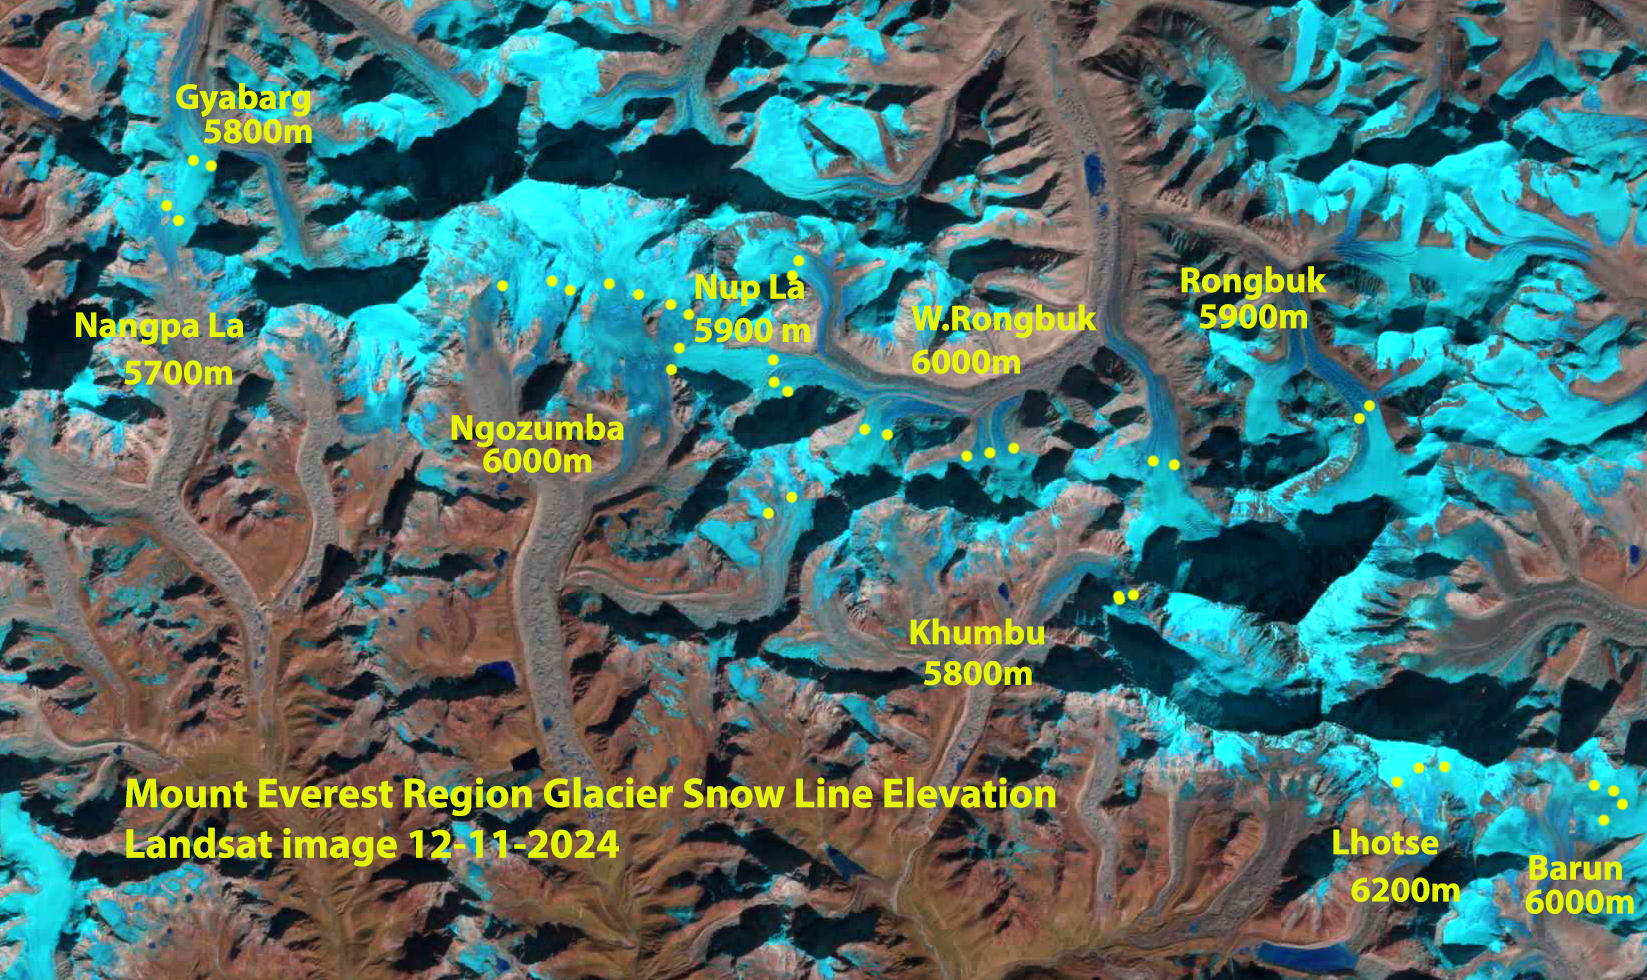
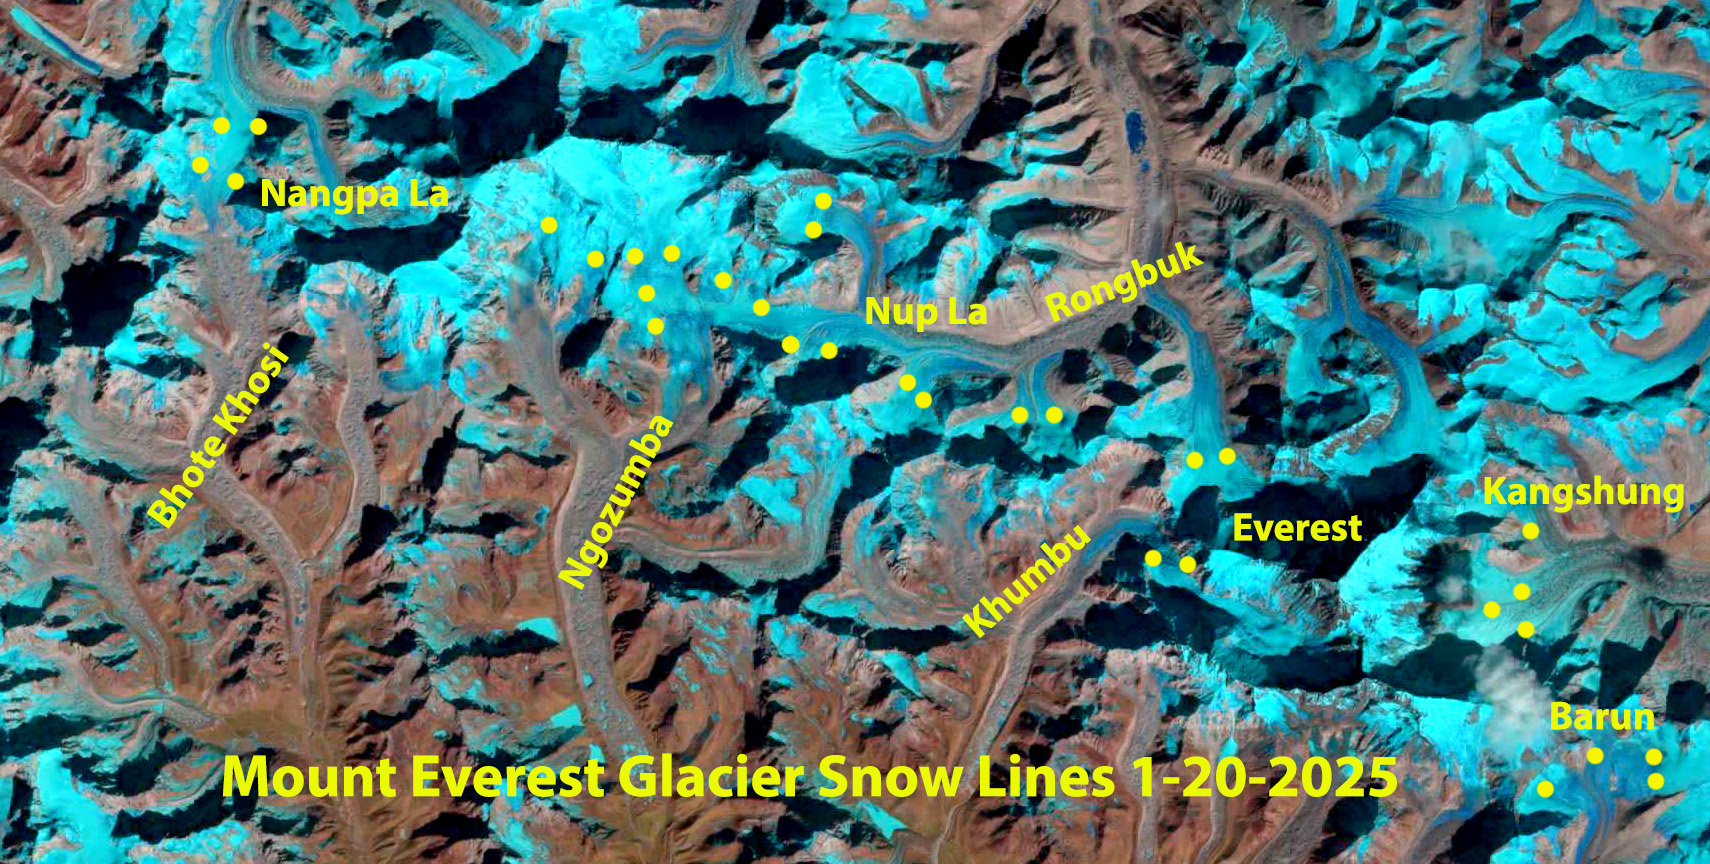
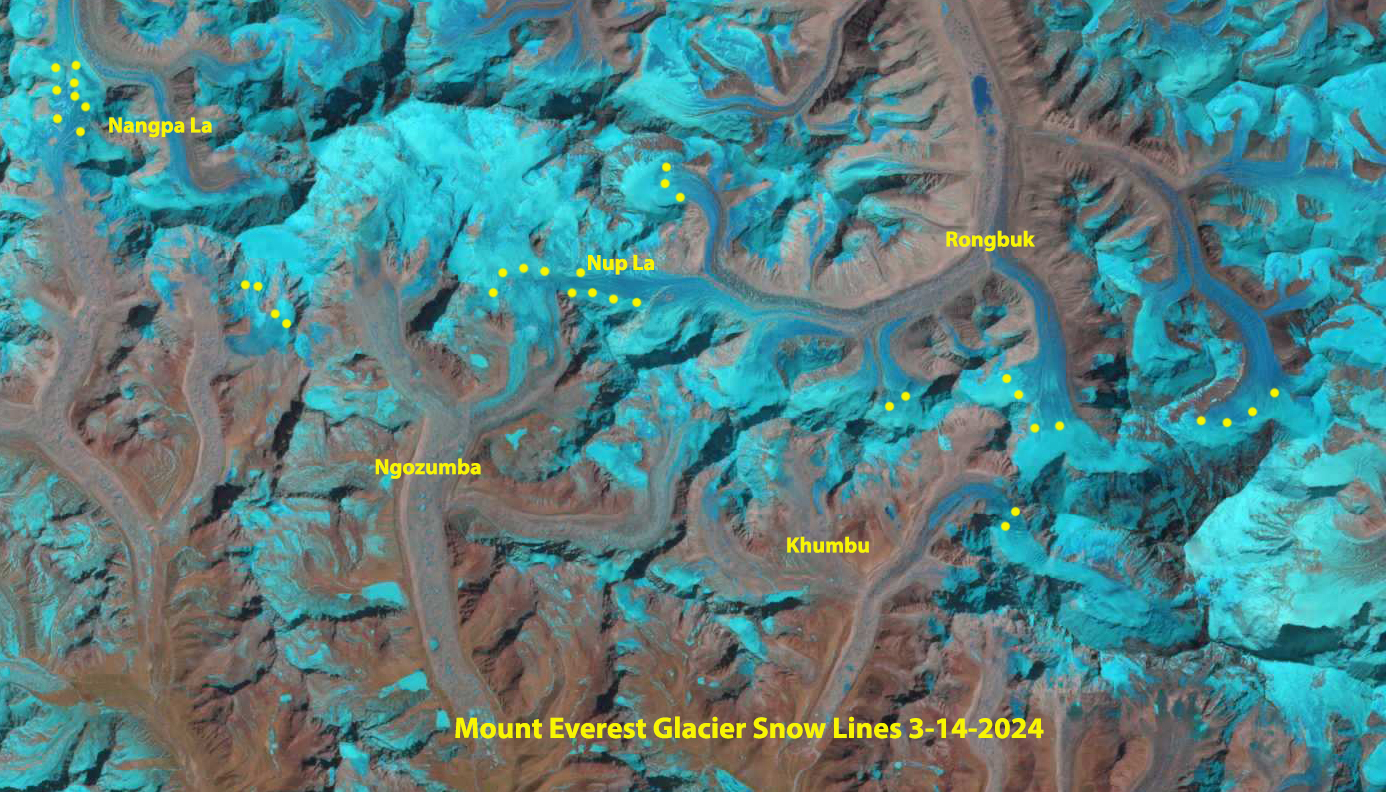
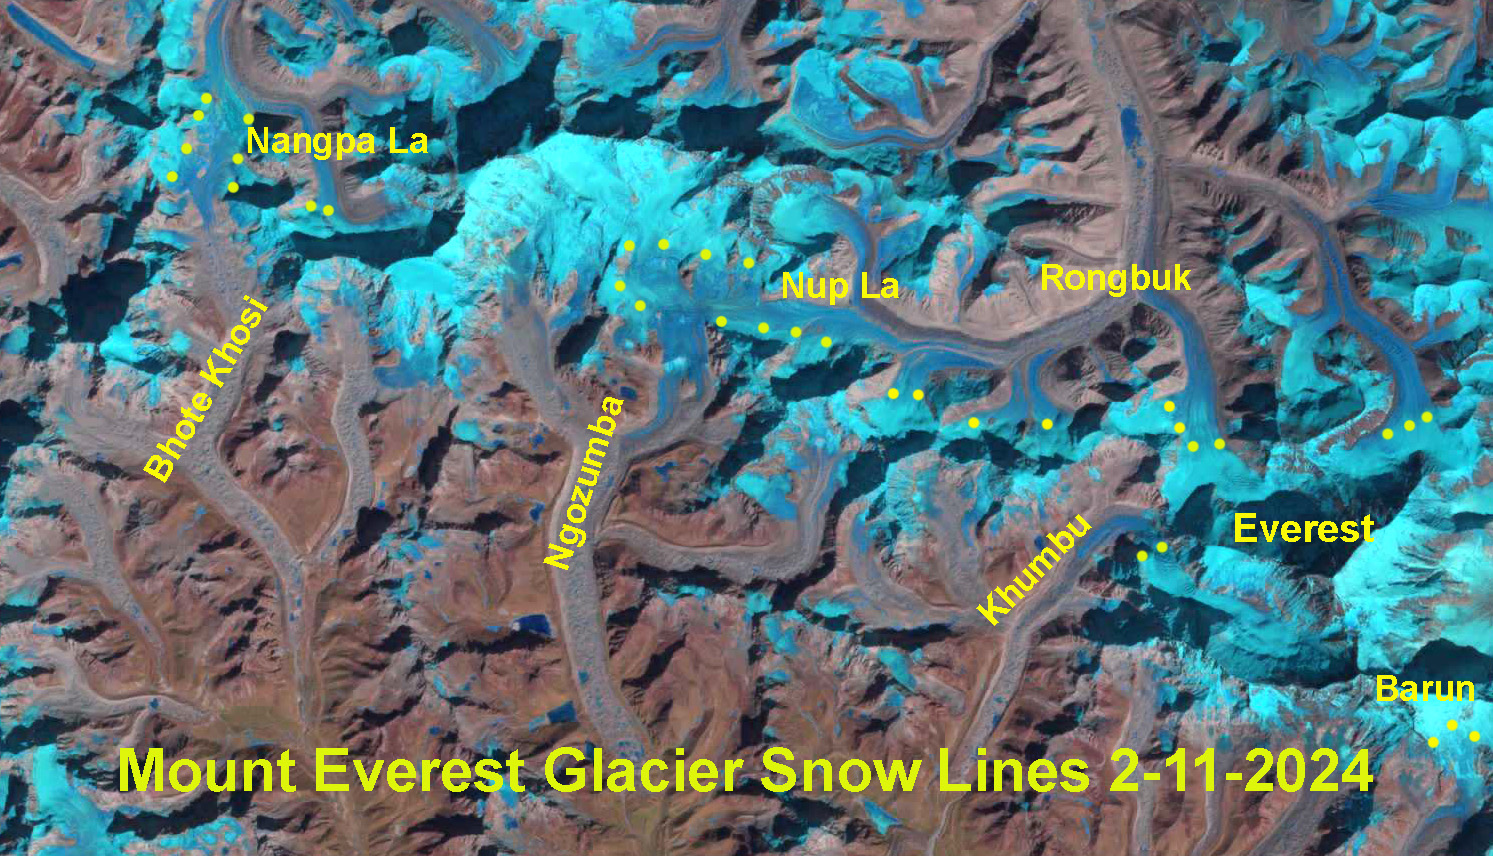
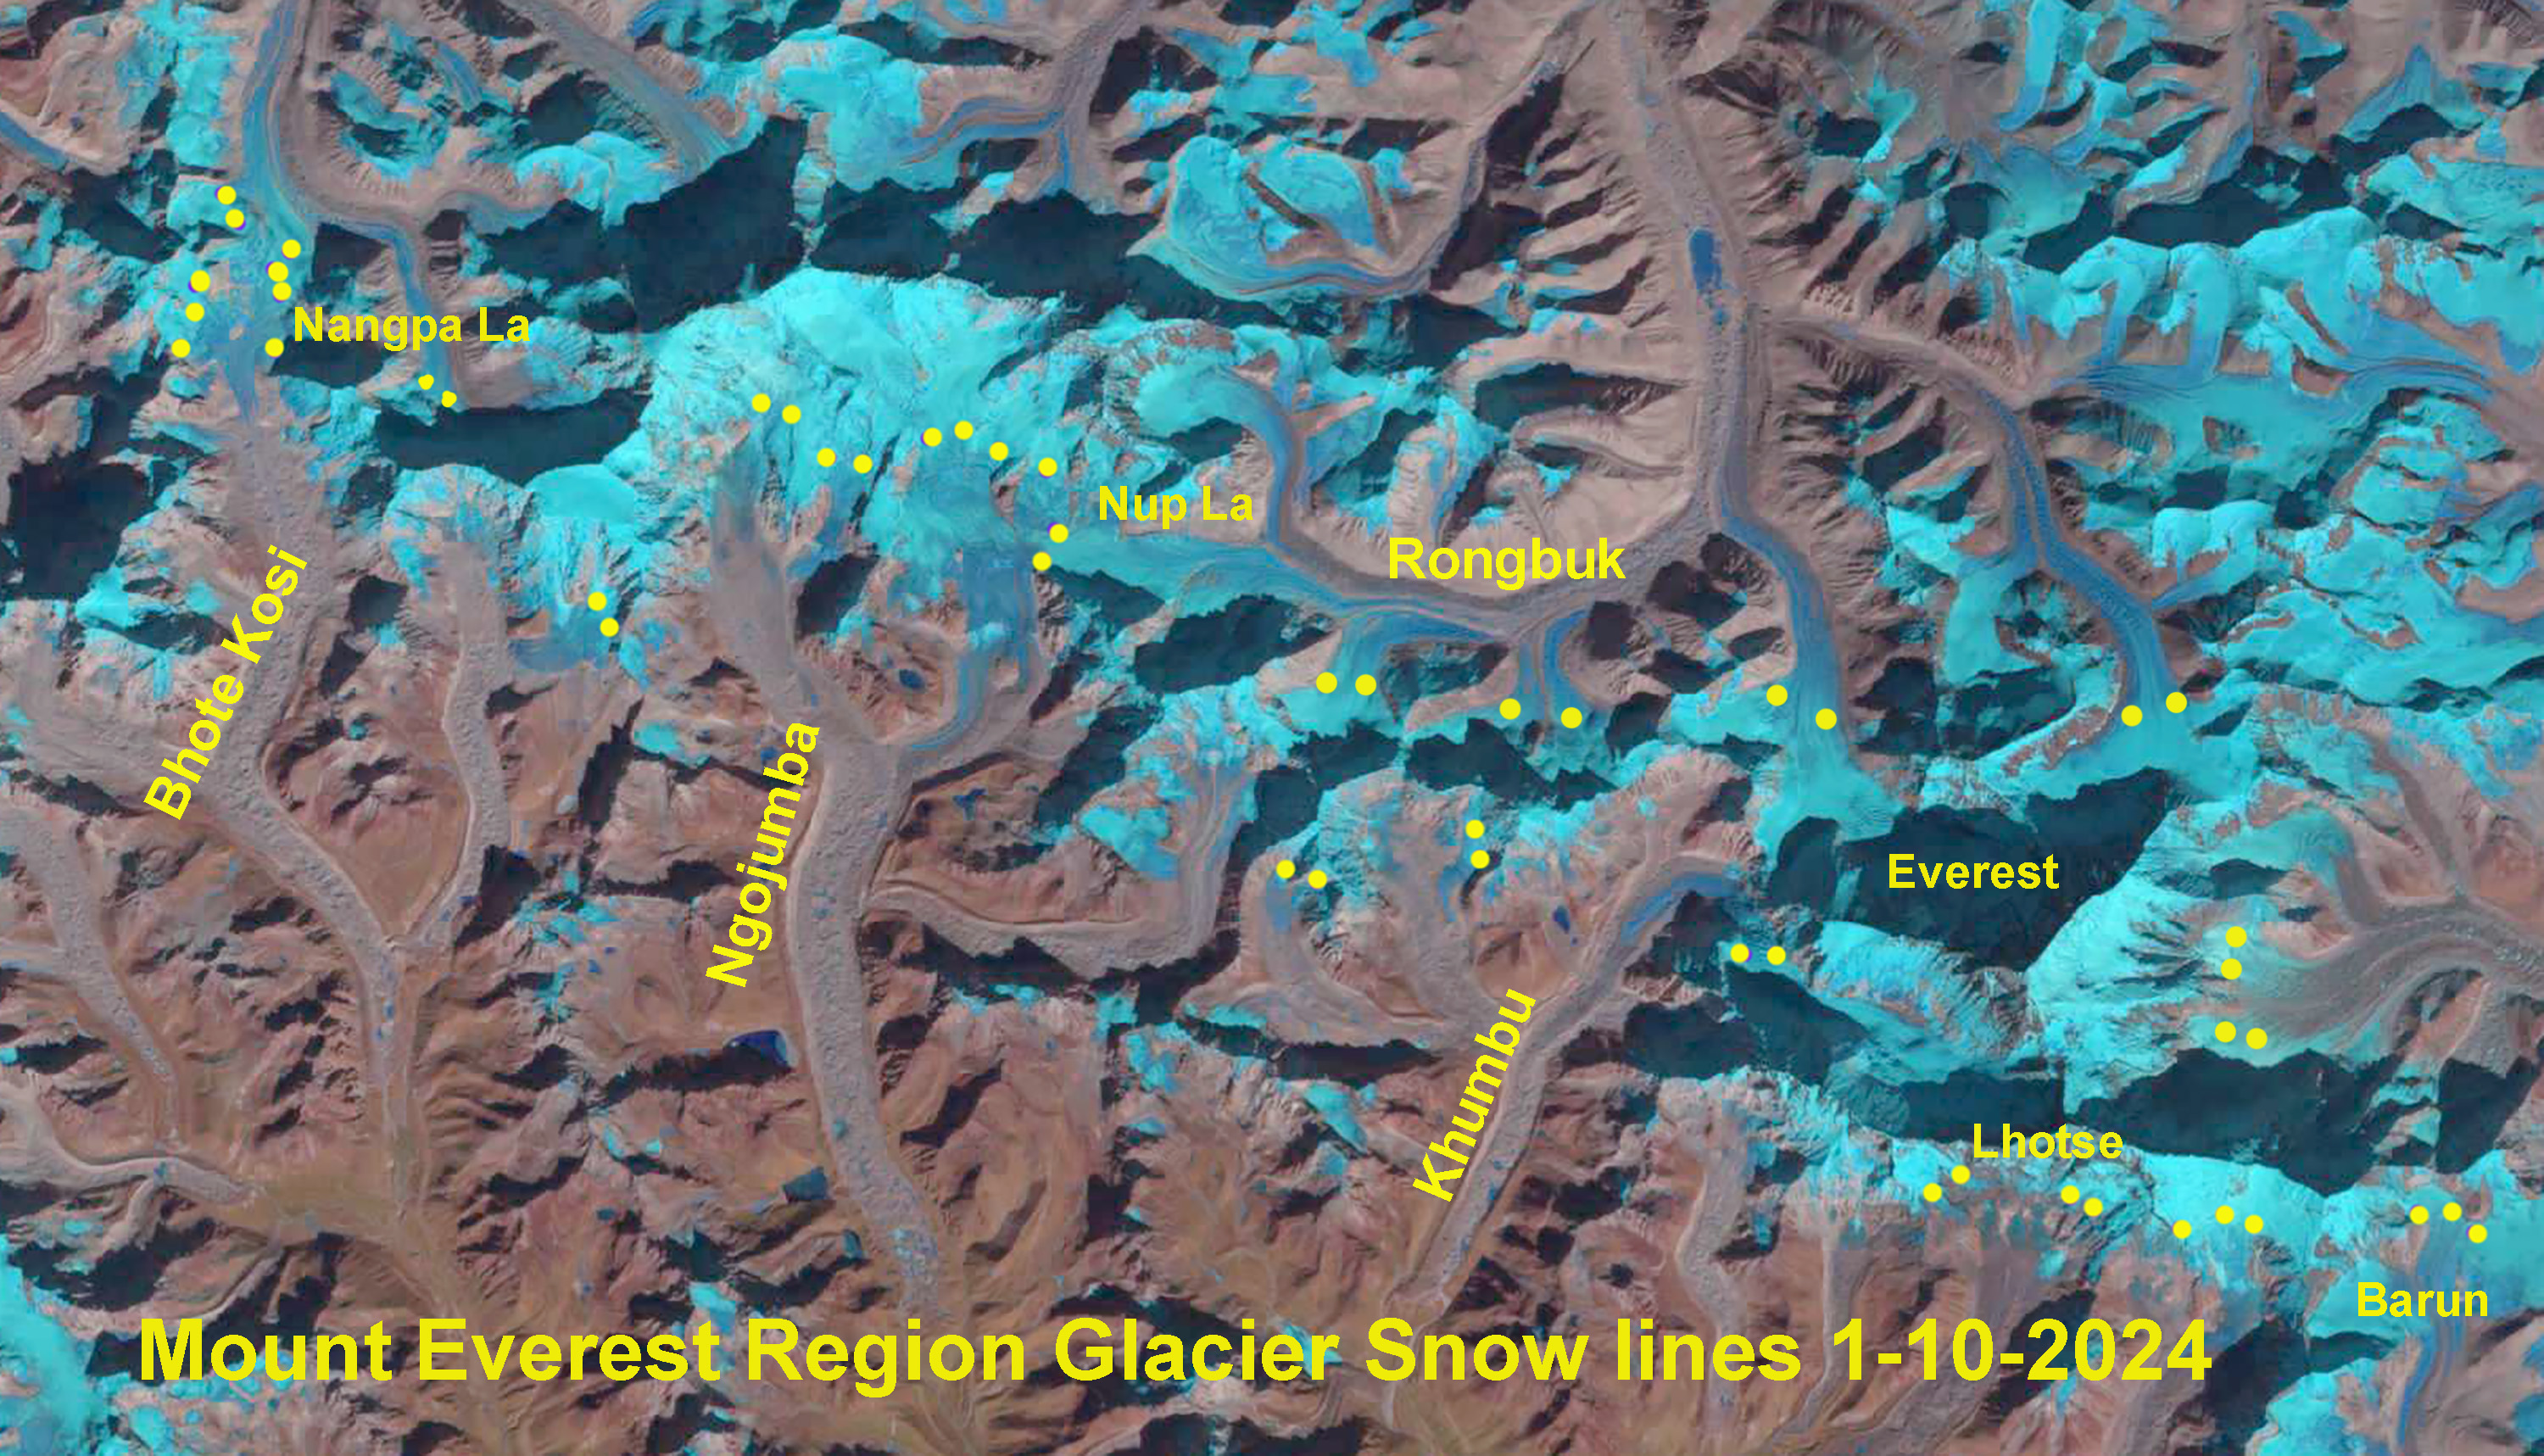
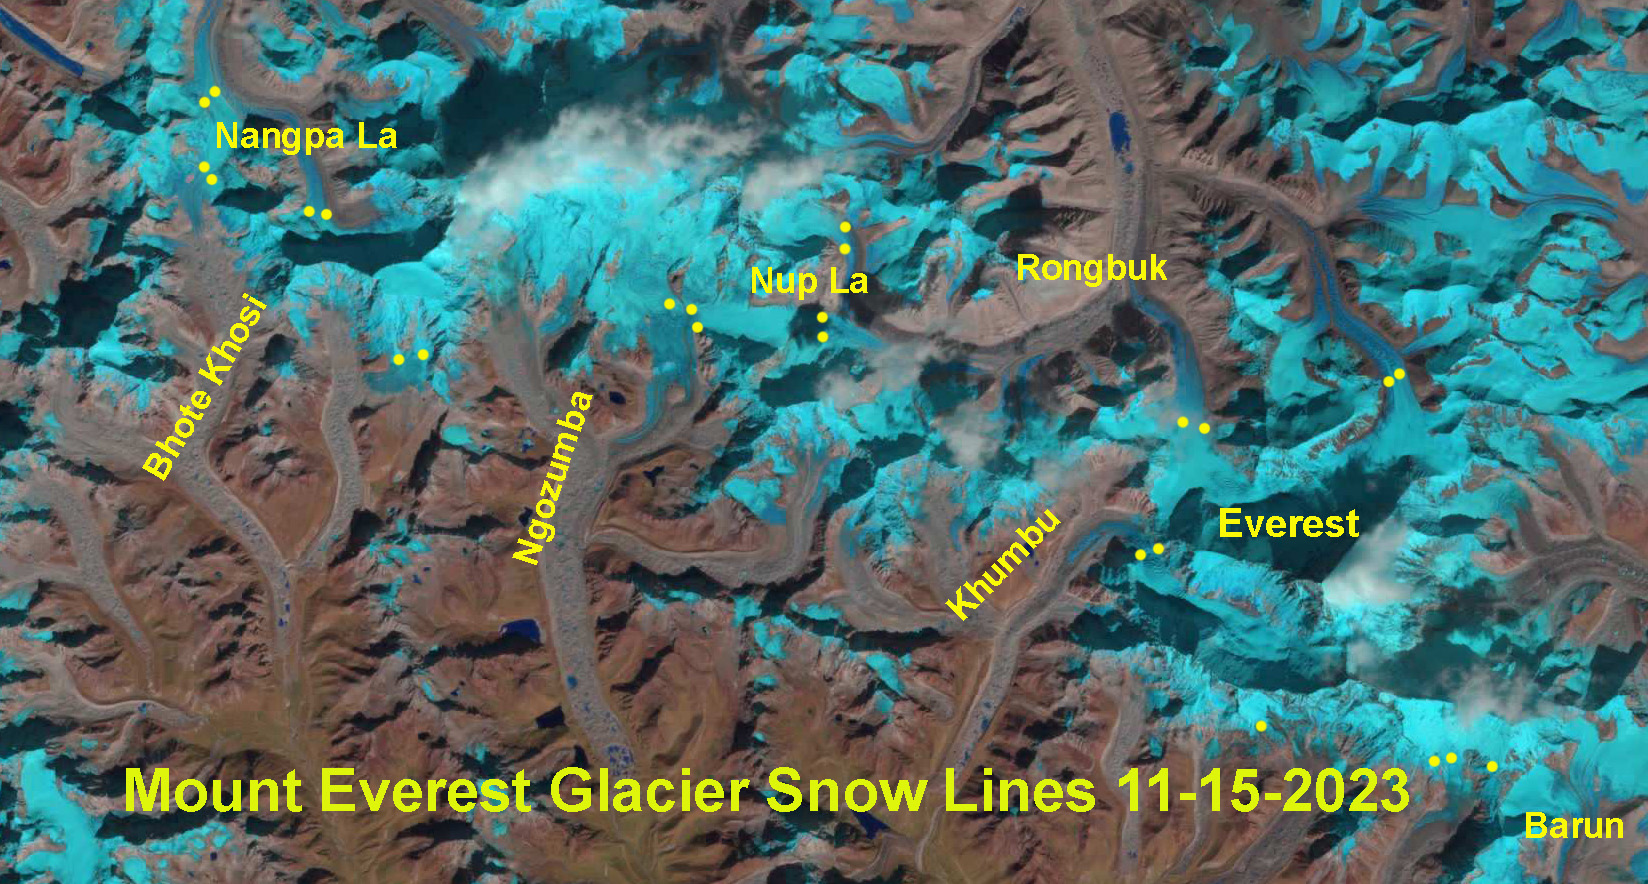
On October 13, 2020 Landsat imagery indicates the snow line on Mount Everest region glaciers averages 5600 m. By December 16 the mean snow line had risen to 5800 m (Pelto, 2020). On January 4-5, 2021 a minor snow event covered the area glaciers, which subsequently melted during an unusual warm period that extended from January 10-15. During this six-day January thaw daily maximum temperatures exceeded 3 C at the Base Camp weather station each day, peaking at 7 C on January 13 .  At the Camp 2 weather station temperatures reached above -4 C each day during this period, with a maximum of 1 C on January 10 and 13. The daily maximum freezing line during the six-day period given the winter lapse rate of 0.54 C/100m is ~6000 m. Yes, mid-winter freezing levels at 6000 m on Mount Everest. This indicates melting even if limited in the vicinity of the snow line. From January 9-22 maximum temperatures have exceeded 0 C at Base Camp on 8 days. 

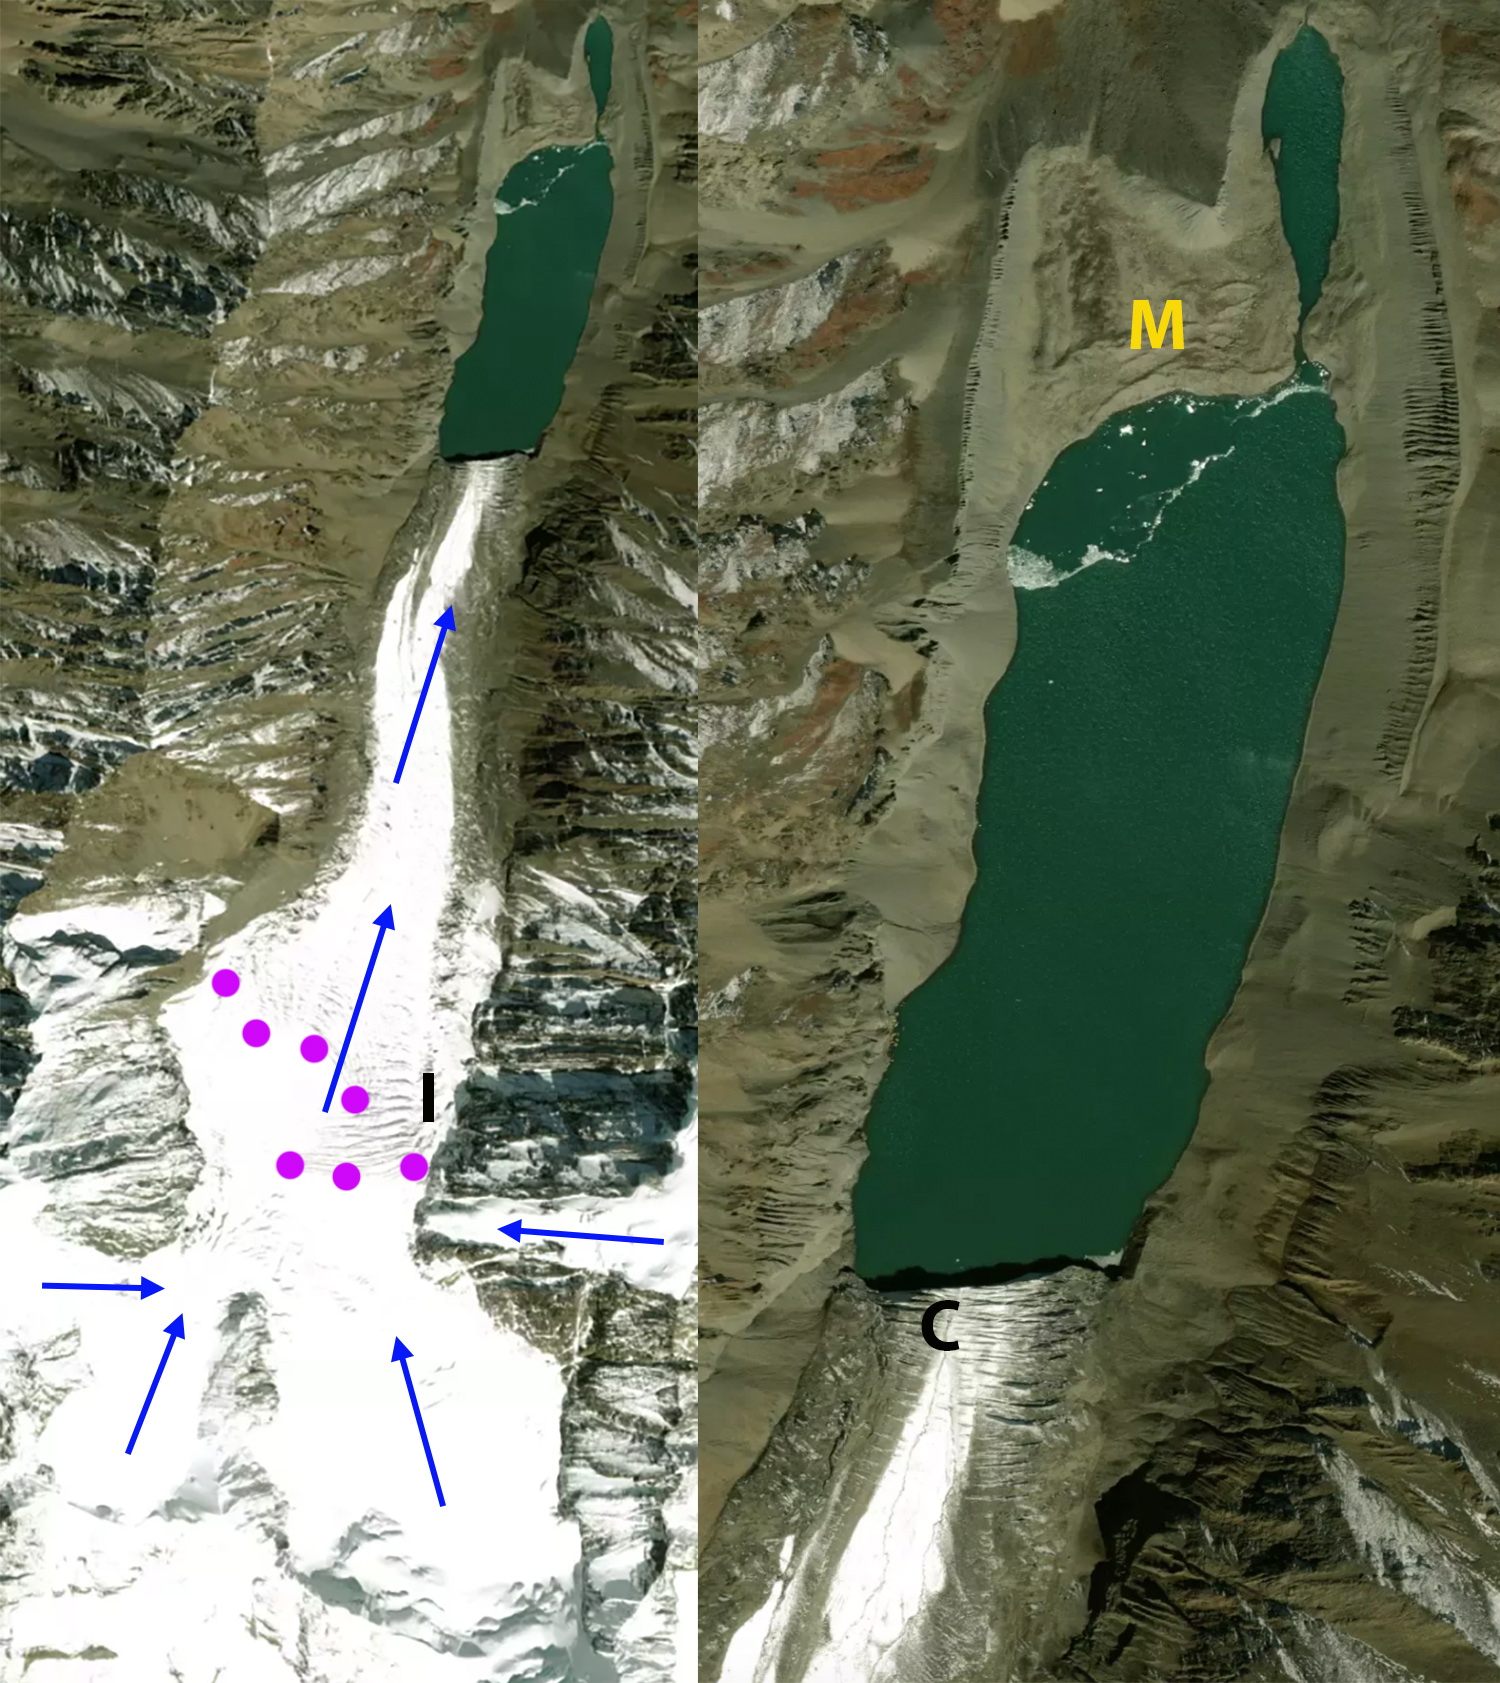
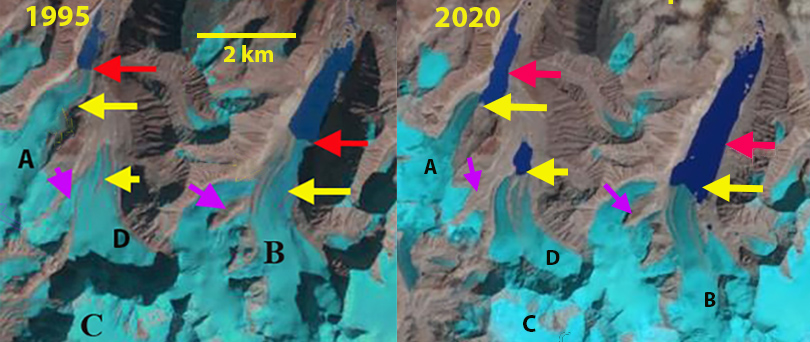
The impact is evident on Rolwaling Glacier which is 20 km south of Nanpa La and 35 km southwest of Mount Everest. This glacier is best known for being the primary glacier feeding the expanding and dangerous Tsho Rolpa, the lower part is often referred to as Trakarding Glacier (Rounce et al 2020). The glacier has a gentle slope allowing accurate assessment of the snow line. On October 13, 2020 the snow line is at 5725 m adjacent to Point A.  By December 16 the snow line has risen to just south of Point B at 5800 m.  On January 17 despite a small snow event on January 4-5, the snow line has risen above Point B  to 5825 m. That the majority of the glacier remains snow free in mid winter and that ablation continues will hasten glacier retreat and Tsho Rolpa expansion.

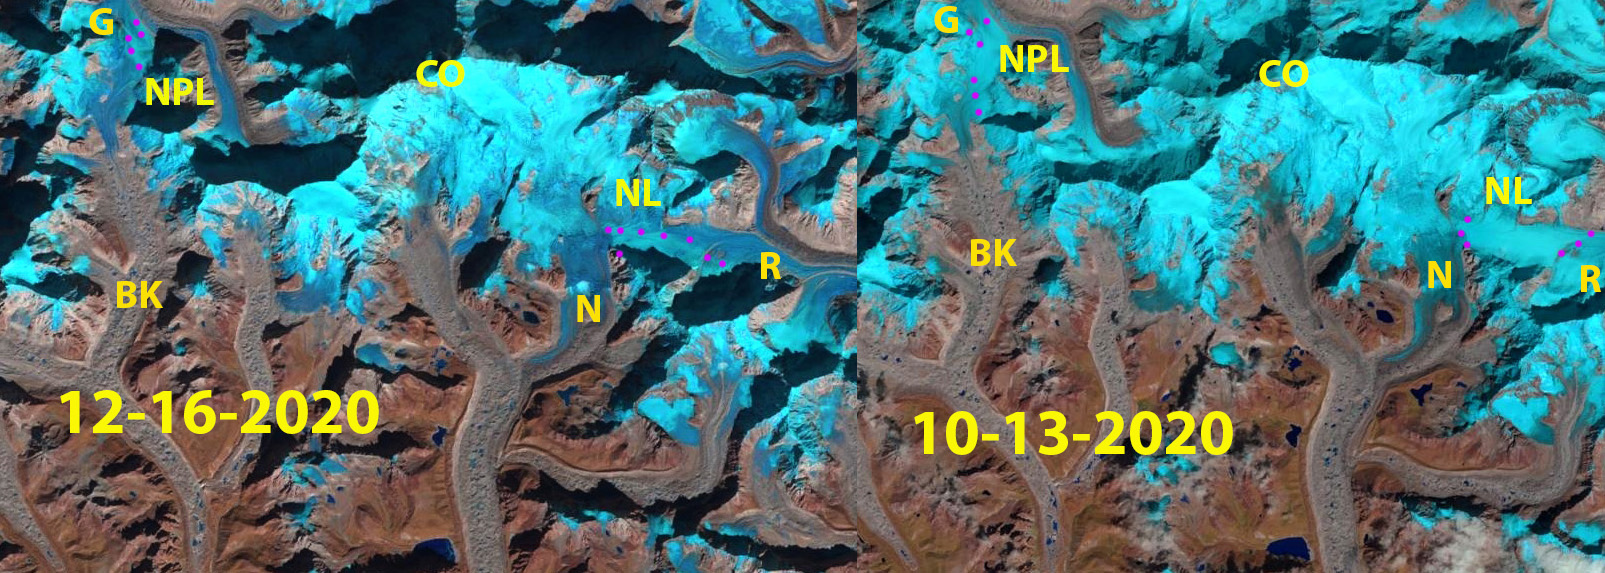
The snow line also remains above Nangpa La (5800 m) on January 17, 100 m higher than on October 13 when the snow line was at 5700 m, see below. Bolch et al (2011) indicated thinning on Khumbu Glacier was greatest in the clean ice zone, above the debris cover and below the snow line. This is both because of the higher albedo increasing the amount of solar radiation absorbed versus snowcover and the lack of an insulating debris cover.  The rising snow line elevation has in the short term expanded this zone and bare ice is more susceptible to melt in the dry, sunny conditions of winter as temperatures are near 0 C.

Mount Everest glaciers are summer accumulation type glaciers with ~75% of annual precipitation occurring during the summer monsoon, which is also the period of maximum melt lower on the glaciers (Wagnon et al 2013; Perry et al 2020). The freezing limit in summer separates the region where frozen precipitation or liquid precipitation predominates. Bocchiola et al (2020) report that on West Kangri Nup Glacier, tributary to Khumbu Glacier, in the 5400-5500 m range significant accumulation is no longer being retained through the summer monsoon, indicating the recent freezing limit.  Perry et al (2020)  identified a ~100 m rise in summer freezing level since 1980, to ~5400 m in the Mount Everest region, using ERA5 June, July, August, and September freezing-level heights.  The rising freezing level is also evident in the ELA on Mera Glacier measured in October where Wagnon et al (2020) note that from 2008-2016 the ELA ranged from 5335-5680 m, and then rose to above 5700 m each year from 2017-2019. 

October has been considered the end of the melt season in the region with little precipitation in the post monsoon and early winter season (October-December), averaging just ~3% of the total annual precipitation (Perry et al 2020)  Winters (December-February) have been characterized as cold and dry, though they do have the most variable precipitation (Wagnon et al 2020). Salerno et al (2015) noted that winter ablation was only significant near the terminus of glaciers on the southern flank of Mount Everest.  Litt et al (2019) use a glacier mass balance ablation model that does not account for potential winter ablation over much of the glacier.  Sherpa et al (2017) examining the mass balance of Changri Nup concluded that winter mass balance is close to zero at all elevations based on the 2010-2015 period.  The assumption that the ablation season endin October, appears appropriate prior to the last decade. It is acknowledged that sublimation did occur in winter, but that was secondary to winter accumulation. Wagnon et al (2013) noted that ablation was significant in the ablation zone during the four winters surveyed from 2009-2012 at 5505 m on Mera Glacier in the Dudh Koshi Basin that Mount Everest south side drains intoThis indicates that at least in recent years we need to account for winter ablation on Himalayan glaciers and the new high elevation weather record from Mount Everest are key to this Matthews et al (2020).

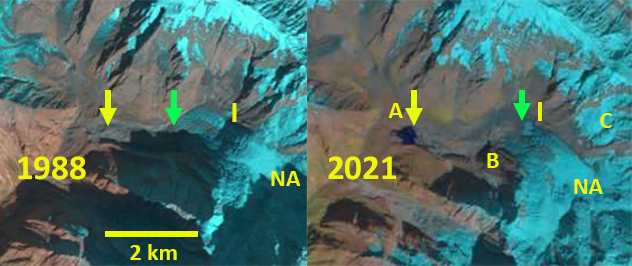
Nanpa La (NPL) and Nup La (NL) in October 13, 2020 and January 17, 2021 Landsat imagery indicating the snow line rise that has persisted into mid- winter. Snow line indicated by yellow dots.

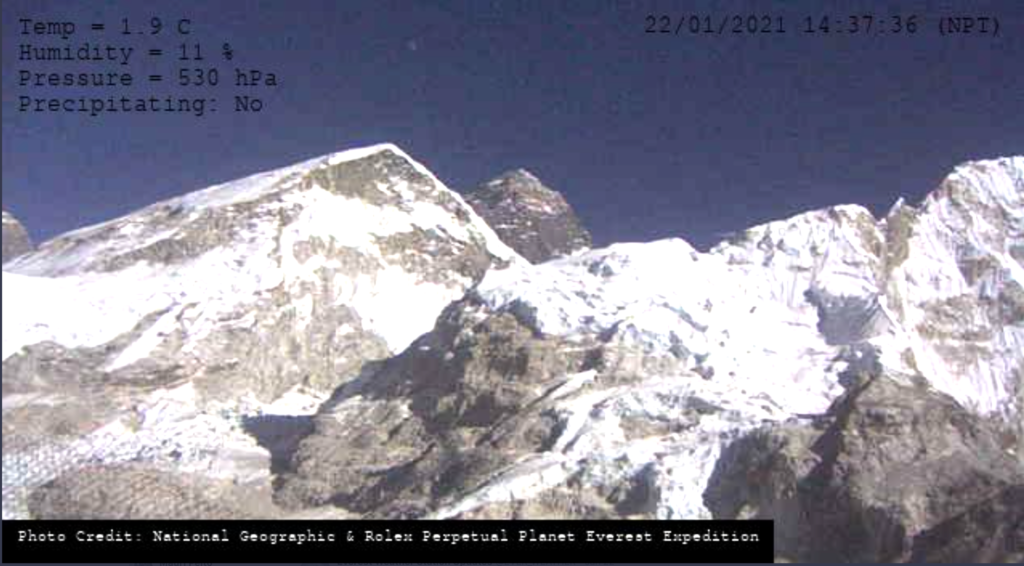
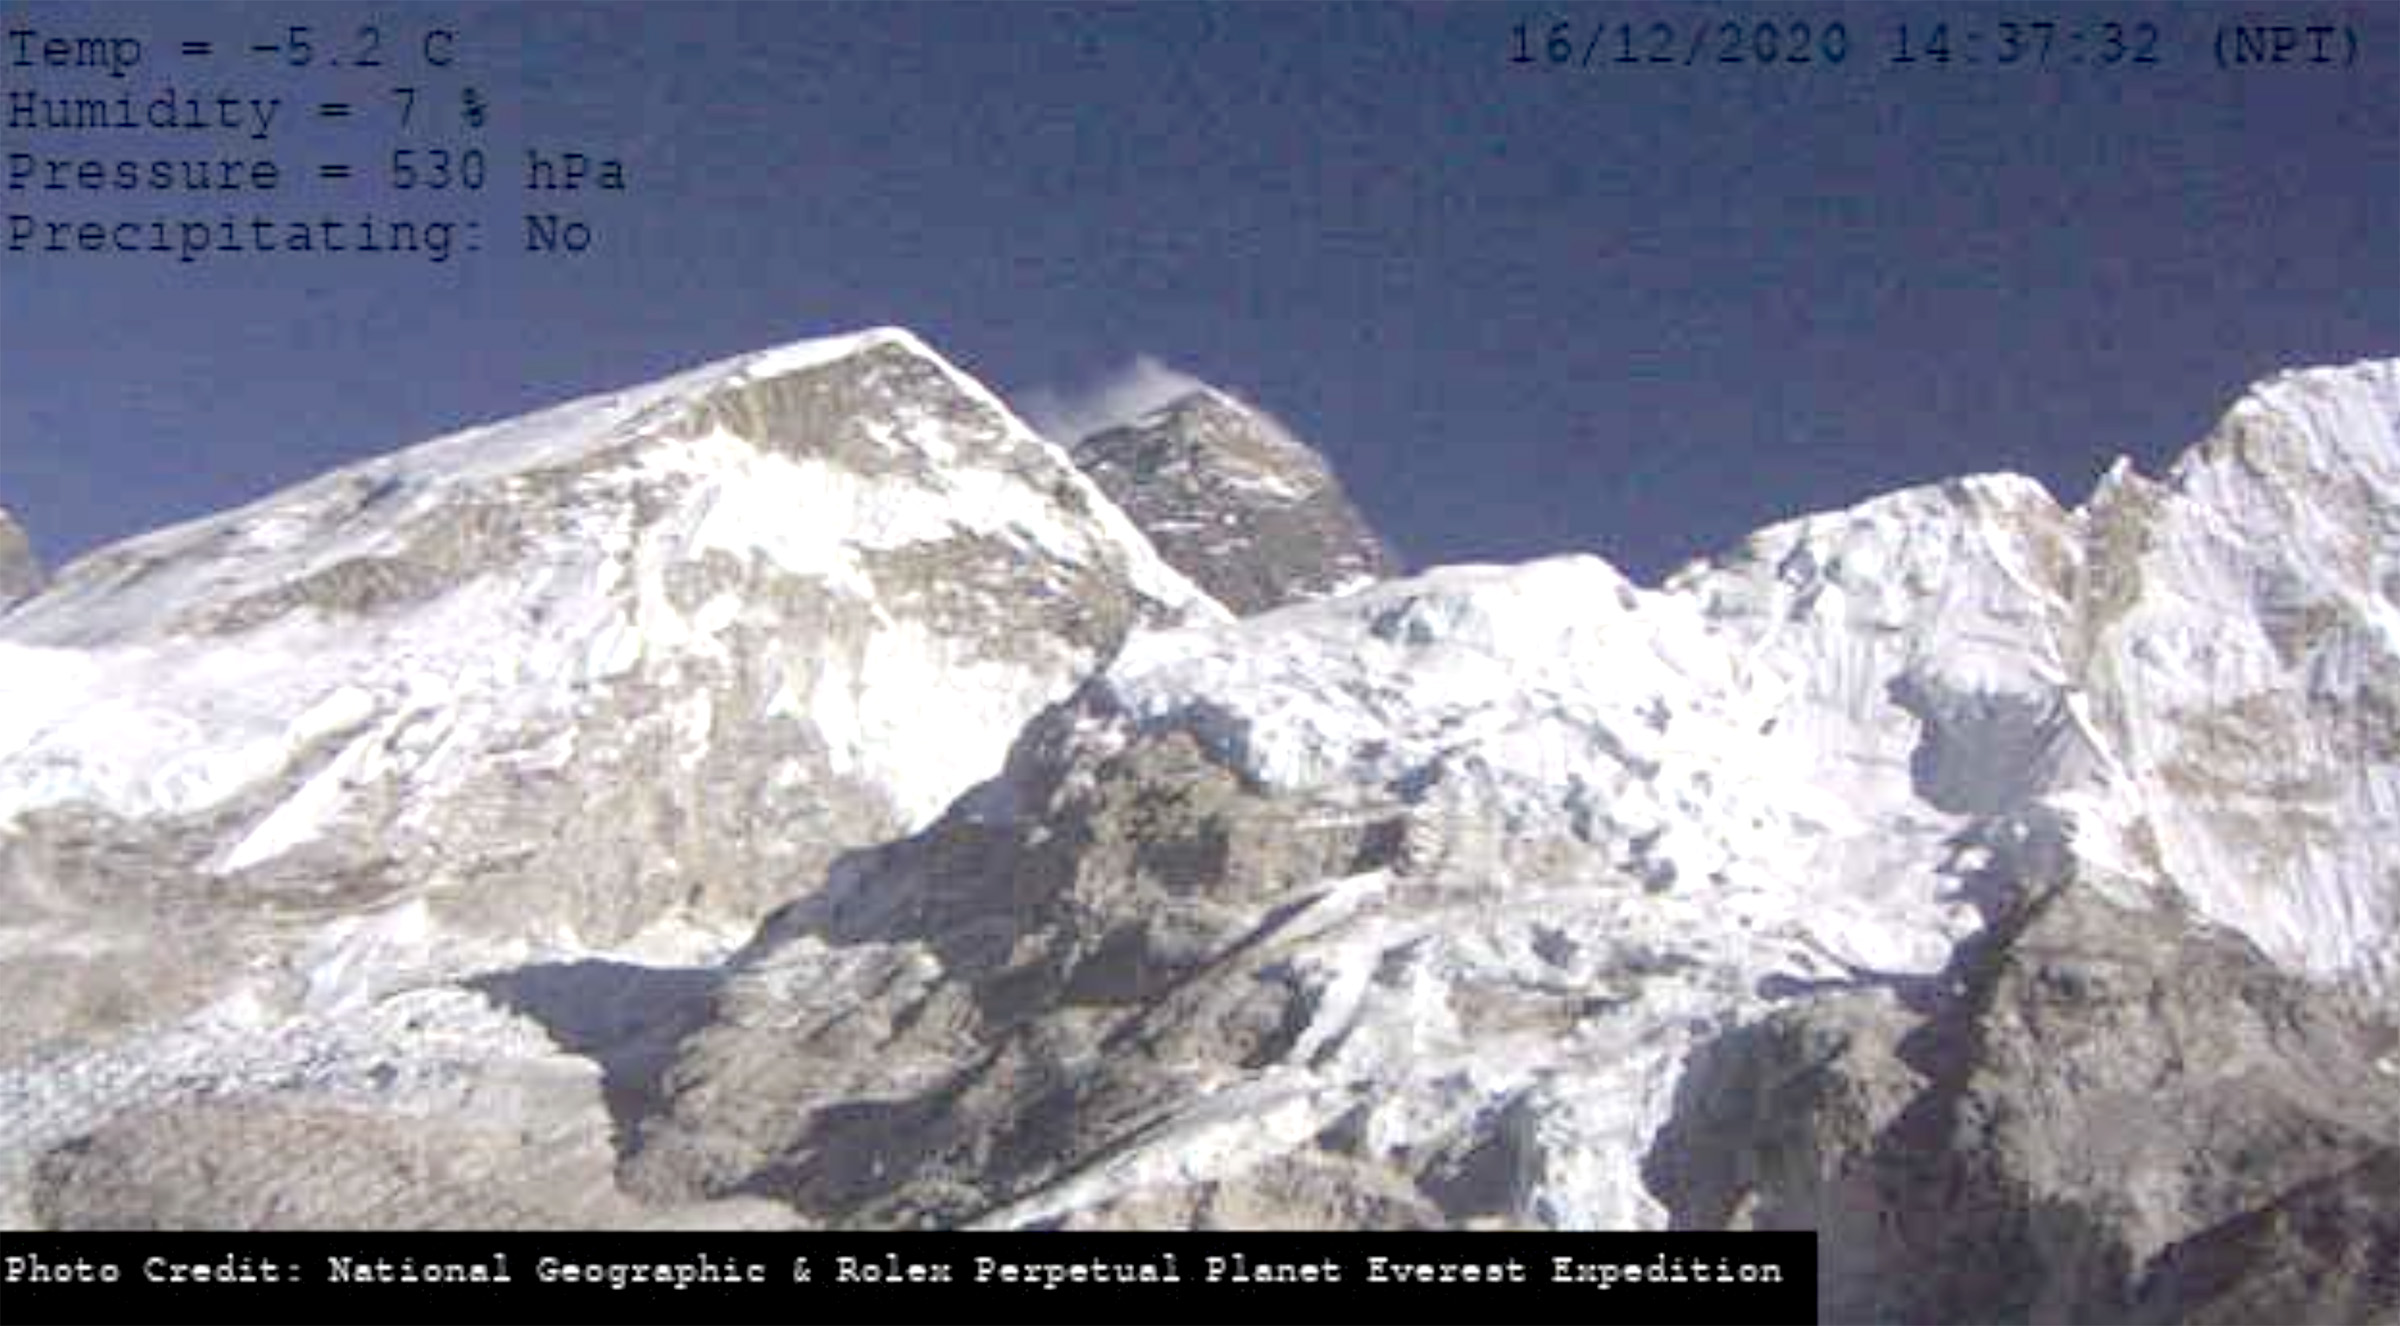
Daily Photograph from the Rolex National Geographic Perpetual Planet expedition Base Camp weather station on January 22, indicating the lack of snowcover on the bare rock surfaces in foreground.


Nangpa La and Nup La, Mount Everest Region are snow free through December 2020

Nangpa La (NPL) and Nup La  (NL)  in Landsat images from 10-13-2020 and 12-16-2020, CO=Cho Oyu Peak and purple dots indicate the snowline. Both passes can be crossed without traversing snow on December 16.

The winter monsoon for the Nepal Himalaya is a dry cold period with limited precipitation or new snow accumulation.  Mount Everest region glaciers are summer accumulation type glaciers with ~75% of annual precipitation occurring during the summer monsoon (Wagnon et al 2013; Baker Perry et al 2020). The summer monsoon also is the period of the highest melt rates lower on the glaciers. October has been considered the end of the melt season in the region with little precipitation early in the Post Monsoon and early winter season (October-December), averaging ~3% of the total annual precipitation (Baker Perry et al 2020).   The limited snowpack with warmer winter temperatures have led to higher snowlines during the first few months of the winter season in recent years (Pelto, 2019).  Here we use a combination of Landsat images from Oct. 13 and Dec 16. to indicate the snowline rise in the vicinity of four high passes between Nepal and China (Tibet) along with The Rolex-National Geographic Perpetual Planet Expedition real time weather data, which  for Dec. 16 indicate clear dry, low humidity conditions on Mount Everest, see image below.local weather records. The four passes are  Nangpa La (NPL)  at the glacier divide between Gyarbarg and Bohte Koshi Glacier,  Nup La (NL) at the glacier divide of Ngozumpa and Rongbuk Glacier,  Lho La (LL) on a ridge between Rongbuk and Khumbu Glacier and Pethangtse Col (PC) at the top of Barun Glacier. Nangpa La is the only pass that is gentle enough that it can be crossed without mountaineering experience and has been used as a trading route across the Himalaya. Further information at NASA Earth Observatory and paper published by Pelto et al 2021.

On October 13, 2020 the snowline is at 5700 m on the Gyarbarg Glacier and Bhote Khosi Glacier that flow north and south from Nangpa La respectively. At Nup La the snowline is at 5750 m short of the pass on the Rongbuk Glacier and Ngozumpa Glacier that flow north and south from the divide respectively.  At Lho La the snowline is at 5700 m on Rongbuk Glacier and 5500 m on Khumbu Glacier that flow north and south from the divide respectively.  At Pethangtse Col the snowline is at ~6000 m on Barun Glacier that flows south from the col.  Two months later on Dec. 16 the snowline has risen above Nangpa La, allowing for a snow free crossing, and is at ~5800 m. There is also a snow free crossing at Nup La, with the snowline above the pass at 5850 m. At Lho La the snowline is below the pass on Rongbuk Glacier at 5800 m and at ~5600 m on Khumbu Glacier. At Pethangtse Col the snowline reaches the crest at the top of Barun Glacier at over ~6100 m.  Nup La and Nangpa La remain snowfree through January 1, 2021, see below. The rise of ~100 m at each site since October 13 indicates significant ablation during the period, indicative of greater mass losses lower on these glaciers. Bocchiola et al (2020) report that on West Kangri Nup Glacier, tributary to Khumbu Glacier, in the 5400-5500 m range significant accumulation is no longer being retained through the summer monsoon. This is indicative of the ~100 m rise in summer freezing level since 1980 reported by Baker Perry et al (2020). 

In 2015, 2016, 2018 and again in 2019 high winter snowlines indicated the same process in the Mount Everest region (Pelto, 2019). On December 11. 2019 the snowline in the Everest Region was notably high, averaging 5800 m, but high passes such as Nup La and Nangpa La still had snowcover (Pelto, 2019). There had been no significant snowfall from the end of the summer monsoon in 2019 through Dec. 11, a snow storm occurred from Dec. 12-14 (Baker Perry et al 2020).  The result is an expanded ablation season that extends beyond October into December or later in the winter. The melt rates due to the limited solar radiation or sublimation are small, but are significant on many glaciers (Wagnon et al 2013). This has occurred due to increasing air temperatures since the 1980’s, with mean annual air temperatures  increasing  0.62 °C per decade over the last 49 years; the greatest warming trend is observed in winter, the smallest in summer (Yang et al., 2011).In recent years a white early winter can only be found high on the glaciers of the Khumbu Region.

The Lho La (LL) and Pethangtse Col (PC) region in Landsat images from 10-13-2020 and 12-16-2020, Lh=Lhotse Peak, EV=Everest, R=Ronguk Glacier, K=Khumbu Glacier, B=Barun Glacier and purple dots indicate the snowline.

Here we continue to document the extension of mass balance losses through the post monsoon and into the winter season, which we have also reported on for the Gangotri Glacier, India and Lhonak Glacier, Sikkim.  The question for Himalayan glaciers now is when does the ablation season end?  The answer will depend on the specific glacier, but a combination of satellite imagery and local weather records are key to answering, such as the ongoing programs noted by Baker Perry et al (2020) and Wagnon et al (2020).  The Rolex-National Geographic Perpetual Planet Expedition provides real time weather data from Everest and daily images of conditions that provide an opportunity to document the end of ablation conditions. King et al (2019) found during the 2000-2015 period mass balance losses of debris-covered and clean-ice glaciers to be substantially the same in the Mount Everest region. They observed the mass balance of 32 glaciers finding a mean mass balance of all glaciers was −0.52 m/year, increasing to -0.7 m/year for lake terminating glaciers. Dehecq et al (2018) examined velocity changes across High Mountain Asia from the 2000-2017 period identifying a widespread slow down in the region.  The key take away is warming temperatures lead to mass balance losses, which leads to a velocity slow down, and both will generate ongoing retreat.


Nangpa La and Nup La in Dec. 16, 2020 (above), and January 1, 2021 (below) Landsat images indicating both are snow free, purple dots indicate snowline.

Image from Rolex-National Geographic Perpetual Planet Expedition  on Dec. 16 indicating the lack of snow accumulation to date on bare rock surfaces below 5600 m in foreground including weather conditions indicating 7% humidity.