West Ganglung Glacier, Tibet Glacier Loses 20% of Length

Landsat image comparison from 1991, 2001 and 2016 of West Ganglung Glacier, red arrow is the 1991 terminus, yellow arrow the 2016 terminus, green arrow the eastern glacier proglacial terminus lake and purple arrow expanding zone between a former tributary and West Ganglung Glacier

West Ganglung Glacier is on the China-India border 6 km west of Ganglun Grangri Peak meltwater enters the Sultej River and then Mapam Tso.  the glacier terminates in a proglacial lake at 5200 m with its head on the border at 5750 m. This region is part of the Indus Basin, the second China glacier inventory noted a 23% decline in glacier area from 1970 to 2007 (Guo et al 2015) Assessing the sensitivity of the Sutlej River basin to climate change Miller et al (2012) noted that with a warmer climate melt contributions from lower parts are reduced because of decreased snow cover and a shorter melting season.  Significant glacier area loss will also lead to less runoff despite an increase in rate. Singh et al (2012) noted a decline in runoff from the Sutlej basin after 2000, whereas there had been a rise before that. 

Here we examine teh unnamed West Ganglung Glacier change from 1991 to 2016 in a series of Landsat images. In 1991 the glacier terminates at the red arrow, and the lake is 1050 m long. At the glacier just to the east there is a small proglacial lake 200 m long. By 2001 glacier retreat had led to lake expansion to 1400 m long. The proglacial lake at the end of the eastern glacier is now 350 m long. By 2016 the proglacial lake at the terminus had expanded to a length of 1850 m, a retreat of 800 m in 27 years.  The proglacial lake at the terminus of the eastern glacier in 2016 is 650 m long, indicating a retreat of 450 m.  In both case the retreat is a significant loss of overall glacier length, ~20%.  The purple arrow indicates the increasing separation between a tributary and the West Ganglung Glacier glacier.

Google Earth image of West Ganglung Glacier, red arrow is the 1991 terminus, yellow arrow the 2016 terminus, green arrow the eastern glacier proglacil terminus lake and purple arrow expanding zone between a former tributary and West Ganglung Glacier


Landsat image from2014 of West Ganglung Glacier, red arrow is the 1991 terminus, yellow arrow the 2016 terminus, and green arrow the eastern glacier proglacial terminus lake.

Lumding Glacier Rapid Retreat, Nepal 1992-2016

Landsat comparison of Lumding Glacier terminating in Lumding Tsho. Red arrow on each Landsat image indicates 1992 terminus and yellow arrow 2016 terminus location.

Lumding Glacier, Nepal terminates in Lumding Tsho, a proglacial lake, in Dudh Khosi Valley in the Mount Everest region of Nepal. This lake poses a hazard for a glacier lake outburst flood in the Dudh Khosi valley. The lake expansion results from retreat of the Lumding Glacier. International Centre for Integrated Mountain Development (ICIMOD) study examined the changes in Lumding Tsho from 1962-2000 and found the lake grew from 0.2 km2 in 1962 to 0.77 km2 in 2000. ICIMOD has an ongoing specific focus on assessing glacier lake outburst flood potential. The lake growth was the result of a retreat of 40 meters/year from 1976-2000 and 35 meters/year from 1962-2007, as noted in figure below from Bajracharya  & Mool (2009). Here we update the changes to 2016 using Landsat imagery.

The lake begins at the end of the heavily debris covered Lumding Glacier draining east from Numbur Himal . Red arrow on each Landsat image indicates 1992 terminus and yellow arrow 2016 terminus location. The lake was 1675 meters long in 1992, 1950  meters long in 2000, 2350 meters long in 2009 and 2800 meters in 2016. This 1100 m retreat in 25 years is a retreat rate of 45 meters/year. The lake at 2.8 km in length now has an area of over 1 square kilometer. The glacier is fed largely by avalanching off the flanks of Numbur, blue arrows. King et al (2017) noted a mean mass balance of all 32 glaciers examined in the Mt. Everest region from 2000-15 was  −0.52  water equivalent per year. The mean mass balance of nine lacustrine terminating glaciers, like Lumding Glacier, was 32 % more negative than land-terminating debris-covered glaciers.  An additional problem for the glacier in the future is the retreat of the terminus of the tributary glaciers that avalanche onto the lower Lumding Glacier. The yellow letter A in the 2016 Sentinel images indicates the retreat of a feeder glaciers, 300 m since 1992.  The lower section of the Lumding Glacier is heavily debris covered, noted best in Google Earth image, which insulates the underlying ice, reducing melting and retreat. This also indicates the avalanche source of much of the accumulating snow and ice. The increased distance to the feeding snow and ice slopes will reduce this input.  The two blue arrows indicate plumes of glacier runoff into the lake.  This glacier loss in mass driving the retreat is like that on Hinku Nup Glacier and Middle Lhonak Glacier

A 2016 Sentinel image of Lumding Glacier with avalanche paths shown by blue arrows, and retreating tributary above Point A.

Google Earth image of Lumding Glacier front.  This illustrates the debris cover and also meltwater plumes entering lake. 

Hinku Nup, Nepal Downwasting Lake Development

Hinku Nup Glacier in November 2016 Sentinel 2 image.  Yellow arrows indicate three supraglacial lakes that have formed.  

Hinku Nup is a valley glacier in the Dudh Khosi basin in the Mount Everest region of Nepal.  The glacier is heavily debris covered in its lowest 4 km which is a low slope section extending from 5100-4900 m.  In 1992 Landsat images there are only small supraglacial lakes, less than 100 m across on the glacier surface.  In 2000 this remains the case on Hinku Nup proper, though a lake has formed at the terminus of a former tributary, northwest yellow arrow.  By 2013 a lake has formed at the junction of Hinku Nup and Hinku Shar Glacier and a lake near the terminus of the glacier.  By 2016 the terminus lake has expanded to a length of 600 m.  There are a series of lakes that appear ready to coalesce that will extend the lake to 800 m in length, smaller yellow arrow.  The lake at the junction of Hinku Nup and Hinku Shar is 200 m across in 2016.  The proglacial lake at the terminus of the former tributary to Hinku Nup is now 500 m wide and 400 m long.  The coalescing of the lakes near the terminus will lead to the formation of lake large enough to enhance melting and lead to calving.  This should lead soon to a rapid retreat of the terminus, such as occurred on nearby Lumding Glacier.  Glacier lakes have been inventories by ICIMOD, who found little change in glacier lake area from 2001 to 2009 but a sharp decrease in the number of lakes, primarily due to coalescing.  The lake here lacks the clearcut moraine dam that exists on Thulagi Glacier and typifies glaciers that pose a Glacier lake outburst flood hazard.

King et al (2017) noted a mean mass balance of all 32 glaciers examined in the Mt. Everest region from 2000-15 was  −0.52  water equivalent per year. The mean mass balance of nine lacustrine terminating glaciers was 32 % more negative than land-terminating, debris-covered glaciers.  This mass loss is what has been driving the widespread glacier retreat in the region.  Bajracharya and Mool (2009) noted the glaciers in the Mount Everest region retreated at a rate of 10–59 m/year from 1976-2009.

[ngg_images source=”galleries” container_ids=”9″ display_type=”photocrati-nextgen_basic_imagebrowser” ajax_pagination=”1″ template=”/nas/wp/www/sites/blogsorg/wp-content/plugins/nextgen-gallery/products/photocrati_nextgen/modules/ngglegacy/view/imagebrowser-caption.php” order_by=”sortorder” order_direction=”ASC” returns=”included” maximum_entity_count=”500″]

Gangotri Glacier Expanded Melt Season & Melt Area in 2016

[ngg_images source=”galleries” container_ids=”22″ display_type=”photocrati-nextgen_basic_imagebrowser” ajax_pagination=”1″ template=”/nas/wp/www/sites/blogsorg/wp-content/plugins/nextgen-gallery/products/photocrati_nextgen/modules/ngglegacy/view/imagebrowser-caption.php” order_by=”sortorder” order_direction=”ASC” returns=”included” maximum_entity_count=”500″]

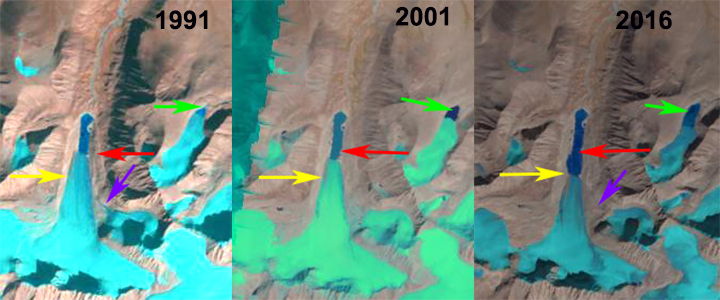
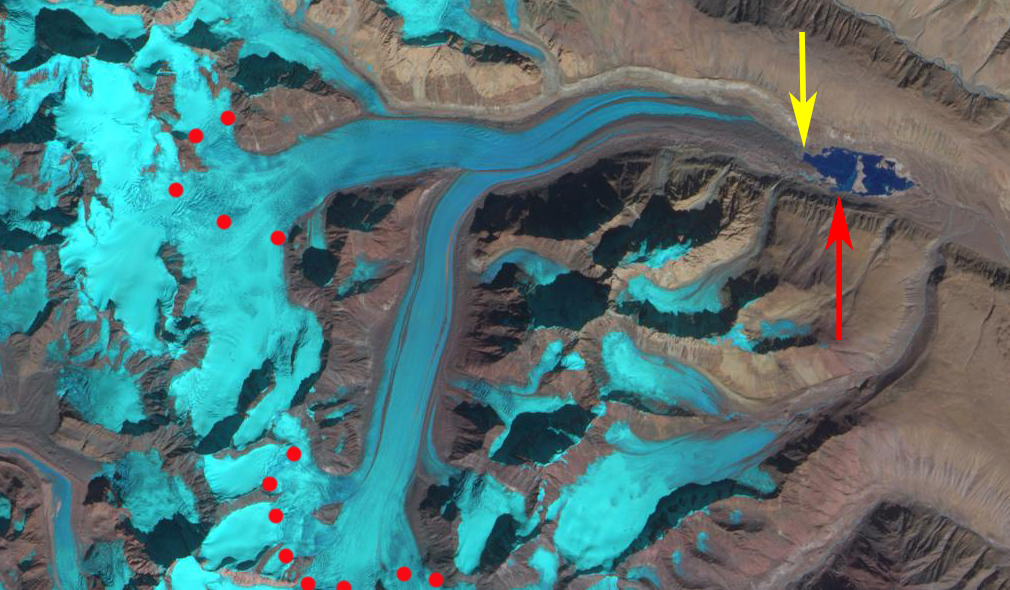
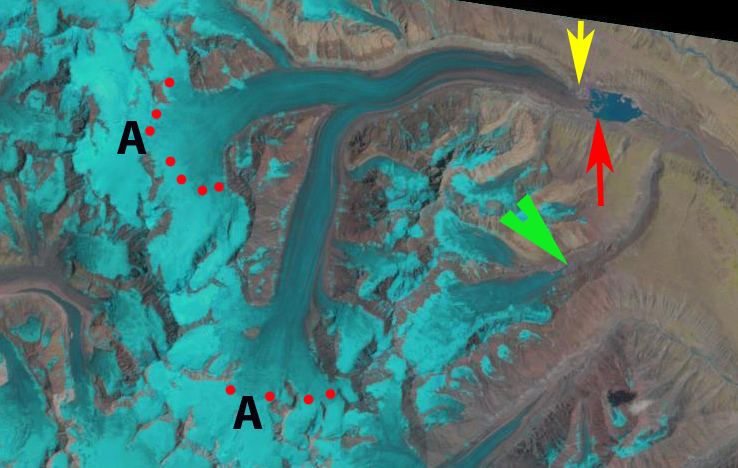
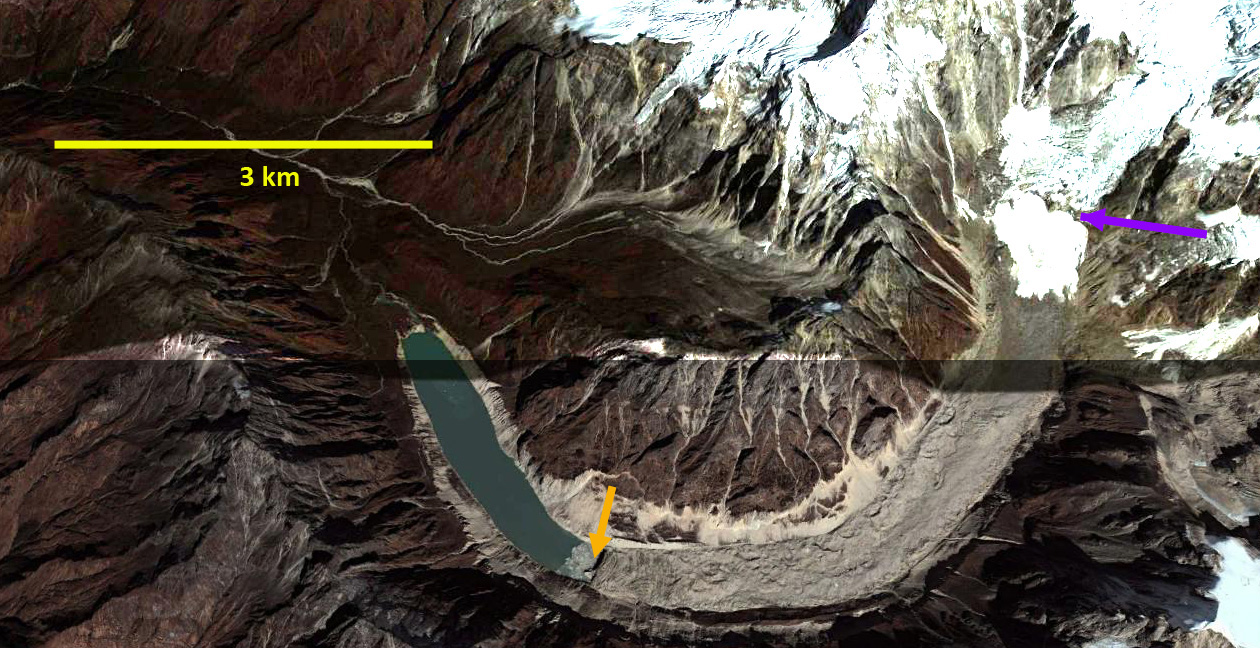
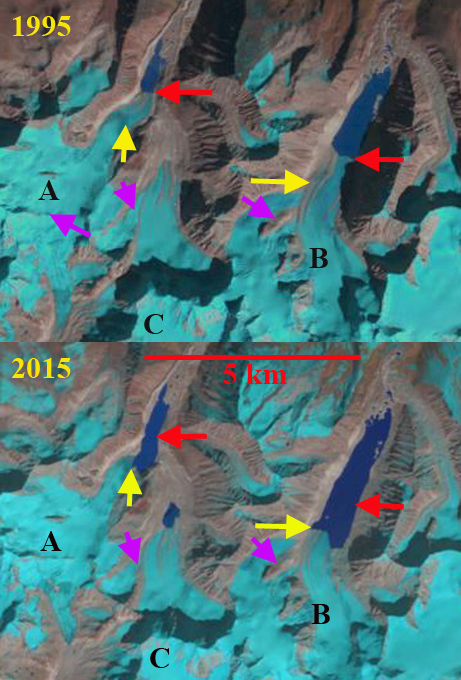
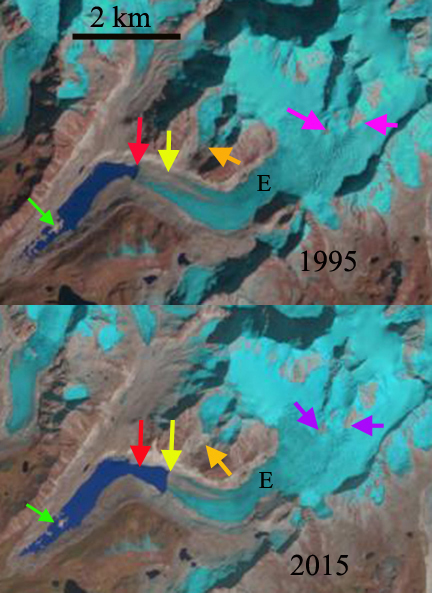
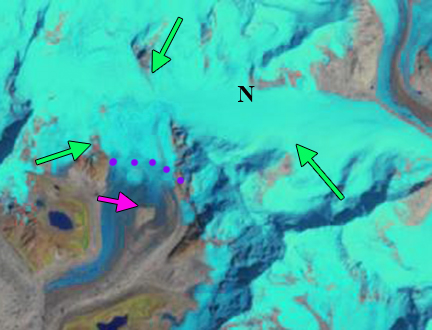
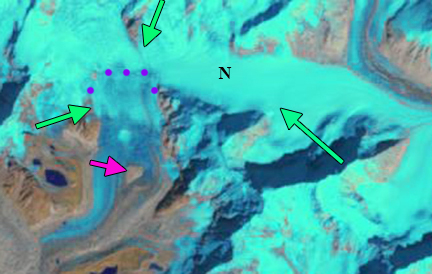
Purple dots indicate the transient snowline on Gangotri Glacier in the fall and early winter of 2016. Red arrow indicates the terminus of the glacier.

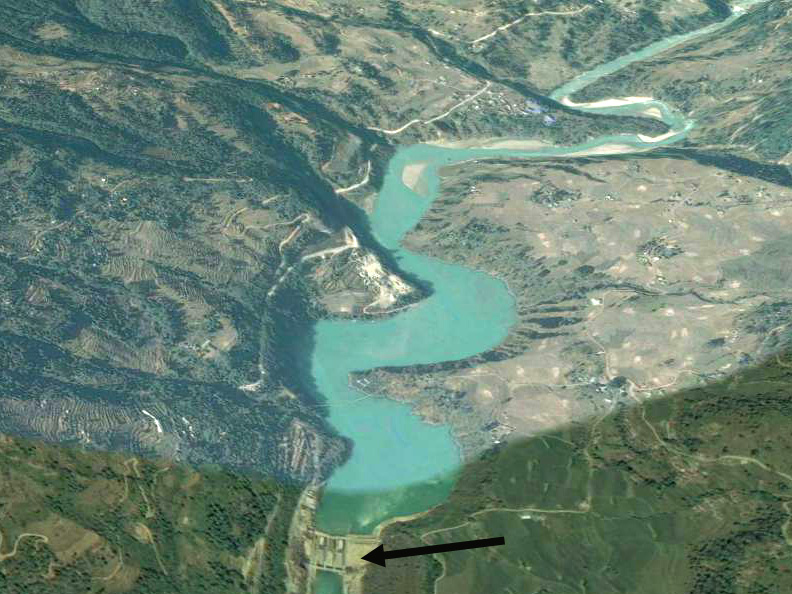
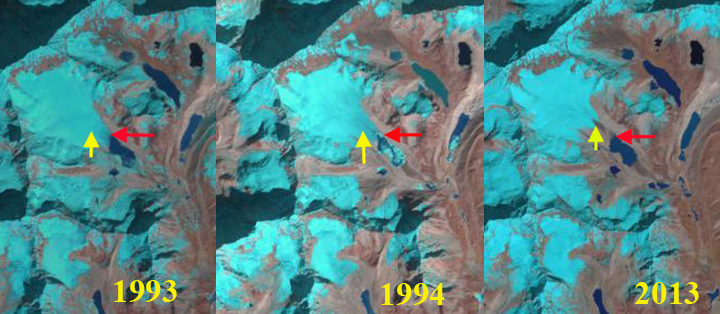
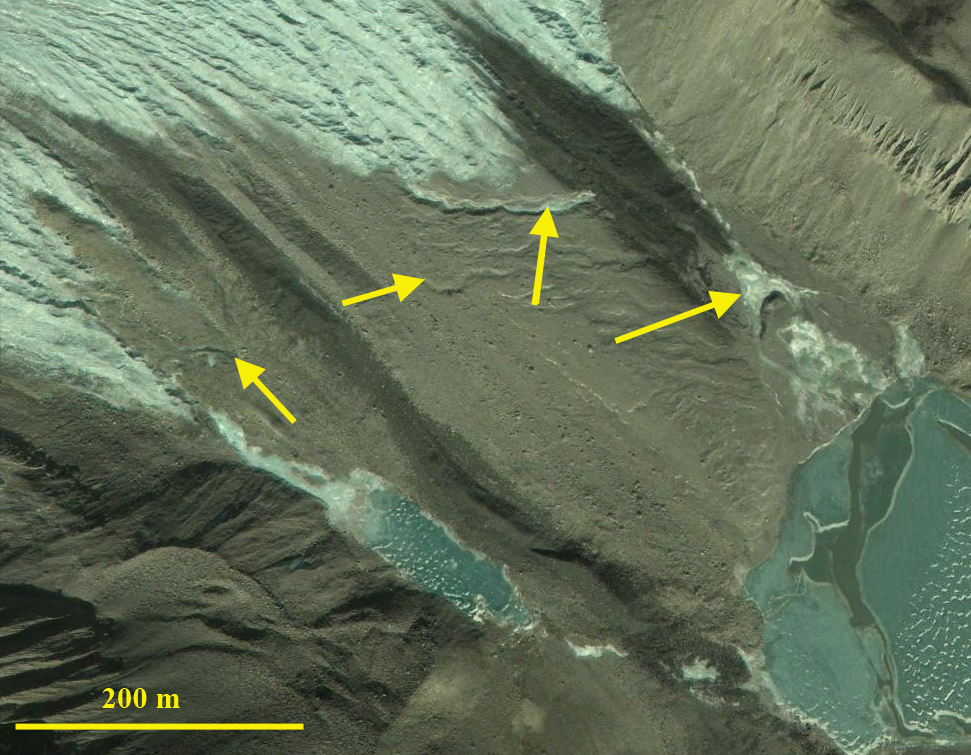
The Gangotri Glacier is the largest glacier in the Bhagirathi River watershed, situated in the Uttarkashi District, India. It is one of the larger glaciers in the Himalaya, and like all of the nearby Himalayan glaciers is retreating significantly. Gangotri Glacier provides hydropower as its meltwater  passes through three hydropower plants generating 1430 MW, including the 1000 MW Tehri Dam and reservoir and Maneri Bhali I and II, see map below.  From 1968-2006 the glacier retreated 800 meters, close to 20 meters per year (Bhambri et al, 2012). The glacier continues to thin and tributary inflow decline, while terminus retreat is slowe due to the thick debris cover that heavily insulates the ice. Bhambri et al (2011) inventoried glaciers in the upper Bhagirathi basin  and found they lost 9 square kilometers in area, 3.3% to the total, from 1968 to 2006. They further noted that recession rates have increased since 1990 and that the number of glaciers increased from 82 in 1968 to 88 in 2006 due to fragmentation of glaciers. From 1968 to 2006, the debris-covered glacier area increased by ~12% in the upper Bhagirathi basin.  Bhattachaya et al (2016) expanded on this work noting that the velocity of Gangotri Glacier declined during 2006-2014  by 6.7% from 1993-2006, this suggests reduced accumulation being funneled downglacier. They also noted an increase in the rate of debris-covered area expansion on the main trunk of Gangotri Glacier from 2006-2015, which is indicative of an expanding ablation zone. Bhattachaya et al (2016)  report a retreat rate of 9 m/year 2006-2015, which is less than before, but the down-wasting in the same period 2006-2015 was higher than during 1968-2006. The study reinforced that glacier retreat is a delayed response to climate change, whereas glacier mass balance is a more direct and immediate response. This underlines the importance of mass balance studies for assessing climate change impact on glaciers,that the World Glacier Monitoring Service has emphasized. Gangotri Glacier is a summer accumulation glacier with the peak ablation period low on the glacier coinciding with peak snowfall high on the glacier during the summer monsoon.  In the post monsoon period of October and November precipitation is low and melt rates decline, Haritashya et al (2006) note a sharp decline in discharge and suspended sediment load beginning in October. . Kundu et al (2015) from Sept. 2012 to January 2013 noted that the snowline elevation varied little, with the highest elevation being 5174 m and the lowest 5080 m.

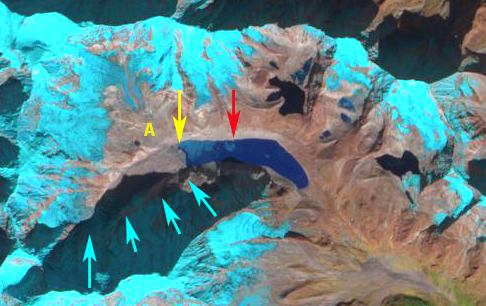
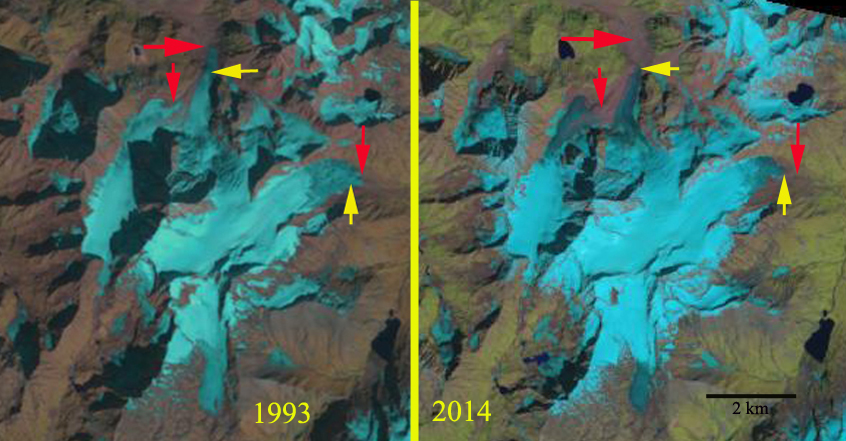
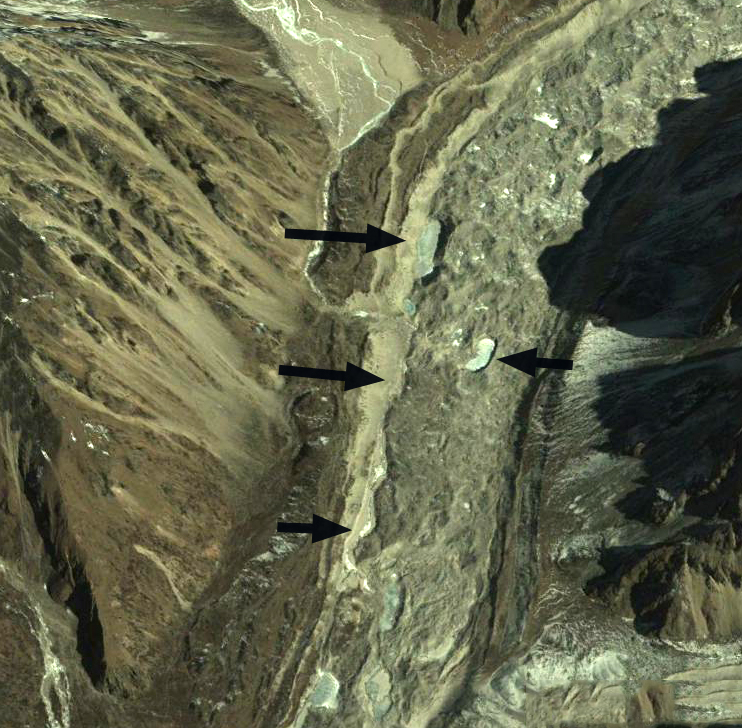
The increase in temperature has led to a tendency for snowlines to rise in the post monsoon period and remain high into the winter season on many Himalayan glaciers. In 2016 this has been the case. On October 9, 2016  a Sentinel image indicates the snowline is at 4850 m on the main trunk and on the tributary Ghanohim Glacier the snowline, while it is 4750 m on the tributaryKirti Glacier.  A Landsat image from October 13th indicates the snowline on Kirti has risen to 4800 m, and remains at 4850 on the main trunk and Ghanohim Glacier.  By November 30th a Landsat image indicates the snowline has risen to 5400 m on the main trunk and Ghanohim, the snowline is at 5800-5900 m on the glaciers in the Swachhand tributary valley, at 5600 m on Maiandi Glacier and 5700 m on the last tributary entering from the north. Note the impact of radiational shading is apparent on the main trunk with the snowline descending down the middle of the main trunk from 5400 m to 5100 m and on Kirti Glacier which is too dark to confidently discern the snowline.  Temperatures are typically cool in December, but sunshine is common. A Sentinel image from December 8th and Landsat from Dec. 9th indicate that the snowline remains approximately the same as on Nov. 30th.  The accumulation area ratio is the percentage of a glacier in the accumulation zone and is typically above 50%.  On Gangotri Glacier in December 2016 the accumulation area ratio is only 20%, indicating a large mass balance deficit.  High winter snowlines on Chutenjima Glacier, Tibet, from October, 2015 to February 2016. This tendency is also noted at Nup La-West Rongbuk Glacier, on the Nepal-China border, West Hongu Glacier, Nepal and Lhonak Glacier, Sikkim.

gangotri-glims

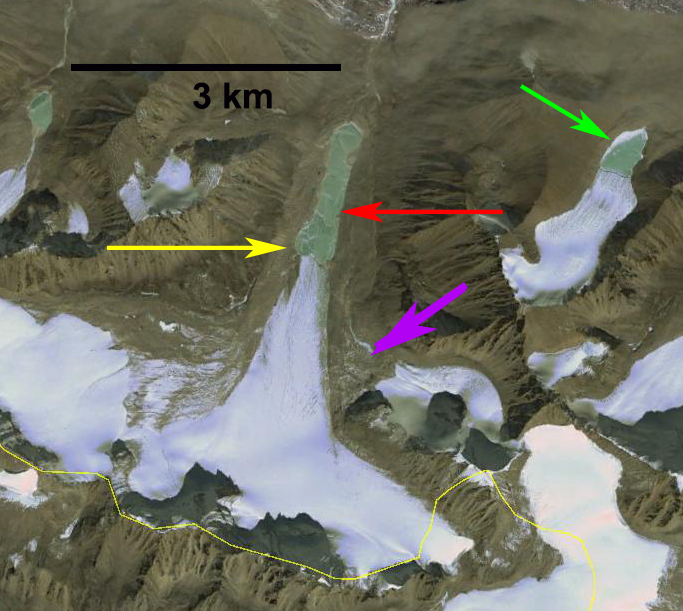
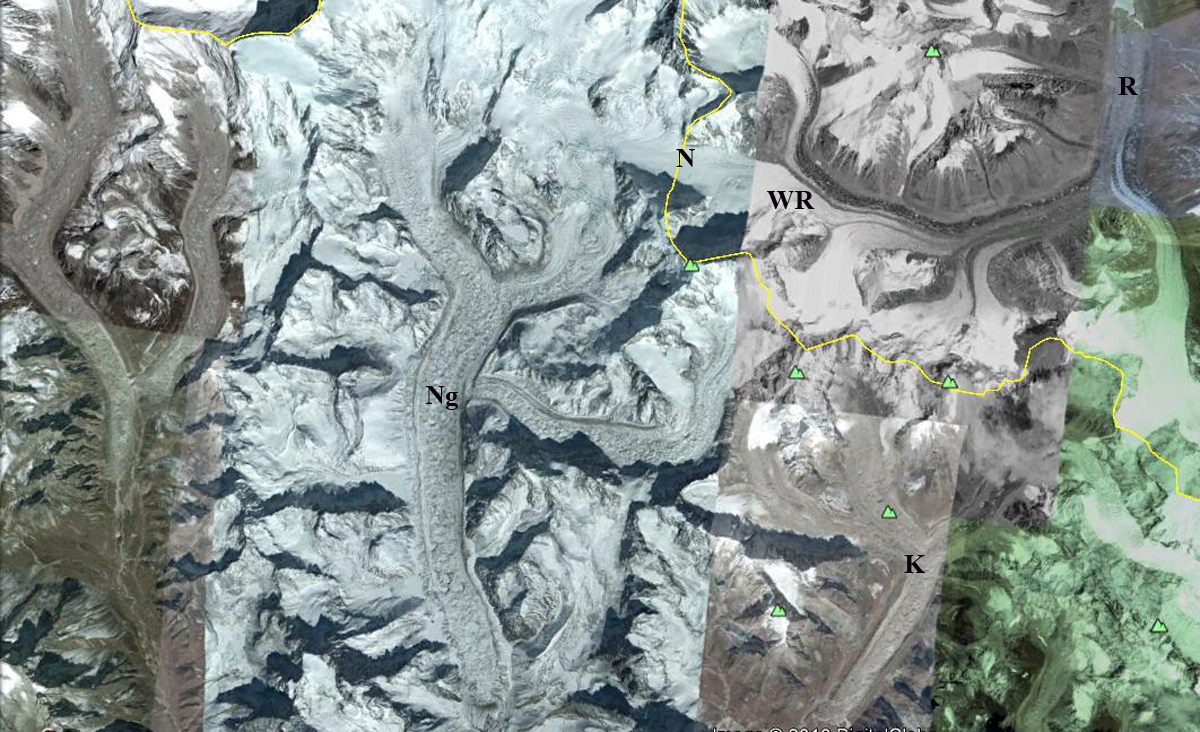
Gangotri Glacier and its key tributaries, with the red line being the outline of the glacier from GLIMS.

bhagirathi-150411

Hydropower in the Bhagirathi River watershed

Samudra Tapu Glacier, India Accelerated Retreat 1998-2016

samudra-tpa-compare

Landsat Comparison from 1998 and 2016 of Samudra Tapu Glacier, India.  Red arrow is the 1998 terminus, yellow arrow the 2016 terminus, green arrow a subsidiary glacier tongue, red line and dots the snowline and pink arrow an area indicating a water level decline in the lake. 

Samudra Tapu Glacier is one of the largest in the Chenab Basin, India. Maanya et al (2016) indicate the glacier terminates at 4150 m and is 16 km long and has an area of 62.5 square kilometers. In a glacier inventory in the basin by Kulkarni et al (2007) the 466 glaciers in the basin were observed to have lost 21% of their total area from 1962 to 2001. This study coordinated by the Space Applications Centre of the Indian Space Research Organization, has combined field observations of the glacier with remote sensing to observe the changes in area and length of the glaciers. The Chenab River also provides 690 MW of hydropower at the Salal Hydroelectric Project

In this post we use 1998, 2002 and 2016 Landsat imagery to examine the terminus of this glacier.  The terminus in 1998 is in an expanding proglacial lake and the snowline is at 5200 m.  In 2002 the glacier has retreated a short distance since 1998 and the snowline is at 5300 m.  Note that the smaller glacier tongue at the green arrow is disappearing. An October 2016 image indicates a further lake expansion and a glacier retreat of 600 m since 1998.  The lake level has also fallen as evident by the expansion of peninsula areas in the lake, pink arrow. A Sentinel 2 image from November 11, 2016 indicates the snowline is higher than in October or during the other years observed at 5400 m. The lower glacier is heavily debris covered, has a low slope and is essentially stagnant in its lowest 1 km, note image below from Anil Kulkarni. These factors will lead to continued retreat. There are some remarkably long supraglacial streams, the longest is 3.5 km long, that further illustrate the slow velocity of the lower glacier.  This is in a region where ice thickness is 100-200 m, see image below  Maanya et al (2016). Neither glacier is at the end of the melt season.   The glacier at the green arrow has retreated well upvalley from the green arrow.  This glacier is not calving into a lake and is retreating faster than Samudra Tapu.  This suggests that the debris cover is reducing melting more than the lake is enhancing melting. In November 2016 the snowline is at 5400 m.  An ELA of 5300+ meters leaves an accumulation area insufficient to maintain the current glacier size. In 1970 the ELA was at 4900 meters Kulkarni et al (2007) .  The retreat of Samudra Tapu is noted by Kulkarni (2006) as 20 meters/year during the 1962-2000 period. From 1998 to 2016 the glacier retreated nearly 600 m, closer to 30 meters/year. The retreat of this glacier is less than that of other large glaciers nearby Sara Umaga and Gangotri, but similar to Durung Drung Glacier.

samudra-tupa-sentinel-11-11-16

Sentinel 2 image from 11/11/16.  Red arrow is the 1998 terminus, yellow arrow the 2016 terminus, red dots the snowline.

sumadra-tupa-2002

Landsat image from 2002.  Red arrow is the 1998 terminus, yellow arrow the 2016 terminus, green arrow a subsidiary glacier tongue, red  dots the snowline.

sumadra-tupa-kulkarni-300x224

Image of the debris covered stagnant terminus of Samudra Tapu from Anil Kulkarni taken in 2006

samudra-tupa-supraglacial


samudra-tupa-depth

The above figure is from Maanya et al (2016).

Thulagi Glacier, Nepal Retreat and GLOF Potential


thulagi-compare

Thulagi Glacier change in Landsat images from 1991 and 2016.  Red arrow is 1991 terminus, yellow arrow 2016 terminus and purple arrow increasingly exposed bedrock rib amidst icefall.

Written With Prajjwal Panday: @prajjwalpanday

Thulagi Glacier terminates in a lake referred to both as Thulagi and Dona Lake. ICIMOD (2011) has identified this as a potential threat for a glacier lake outburst flood (GLOF) and has conducted extensive fieldwork there.  Thulagi Lake is southwest of Mt..Manaslu in western Nepal at an altitude of 4,044 masl. Here we report on the identified threat and use Landsat imagery to identify changes in the glacier. Thulagi Lake has attracted much attention because two hydropower projects have been developed downstream on the Marsyangdi river basin, Marsyangdi Hydropower Project (69MW) and the Middle Marsyangdi Hydropower Project (70MW). Thulagi Lake began to form about 50 years ago and ICIMOD present field investigations showed that from 1995 to 2009, the length of Thulagi Lake had increased from 1.97 to 2.54 km, due to retreat and the lake area increased from 0.76 to 0.94 sq.km. ICIMOD (2011) did a bathymetric survey of Thulagi Lake using an inflatable boat. The volume was calculated to be 35.3 million cu.m in 2009 an increase from 31.75 million cu.m in 1995. The small increase despite significant area increase was because of a surface elevation lowering rate from 2003-2009  of 0.3 to 0.5 m/yr. They found the moraine walls were sinking, but more slowly at a rate of about 0.1 m/yr:  The glacier experienced substantial retreat of 1.65 km from 1958 to 1995.

From 1991 to 2016 the glacier has retreated 750 m a rate of 30 m/year.  The debris cover extends from the terminus 4.25 km upglacier  to 4500 m.  The low slope indicates the lake will continue to expand and the rate retreat should remain high. The bedrock rib is in the icefall that extends from 5600 m to 4600 m, purple arrow. The rock rib at 5000 m in the midst of the icefall is more exposed in Landsat images from 2012 to present than from 1988-2001.  This suggests some thinning.  All images indicate snowcover is persistent above 5800 m. The glacier terminus continues to calve into the lake as seen in the 2012 Google Earth Image, the 40 m high ice front calves only small icebergs that ICIMOD did not deem sufficiently large to trigger a GLOF event by the surge waves. They also noted that temporary blockage of the lake outlet by river ice, snow barriers, or lake ice debris, appears unlike.

Khanal et al (2015) examined the total value at risk under the modeled GLOF scenario of US $406.73 million for Thulagi. The estimated maximum flow was 4736 m3 /second for Thulagi. The majority of this potential damage was to the two hydropower projects.  They noted 125 buildings and  100 acres of irrigated land at risk. A group of Nepali and US scientists carried out stability assessment of Thulagi Lake and its moraine after the April 2015 7.8 magnitude earthquake (USAID, 2015). They noted that the main moraine complex at the end of the lake is relatively stable (black arrow), while the end moraine is less stable (purple arrow). The earthquake caused some slumping of the outlet at the terminal moraine and some deterioration of this moraine. Overall the hazard due to the declining water level would offset some or all of this moraine deterioration in terms of overall risk of a GLOF. Although local people are aware of the deteriorating nature of the terminal moraine at Thulagi, community discussions revealed less concern regarding the possibility of an outburst flood (USAID 2015). However, there is a demand for risk reduction activities such as installation of early warning systems, lowering of lake levels, and development of community-based disaster response plans. There is a general consensus for a science-base community driven approach to address and find solutions for these types of lakes where communities and stakeholders participate starting from research to action.

The retreat of Thulagi Glacier is similar but less rapid than many Himalayan glaciers terminating in lakes; Thong Wuk, West Barun, Lumding and Lhonak

middle-marsyangdi

Middle Marsyangdi Hydropower Station and reservoir in Google Earth

marsyandi

Marsyangdi Hydropower Station and reservoir in Google Earth

thulagi-outlet-copy

Thulagi Lake outlet.  Black arrow points to main moraine complex.  Purple arrow to the less stable terminal moraine.

thulagi-ge

Thulagi Lake in 2012 Google Earth image.  Yellow arrow is recently calved ice and purple arrow indicates bedrock within icefall.

West Hongu Glacier Retreat-Ablation Extending into January, Nepal

hongo compare

Landsat comparison of West Hongu Glacier snowline, purple dots from October 2015 to January 2016. The red arrow indicates the 1993 active terminus location and the yellow arrow the 2015 active terminus location. 

West Hongu Glacier is a small glacier in the Dudh Khosi Basin of Nepal. The glacier drains the east side of Ama Dablam Peak. Shea et al (2015) noted that glaciers in the Dudh Khosi Basin of Nepal lost 16% of total volume and 20% of area from 1961-2007. Shea et al (2015), in an ICIMOD project, modeled future changes in glaciers with various climate scenarios, finding a minimum projected volume change by 2050 of −26 % and maximum of −70 %. This glacier is a short distance from Mera Glacier where mass balance is measured.  Both are summer accumulation type glaciers with 80% of annual precipitation occurring during the summer monsoon season. Salerno et al (2015)  found that the main and most significant increase in temperature is concentrated outside of the monsoon period, leading to more ablation favoured during winter and spring months, and year around close to the glacier terminus. The lake at the end of the glacier is unnamed and not listed as one of 20 lakes recorded as potentially unstable and warranting further investigation in Nepal (Ives et al., 2010). ICIMOD has continued to inventory and assess the hazards from glacier lakes and their capacity to induce outburst floods.  ICIMOD notes the area of the lake is 0.366 square kilometers.

Here we examine the snowline from fall into winter in 2015/16. Above is the comparison indicating the rise of the snowline from October into January. This has been a common occurrence in recent years, indicating that ablation though limited, continues in the post-monsoon into the mid-winter period. The snowline rises from 5550-5600 m in October to 5650-5700 m in January. Besides ongoing ablation into January, the high snowline illustrates the lack of significant accumulation at any elevation on the glacier in the post Monsoon period extending into January. The snowline remained high on Jan.20, 2016, but the image has considerable cloud cover. This tendency has been noted at Nup La-West Rongbuk Glacier, on the Nepal-China border, Chutanjima Glacier, China and Lhonak Glacier, Sikkim.

Below the active ice terminus change from 1993-2013 is noted.  The active ice ended on the shore of the lake in 1993, red arrow.  By 2013 the active ice has retreated 500 m from the lake, yellow arrow. There is still debris covered stagnant ice in this zone. The inactive ice is dissected by significant stream channels that cannot develop in an area of active ice. Some of the stream channels have cut to the base of the glacier.

hongu terminus

Comparison of active terminus location from 1993-2013 in Landsat images. The red arrow indicates the 1993 active terminus location and the yellow arrow the 2015 active terminus location.hongu glaceri terminus 2013

Terminus of West Hongu Glacier inn 2013. Yellow arrows indicate the stream channels cutting through the debris covered inactive ice.Map below indicates glacier ending in the lake.

west hongu map

Bailang Glacier and Angge Glacier Retreat, China 1995-2015

bailang compare

Comparison of 1995 and 2015 Landsat image illustrating 1995 (red arrows) and 2015 terminus locations (yellow arrows) of Bailang Glacier (B) and Angge Glacier (A).  Purple arrows indicate areas upglacier of expanding bedrock due to glacier thinning. Head of Chubda Glacier (C), Bhutan indicated. 

Bailang Glacier and Angge Glacier, China are adjacent to the Chubda Glacier, Bhutan.  Despite being in a different nation on a different side of the Himalaya, the behavior is the same. These are both summer accumulation type glaciers that end in proglacial lakes.  Both lakes are impounded by broad moraines that show no sign of instability for a potential glacier lake outburst flood. The number of glacier lakes in the adjacent Pumqu Basin to the west has increased from 199 to 254 since the 1970’s with less than 10% deemed dangerous  (Che et al, 2014) Here we compare Landsat images from 1995 and 2015 to identify their response to climate change.   The second Chinese Glacier inventory (Wei et al. 2014) indicated a 21% loss in glacier area in this region from 1970 to 2009.

Bailang Glacier in 1995 terminated in a proglacial lake that was 2.1 km long at an elevation of ~5170 m, red arrow. Angge Glacier terminated in a lake that was 1 km long at an elevation of ~5020 m.  By 2001 both glaciers had experienced minor retreat of less than 250 m.  By 2014 both lakes had expanded considerably due to retreat, no significant change in water level had occurred. By 2015 Bailang Glacier had retreated  800-900 m and the lake was now 3 km long.  A key tributary on the west side near the yellow arrow had also detached. There is no significant slope change in the lower 1 km of the glacier indicating retreat should continue enhanced by melting in and calving in the proglacial lake.  For Angge Glacier retreat from 1995 to 2015 was 700 to 800 m, with the glacier retreating to a westward bend in the lake basin.  The glacier has an icefall just above the current terminus suggesting the lake basin will soon end, which should slow retreat. The pattern of retreat and lake expansion is quite common as is evidence by Gelhaipuco, Thong Wuk and Longbashaba Glacier.

bailang glacier 2001

2001 Landsat image illustrating 1995 (red arrows) and 2015 terminus locations (yellow arrows) of Bailang Glacier (B) and Angge Glacier (A).  Head of Chubda Glacier (C), Bhutan indicated. 

bailang glacier 2014

2014 Landsat image illustrating 1995 (red arrows) and 2015 terminus locations (yellow arrows) of Bailang Glacier (B) and Angge Glacier (A).  Head of Chubda Glacier (C), Bhutan indicated. 


Chubda Glacier Retreat, Bhutan 1995-2015

chubda glacier compare

Chubda Glacier comparison in 1995 and 2015 images.  Red arrow indicates 1995 terminus location and yellow arrow is 2015 terminus location.  Pink arrows indicate areas upglacier of expanding bedrock. Green arrow indicates moraine areas amidst the lake.  The orange arrow indicates a secondary glacier.

Chubda Glacier, Bhutan drains south from Chura Kang on the Bhutan/China border.  The glacier terminates in Chubda Tsho, a glacier moraine dammed lake, Komori (2011) notes that the moraine is still stable and the lake is shallow near the moraine, suggesting it is not a threat for a glacier lake outburst flood. Mool et al, (2001) indicate the glacier was 3.4 km long and 0.3 km wide in the late 1990’s. Jain et al., (2015) noted that in the last decade the expansion rate of this lake has doubled. The glacier feeds the Chamkhar Chu basin which has a proposed 670 MW hydropower project under consideration. Here we examine changes in the Chubda Glacier from 1995 to 2015 with Landsat imagery.

In 1995 Chubda Glacier terminated at the red arrow and there was considerable ice cored moraine remaining in the southern portion of Chubda Tsho, green arrow.  The glacier is 700 m wide at Point E and has limited exposed bedrock areas just above the snowline above 2100 m, pink arrows.  A pair of secondary glacier have a joint terminus at the orange arrow In 2001 there are only minor changes from 1995.  In 2014 the snowline is at 2100 m, bedrock areas have expanded at pink arrows, and the amount of lake area at the southern end has expanded as ice cored moraine has melted out. In 2015 the glacier terminus has retreated 600 m since 1995, the lake area has expanded by ~2 square kilometers.  In 2015 the southern end of Chubda Tsho remains shallow and the wide moraine dam stable. The snowline is again at 2100 m and the glacier is only 500 m wide at Point E.  This indicates a continued decline in glacier flow into the terminus zone, which will lead to continued retreat. The secondary glaciers have now separated significantly, orange arrow.  The retreat of this glacier is similar to that of other glaciers such as Lugge and Thorthomia Glacier and just across the range in China, Zhizhai Glacier and Gelhaipuco Glacier.

chubde ge

Google Earth image of Chubda Glacier. Blue arrows indicate flow, brown arrow indicates wide moraine dam, green arrow indicates shallow moraine areas. 

chubde galcier 2001

Chubda Glacier 2001 Landsat image.  Red arrow indicates 1995 terminus location and yellow arrow is 2015 terminus location.  Pink arrows indicate areas upglacier of expanding bedrock. Green arrow indicates moraine areas amidst the lake.  

chubde glacier 2014

Chubda Glacier Landsat image in 2014.  Red arrow indicates 1995 terminus location and yellow arrow is 2015 terminus location.  Pink arrows indicate areas upglacier of expanding bedrock. Green arrow indicates moraine areas amidst the lake.  


Goddess of Light (Kolahoi) Glacier Showing Mortality, Kashmir Retreat 1993-2015

kolahoi compare

Kolahoi Glacier comparison in Landsat images from 1993 to 2014.  Kolahoi Glacier is the northern glacier, East Kolahoi Glacier the other noted glacier.  Red arrows indicate 1993 terminus locations, and yellow arrows the 2014 terminus locations. 

The Kolahoi Glacier in Kashmir is known as the—”goddess of light”—Gwash Brani  (NatGeo, 2010). The glacier descends the north side of the mountain with two tongues of the glacier merging above the terminus in 1993. The glacier drains into the Liddar River and then the Jhelum River system.  The Jhelum River has several large operating hydropower stations and several more under construction including the Karot Hydropower Project a 720 MW run of river project.  Jeelani et al (2012) observed that the Liddar Watershed derives 60% of its runoff from snowmelt and just 2% from glacier ice melt.  They further report that the Liddar watershed has 17 glaciers covering an area of 40 km2 in 2008. The climatic warming in the region has led to mass wasting of Kolshoi Glacier and retreat.  From 1970 to 1990 there was a cooling trend of about −0.02°C per year followed by the time period from 1991 to 2010 with the highest increasing trend of 0.07°C per year (Jeelani et al 2012) .  Tayal (2011) observed the detachment of the two glacier branches and a loss of 2-3.5 m of ice thickness due to ablation in the lower reach of the glacier.

jhelum_river_basin

Hydropower Projects in Jhelum Basin.

From 1993 to 2001 there is limited retreat of Kolahoi Glacier and East Kolahoi Glacier, though both glacier fronts become narrower.  By 2006 Kolahoi Glacier has retreated to near the base of a steeper slope.  The glacier remains heavily crevassed in the region above the icefall within 1 km of the terminus, Point A. By 2014 the glacier has retreated to the top of the steeper slope between two bedrock knobs at 3650 m, total retreat from 1993 to 2014 is 700 m.  Crevassing above the slope, at Point A, that used to be an icefall has become limited since 2006 and before.  The reduction in velocity indicates retreat will continue. The western tributary of the Kolahoi has developed a separate termini from the main glacier after 2001, single vertical red arrow.. The East Kolahoi Glacier has retreated 300 m.  The lower 300 m of Kolahoi Glacier is thin and relatively uncrevassed.  This indicates the retreat will continue.  This region has its highest precipitation from January through April and highest runoff in June and July.  Hence, the glacier is not a summer accumulation type like glaciers to the east in the Himalaya. The retreat is similar to that of Samudra Tupa Glacier and Durung Drung Glacier.

kolahoi ge 2014

Google Earth image from 2014 of Mount Kolahoi and its main glaciers flow directions indicated.

kolahoi 2001

2001 Landsat image of Kolahoi Glacier

koahoi 2015

2015 Landsat image of Kolahoi Glacier

kolahoi terminus compare

Google Earth image of the terminus area outlined in blue of Kolahoi Glacier in 2006 and 2014. 

kolahoi-fig-0006

Image of the terminus of Kolahoi Glacier in 2010 from Jellani et al (2012)


Where is the snow at Nup La, 5850 m, West Rongbuk Glacier?

nup la 1516

Landsat image from January 4, 2016 indicating the actual Nup La (N).  Purples dots is the snowline. Green arrows are expanding bedrock exposures and pink arrow a specific rock know amidst the glacier.

Nup La at 5850 m is on the Nepal-China border and is the divide between the West Rongbuk Glacier and the Ngozumpa Glacier.  The pass should be part of the accumulation zone of both glaciers.  In recent years including currently this has not been the case, this past Christmas was not a white one at the pass.  Our attention is often focused on the more easily viewed terminus of a glacier, and both of these glaciers are retreating. The changes higher on the glacier can have more far reaching implications. Bolch et al (2011) observed strong thinning in the accumulation zone on nearby Khumbu Glacier, though less than the ablation zone . This can only happen with reduced retained snowpack particularly in winter.  This has occurred with increasing air temperatures since the 1980’s. Mean annual air temperatures have increased by 0.62 °C per decade over the last 49 years; the greatest warming trend is observed in winter, the smallest in summer (Yang et al., 2011). The glaciers in the area are summer accumulation type glaciers with 70% of the annual precipitation occurring during the summer monsoon. There is little precipitation early in the winter season (November-January). The limited snowpack with warmer winter temperatures have led to high snowlines during the first few months of the winter season in recent years. Here we examine Landsat images from 1992 to 2016 to observe changes in the snowline during the early winter period.

In January of 2016 the snowline is at 6100 m, which is well above Nup La and the divide between West Rongbuk and Ngozumpa Glacier.  The green arrows indicate three areas of expanding bedrock exposure occurring over the last 15 years.  This indicates thinning in this region of 5700-6000 m, which should typically be the accumulation zone.  In December 2015 three works prior to the 2016 image the situation is the same.  In November 2014 the snowline is lower at 5750 m.  In 1992 the snowline is at 5600 m, and the bedrock areas at the green arrows are reduced from above.  In November 2000 the snowline is at 5450 m and in November 2001 it is at 5600 m.  In all images prior to 2012 the snowline does not reach the region around Nup La above 5700 m during the early winter period.  In recent years the snowline has remained high, above 5700 m, significantly into the winter season almost every year, and in 2015/16 remains high three months into the winter season. This is an indication of an extended period after the summer monsoon, in which not only is snow not accumulating, but ablation can occur mostly via sublimation at elevations of Nup La. The thinning resulting has caused the expansion of bedrock areas at the green arrows and at the pink arrow.

nup la region
Google Earth image of the region indicating Nup La (N), Wests Rongbuk Glacier (WR), Rongbuk Glacier (R), Ngozumpa Glacier (Ng) and Khumbu Glacier on Mount Everest (K)

nup la dec2015
December 2015 Landsat image indicating the actual Npu La (N).  Purples dots is the snowline. Green arrows are expanding bedrock exposures and pink arrow a specific rock know amidst the glacier.

nup la 11202014
November 2014 Landsat image indicating the actual Npu La (N).  Purples dots is the snowline. Green arrows are expanding bedrock exposures and pink arrow a specific rock know amidst the glacier.

nup la oct92
October 1992 Landsat image indicating the actual Npu La (N).  Purples dots is the snowline. Green arrows are expanding bedrock exposures and pink arrow a specific rock know amidst the glacier.

nup la oct2001
November 2000 Landsat image indicating the actual Npu La (N).  Purples dots is the snowline. Green arrows are expanding bedrock exposures and pink arrow a specific rock know amidst the glacier.

nup la 10152000
November 2001 Landsat image indicating the actual Npu La (N).  Purples dots is the snowline. Green arrows are expanding bedrock exposures and pink arrow a specific rock know amidst the glacier.

nup la 2014
Google Earth image indicating flow paths at Nup La.


Kanchenjunga Glacier, Nepal Volume Losses

kanchenjunga compare
Figure 10-16. Kanchenjunga Glacier (K) from 1991 to 2015, green arrows indicate locations of enhanced supraglacial lakes since 1991. Purple arrow indicates areas of thinning at higher elevations in the region. Location 2 is the main junction area. 

Kanchenjunga Glacier is the main glacier draining west from Kanchenjunga Peak, also listed on maps as Kumbukarni. The glacier is similar to Zemu Glacier flowing east from the same mountain into Sikkim, in the heavy debris cover that dominates the glacier in the ablation zone extending from the terminus for 15 km and an altitude of 5600 m. Identifying the retreat is difficult due to the debris cover. Racoviteanu et al (2015) examined glaciers in this region using 1962 and 2000 imagery. They found area losses of 14% for debris covered glacier and 34% for clean glaciers. The debris covered glaciers terminus response is even more muted indicating why terminus change is an easy measure of glacier change but not always the best. For Kanchenjunga Glacier Racoviteanu et al (2015) indicate the glacier area declined by just 4-8% from 1962-2000.

What is apparent in the Landsat images at the green arrows is the increase from 1991 to 2015 of supraglacial lakes. Also features of thinning are evident in the mid reaches of the glacier, purple arrows, where tributaries have narrowed and detached from the main glacier. A closeup of the main glacier junction 12 km above the terminus indicates the number of large supraglacial lakes. These cannot form in a region where melting does not dominate over glacier motion. The Google Earth image from 2014 of the terminus area indicates a patchwork of moraine cored ice dotted with supraglacial lakes and dissected by the glacial outlet river in the lower 3 km of the glacier. This is clearly not an active portion of the glacier, it is thin not moving and does not fill even the valley floor. An overlay of images indicates the lack of motion. The heavy debris cover has slowed retreat and thinning, however, the lower glacier is poised for an increased rate of retreat with merging of supraglacial lakes, which will lead to further area losses. The Kanchenjunga Glacier is losing volume like all other 41 glaciers examined in detail and linked at the Himalayan Glacier Index page. 

kanchenjunga glacier jct

Google Earth image of the main glacier junction region (2) Supraglacial lakes in the area of at 5200 m. 


kanchenjunga glacier

Google Earth image of supraglacial lakes 2-5 km above the terminus and the region along the north margin of the glacier where the glacier is receding from the lateral moraine. 

kanchenjunga terminus

2014 Google Earth image of terminus reach.  Black arrows indicate ice cored moraine, blue arrow the lowest large supraglacial lake, 2.5 km above the terminus and red arrow the last remnant of ice.