


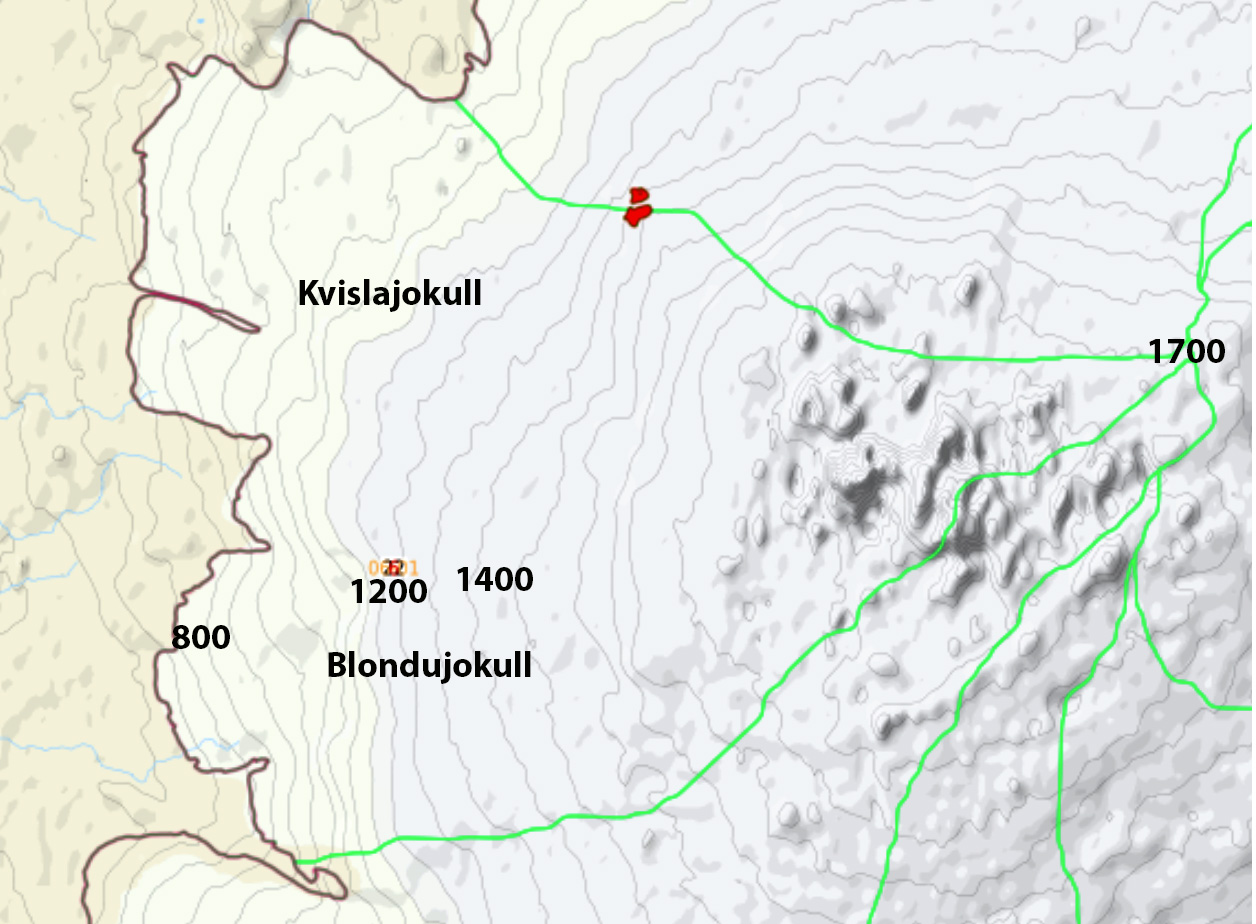
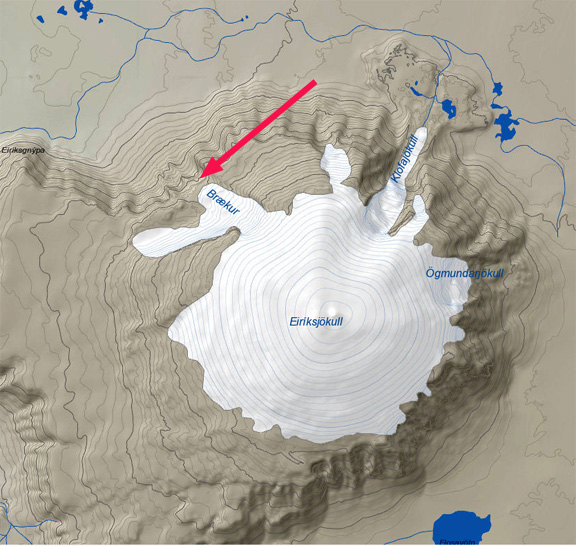
Hofsjokull East, Iceland is a small ice cap east of Vatnajokull with a summit elevation of 1100 m. In the last decade the snow line has often been above the ice cap. The ice cap had an area or 4.97 km2 in 2003 declining to 2.51 km2 in 2023 (Iceland Glacier Viewer). In 2024 all 10 glaciers in Iceland had significant mass loss (Pelto, 2025).
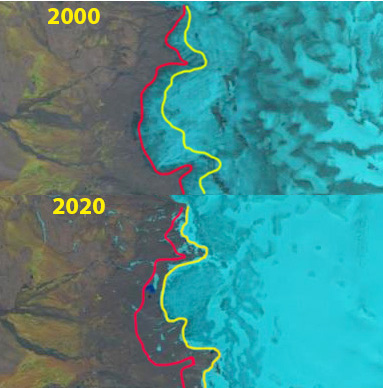
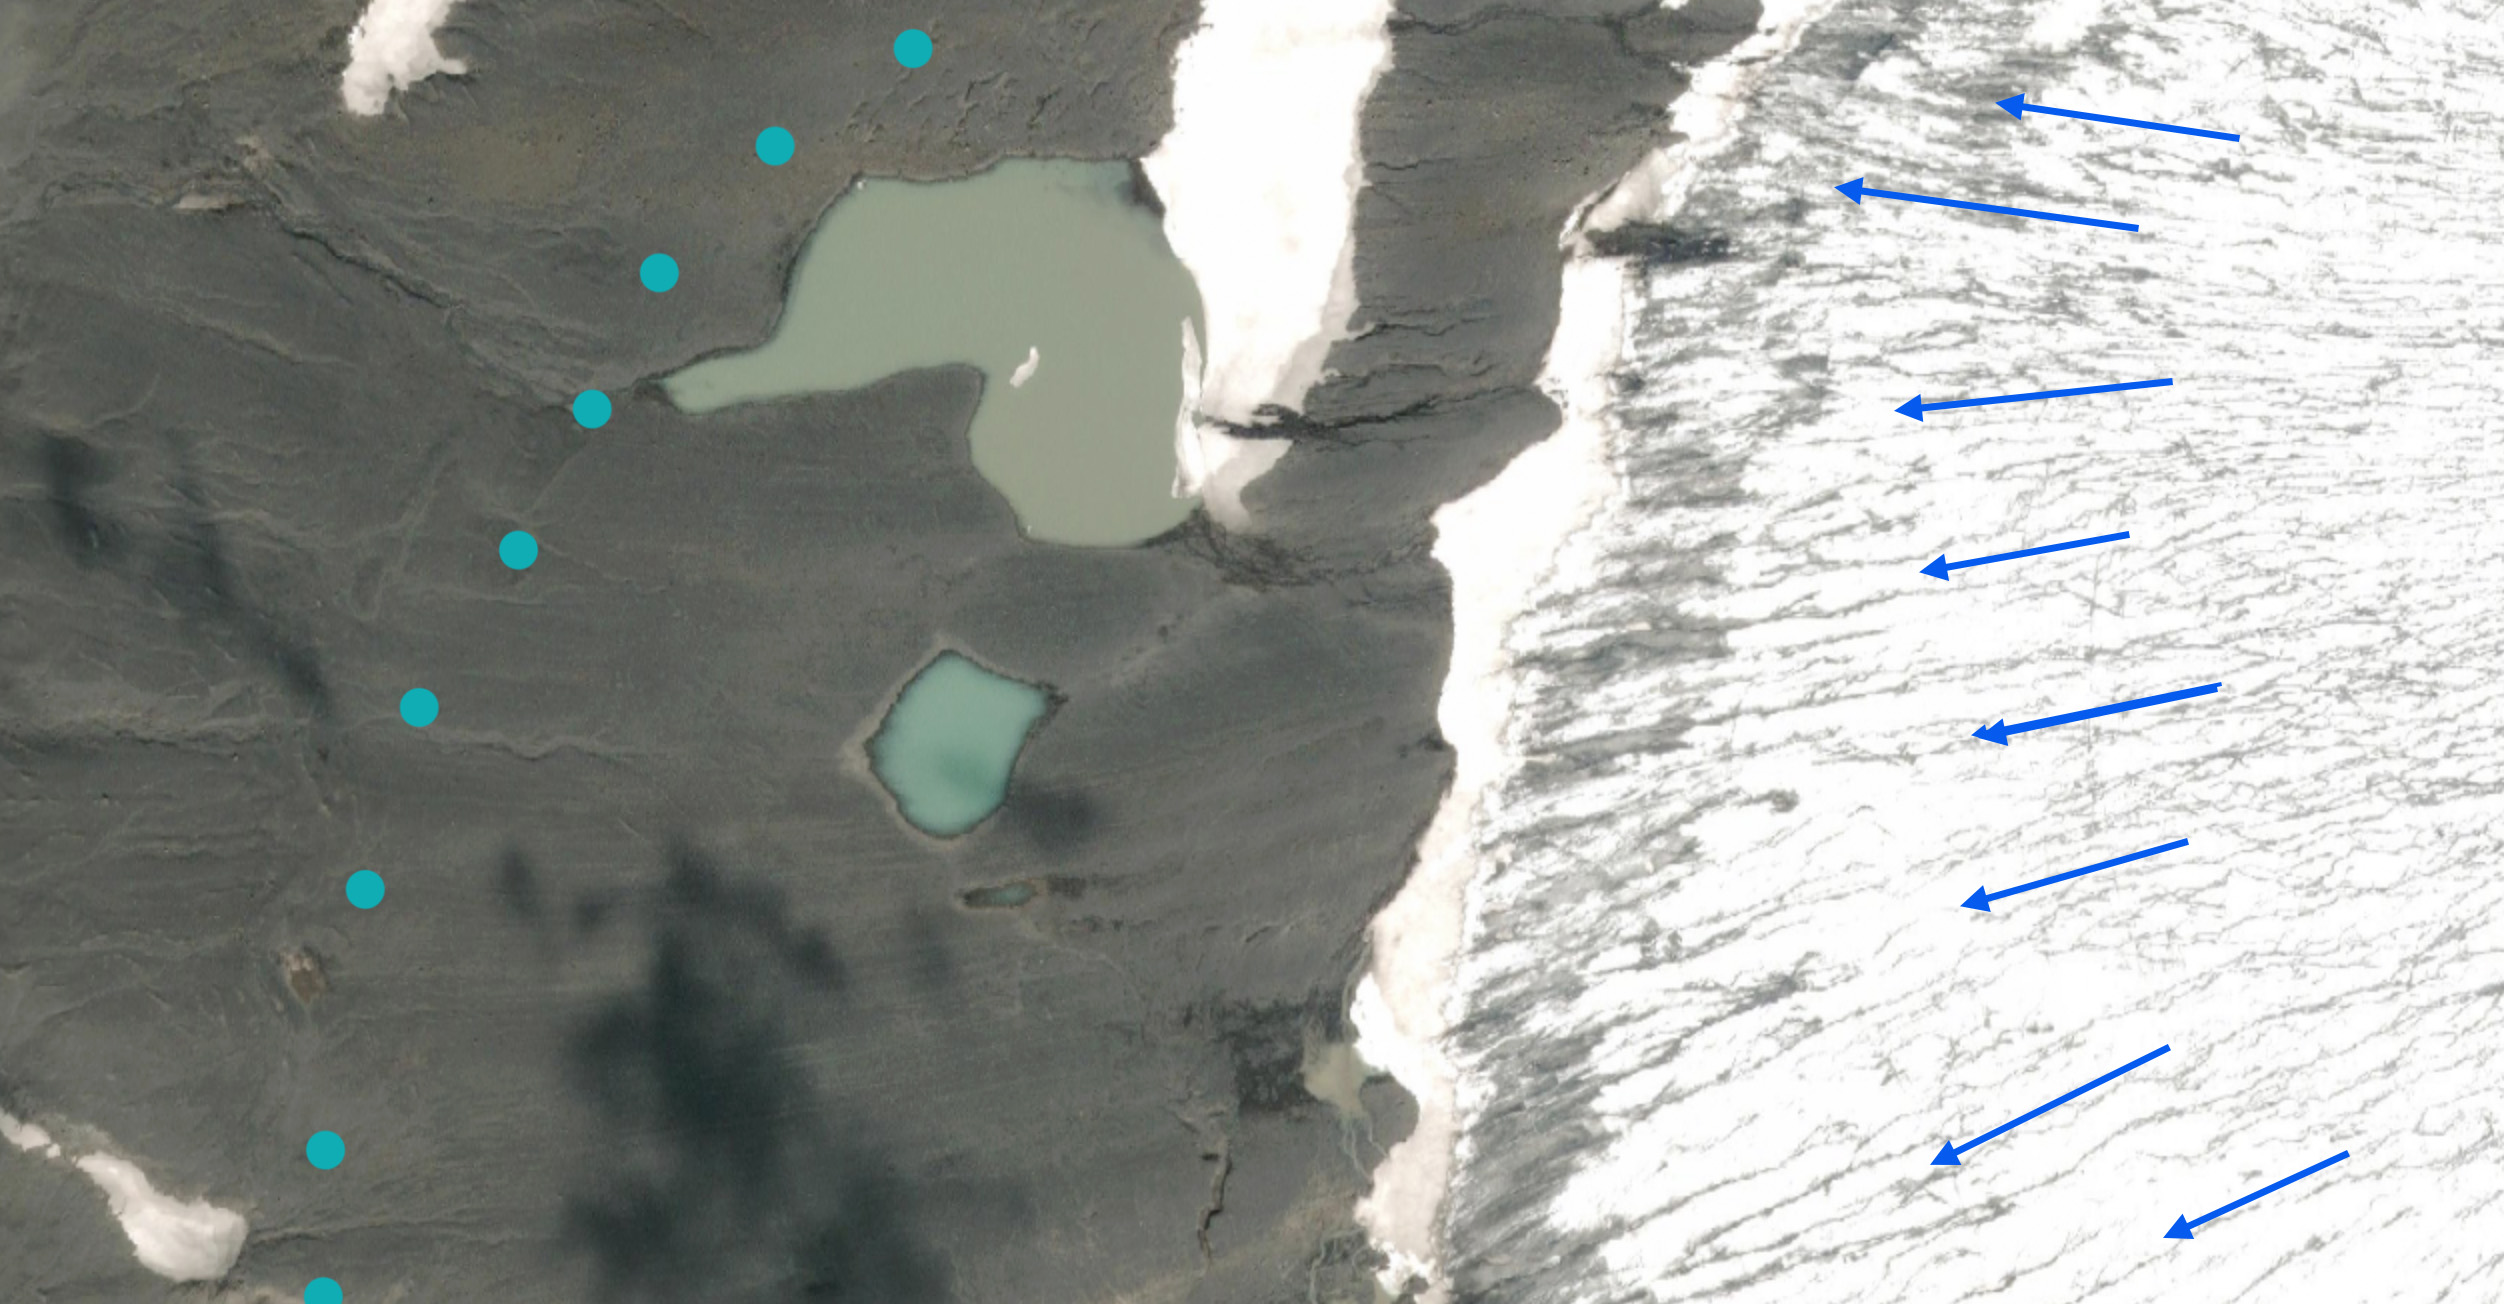
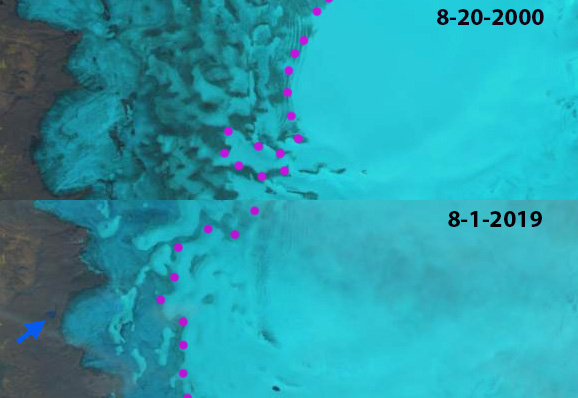
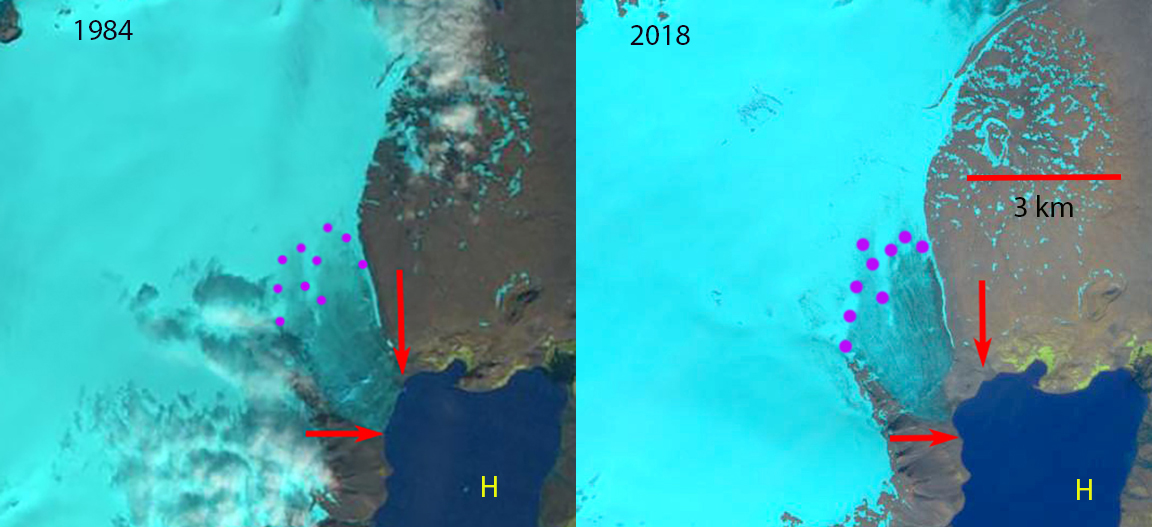
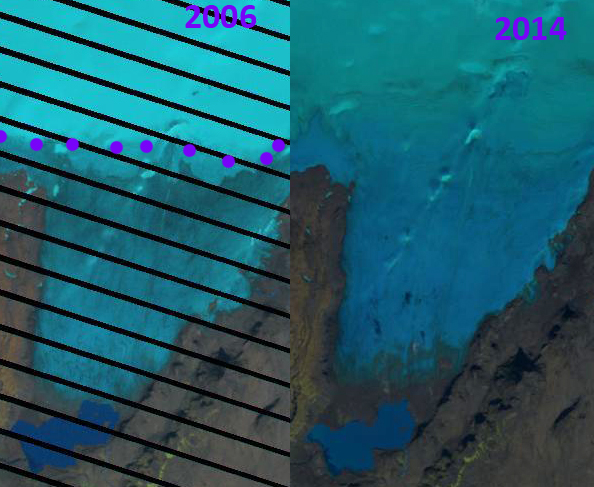
In August 2020 the ice cap has lost nearly all of its snow cover, this occurred again in 2023 and 2024. The result in 2025 when the ice cap again lost all its snowcover, is significant glacier surface melt and thinning. This leads to expansion of bedrock. At Point A there has been rapid expansion of the bedrock knob. At Point B and C new bedrock has been exposed and rapidly expanded. At Point D a bedrock rib at the edge of the ice cap has spread into the ice cap.
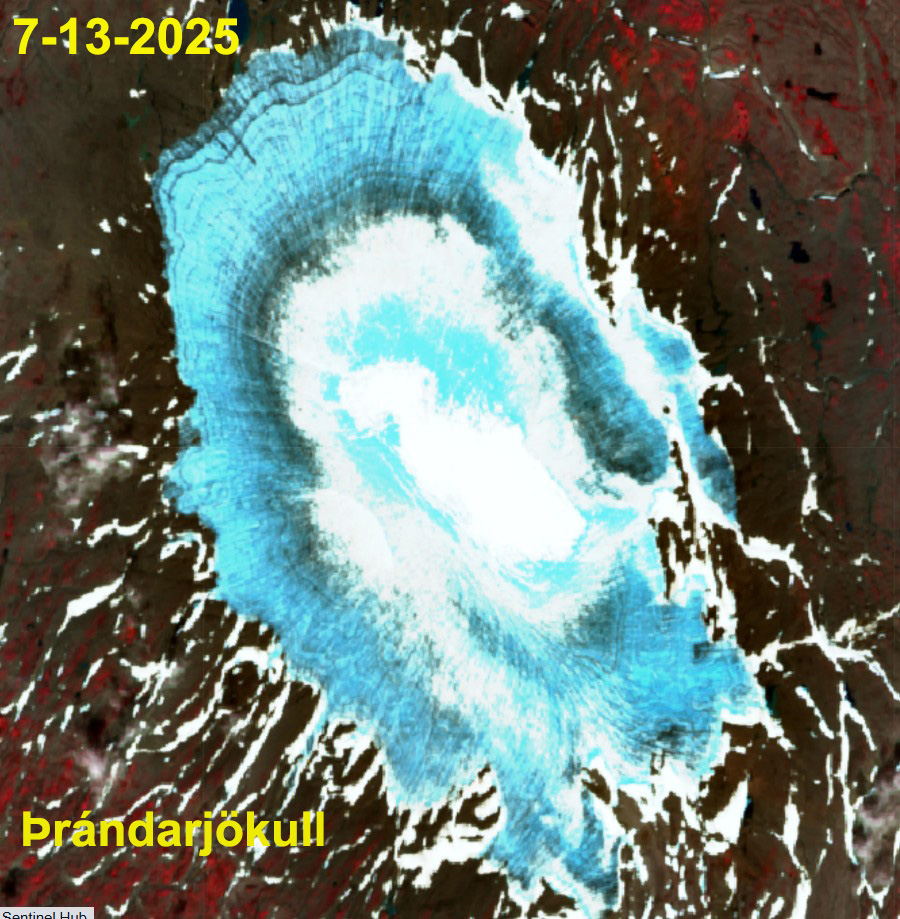
The lack of snow cover indicates the ice cap no longer has an accumulation zone and cannot survive. In 2025 the ice cap area is 2.10 km2 . Ice cap area has declined by ~60 % in the last 22 years. The story here is similar to that at the larger Prándarjökull 10 km to the northeast. The summer of 2025 in Iceland was exceptional beginning with a May heatwave, followed by a July heatwave. The May heat wave led to high snow lines as summer began on Vatnajokull.

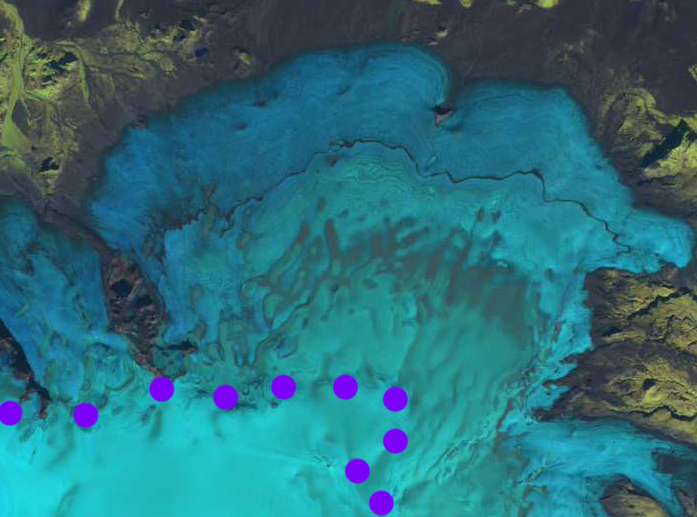
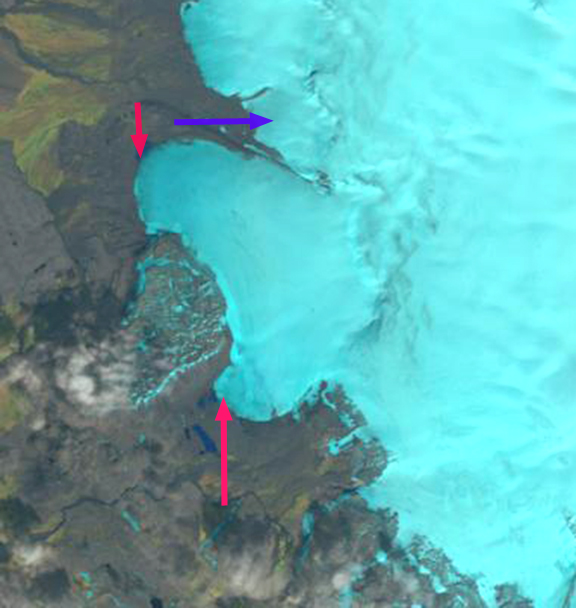
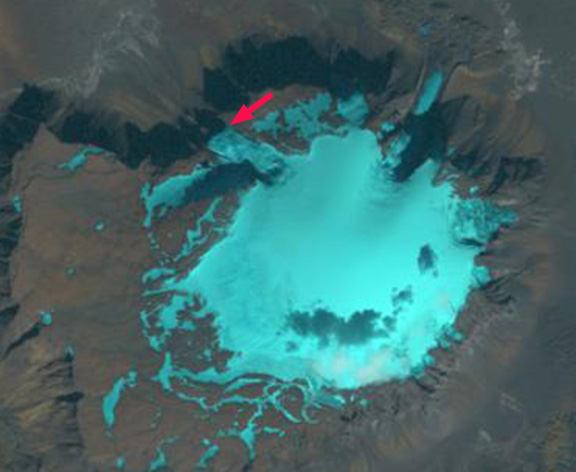
Hofsjokull East is nearly snow free on 8-14-2020 in this false color Sentinel image. Contrast the area of bedrock at Point A-D to the 2023 and 2025 images.

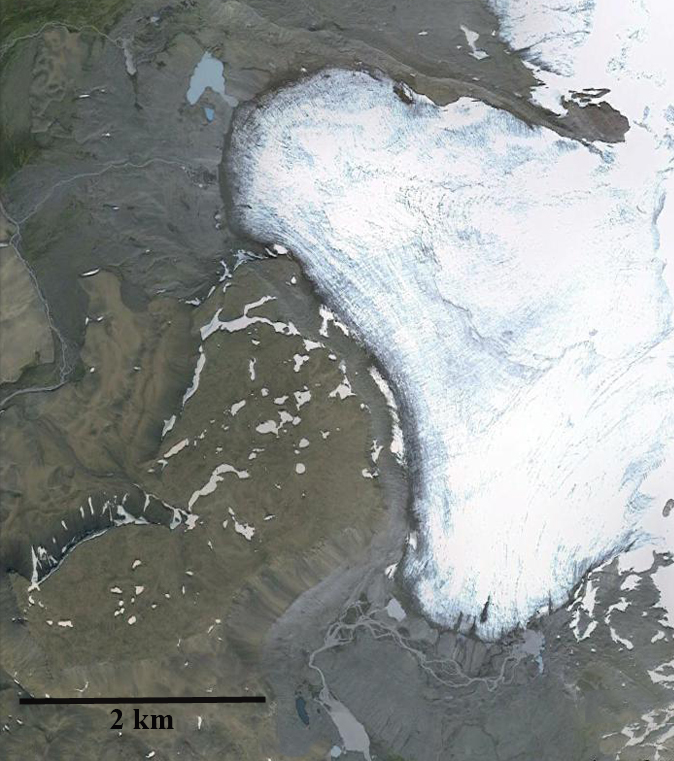
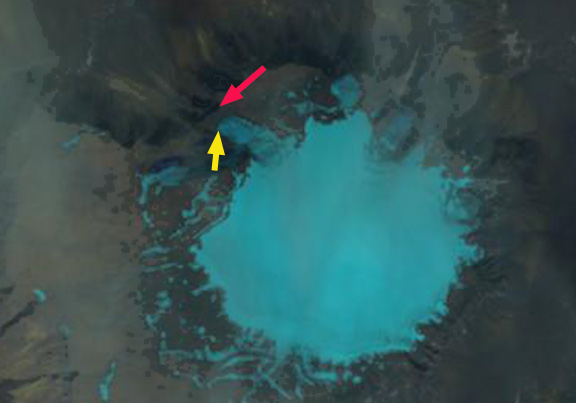
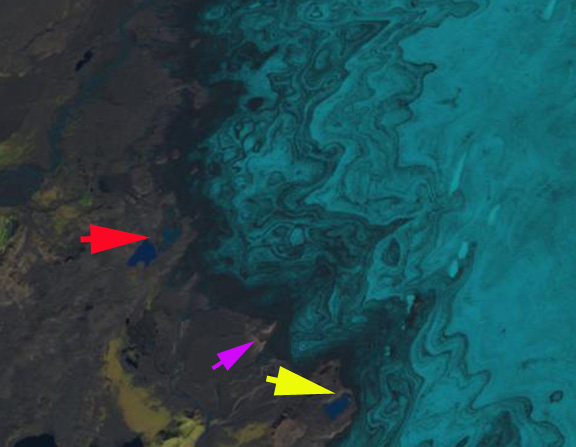
Hofsjokull East is nearly snow free on 9-3-2023 in this false color Sentinel image. Point B and C now have evident bedrock areas.


