Ongoing Detachment at Victoria Glaicer, New Zealand

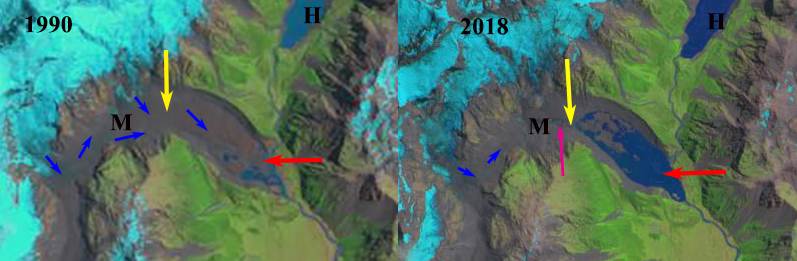
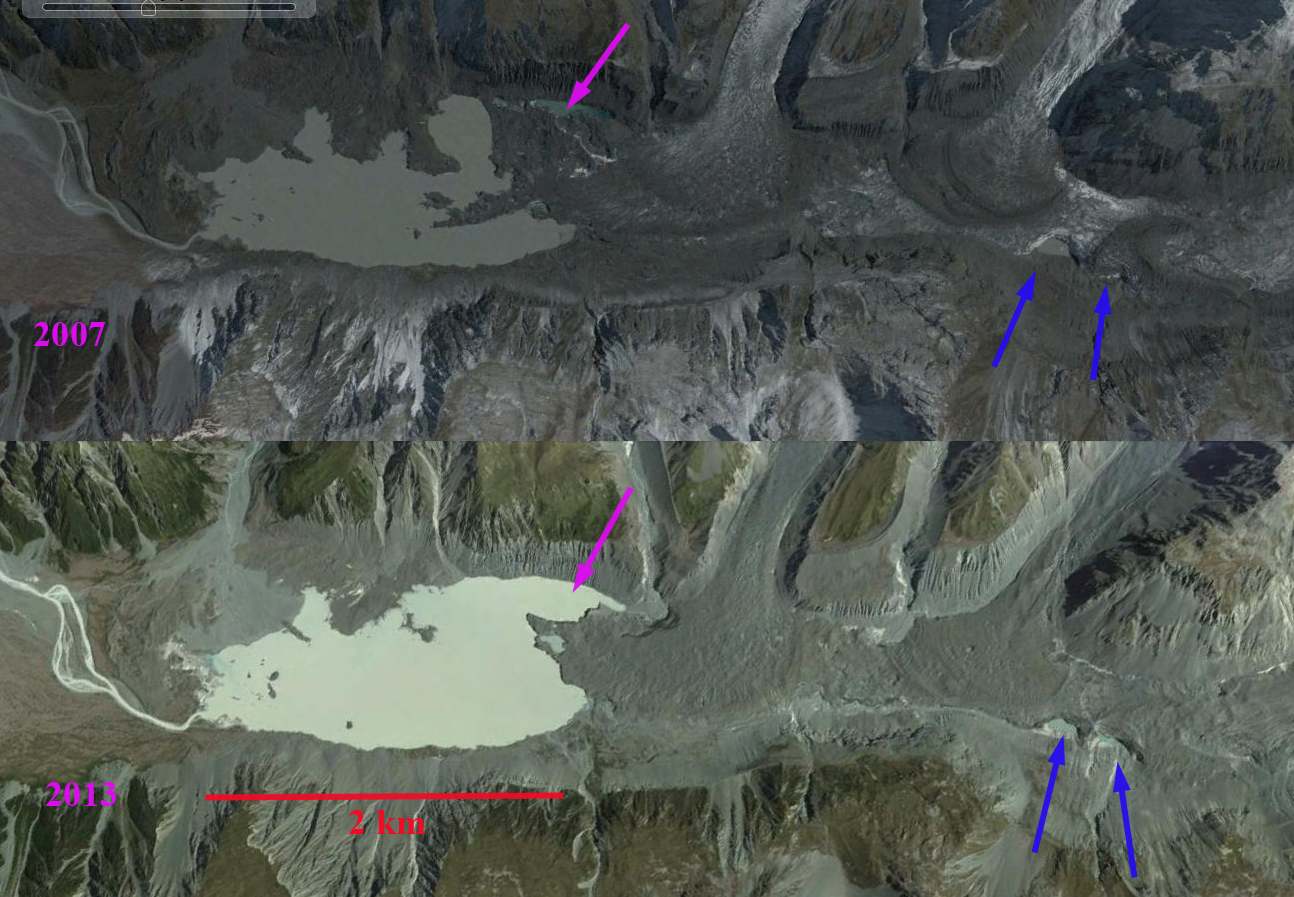
Victoria Glacier in Sentinel images from February 2017 and February 2022. Red arrow is 2002 terminus location, yellow arrow marks 2022 debris cover take over and beginning of stagnating ice region. Point C is lowest point of clean ice in 2017 and just above terminus in 2022. Point A, B and D are icefalls where detachment is underway.

Victoria Glacier in New Zealand’s Southern Alps is the westward draining valley glacier between Fox and Franz Josef Glacier. Victoria Glacier has limited terminus observations over the last 25 years indicating a stationary terminus position from 1998-20o1, retreat in 2005, advance in 2008 and 2009, stationary position 2010-2013 and retreat from 2014-2017 (WGMS, 2021). Here Landsat and Sentinel imagery are used to explore changes to this glacier from 2002-2022. Chinn and Chinn (2020) reported a 3.7 m/year rise in the mean New Zealand end of summer snowline on glaciers over the last 40 years, which is driving mass loss and retreat of glaciers across the range. Baumann et al (2020) provide an inventory of NZ glaciers noting that most of the glacier tongues below 1000 m are debris covered including several that are detached and a 21% decrease in area was noted for the 1978-2016.

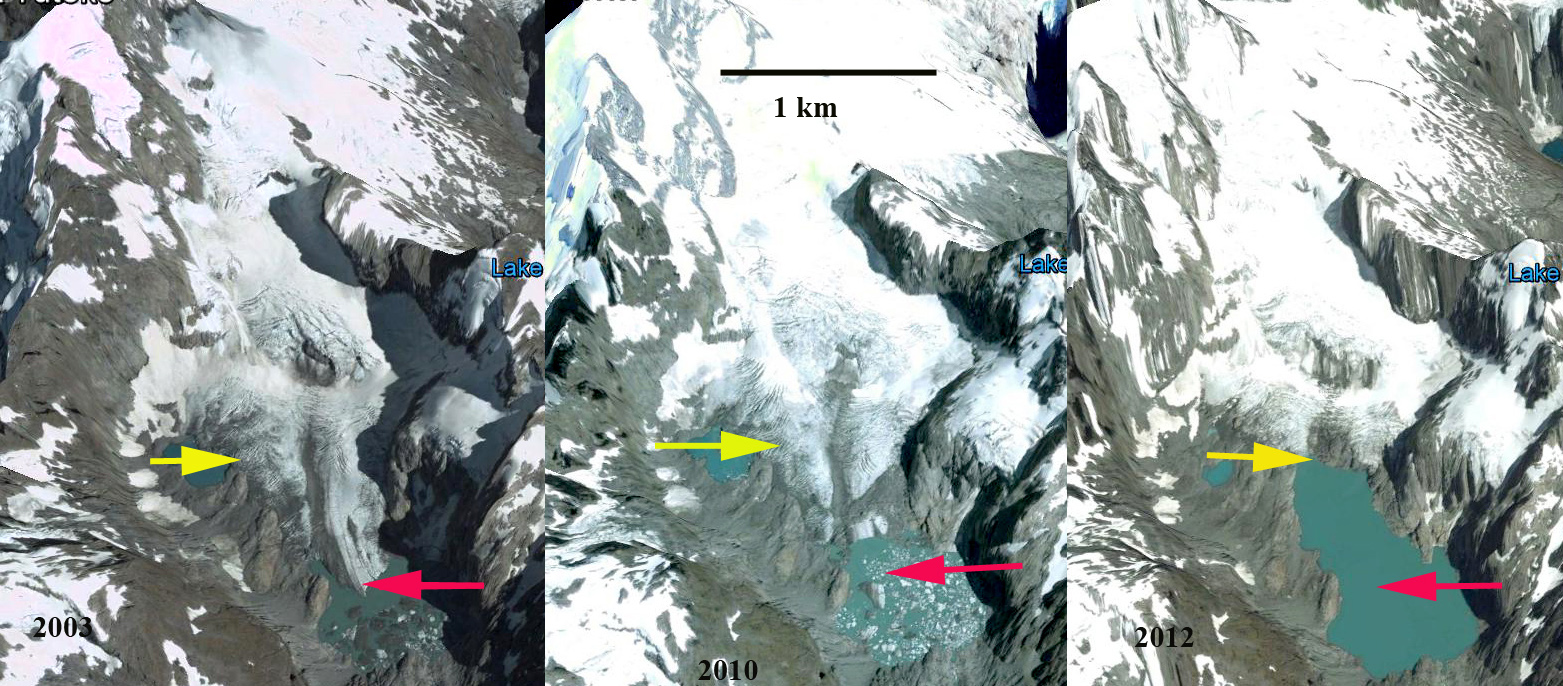
In 2002 the glacier extends 2.3 km downvalley from the base of the Icefall at Point A. The active ice front marking the terminus is at 1150 m and clean ice begins 300 m upglacier from the terminus. In 2017 following first a period of advance and retreat the terminus has retreated ~100 m since 2002, clean ice begins 400 m from the terminus, at Point C .The width of the clean ice area is reduced from 2002.  In 2017 there is active crevassing in the icefalls at Point and D extending to the valley trunk below.  At Point B there is a clean ice connection in 2017, but not active crevassing to the base of the icefall. From 2017-2022 rapid downwasting of the terminus tongue resulted in a 500 m retreat of the active ice front, which is near Point C. There is only small patch of clean ice in the last 1 km of the glacier.  Crevassing in the icefalls at Point B and D no longer extends all the way to the valley trunk of the glacier.  At the yellow arrow is both where debris cover dominates in 2022, but also marks the beginning of a deeply carved surface stream, indicating near stagnation of the glacier in this region. The recent high snowlines observed in the annual end of summer surveys  (NIWA, 2018) will lead to continued reduced flux of ice through the icefalls and detachment at Point B and D in the near future.

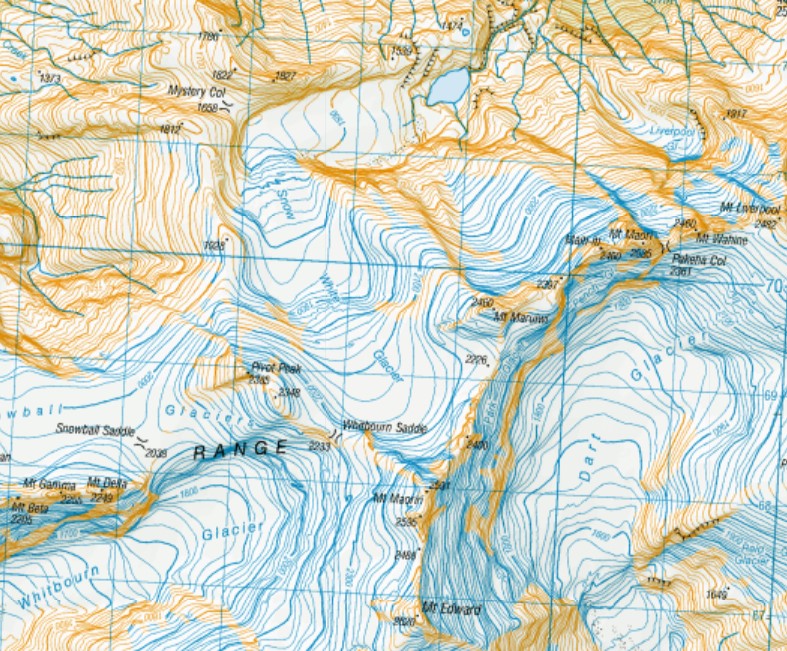
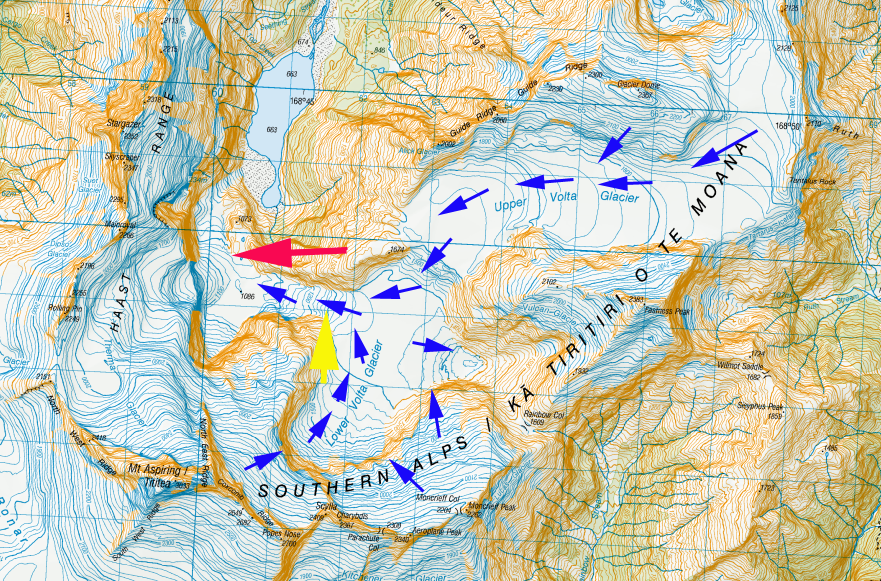
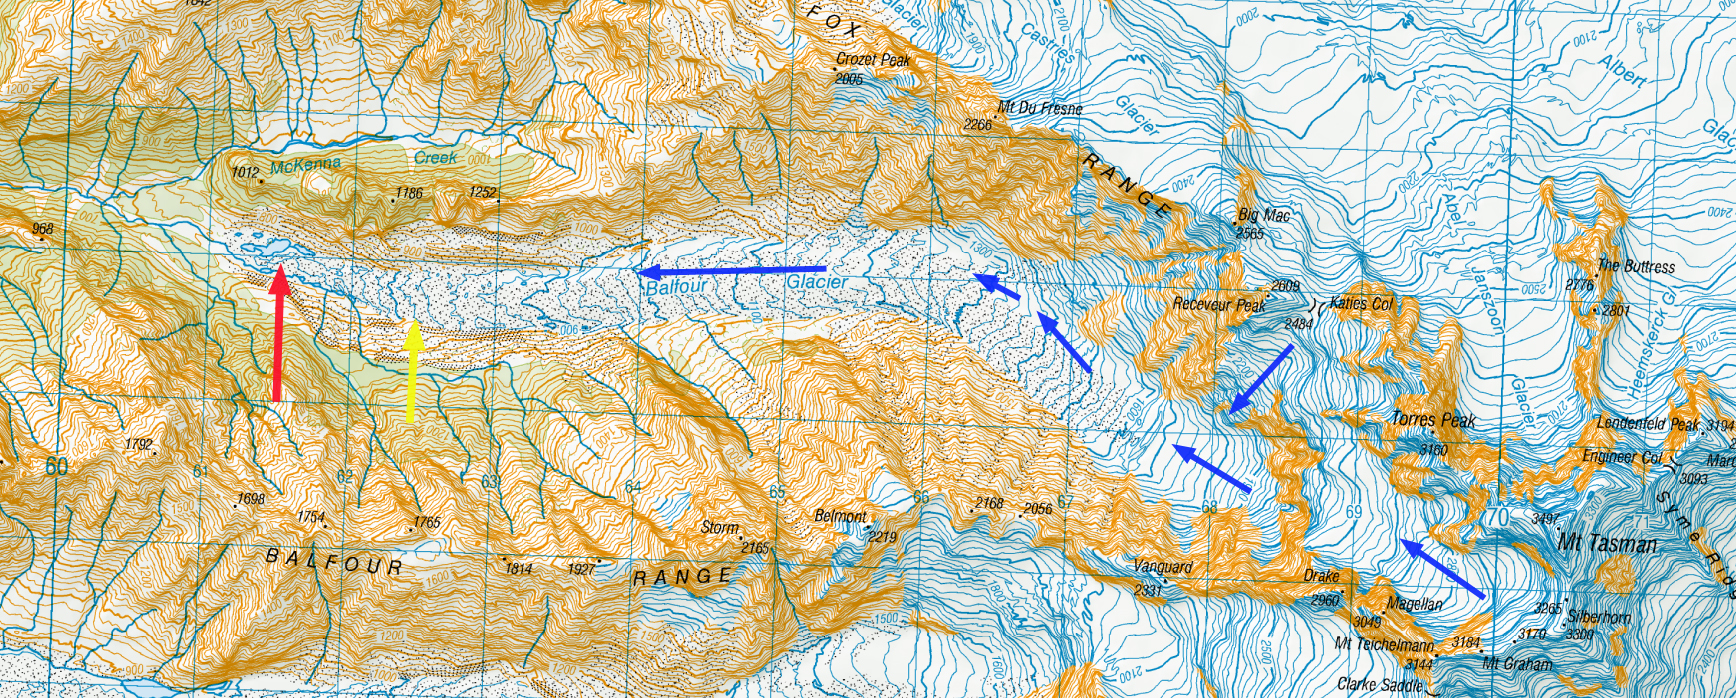
Victoria Glacier topographic map with flow arrows and specific elevations. 

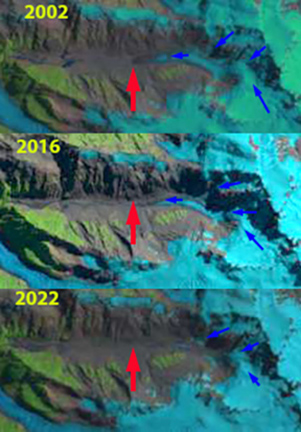
Victoria Glacier in 2002, 2016 and 2022 Landsat images.Red arrow marks 2002 terminus position, blue arrows indicate flow lines.

Bonar Glacier Retreat, New Zealand

Bonar Glacier in 1992 and 2021 Landsat image.  Red arrow is the 1992 reconstituted terminus location, yellow arrow the 2021 terminus location and purple dots the snowline.

Bonar Glacier is on the west flank of Mount Aspiring flowing north from Mount before turning sharply west and descending towards a lake and draining into the Waipara River. The NIWA glacier monitoring program noted that  30 per cent of New Zealand’s ice that was existed in the late 1970s has been lost in the past 40 years as snowlines have been rising. The retreat has been driven by a series of  increasingly warm summers (NIWA, 2019).  Bonar Glacier is one of the six largest west side glaciers in the NZ Alps  and has no significant debris cover (Baumman et al 2021). Here we examine Landsat imagery from 1992-2021 to identify changes.

In 1992 the glacier descends west down the steep slope to its terminus at 1150 m avlanching down the steep slope to a reconstituted glacier at the head of a 1 km long proglacial lake at ~550 m.  In 2001 there is no reconstituted glacier at the lake, the terminus is at ~1200 m in elevation. By 2020 the glacier terminus has receded to ~1250 m, the snowline is at 1900 m above the first icefall in early March. In 2021 the glacier has retreated 200 m, with its overall length being reduced by 3%  since 1992. The snowline in 2021 is again at the top of the 1900 m icefall.

The retreat is more limited than at either Volta Glacier  which is on the east side of Mount Aspiring, or at Snow White Glacier  to the southwest. The mean elevation of glaciers in New Zealand is 1950 m (Baumman et al 2021). The mean elevation of Bonar Glacier is 2075-2090 m, which has enabled the glacier to endure recent warming better.

Bonar Glacier in aerial image from 2020, with red arrow indicating 1992 terminus location, note heavily crevassed areas on the east side draining from 2500 m on the slopes of Mount Aspiring and at the three icefalls areas on the main glacier.

Bonar Glacier topographic map, blue arrows indicate glacier flow. Icefalls at 2000 m, 1800 m and from 1600 m to the terminus at 1300 m.

Bonar Glacier in 2001 and 2020 Landsat image.  Red arrow is the 1992 reconstituted terminus location, yellow arrow the 2021 terminus location and purple dots the snowline.

Snow White Glacier, New Zealand Withers with Climate Change in 21st Century

Snow White Glacier in Landsat images from 2002, 2016 and 2021.  Point A is an alpine lake, Point B is  new proglacial lake location, Point C is lower icefall and Point D the Upper Icefall.  Blue arrows indicate glacier flow.

The Snow White Glacier is in the Snow Drift Range and Olivine Wilderness in Mt Aspiring National Park, New Zealand. The glacier flows north from 2400 m on the slopes of Mount Maoriri and Maruiwi through an icefall at 2000 m (D) and a second icefall (C) at 1700 m before taking a sharp eastward turn for the terminus reach and then draining into the Arawhata River. The NIWA glacier monitoring program noted that  30 per cent of New Zealand’s ice that was existed in the late 1970s has been lost in the past 40 years as snowlines have been rising. The retreat has been driven by a series of  increasingly warm summers (NIWA, 2019). The NIWA 2021 snowline survey indicated near normal average end of summer snowline despite a La Nina (Drew Lorrey in NZHerald, 2021). Here we report on changes in Snow White Glacier using Landsat and Sentinel imagery from 2002-2021.

In a 2002 Landsat image Snow White Glacier had a wide terminus tongue filling a basin at Point B ~1400 m in elevation, 600 m from a small lake at Point A. The glacier is 400 m wide at the lower icefall and 600 m wide at Point B. By 2016 the lower icefall reach is down to 200 m in width, which means less ice is flowing from high on the glacier to the terminus.  As a result the terminus lobe width has been reduced to 300 m and an incipient glacial lake is forming near Point B. By 2020 in a Sentinel image and Digital Globe image the lake forming at Point B is evident fringing much of the glacier. Notice the snowline reaches the upper icefall in 2020, and the icefall at Point C is too narrow to be stable.  The lake in the Digital Globe image has an area of 0.1 km2. The icefall connection is less than 100 m wide and will soon disconnect the upper glacier from the terminus. In 2021 Landsat imagery indicates the terminus lake is continuing to expand and the icefall reach is even more tenuous. The glacier has retreated 450 m since 2002. The impending detachment will lead to a jump in the retreat to the new active terminus in the lower icefall, with the 1 km long stagnant tongue left behind.

This glaciers retreat parallels that of other glacier in the region such as Gunn Glacier and Donne Glacier, where new alpine lakes have recently formed also. The detachment is quite similar to that of Volta Glacier.

Digital Globe 2020 image of the terminus reach of Snow White Glacier indicating new lake near Point B.

.

Snow White Glacier in Sentinel and Digital Globe image from 2020.  Point A is an alpine lake, Point B is  a new proglacial lake, Point C is the lower icefall and Point D the Upper Icefall. 

Topographic map of Snow White Glacier from NZTopo Map


Glacier Retreat Drives 400% Lake Expansion Southern Alps, New Zealand 1990-2020

Landsat images  from 1990 and 2020 of the Mueller (M), Hooker (H), Tasman (T) and Murchison (Mn) Glacier.  Red arrows indicate the 1990 terminus location, yellow arrows the 2020 terminus location and pink arrows the upglacier extent of debris cover in 1990.

Glaciers of the Southern Alps of New Zealand have been losing ice volume since 1978, with an increasing rate in the last decade (Pelto, 2016).  Gjermundsen et al (2011) examined glacier area change in the central Southern Alps and found a 17% reduction in area mainly from large valley glaciers such as Hooker, Mueller, Tasman and Murchison Glacier. The NIWA glacier monitoring program noted that  30 per cent of New Zealand’s ice that was existed in the late 1970s has been lost in the past 40 years as snowlines have been rising. The retreat has been driven by a series of  increasingly warm summers (NIWA, 2019). The NIWA and University of Wellington 2020 snowline survey indicated improvement in 2020.  Lauren Vargo and Andrew Lorrey reported there was more retained snowcover compared to the very high snowlines in 2018 and 2019, despite the presence of ash/dust from Australian fires (NIWA, 2020).

If we look back to the 1972 Mount Cook map, see below, no lakes are evident at the terminus of Hooker (H), Mueller (M), Tasman Glacier (T), or Murchison Glacier that all drain into Lake Pukaki, pink dots indicate terminus location. In 1990 four lakes had developed one in front of each retreating glacier with a combined area of 2.5 km2.  By 2020 the combined lake area is 12.9 km2.

Mueller Glacier has had a 2300 m retreat from 1990-2020, which will continue in the future as the lower 1.2 km section of the glacier is stagnant. Mueller Lake area was under 0.2 km2 in 1990, expanding to 1.9 km2 by 2020. Mueller Glacier’s lower section is not a typical convex valley glacier, but a concave reach of debris covered ice with significant melt valleys and hollows indicating stagnation in the lowest 1.6 km.  In 1990 a fringing discontinuous area of water along the southern glacier margin existed.  By 2004 the Mueller Glacier Lake had expanded to a length of 700 meters.  Mueller Lake in 2010 had a surface area of 0.87 km2 and a maximum depth of 83 m (Robertson et al, 2012). By 2015 the lake had reached 1800 meters in length. From 2015-2020 the terminus collapsed into the lake with icebergs and other attached ice remnants.  Terminus images from 2018, taken by Jill Pelto, indicate the high turbidity of the lake, which is expected from a debris covered ablation zone.

Hooker Glacier retreated 1350 m from 1990 to 2020 with the retreat enhanced by calving in Hooker Lake. The lake had an area of 0.5 km2 in 1990, expanding to 1.5 km2 by 2020. The retreat was faster during the earlier part of this period with lake area reaching 1.22 km2 by 2011 (Robertson et al.,2013). Hooker Glacier has a low gradient which helps reduce its overall velocity and a debris covered ablation zone reducing ablation, both factors increasing response time to climate change  (Quincey and Glasser 2009). Hooker Lake which the glacier ends in began to form around 1982 (Kirkbride, 1993). The peak lake depth is over 130 m, with the terminus moving into shallow water after 2006 leading to declining retreat rates (Robertson et al, 2012). The debris cover now extends ~2 km further upglacier than in 1990.

Tasman Glacier retreated 4900 m from 1990 to 2020 primarily through calving into the expanding proglacial lake. In 1990 Tasman Lake had an area of 1.7 km2, expanding to 7.1 km2 by 2020.  Dykes et al (2011) note a maximum depth of 240 m, and an annual growth rate of 0.34 km2 . The proglacial lake at the terminus continues to expand as the glacier retreats upvalley. The lake is deep with most of the lake exceeding 100 metes in depth, and the valley has little gradient, thus the retreat will continue. It has been noted by researchers at Massey University that the lake can expand in this low elevation valley another 9 km, and that at the current rate this could occur over two decades. The debris cover now extends ~1.5  km further upglacier than in 1990.

Murchison Glacier has retreated 2700 m From 1990 to 2020.  In 1990 the lake had an area of under 0.2 km2, expanding to 2.5 km2 by 2020. The rapid retreat will continue as 2010, 2013 and 2015 imagery indicate other proglacial lakes have now developed 3.5 km above the actual terminus. The debris cover now extends ~2 km further upglacier than in 1990.

For each glacier debris cover now extends further upglacier which along with rising snowlines highlights the expansion of the ablation area, that also drives volume loss, retreat and lake expansion.

Glacier runoff is a key hydropower water resource. Water from Lake Pukaki is sent through a canal into the Lake Ohau watershed and then through six hydropower plants of the Waitaki hydro scheme: Ohau A, B and C. Benmore, Aviemore and Waitaki with a combined output of 1340 MW.  Meridian owns and operates all six hydro stations located from Lake Pūkaki to Waitaki.  Interestingly salmon have been introduced into the Waitaki River system for fishing near its mouth, though Lake Pukaki itself has limited fish.

Mueller Glacier terminus collapse in 2018, image from Jill Pelto.

1972 Map of region when Tasman, Mueller and Hooker Glacier lacked proglacial lakes.

Canals draining from Lake Tekapo to Lake Pukaki then upriver of Lake Benmore

Canal at Ohau hydropower, image from Jill Pelto.

Mueller Glacier, NZ Terminus Collapse

Mueller Glacier (M) in a Landsat image from 1990 and a Sentinel image from 2018. Red arrow is 1990 terminus, yellow arrow 2018 terminus, blue arrow glacier flow, and pink arrow in 2018 ablation valley cut into glacier.

Glaciers of the Southern Alps of New Zealand have been losing ice volume since 1978, with an increasing rate in the last decade (Pelto, 2017).  The NIWA glacier monitoring program has noted that volume of ice in New Zealand’s Southern Alps has decreased 5.8 cubic kilometres, more than 10% in the past 30 years. More than 90% of this loss is from 12 of the largest glaciers in response to rising temperatures over the 20th century. Three of these glaciers are the Tasman, Mueller and Hooker Glacier.   If we look back to the 1972 Mount Cook Map, see below, no lakes are evident at the terminus of Hooker (H), Mueller (M) or Tasman Glacier (T), pink dots indicate terminus location, top image. Now it is a developing lake district.

Mueller Glacier drains the eastern side of Mount Sefton, Mount Thompson and Mount Isabel. The lower section of the glacier is debris covered in the 2.5 km long valley reach from the terminus at 950 m to 1250 m. A comparison of the Mueller Glacier in a sequence of Landsat images indicates a fringing discontinuous area of water along the southern glacier margin in 1990. In 2000 the lake at the end of Hooker Glacier had developed and was 400 meters long. By 2004 the Mueller Glacier Lake had expanded to a length of 700 meters. By 2011 the lake had reached 1400 meters in length. By 2015 the lake had reached 1800 meters in length. Mueller Lake had a surface area of 0.87 km2 and a maximum depth of 83 m (Robertson et al, 2012). From 2015-2018 the terminus has collapsed into the lake with icebergs and other attached ice remnants.  The retreat has left a lake that is 2700 m long,  a retreat of 2300 m since 2000.  The lake basin is 1.6 km2 with 15% filled with remnant ice. Above the current terminus in not a typical convex valley glacier, but a concave reach of debris covered ice with significant melt valleys and hollows indicating stagnation in the lowest 1.6 km.  Pictures of the terminus from 2018 taken by Jill Pelto, UMaine indicate the high turbidity of the lake, which is expected from a debris covered ablation zone. The lack of relief of the relict ice is also evident.

Mueller Glaier drains into Lake Pukaki,a along with Murchison,Hooker and Tasman Glacier, where water level has been raised 9 m for hydropower purposes. Water from Lake Pukaki is sent through a canal into the Lake Ohau watershed and then through six hydropower plants of the Waitaki hydro scheme: Ohau A, B and C. Benmore, Aviemore and Waitaki with a combined output of 1340 MW.  Meridian owns and operates all six hydro stations located from Lake Pūkaki to Waitaki.  Reductions in glacier area in the watershed will lead to reduced summer runoff into the Lake Pukaki system.

The glacier has been fed by three different glaciers flowing off of Mount Sefton. Two of them Tuckett and Huddlesoton (pink arrow) are no longer delivering significant ice to the Mueller, only modest avalanching now spills onto the Mueller Glacier. Only the Frind Glacier (yellow arrow) is contributing to the Mueller Glacier. This is similar to the situation on nearby Murchison Glacier. Further the lack of ice connection from Huddleston and Tuckett Glaciers to Mueller is again evident, pink arrow. The lake will continue to expand through minor calving and downwasting.

Field work images from Jill Pelto looking across Mueller Lake towards Hooker Lake and Mt. Cook. Some remnant ice is visible.

View southwest toward the head of Mueller Lake and terminus of Mueller Glacier notice stream dissecting stagnant ice at head of lake.  Picture is from Noel Potter, UMaine,  2/2018 


Mueller Glacier (M) in a Landsat image from 2000 and 2015. Red arrow is 1990 terminus, and yellow arrow 2018 terminus.

1972 Map of region when Tasman, Mueller and Hooker Glacier lacked proglacial lakes and Landsat image in 2011 after lake development.


New Zealand Glacier Retreat will Impact Hydropower

Map of the Waitaki Hydropower system, from Meridian and images of the system taken by Jill Pelto January 2017.  

Hooker Glacier, Mueller, Murchison and Tasman Glacier drain into Lake Pukaki, where water level has been raised 9 m for hydropower purposes. Classen Glacier, Grey Glacier and Godley Glacier drain into Lake Tekapo. Lake Tekapo and Lake Pukaki are both utilized for hydropower. Water from Lake Tekapo is sent through a canal to Lake Pukaki. Water from Lake Pukaki is sent through a canal into the Lake Ohau watershed and then through six hydropower plants of the Waitaki hydro scheme: Ohau A, B and C. Benmore, Aviemore and Waitaki with a combined output of 1340 MW.  Meridian owns and operates all six hydro stations located from Lake Pūkaki to Waitaki. Below the Benore Dam is pictured,.  Interestingly salmon have been introduced into the Waitaki River system for fishing near its mouth. Benmore Lake itself is an internationally renowned trout fishing spot, providing habitat for both brown trout and rainbow trout. The reduction of glacier area in the region due to retreat will reduce summer runoff into Lake Pukaki and this hydropower system, which will reduce summer flow in the Waitaki River.

Mueller Glacier has had a 1500 m retreat from 1990-2015, which will continue in the future as the lower 2 km section of the glacier is stagnant. Hooker Glacier retreated 1200 m from 1990 to 2015 and the lake expanded to 2300 m, with the retreat enhanced by calving. Tasman Glacier retreated 4.5 km from 1990 to 2015 primarily through calving into the expanding proglacial lake.  Murchison Glacier has retreated 2700 m From 1990 to 2015. The rapid retreat will continue as 2010, 2013 and 2015 imagery indicate other proglacial lakes have now developed 3.5 km above the actual terminus. Classen Glacier  has retreated 1000 m from 1990 to 2015 leading to expansion of the lake it ends in (Pelto, 2016).  Godley Glacier has retreated 1300 m from 1990-2015 with an equal amount of lake expansion (Pelto, 2016). The expansion of debris cover is striking from 1990 to 2015 this indicates reduced flow from the accumulation zone.  Grey Glacier has a heavily debris covered terminus that prevents accurate assessment of retreat. Overall these 7 glaciers make up the majority of the volume and area loss of New Zealand glaciers, which has been dominated by 12 large glaciers (Salinger and Willsman, 2008).  The changes of 12 different glaciers have been examined in detail and are compile at the New Zealand Glacier Index. The loss of summer glacier runoff from each square kilometer of lower elevation glacier area that has disappeared is at least 50,000 cubic meters per day (Pelto, 2016).  Given the 12 square kilometer loss in the terminus zone of just these seven glaciers, you have a 600,000 cubic meter per day loss in runoff that would be heading into the Pukaki-Takapo-Waitaki Hydro system. The retreat is driven by mass losses as indicated by the rising snowline observed by NIWA.

nzhydro

Map of the glaciers feeding Lake Pukaki and Lake Tekapo. M=Mueller, H=Hooker, T=Tasman, Mu=Murchison, Gr=Grey, Go=Godley and C=Classen. From Pelto (2016)

tekapo-canals

Canals connecting Lake Pukaki and Lake Tekapo

Waitaki Hydropower network

New Zealand Glacier Change Index

 nzlake compare2

Terminus of Tasman, Mueller and Hooker Glacier terminus in Mount Cook 1972 map, no lake present.
Progalcial lakes forming in front of Tasman, Mueller and Hooker Glacier in 1990 above and 2015 Landsat images below. 
Red arrows are the 1990 terminus and yellow arrows the 2015 terminus locations.


Overview

The Southern Alps of New Zealand are host to over 3000 glaciers that owe their existence to high amounts of precipitation ranging from 3 to 10 m (Chinn, 1999). The list below examines the changes of 12 glaciers examined in a separate post. The NIWA glacier monitoring program has noted that volume of ice in New Zealand’s Southern Alps has decreased by 36% with the loss of 19.0 km3 of glacier ice, from 53.3 km3 in 1978 to 34.3 km3 in 2014 (New Zealand Govt., 2015). Volume loss in New Zealand glaciers is dominated by 12 large glaciers (Salinger and Willsman, 2008). More than 90% of this loss is from 12 of the largest glaciers in response to rising temperatures over the 20th century (Chinn, 1999).  In the 1972 map of the region there is no lake at the terminus of the Tasman Glacier, Mueller Glacier or Hooker Glacier; each are substantial in size by 2015. Each lake continues to expand and as glacier retreat continues .From 1977-2015 NIWA has conducted an annual snowline survey, in six of the last nine years the snowline has been significantly above average and three years approximately at the average (Willisman et al., 2015).  This has driven the widespread glacier retreat underway. In each case the retreat of the largest glaciers has been enhanced by the formation and expansion of lakes, in this newly developing lake district. Dykes et al., (2011) identify the role of glacier lakes in accelerating the retreat of Tasman Glacier.  The retreat of these glaciers has until recently been slowed by debris cover and the long low slope ablation zone segments  (Chinn, 1999).  Glaciers that lack debris cover and have a steeper slope have a more rapid response time, such as Fox Glacier and Franz Josef Glacier (Purdie et al., 2014).  These two glaciers have been in the news of late due to rapid retreat causing glacier tours of the lower reaches of the glacier unsafe.  NIWA reported that February of 2016 was the second warmest month of any month in New Zealand, which will drive snowlines higher and enhance glacier melt this year.

Many New Zealand glaciers are important for hydropower: Lake Tekapo and Lake Pukaki are both utilized for hydropower. Hooker Glacier, Mueller, Murchison and Tasman Glacier drain into Lake Pukaki, where water level has been raised 9 m for hydropower purposes. Water from Lake Pukaki is sent through a canal into the Lake Ohau watershed and then through six hydropower plants of the Waitaki hydro scheme: Ohau A, B and C. Benmore, Aviemore and Waitaki with a combined output of 1340 MW.  Meridian owns and operates all six hydro stations located from Lake Pūkaki to Waitaki. The reduction of glacier area in the region will reduce summer runoff into Lake Pukaki and this hydropower system.
gunn glacier 2006
Gunn Glacier in, 2006 above and 2012 below,Google Earth image.  Red arrows the 2006 terminus position yellow arrows 2012 terminus location. The glacier lost 25% of its area in six years. 

gunn glacier 2012
Individual Glacier Posts

Murchison Glacier   Tasman Glacier   Balfour Glacier

Mueller Glacier   Hooker Glacier   Salisbury Snowfield

Lyell Glacier     Douglas Neve    Gunn Glacier

Upper Volta Glacier  Donne Glacier

donne compare

Donne Glacier from 2003-2012 in Google Earth images.  Red arrow is the 2003 terminus and yellow arrow the 2012 terminus. A seven hundred meter retreat in a decade.

Volta Glacier New Zealand Losing Lower Volta section

volta compare

Comparison of Volta Glacier in 2001 and 2016.  Yellow arrow is the 2016 terminus position and the red arrow the NZ topo map terminus location.  Purple arrows indicate upglacier thinning and orange arrows regions of avalanching onto the lower Volta Glacier. 

Volta Glacier drains northeast from Mount Aspiring entering the Waiatoto River.  This region is 60 km south of the main region of glaciers around Mount Cook. The glacier is divided into two segments the upper Volta flowing west from Tantalus Rock at 2100 m to an icefall extending from 1600 m to 1400 m where the Lower Volta Glacier begins. The Lower Volta is also fed by steep glaciers that avalanche material onto the lower Volta Glacier from the south.  In the New Zealand Topo Map the lower Volta flows down an additional icefall to 1050 m.  The glacier has been noted as part of the pattern of the larger glaciers undergoing substantial retreat in New Zealand by NIWA (2007).  The volume loss of New Zealand glaciers is reported as 36% from 1978 to 2015, from 54 cubic km to 34 cubic km. In 2015 the average snowline was approximately 40 m higher than average leading to mass losses overall (NIWA, 2015)

In 2001 the Lower Volta Glacier still descended through the icefall to the terminus lobe at 1050 m. By 2010 the glacier terminated at the top of this icefall near 1200 m.  A 2012 Google Earth image indicates this position.  It is also evident that icefall connecting the upper and lower Volta has narrowed and flow has been reduced.  The heavily debris covered lower Volta in the 2012 image is clearly wasting away.  The 2016 Landsat image indicates continued downwasting of lower Volta Glacier.  The glacier has retreated 1600 m from the map position. Thinning of the upper Volta continues, purple arrows including the icefall is much narrower and bedrock areas are expanding in the region above the icefall. The upper Volta continues to retain significant snow covered areas throughout the years while the lower Volta does not. As the lower Volta Glacier continues downwasting rapidly the upper Volta downwasting is much slower.  The glacier has experienced significant retreat just like other New Zealand glaciers: Murchison, Mueller and Tasman.

volta map

New Zealand Topographic Map indicating flow of upper and lower Volta Glacier, blue arrows. Red arrow is the terminus location for the map and yellow arrow the 2016 terminus location.

aspiring 2012 ge

Google Earth image in 2012 of the lower Volta Glacier and the icefall connection.  The terminus diverges to the yellow arrows left and right. 

lowervoltatherma13

View across lower Volta Glacier to the southwest, from Mountain Recreation News  


Murchison Glacier, New Zealand Rapid Retreat Lake Expands 1990-2015

murchison compare

Murchison Glacier change revealed in Landsat images from 1990 and 2015.  The red arrow indicates 1990 terminus location, the yellow arrow indicates 2015 terminus location and the purple arrow indicates upglacier thinning.

Murchison Glacier is the second largest in New Zealand.  The glacier drains south in the next valley east of Tasman Glacier and terminates in a lake that is rapidly developing as the glacier retreats. The lower 6 km section  is debris covered, stagnant, relatively flat and will not survive long. There was not a lake in the 1972 map of the region.  In 1990 the newly formed lake was limited to the southeast margin of the terminus . From 1990 to 2015 the terminus has retreated 2700 m. A rapid retreat will continue as 2010, 2013 and 2015 imagery indicate other proglacial lakes have now developed 3.5 km above the actual terminus. These lakes are glacier dammed and may not endure but do help increase ablation, and in the image below show a glacier that is too narrow to provide flow to the lower 3.5 km. The demise of the lower section of this glacier will parallel that of Tasman Glacier.  The expanding lake will continue to enhance the retreat in part by sub-aqueous calving noted by Robertson et al (2012) on nearby glaciers. The increased retreat has been forecast by the NIWA and Dykes et al (2011). The glacier still has a significant accumulation area above 1650 m to survive at a smaller size.  The ongoing retreat is triggered by warming and a rise in the snowline in the New Zealand Alps observed by the NIWA. Notice the changes upglacier indicated at the purple arrows above, where tributary flow has declined, bedrock areas in accumulation zone have expanded and the snowline is higher.  Gjermundsen et al (2011) examined the change in glacier area in the central Southern Alps and found a 17% reduction in area mainly from reductions of large valley glaciers such as Murchison Glacier.

mucrhison terminus reach compare

Terminus reach of Murchison Glacier in Google Earth images from 2007 and 2013.  Note expansion at pink arrow on the terminus lake and the development of proglacial lakes 3.5 km upglacier at blue arrows.

The Feb. 2011 earthquake near Christchurch led to a major calving event of a portion of the rotten stagnant terminus reach of the Tasman Glacier. There was no evident calving event from Murchison Glacier.This has led to increased exposure of bedrock high on the glacier and reduction of tributary inflow noted at purple arrows.

Murchison Glacier drains into Lake Pukaki,a along with Hooker, Mueller and Tasman Glacier, where water level has been raised 9 m for hydropower purposes. Water from Lake Pukaki is sent through a canal into the Lake Ohau watershed and then through six hydropower plants of the Waitaki hydro scheme: Ohau A, B and C. Benmore, Aviemore and Waitaki with a combined output of 1340 MW.  Meridian owns and operates all six hydro stations located from Lake Pūkaki to Waitaki. Reductions in glacier area in the watershed will lead to reduced summer runoff into the Lake Pukaki system. Below the Benore Dam is pictured,.  Interestingly salmon have been introduced into the Waitaki River system for fishing near its mouth. Benmore Lake itself is an internationally renowned trout fishing spot, providing habitat for both brown trout and rainbow trout.

benmore dam

Google Earth Image with Benmore Dam in foreground and Benmore Lake.  This hydropower system is fed by a canal from Lake Pukaki which in turn is fed by Murchison Glacier.


Hooker Glacier Retreat, 1990-2015

hooker compare

Glacier change revealed in Landsat images from 1990 and 2015.  Mueller Glacier (M) and Hooker Glacier (H).  The red arrow indicates 1990 terminus location, the yellow arrow indicates 2015 terminus location and the purple arrow indicates upglacier thinning.

Hooker Glacier parallels the Tasman Glacier one valley to the west draining south from Mount Hicks and Mount Cook.  Hooker Glacier is a low gradient which helps reduce its overall velocity and  a debris covered ablation zone reducing ablation, both factors increasing response time to climate change  (Quincey and Glasser 2009). Hooker Lake which the glacier ends in began to from around 1982 (Kirkbride, 1993).  In 1990 the lake was 1100 m long (Figure 11.2).  From 1990 to 2015 the lake expanded to 2300 m, with the retreat enhanced by calving. The 1200 m retreat was faster during the earlier part of this period (Robertson et al.,2013).

hooker-mueller 1972 map

Map of the region in 1972 indicating the lack of proglacial lakes at the end of Mueller, Hooker and Tasman Glacier

The lower 3.4 km of the glacier has limited motion.  Robertson et al, (2012)  suggest the retreat will end after a further retreat of 700-1000 m as calving will decline as the lake depth declines.  The peak lake depth is over 130 m, with the terminus moving into shallow water after 2006 leading to declining retreat rates (Robertson et al (2012).Gjermundsen et al (2011) examined the change in glacier area in the central Southern Alps and found a 17% reduction in area mainly from reductions of large valley glaciers such as Hooker Glacier. Based on the nearly stagnant nature of the lower glacier and the diminished ice flow from above indicated by debris cover expansion at the purple arrow, it seems likely the retreat will continue well beyond the end of the lake but at a diminished rate.

Hooker Glacier drains into Lake Pukaki,a along with Murchison, Mueller and Tasman Glacier, where water level has been raised 9 m for hydropower purposes. Water from Lake Pukaki is sent through a canal into the Lake Ohau watershed and then through six hydropower plants of the Waitaki hydro scheme: Ohau A, B and C. Benmore, Aviemore and Waitaki with a combined output of 1340 MW.  Meridian owns and operates all six hydro stations located from Lake Pūkaki to Waitaki. Reductions in glacier area in the watershed will lead to reduced summer runoff into the Lake Pukaki system (see image below)

hookder 2006-2013

Comparison of Hooker Glacier terminus area in 2006 (red arrow) and 2013 (yellow arrow) in Google Earth. Blue arrow indicates icebergs in 2006.

pukaki hydro

Hydropower projects below Lake Pukaki

Balfour Glacier, New Zealand Retreat 1990-2015

Balfour Glacier drains west from Mount Tasman in the Southern Alps of New Zealand.  The ablation is a low slope, 8 km long debris covered tongue extending from the terminus near 800 m to 1600 m.  The glacier is fed by avalanching off of Mount Tasman to the west, the southern flank of the Fox Range to the north and the northern flank of the Balfour Range to the south.  Gjermundsen et al (2011) examined the change in glacier area in the central Southern Alps and found a 17% reduction in area mainly from reductions of large valley glaciers such as Balfour Glacier. The volume loss of New Zealand glaciers is reported as 36% from 1978 to 2015, from 54 cubic km to 34 cubic km.

balfour map

Topographic map of Balfour Glacier area of New Zealand from http://www.topomap.co.nz/ . Blue arrows indicate flow, red arrows at 1990 terminus and yellow arrow at 2015 terminus

In 1990 the glacier ended at 700 m with a snowline at 1600 m. The lower 18 km of the Balfour Glacier is debris covered. Only the upper 8 km has snowcover.  In 2015 the terminus has retrated 1250 m, the snowline is at 1800 m, with the lower 20 km debris covered. The terminus reach has continued to appear stagnant from 1990 to 2015.  Balfour Glacier has not developed a significant proglacial lake at its terminus, which has limited the retreat compared to Tasman Glacier or Mueller Glacier. Google Earth indicates the retreat of stagnant debris. The main glacier meltwater outlfow issues from the glacier at the yellow arrow in 2012, 600 m above the terminus.

balfour compare

Landsat Analysis of 1990 above and 2015 Below of Balfour Glacier.  Red arrow is at 1990 terminus and yellow arrow at 2015 terminus.  The purple arrows indicate area of thinning upglacier. 

balfour 2006

2006 Google Earth image of Balfour Glacier above and 2012 image below.  The red arrow is at the terminus location in 2006, the yellow arrow is at the 2012 location where the glacier stream issues from beneath the glacier. The purple arrows

balfour 2012