Ålfotbreen, Norway Mass Balance Large Loss in 2019

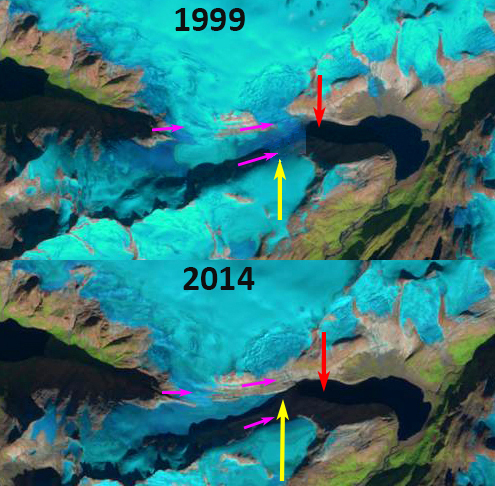
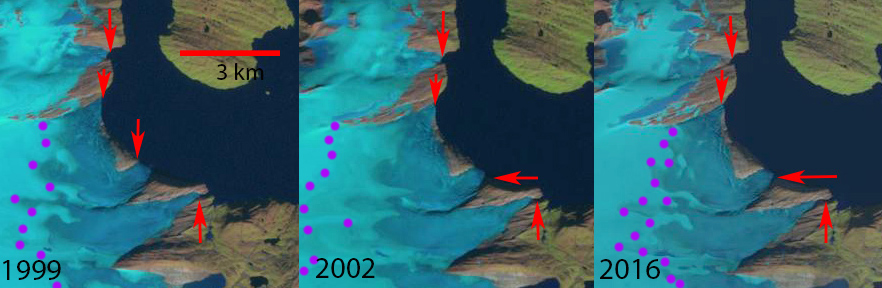
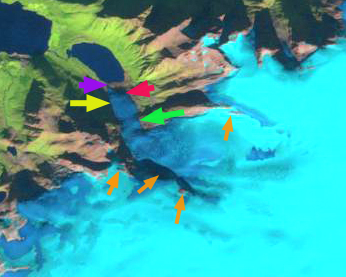
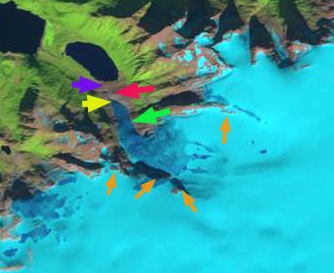
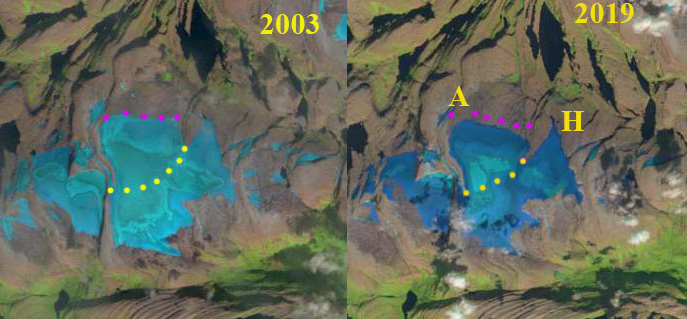
Ålfotbreen (A) in August 2003 and 2019 Landsat images.  The yellow line marks the divide between Ålfotbreen and Hansebreen (H). Pink dots indicate the 2003 margin.  There is no retained snowpack in 2003.  In 2019 there are two small patches near the divide  on Aug. 26 that melt away by the end of the summer.

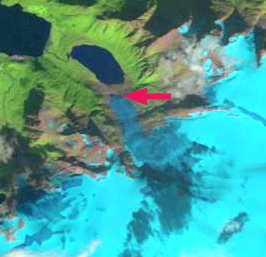
The Ålfotbreen Ice Cap , Norway (61°45’N, 5°40’E; area=17 km2) is the westernmost and most maritime glacier in Norway. Mass balance studies have been carried out on one of the glaciers of the ice cap since 1963, Ålfotbreen and since 1986 on Hansebreen, by the Norwegian Water Resources and Energy Directorate. Both of these glaciers supply runoff to the Askara Kraftwerk an 85 MW hydropower plant completed in 1973.  Ålfotbreen is a reference glacier for the World Glacier Monitoring Service (WGMS). From 1963-2000 the mean annual mass balance of Ålfotbreen was +0.9 m/year (see below).  From 2001-2019 the mean annual mass balance has been -1.7 m/year.  From 2001-2019 there have been seven years where the mass loss has been greater than 2 m.  This only occurs when all of the retained accumulation from the previous winter is lost.

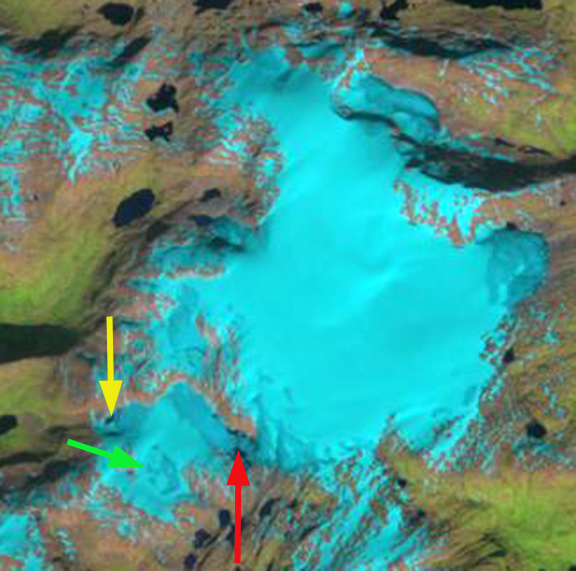
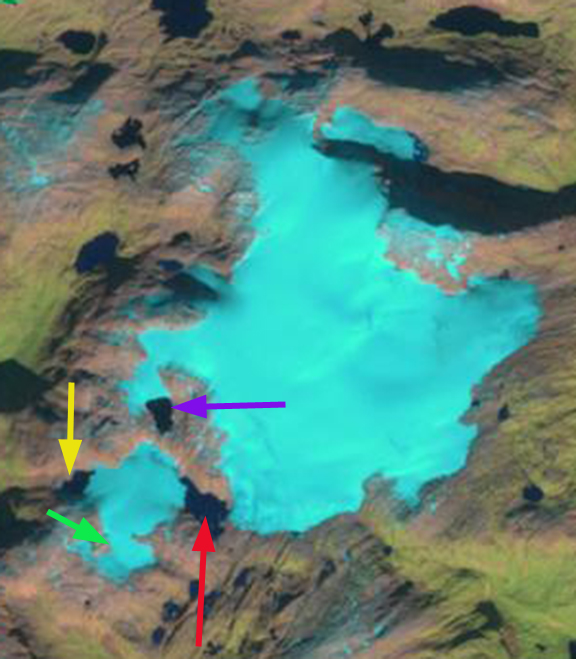
To be in equilibrium Ålfotbreen must have at least 55% of its area still covered by snow at the end of the summer.  In On August 3, 2003 the glacier had lost all of its snowcover, with more than a month left in the melt season.  The majority of the glacier surface is firn that is several years old, but not fully transformed to glacier ice.  The mass balance in 2003 was  very negative at -3.03 m.  The winter mass balance measured in early May was 2.26 m with a summer balance of -5.29 m.  Glacier runoff during the melt season of 2003 from Ålfotbreen is the product of its area at that time 4.4 km2 and summer balance, which yields 23 million m3. On Aug. 26, 2019 the glacier has two small areas of retained snowpack near the divide, light blue. There is a substantial area of darker blue-glacier ice exposed and medium blue firn exposed. The accumulation area ratio is 15% on Aug. 26, 2019 and was 0% by the end of the melt season.  The final mass balance in 2019 was -2.4 m with a winter balance of 2.38 m and a summer balance of -4.82 m.  The glacier area in 2019 is ~3.8 km2, yielding melt season glacier runoff of 18 million m3. This is 20-25% less runoff than in 2020 due to 10% lower melt per unit area and a ~15% reduction in glacier area. In 7 of the last 19 summers no snowcover remained at the end the melt season, this indicates the accumulation zone is not persistent, suggesting this glacier cannot survive current climate. This glacier has no slopes to deliver avalanche accumulation and is dependent on direct snowfall and wind drifted snowfall.

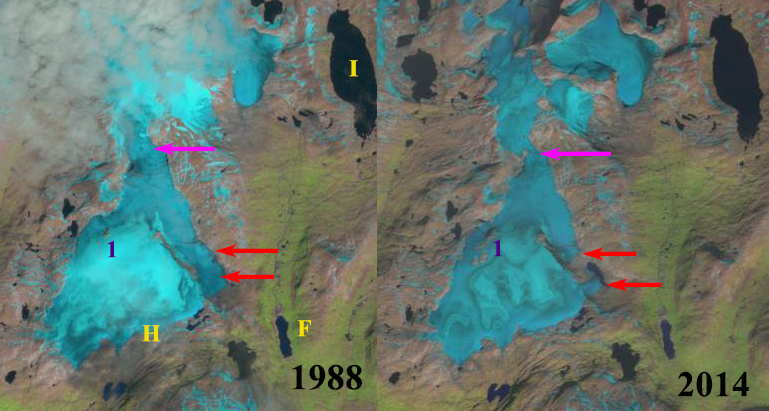
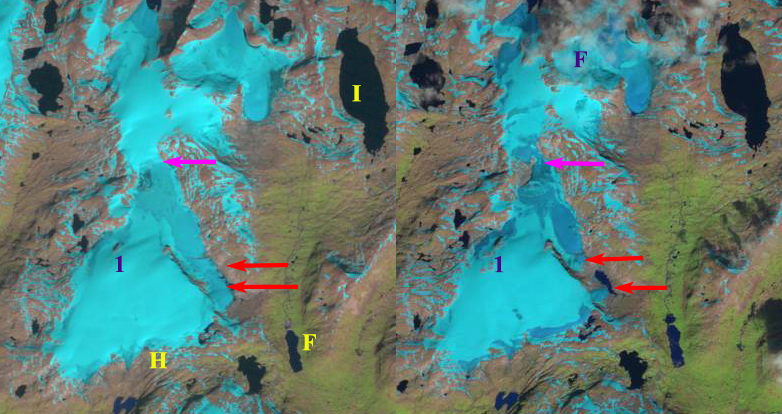
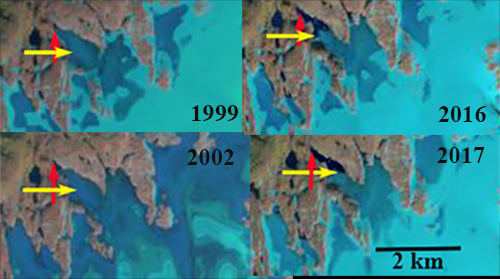
In contrast snowcover was 100% on July 17, 2017 and August 3, 1999, both years ended the melt season with smaller negative balances of -0.75 m and -0.37 m respectively. This illustrates the vast difference in exposed glacier ice between large negative balance years such as 2003 and 2019 and years with a smal negative or postiive balance.

The loss in glacier area has been due to a retreat of the broad terminus of the glacier, pink dots, ~150 m from 2003-2019. This retreat is less than at Harbardsbreen or Tunsbergdalsbreen.  Continued reductions in glacier area, will lead to a continued decline in glacier runoff and available water resources for summer hydropower production.

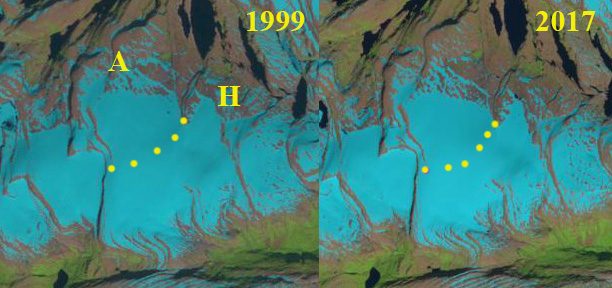
Ålfotbreen (A) in August 1999 and July 2017 Landsat images.  The yellow line marks the divide between Ålfotbreen and Hansebreen (H).

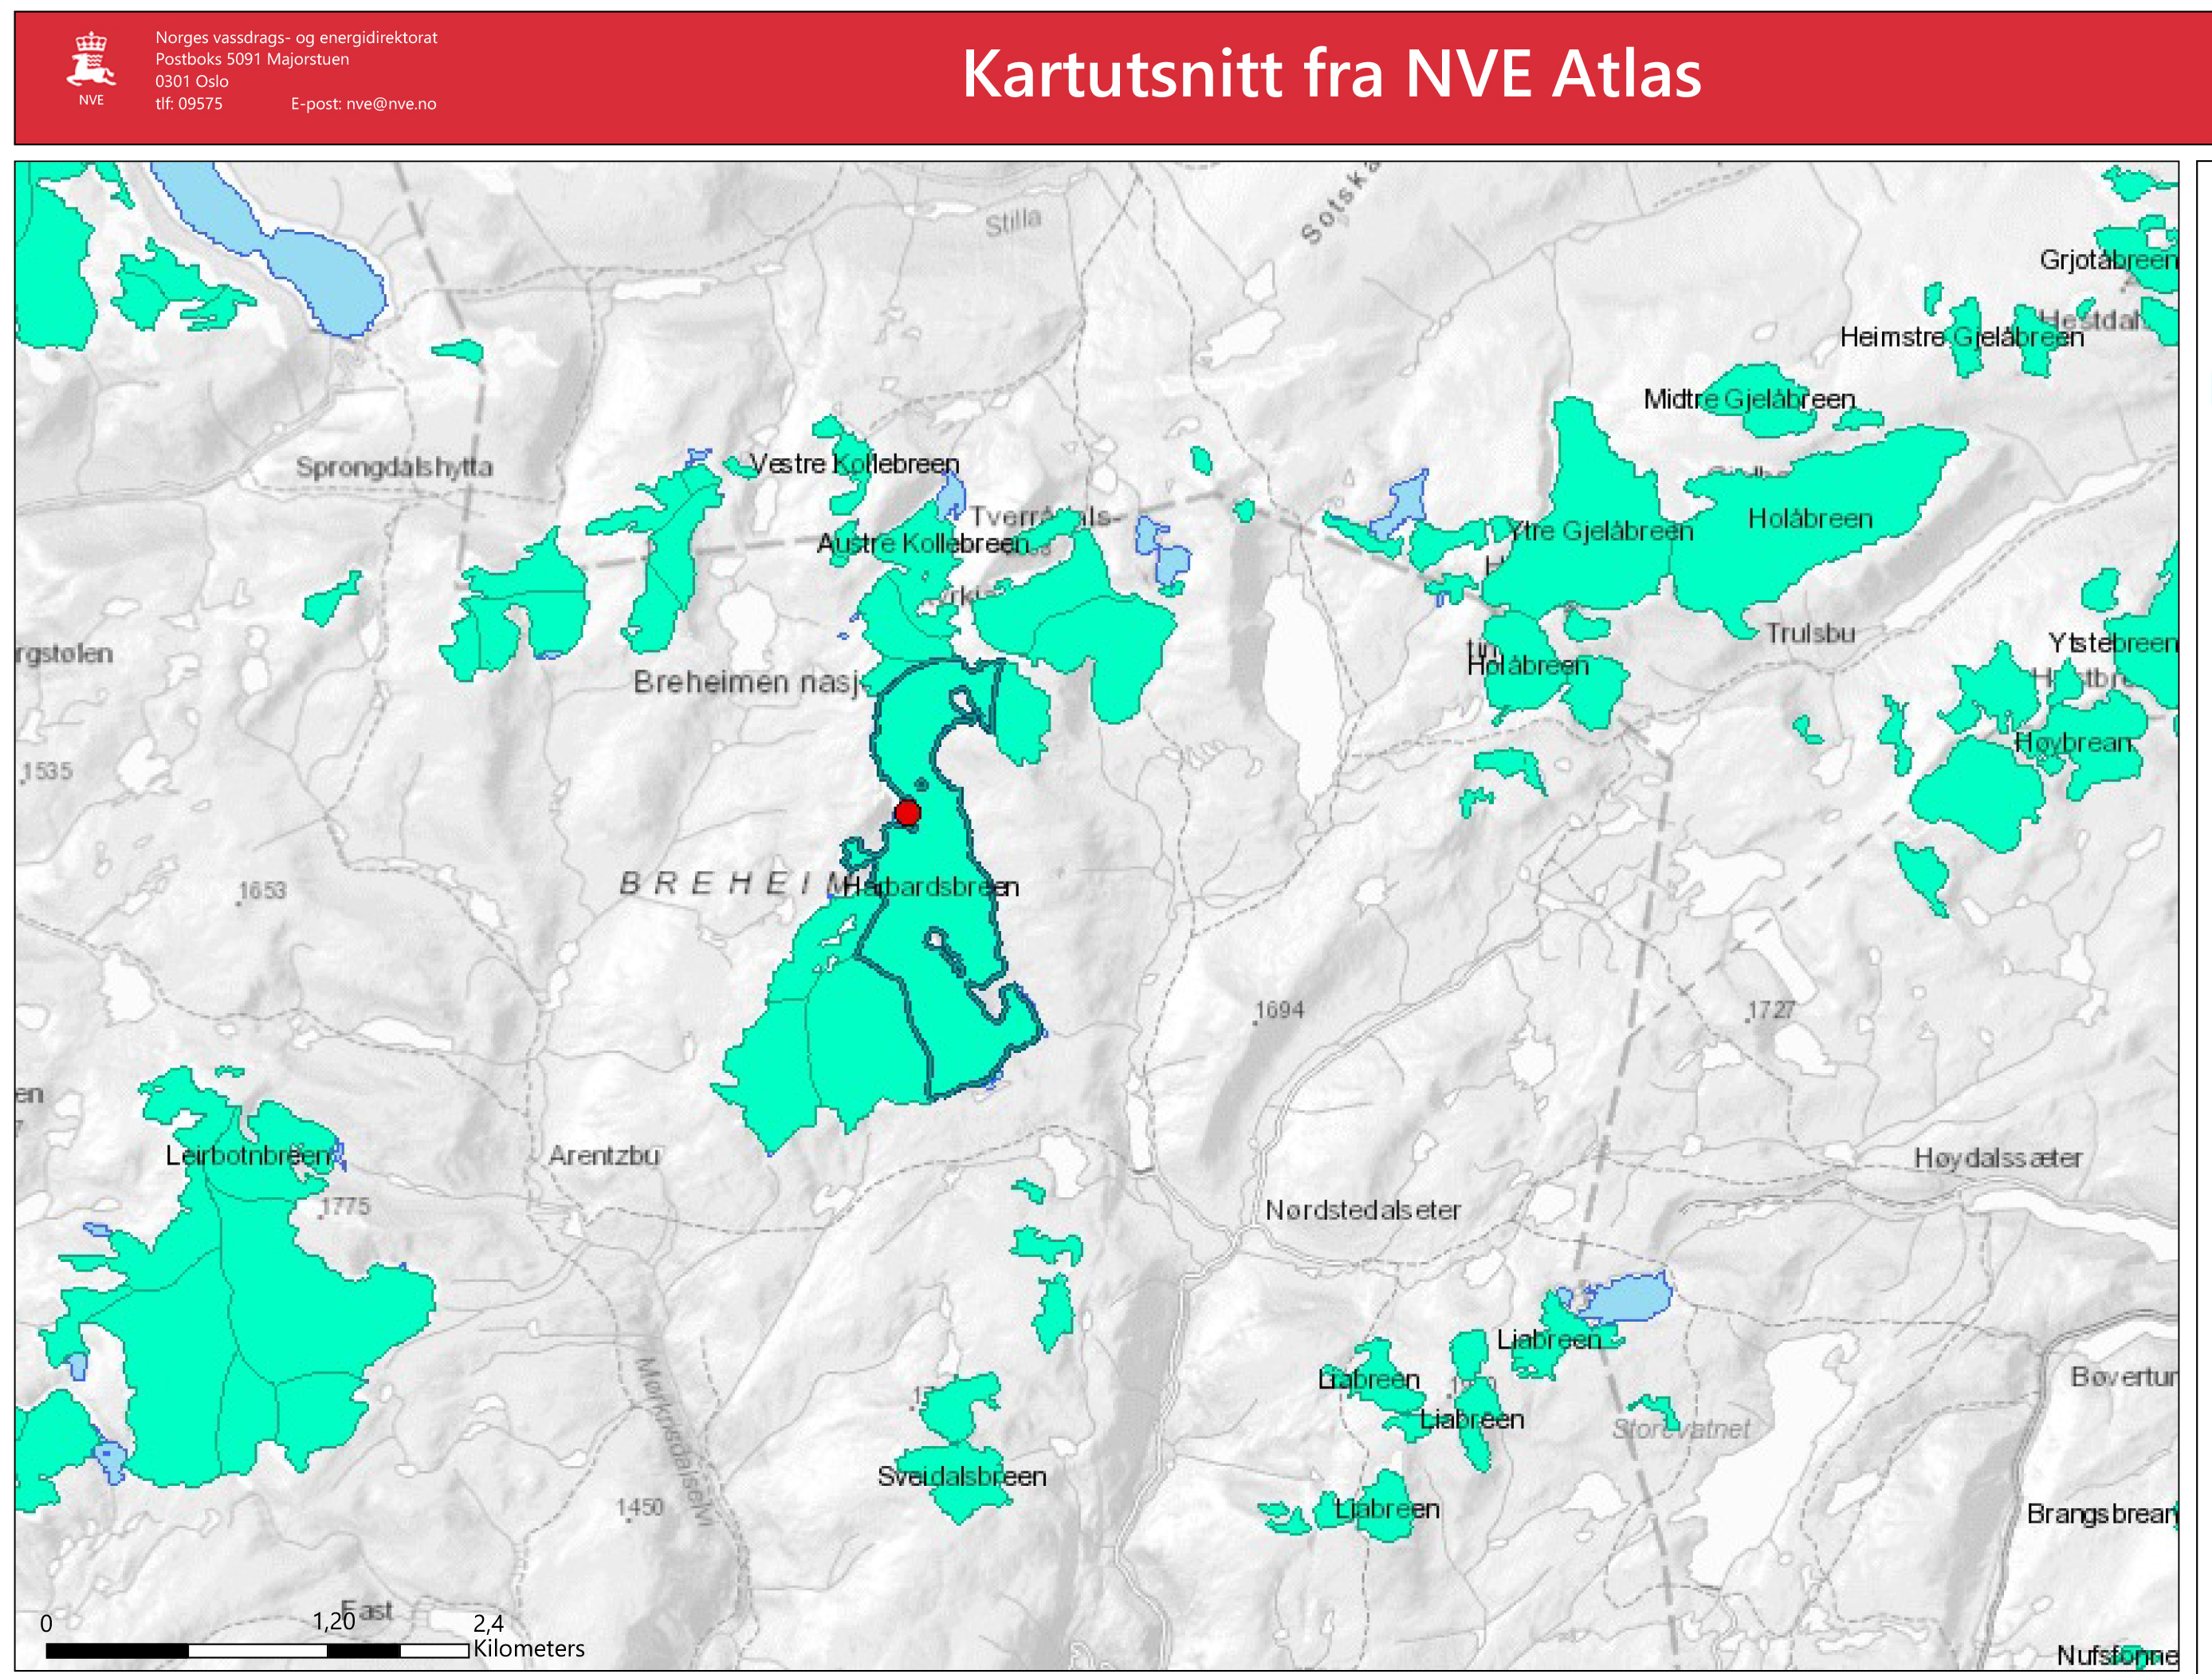
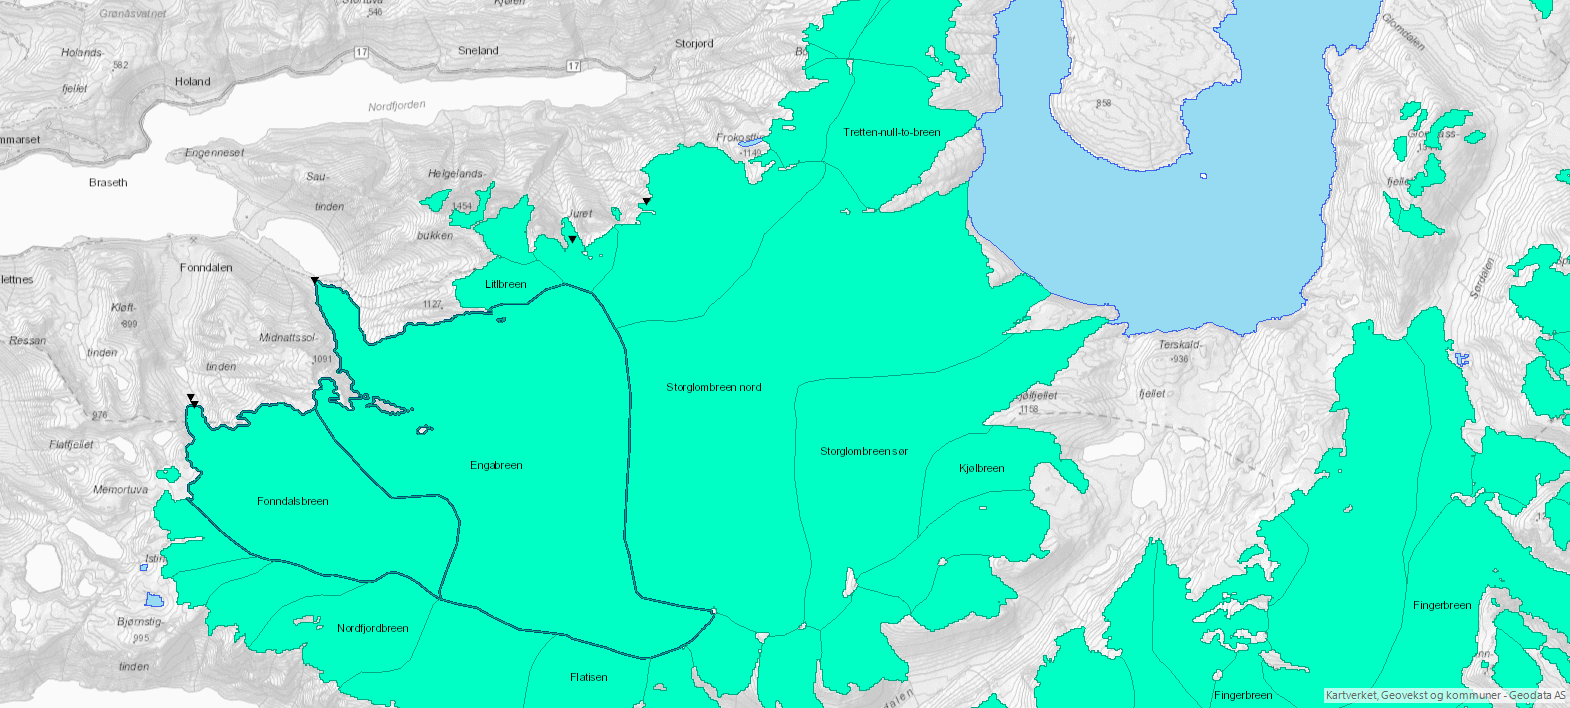
Map of the Ålfotbreen ice Cap form the Norway Glacier Atlas 

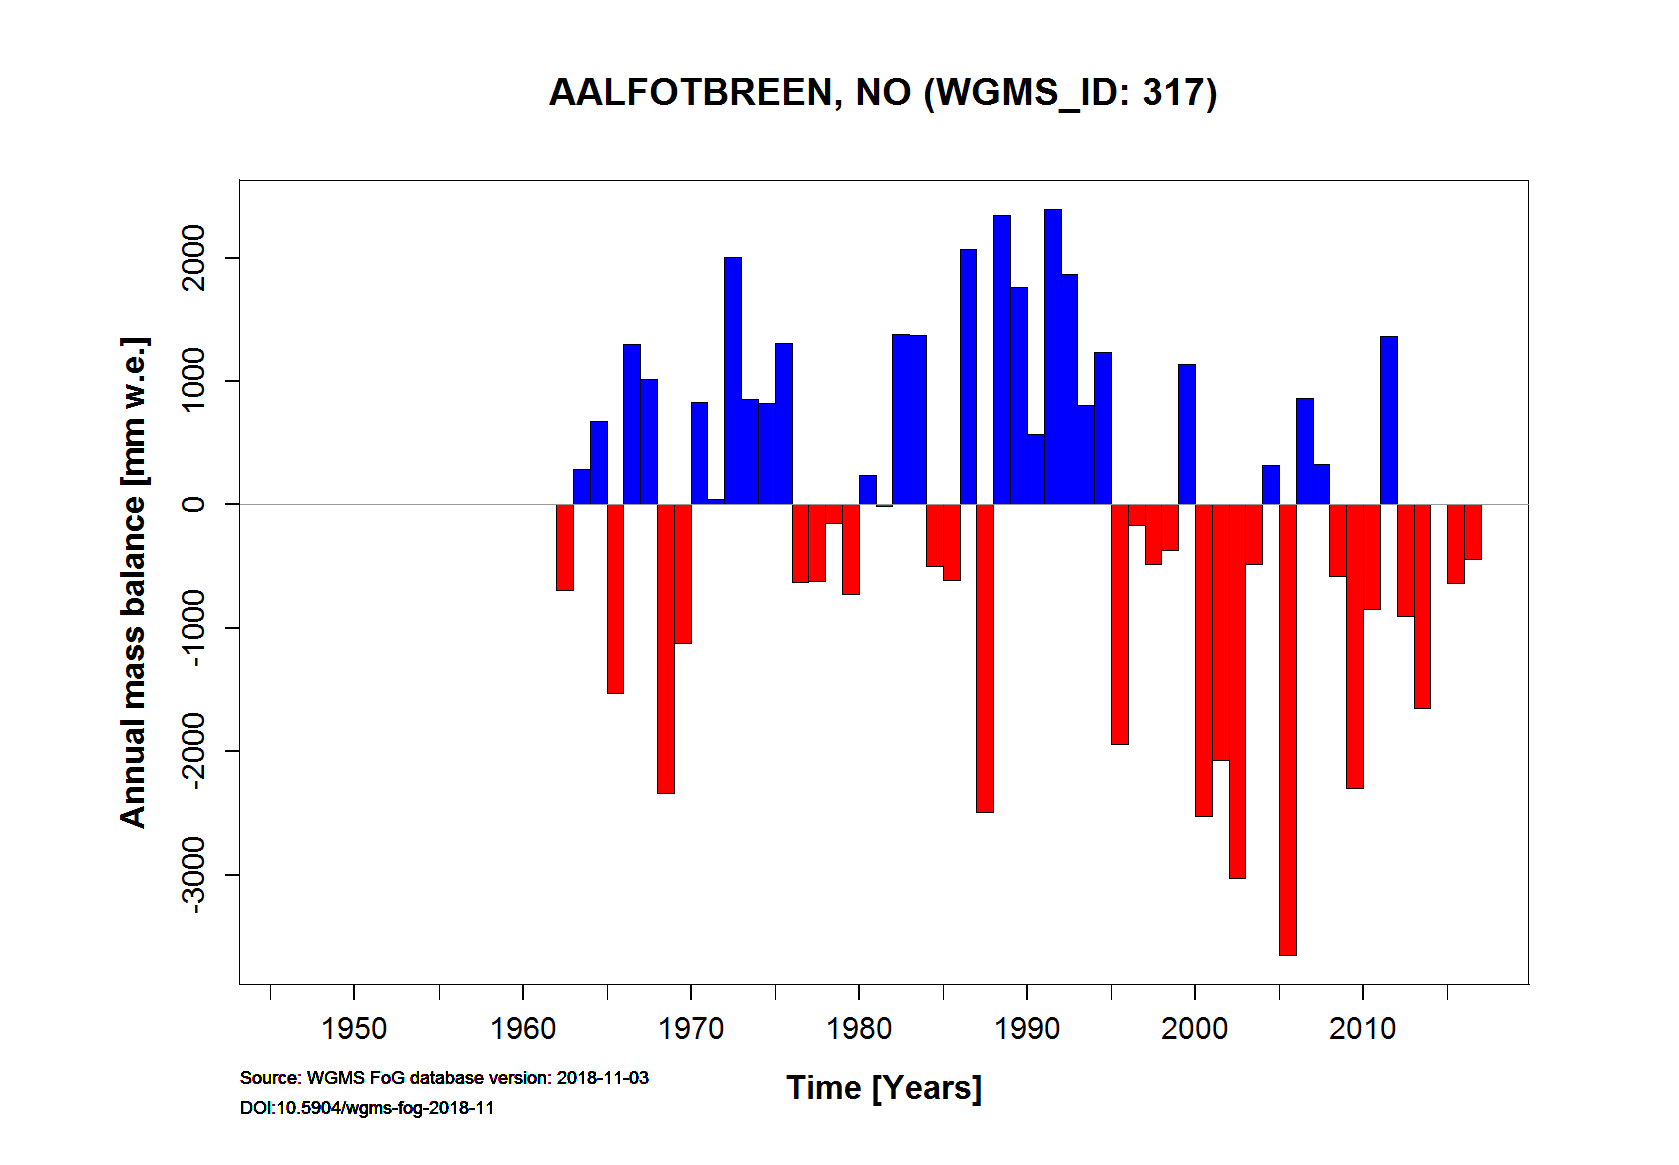
Mass balance record of the Alfotbreen from the WGMS.


Flatisen Glacier, Norway Retreats from Lake & Separates

Flatisen Glacier in Landsat images from 1990 and 2018.  The glacier terminates in the proglacial lake in 1990 at the red arrow and in 2018 at the yellow arrow no longer terminating in the lake.  The pink arrows indicate three connections of the ice cap to the terminus tongue in 1990, with two lost by 2018. 

Flatisen is the primary outlet glacier on the southern side of the second largest ice cap in Norway the Western Svartisen. From 1945-2000 the glacier terminated in a proglacial lake that expanded from 1.5 km long in 1945, to 3 km in 1985 (Theakstone, 1990) to km in 2000.  Haug et al (2009)  indicate significant mass loss of the Western Svartisen Ice Cap from 1985-2000.

In 1990 the glacier terminated in the proglacial lake that was ~3.5 km long.  There were significant feeders from the ice cap both north and south of the terminus tongue, pink arrows. In 1999 the glacier has retreated several hundred meters, still terminates in the lake and is still connected to the ice cap at the three noted locations, pink arrows.  By 2014 the glacier has retreated out of the lake and has lost the two eastern connections from the ice cap to the terminus tongue.  There is not retained snowcover on the valley tongue of the glacier.  By 2018 the glacier has retreated 1400 m from the 1990 position, has only one narrow connection to the main ice cap to the north and has very limited retained snowpack even on 8/6/2018.  There will be continued large mass balance loss for this glacier in 2018 reflective of the warm melt season in Norway. Once the glacier connection entering from the northwest is lost the glacier will have a limited accumulation zone.  The retreat of this glacier is greater given the size of the glacier than at two other key glaciers of the ice cap, Engabreen and Storglombreen.


Flatisen Glacier in Landsat images from 1990 and 2018.  The glacier terminates in the proglacial lake in 1990 at the red arrow and in 2018 at the yellow arrow no longer terminating in the lake.  The pink arrows indicate three connections of the ice cap to the terminus tongue in 1990, with two lost by 2018.

Map of Flatisen Glacier from the Norway Glacier Atlas indicating the margin in 1990 dark green and 1999 light green.

Harbardsbreen, Norway Margin Retreat and Separation

Harbardsbreen (H) the 13th largest ice cap in Norway in 1988 and 2014 Landsat images.  Red arrows indicate the main terminus on the east side that has separated since 1988. Point 1 is the sole nunatak in 1988 now there are more.  The Pink arrow is the location of the narrowing connection with the northern section of the icecap.  The east side of the ice cap feeds the hydropower system of Fivelmyr (F) and Illvatnet Reservoir (I).

Harbardsbreen (H) is the 13th largest ice cap in Norway in the Norwegian Glacier Inventory with an area of 24.8 square kilometers in 2006.  The ice cap is east of Jostedalsbreen. Here we examine Landsat imagery to indicate changes amidst and at the margin of this ice cap from 1988-2016. The east side of this ice cap drains into Fivelmyrane Reservoir (F) and its hydro power.  The Fivelmyr Power Plant was built in 1962 and has an 8 GWh annual capacity.  This water via pumped storage  is also part of the Herva Power Plant that produces 129 GWh annually.

In 1988 the main outlet of the ice cap was a tongue of ice fed from both north and south outlet glaciers on the east side of the ice cap, not red arrows.  There is a  connection to the northern end at the pink arrow is nearly 1 km wide.  At Point 1 there is a single nunatak amidst the ice cap.  Up to 1998 there is limited change in the icecap.  In 2014 the snowline is at 1700 m near the crest of the ice cap.  The eastern terminus of Harbardsbreen has separated at the red arrows.  A new lake has formed that is in contact with the southern terminus. The connection at the pink arrow to the northern segment is now just 200 m wide. There are now three new bedrock outcrops near Point 1 and the expanded former solitary nunatak. The expansion of the bedrock knobs indicate the impact of the rising snowline converting portions of the ice cap into an ablation zone that had been an accumulation zone. In 2016 the southeastern terminus of Harbardsbreen barely reaches the new lake that has formed. The glacier termini are now separated by 800 m from each other. The reduced size of the glacier means less area for melting, in this case the reduced natural ice storage can be replaced by the artificial pumped storage in Illvatnet.  This same story is being told at nearby Spørteggbreen and Tunsbergdalsbreen.

Harbardsbreen (H) the 13th largest ice cap in Norway in 1998 and 2016 Landsat images.  Red arrows indicate the main terminus on the east side that has separated since 1998. Point 1 is the sole nunatak in 1998 now there are more.  The Pink arrow is the location of the narrowing connection with the northern section of the icecap.  The east side of the ice cap feeds the hydropower system of Fivelmyr (F) and Illvatnet Reservoir (I).


Harbardsbreen in the NVE Atlas showing 2006 glacier margins


Gråfjellsbrea, Norway Retreat Forms New Lake

Gråfjellsbrea Retreat in Landsat images from 1999 to 2017.  Red arrow indicates 1999 terminus, yellow arrow the 2017 terminus location. 

Gråfjellsbrea is an outlet glacier on the northwest side of the Folgefonna  Icefield that drains into Mysevatnet.  The 2012 Norwegian Glacier Inventory notes the glacier having an area of 8.77 square kilometers in 2002.  In 2016 the Norwegian Water Resources and Energy Directorate (NVE) reported this glacier to have the greatest retreat in 2016 of the 36 glaciers where they measure terminus fluctuations annually.  The NVE report indicates a 550 m retreat from 2002-2016.  Here we examine Landsat imagery  from 1999-2017 that indicates the formation of three new lakes at the terminus of the glacier.

In 1999 the glacier terminated in a bedrock valley east of Grafjellsvatnet.  By 2002 minor retreat had led to formation of a proglacial lake.  The snowline was quite high that year with only a few pockets of retained accumulation.  By 2016 the glacier had receded 550 m since 2002 exposing a narrow length of similar length.  The terminus did retreat significantly~100 m in 2017, the exact distance will be reported by NVE in the coming months.  

Mysevatnet is a reservoir impounded for hydropower production. The lake through a tunnel falling 825 m to produce 250 MW at the Statkraft operated Mauranger Plant  NVE (2014) reports there have been no Jokulhlaups from Grafjellsbrea.This glacier is one of many in Norway supplied by glacier runoff, where the glacier is retreating, Storglombreen is another example.

Digital Globe image of Grafjellsbrea and adjacent lakes.

Grafjellsbrea in 2006 with the lake much smaller, NVE image in the Norwegian Glacier Inventory

Storglombreen Glacier Loss, Norway

storg compare Landsat

Landsat images from 199, 2002 and 2016 comparing glaciers draining into Storglomvatnet.  Red arrows indicate 1999 terminus locations, purple dots the snowline. 

Storglomvatnet has several glacier that terminated in the lake in 1999, Storglombreen Nord, Sorglombreen Sud and Tretten. This lake is the main reservoir, 3.5 billion cubic meters that feeds the 350 MW Svartisen Hydropower plant. The lake has an elevation of 585 m, while the power plant is at sea level. Paul and Andreassen,(2009)  examined glacier area and found overall almost no areal extent change from 1968-1999 of Svartisen region glaciers, including the three examined here.  Engelhardt et al (2013), note this was due to positive trends of winter balance between 1961 and 2000, which have been followed by a remarkable decrease in both summer and winter balances leading to an average annual balance of –0.86±0.15 m w.e.a–1 between 2000 and 2010 .Since 1999 there have been changes. The Norwegian Glacier Inventory  and the online digital atlas use this 1999 imagery and indicate glacier area  for Storglombreen Sud at 15.9 km2, for Storglombreen Nord  at 41.2 km2 and Tretten-nulltobreen at 5.9 km2.

In 1999 each of the glaciers reaches the lake shore at 585 m in four separate terminus fronts. The snowline in 1999 is at 1150 m. In early August 2002 the termini still reach the lake shore and the snowline is higher at 1250 m.  In 2001, 2002 and 2003 mass balance measurements by the Norwegian Water Resources and Energy Directorate, indicate the snowline reached the top of the glacier at 1580 m. In 2016 the glacier termini no longer reach the lake shore and the snowline is again at 1150 m. It is evident in the Landsat image above that Storglombreen Sud and Tretten-nulltobreen no longer reach the lake shore, the southern most and northern most termini and arrows.  The two termini of Storglombreen Nord no longer reach the lake, though this requires higher resolution Sentinel 2 images to illustrate. Retreat of Tretten-nulltobreen from 1999-2016 has been 200 m, of Storglombreen Sud 250 m and of Storglmbreen Nord 100-200 m. There was limited calving into the lake and the retreat from the lake will not significantly alter the retreat rate of the glacier.  The high snowlines of recent years will lead to continued retreat. The retreat here is much less than on Engabreen which shares a divide with Storglombreen Nord, Flatisen  or Blåmannsisen.

svartisen west

Map of the glaciers in the region from the Norwegian Glacier Inventory online map application, based on 1999 images.

storg 2016 sentinel

Sentinel 2 image of the glaciers of Storglomvatnet from August 2016.  Notice that none of the termini reach the lake shore. 


Winsvold, Andreassen and Kienholz (2014)

Engabreen Glacier, Norway Retreat

Engabreen is an outlet glacier of the Svartisen ice cap in northern Norway. It has an area of 40 km2. Most of the area lies between 1200 and 1450 m the high plateau of the ice cap. This glacier has been the focus of attention from the Norwegian Water Resources and Energy Directorate (NVE) for over 50 years. 

engabreen ge

Google Earth image of Engabreen Glacier, 2014. 

NVE maintains the most extensive and detailed glacier monitoring network in The NVE annual mass balance measurements on Engabreen indicate that winter snow typically accumulate 3 m of water equivalent on the ice cap. This amounts to 5-7 m of snowpack as the melt season begins in May. The glacier terminus descends from the ice cap down nearly to Svartisvatnet, a lake at 7 m. At the terminus annual melting is 12 m. The rivers from the northern and eastern side of Svartisen were regulated in the 1990’s for hydro power production by construction of a tunnel system partly underneath the glacier. Today about 60% of the potential runoff of the Engabreen is captured and sent through a bedrock tunnel to the hydropower facility. During completion of this tunnel access to the glacier base was opened. Today there is the world’s only ongoing subglacial laboratory here The melt water from Engabreen is collected into this tunnel system at 620 m a.s.l. underneath 200 m of glacier ice in the ice fall.  The sub-glacial blog has further details of this mainly winter research location

Late in the 18th century Svartisvatnet,the lake below the terminus, started to appear as the glacier retreated upvalley. In 1903 regular length change observations were initiated, a small advance ensued until 1910. By 1931 the glacier retreated 100 meters, and the glacier tongue was thinning. During the next decade calving led to rapid retreat revealing the rest of Engabrevatnet. This period of  retreat ended in 1965, Engabreen  advanced with three different pulses ending in 1971, 1984 and 1999, the last pulse reaching to within a few meters of the lake shore.Below are pictures from the NVE taken in 2000 and 2008 of Engabreen, note the large contraction of the terminus area.   This is further illustrated in Landsat images below. engabreen 2000-2008

NVE images of Engabreen Glacier

From 1990 the glacier ended at the red arrow before advancing by 1999 to the purple arrow.  Retreat followed to the yellow arrow in 2015, this is a 350 m retreat.  From 1999-2013 NVE amual terminus assessment indicates a retreat of 317 m.. At the green arrow the width of the glacier declined from 475 m in 1999 to 325 m in 2015.  At the orange arrows thinning is evident higher on the glacier as bedrock areas have expanded.  The snowline in 2014 is above these areas and is at all but one in 2015. This thinning suggest retreat will continue. The 2015 position is its point of furthest retreat since the Little Ice Age. The recent retreat indicates a recent trend of negative mass balance on the glacier. There is excellent flow off the ice cap that has persistent and consistent snowcover indicating this glacier will survive current climate.  This is also leading to the retreat of Storglombreen  and Flatisen from the same ice cap

engabreen 1990

1990 Landsat image

engabreen 1999

1999 Landsat image

engabreen 2014

2014 Landsat Image

engabreen 2015

2015 Landsat image


Langfjordjokulen, Norway Retreat-Thinning

Langfjordjokulen is in the Finnmark region of northern Norway. This is a plateau glacier with a valley glacier extending east toward Langfjordhamm. The Norwegian Water Resources and Energy Directorate has monitored the length change and mass balance of this glacier from 1989-2014. The mean mass balance has been significantly negative averaging -0.7 m/year, with every year being a net loss since 1997. This is no way to sustain a glacier or a business. Retreat of the glacier has averaged 27 m/year from 2000-2014. Here we examine Landsat imagery of the glacier from 1989-2014 to identify key changes.
langford ge

In 1989 the glacier terminated at the red arrow, two glacier tongues descended from the plateau and merged below the purple arrow indicating the northern arm. A ridge extends some distance into the main plateau separating the catchment areas of the two glacier tongues, marked by the letter A.  The glacier is mainly snowcovered in August 1989 and had a negative mass balance of -0.55 m.  In 1994 the two glacier tongues are still joined,  and snowcover is extensive, retreat is limited since 1989.  In 2000 snowpack is quite limited at the time of the image, the two glacier tongues have separated and the main terminus has retreated from the red arrow. In 2014, Norway’s warmest year, snowpack retained is minimal, the glacier mass balance reported by NVE to the World Glacier Monitoring Service was -0.78 m, an improvement over the record low year of 2013, -2.61 m.  A new area of bedrock is emerging near Point A, due to glacier thinning in the plateau area which should be the accumulation zone.  The two glacier tongues are further separated.  The main terminus is at the yellow arrow a retreat of 600-700 m since 1989.  This retreat rate is faster than other periods since 1900. The retreat is similar to that of  the larger nearby Strupbreen and Koppangsbreen.  The cumulative mass loss experienced by Langfjordjokulen is a significant portion of its total volume, 25-35% assuming typical glacier thickness for a glacier with this area.  In 2014 NVE reported In Norway terminus fluctuation data from 38 glaciers  with ongoing assessment indicate, 33 retreating, and 3 were stable.  The average terminus change was -12.5 m

langford 1989
1989 Landsat image

lanford 1994
1994 Landsat image

langford 2000
2000 Landsat image

langford 20142014 Landsat image

Spørteggbreen Separation and Retreat, Norway

Spørteggbreen is a small ice cap just east of Jostdalsbreen, Norway’s largest ice cap.  The Norway Glacier atlas chronicles the area of the 10 glaciers that comprise the ice cap at 23.8 square kilometers in 2006 (Andreassen and Winsvold, 2012). The Norwegian Water Resources and Energy Directorate (NVE) has an excellent glacier monitoring program that monitors 10 glaciers that drain Jostedalsbreen from 2008-2013 the net change was retreat on all 10. This is exemplified by Tunsbergdalsbreen. In 2014, 33 of 38 glaciers observed in Norway retreated and 5 did not change. Laumann and Nesje (2014) examined Spørteggbreen during the Holocene.  They noted the glacier disappeared from 7300 years before present and reformed approximately 5400 years before present.  Their model simulates minor changes from 2011 to 2050. Here we focus on changes to the southwest side of this ice cap using Landsat imagery from 1988-2014 and implications for the near future.

sporteggbreen 2010Norway Glacier atlas image looking southwest toward Jostdalsbreen.  The foreground is the main Sporteggbreen, the new lake is in midground and then the separated southwest extension.  There is no retained snowcover evident on the southwest extension and it is thin.

In 1988 at the southwest side of Spørteggbreen the main ice cap joins the southwest extension of the ice cap in a small lake at the red arrow. At the purple and yellow arrow are small peripheral proglacial lakes. The green arrow indicates a narrow section in the southwest extension. In August 1998 there is substantially more snow and lake ice, which makes identification of change difficult. In 2010 the southwest extension is well separated by a lake from the main ice cap, red arrow. This lake is m across, with the glaciers reaching the shore at both ends. The lakes at the purple and yellow arrow have also expanded. The width of the narrow section of the southwest extension has narrowed from 600 m to 300 m. In 2014 the main Spørteggbreen Ice Cap no longer reaches the eastern shore of the lake, red arrow. The lake is 750 m across. The lake at the purple arrow is now equivalent to the glacier that ends in the lake and is m long. The width of the glacier at the narrow section is down to 200 m. The most noteworthy item is that in this mid-September image the ice cap has 25% of its area still covered in snowpack, note the areas marked with pink letter A. The other areas are either firn from previous years or bare glacier ice.  By the end of the melt season at the end of the month this will likely be closer to 20% . Remember a glacier typically needs 55-65 % snowcover to be have an equilibrium balance.  This will lead to a large negative balance and thinning right to the top of the ice cap. This was the case in 2013 as well. Hence, the Spørteggbreen Ice Cap is currently experiencing significant volume and area losses. The retreat is not as large in terms of distance as on nearby Tunsbergdalsbreen.

sporteggbreen 1988a


1988 Landsat image.

sporteggbreen 1998

1998 Landsat image

sporteggbreen 2010a

2010 Landsat image

sporteggbreen 2014a
2014 Landsat image