Freemanbreen, Svalbard Retreat Leads to Island Formation

Freemanbreen in 1990 and 2022 Landsat images.  Both are years with limited retained snowcover (S) and some area of retained firn (F). The glacier has retreated from a new island that had formed at Point D. At Point A-C glacier melt and resultant thinning has exposed and expanded bedrock areas.

Freemanbreen is the primary southern outlet glacier of the icecap that dominates Barentsøya, Svlabard. Here we examine Landsat imagery from 1990-2022 to illustrate the the impact of climate change on this glacier. Dowdeswell and Bamber (1995) report that Freemanbreen last surged in 1956 and has retreated since, and that most of its bed is above sea level. Morris et al (2020) note a thinning rate of -0.6 m/year for the area from 2011-2017 that is driven by atmospheric temperature and sea surface temperature warming.

In 1990 Freemanbreen experienced a year of extensive melt with limited retained snowpack (S), there is some retained firn which does retain some percolating meltwater from the snowpack. The glacier extended beyond its fjord ending in a convex tidewater front in Freeman Sound. By 2010 the glacier had retreated into the fjord and was pinned on an island in the center of the fjord. By 2013 the glacier had pulled back from the island and the terminus has since developed a concave terminus front. In 2022 the glacier has retreated 800 m from the island  (Arrow-Point D) and 1.8 km from its 1990 position. The tidewater front has been reduced from 2.8 km to 1.3 km. The reduction in calving has not offset the increase in glacier melt resulting in continued retreat. The surface melt has led to surface thinning and the expansion or exposure of bedrock areas amidst Freemanbreen at Point A-C. In 2022 the glacier experienced another summer of extensive melt, likely the most extensive melt in the region in at least the last 50 years (Climato-Liege University).  This left the glacier largely bare of snowpack, with less than 5% snowcover in the area above 500 m near Point C and limited retained firnpack from previous years note NW of Point B. The ice cap summit is in the 600 m range. This loss is similar but not as complete as obseved on the ice caps of Edgeøya.

Left image aerial photograph from TopoSvalbard, at right Sentinel 2 image from 2022. Island indicated by arrow.

Freemanbreen surface conditions in Sentinel image from 8-19-2022, snow cover (S), Firn Cover (F.)

North Cascade Glacier 2022 Initial Observations-39th Field Season

field team 1

2022 North Cascade Glacier Climate Project Field Team

Science Director: Mauri S. Pelto, mspelto@nichols.edu
Art Director: Jill Pelto, pelto.jill@gmail.com

For the 39th consecutive summer we were in the field to measure and communicate the impact of climate change on North Cascade glaciers. We completed detailed measurements on 10 glaciers, three of which are part of the World Glacier Monitoring Service reference glacier network (42 glaciers globally), which have 30+ consecutive years of mass balance observations. NCGCP was founded in 1983 to identify and communicate the response of North Cascade glaciers to regional climate change. We are a fieldwork-based project with a focus on measuring changes in mass balance, glacier runoff, and terminus behavior. The project has an interdisciplinary scope — collaborating with a range of natural scientists, artists, journalists, and conservationists.

This winter snowpack remained below average until a late season surge from April into May.  Snowpack was 90% of the mean (1977-2021) on April 1% and 110% of the mean on May 10.  The month of May and June had below normal temperatures leading to an above average glacier snow cover as June ended. July and August were exceptionally warm at Heather Meadows  (4200 feet) average July and August maximum temperature is 19.2 C, this year 20 days reached or exceeded 5 C above this temperature in July and August 2022. At Stevens Pass (4000 feet) average July and August maximum temperature is 21.4 C, this year 24 days reached or exceeded 5 C above the temperature in July and August 2022. The average July-August temperature at the Stevens Pass and Lyman Lake sites was the highest since records began in 1990.

The result is that glacier snowcover rapidly melted during the July-August period, which is resulting in significant mass losses for North Cascade glaciers that continue to thin, retreat and lose volume. The climate stress is evident on the glaciers, but also in the alpine vegetation and alpine aquatic ecosystems.

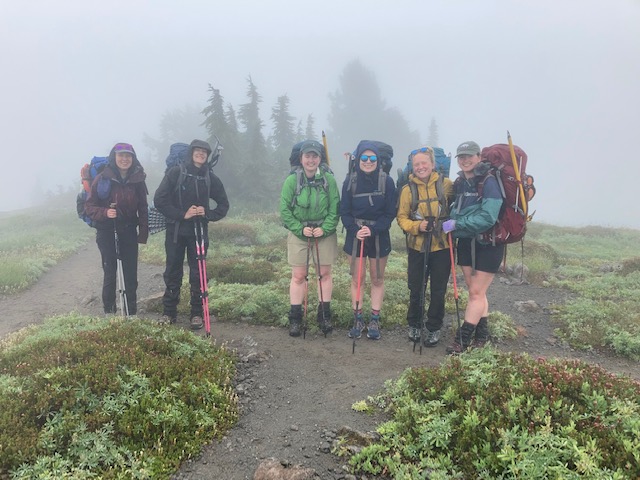
Field team backpacking around Blanca Lake at our first field site.

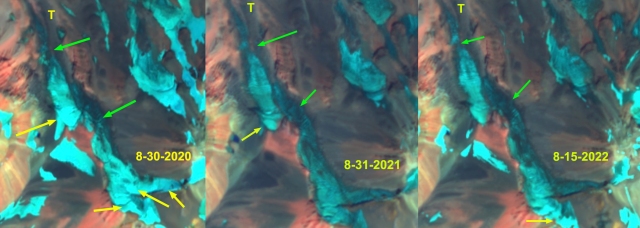
Columbia Glacier with the 1984 terminus position, note the glacier profile now descends from west side (left) to east side (right) of the glacier. The glacier has retreated 270 m since 1984. Note steep tongue extending across entire cirque valley in 1988 lower image.

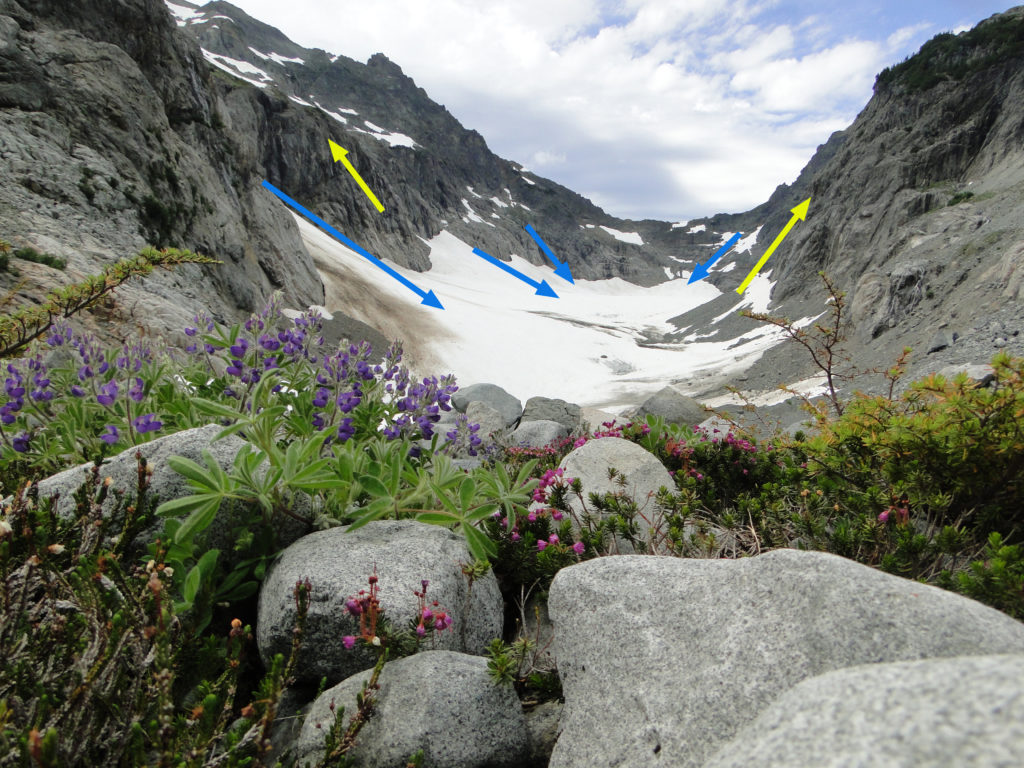
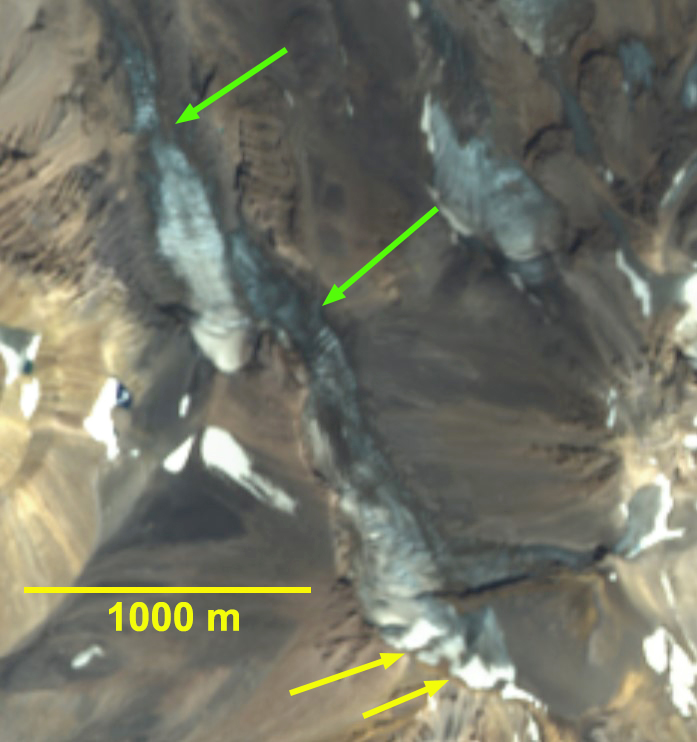
Columbia Glacier indicating the avalanche fans that now provide most of the accumulation to the glacier at the blue arrows. The yellow arrows indicate avalanche slopes that are no longer key feeders resulting in marginal thinning and recession. These locations or reduced avalanching have resulted from the source area slopes having lost their perennial snow and ice, which must be filled each winter before a slide can occur. Snowpack in the avalanche fans exceeds 3 m, while outside of the avalanche fans averaged 1.8 m on Aug. 1-2, 2022.

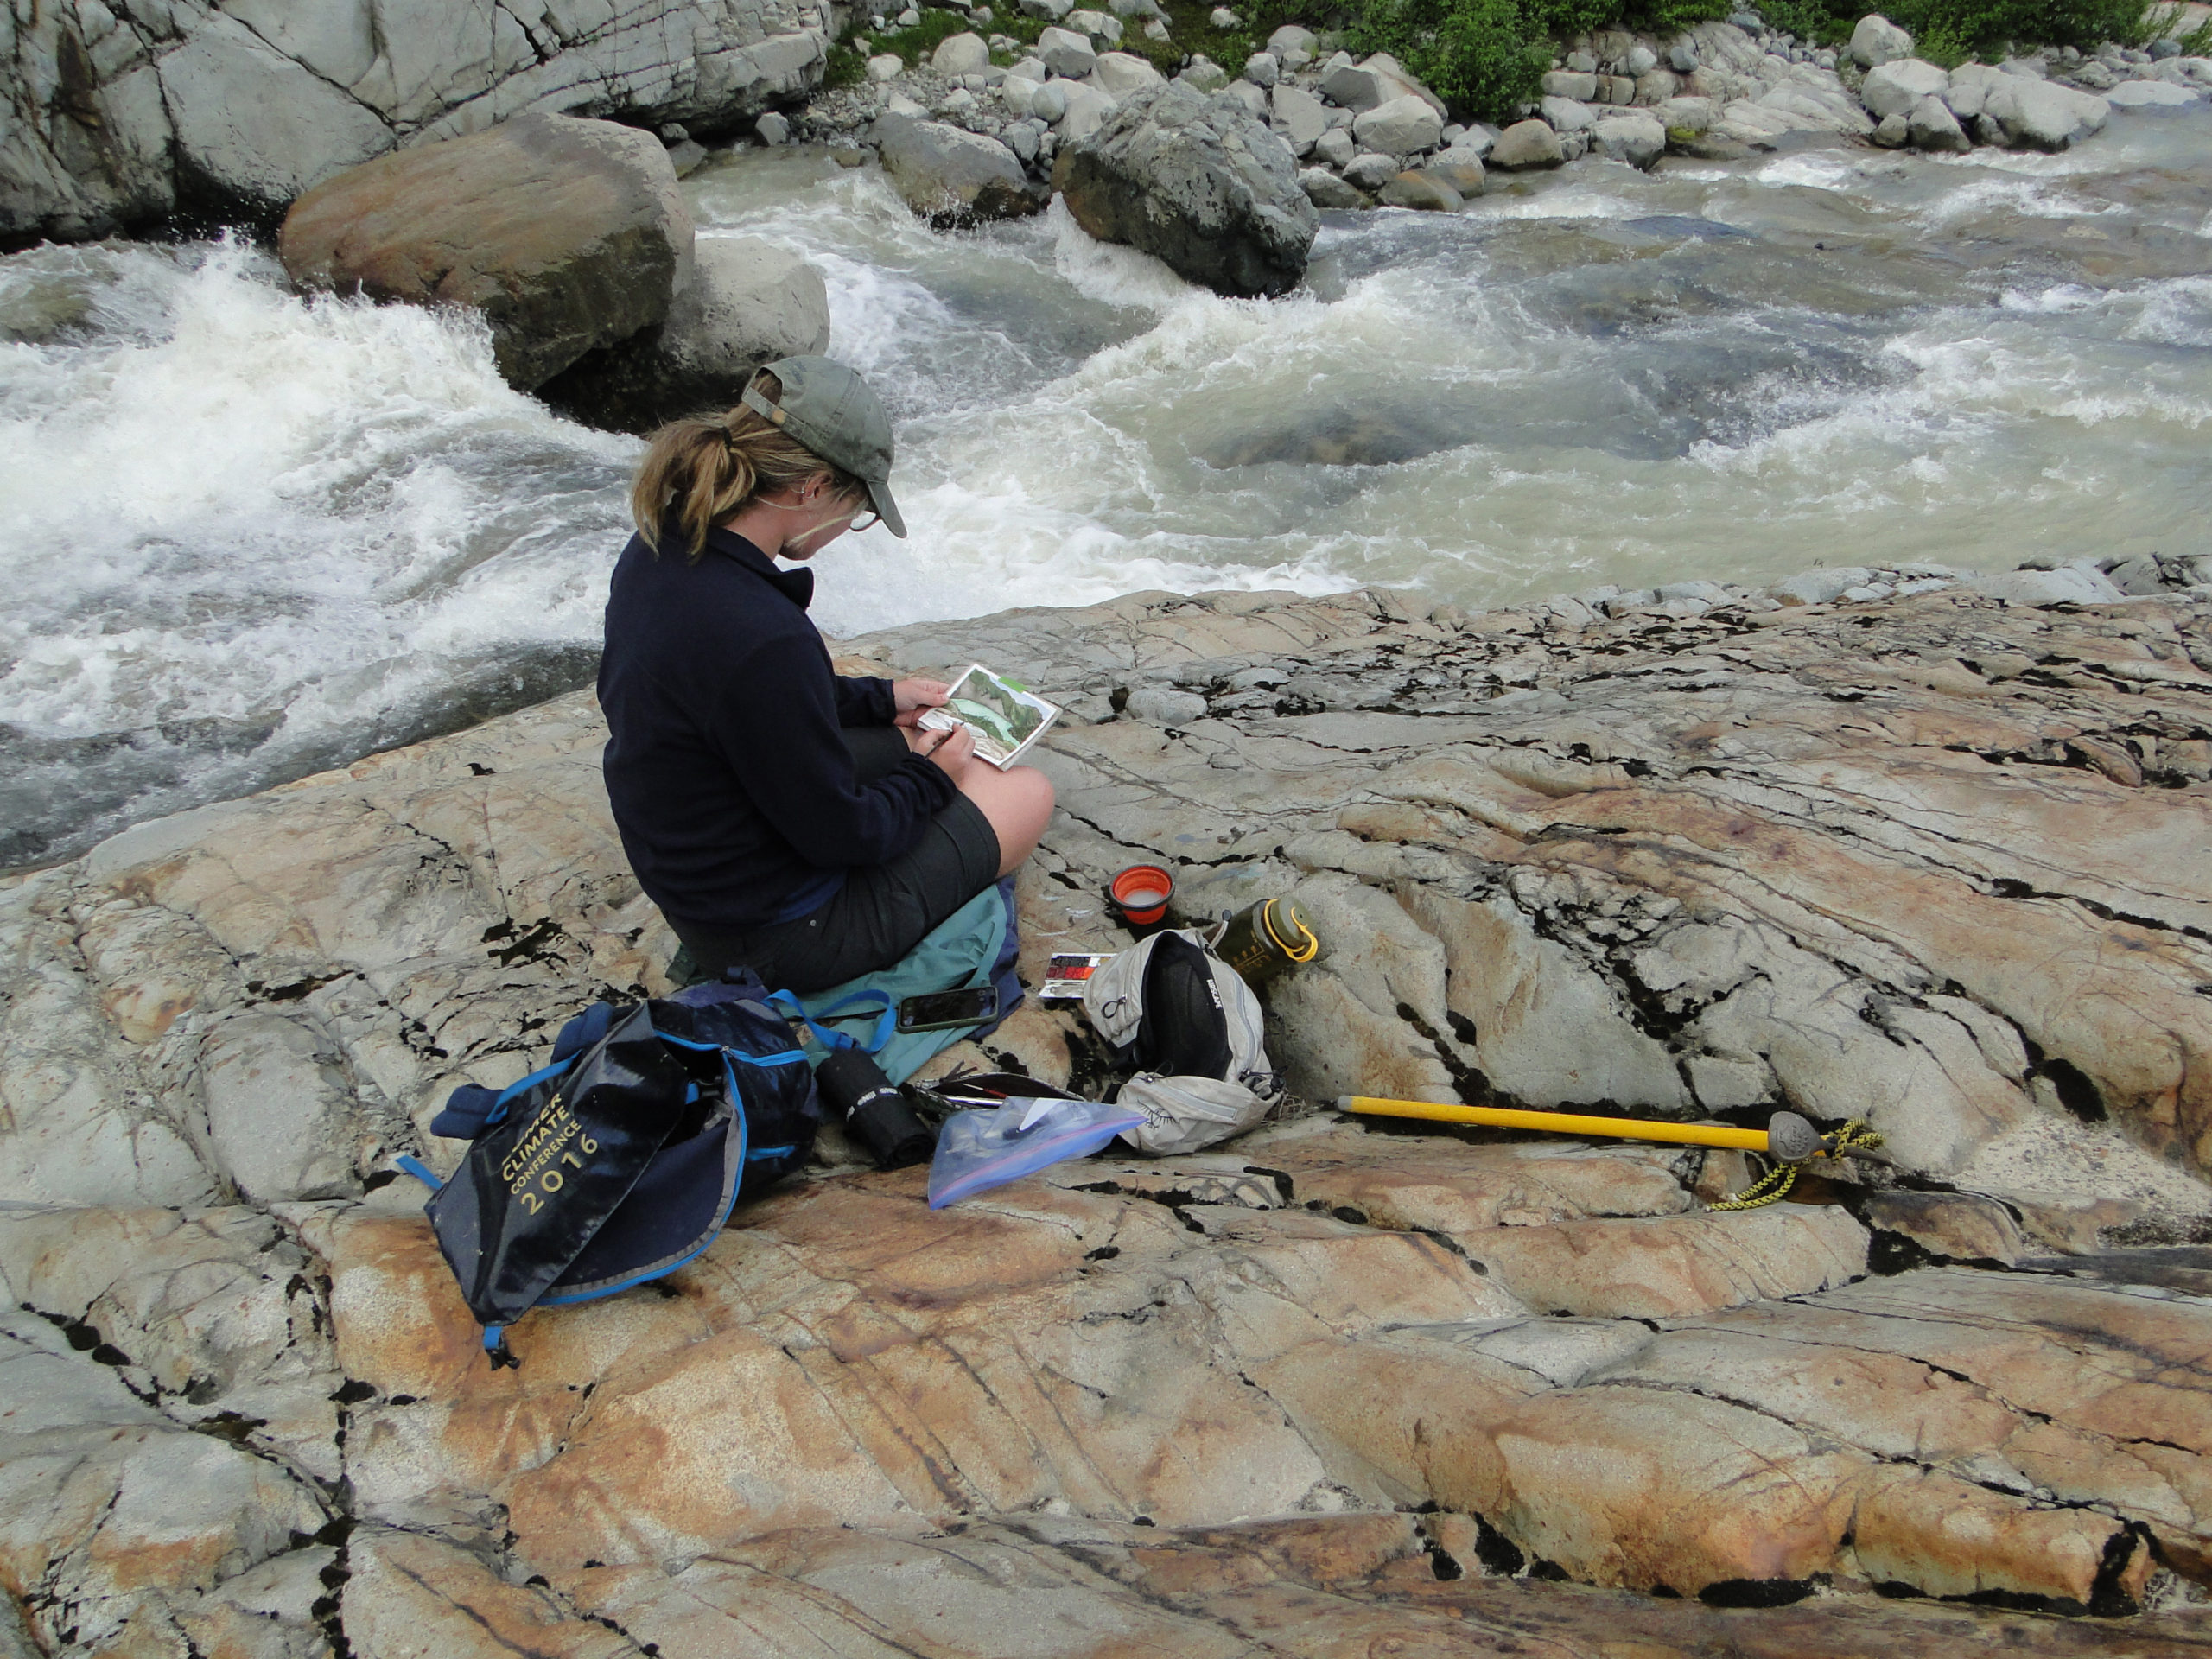
Jill Sketching Blanca Lake and Troublesome Creek draining from Columbia Glacier.

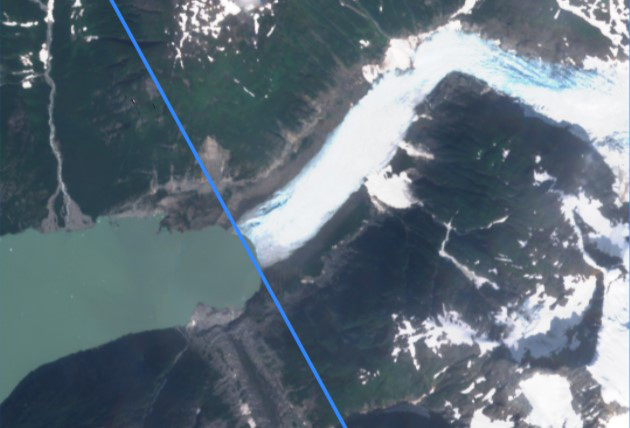
Braided stream issuing from the the rapidly retreating and thinning Sholes Glacier on the north flank of Mount Baker. Retreat since 2015 has been 90 m, with 225 m since 1984.

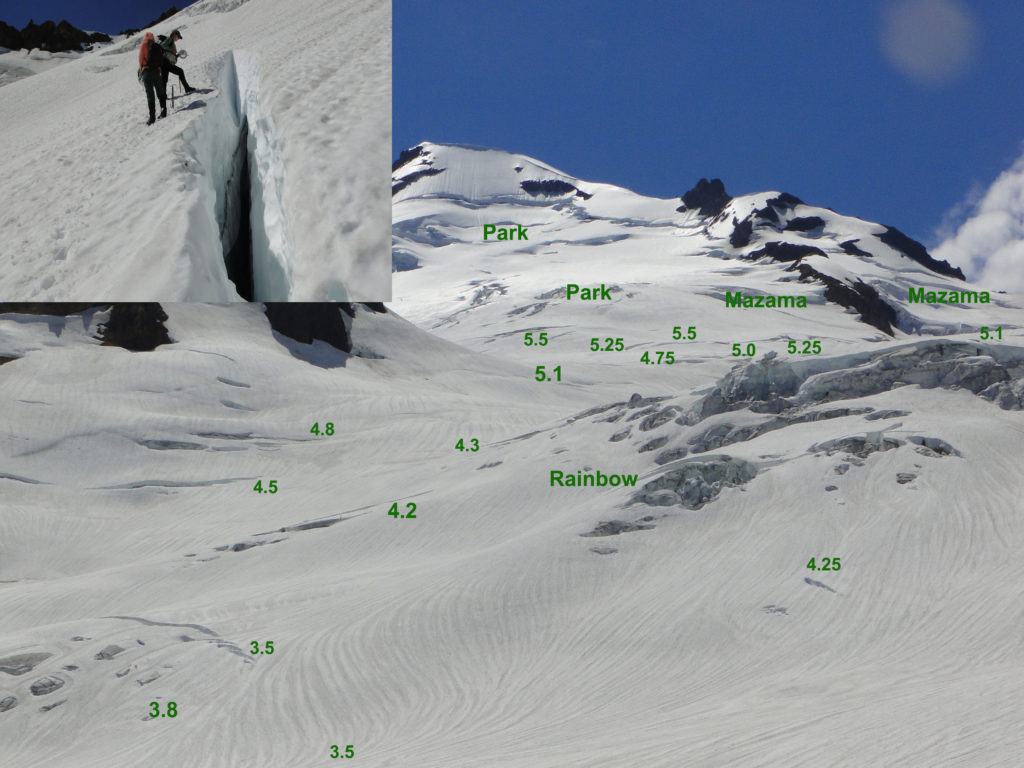
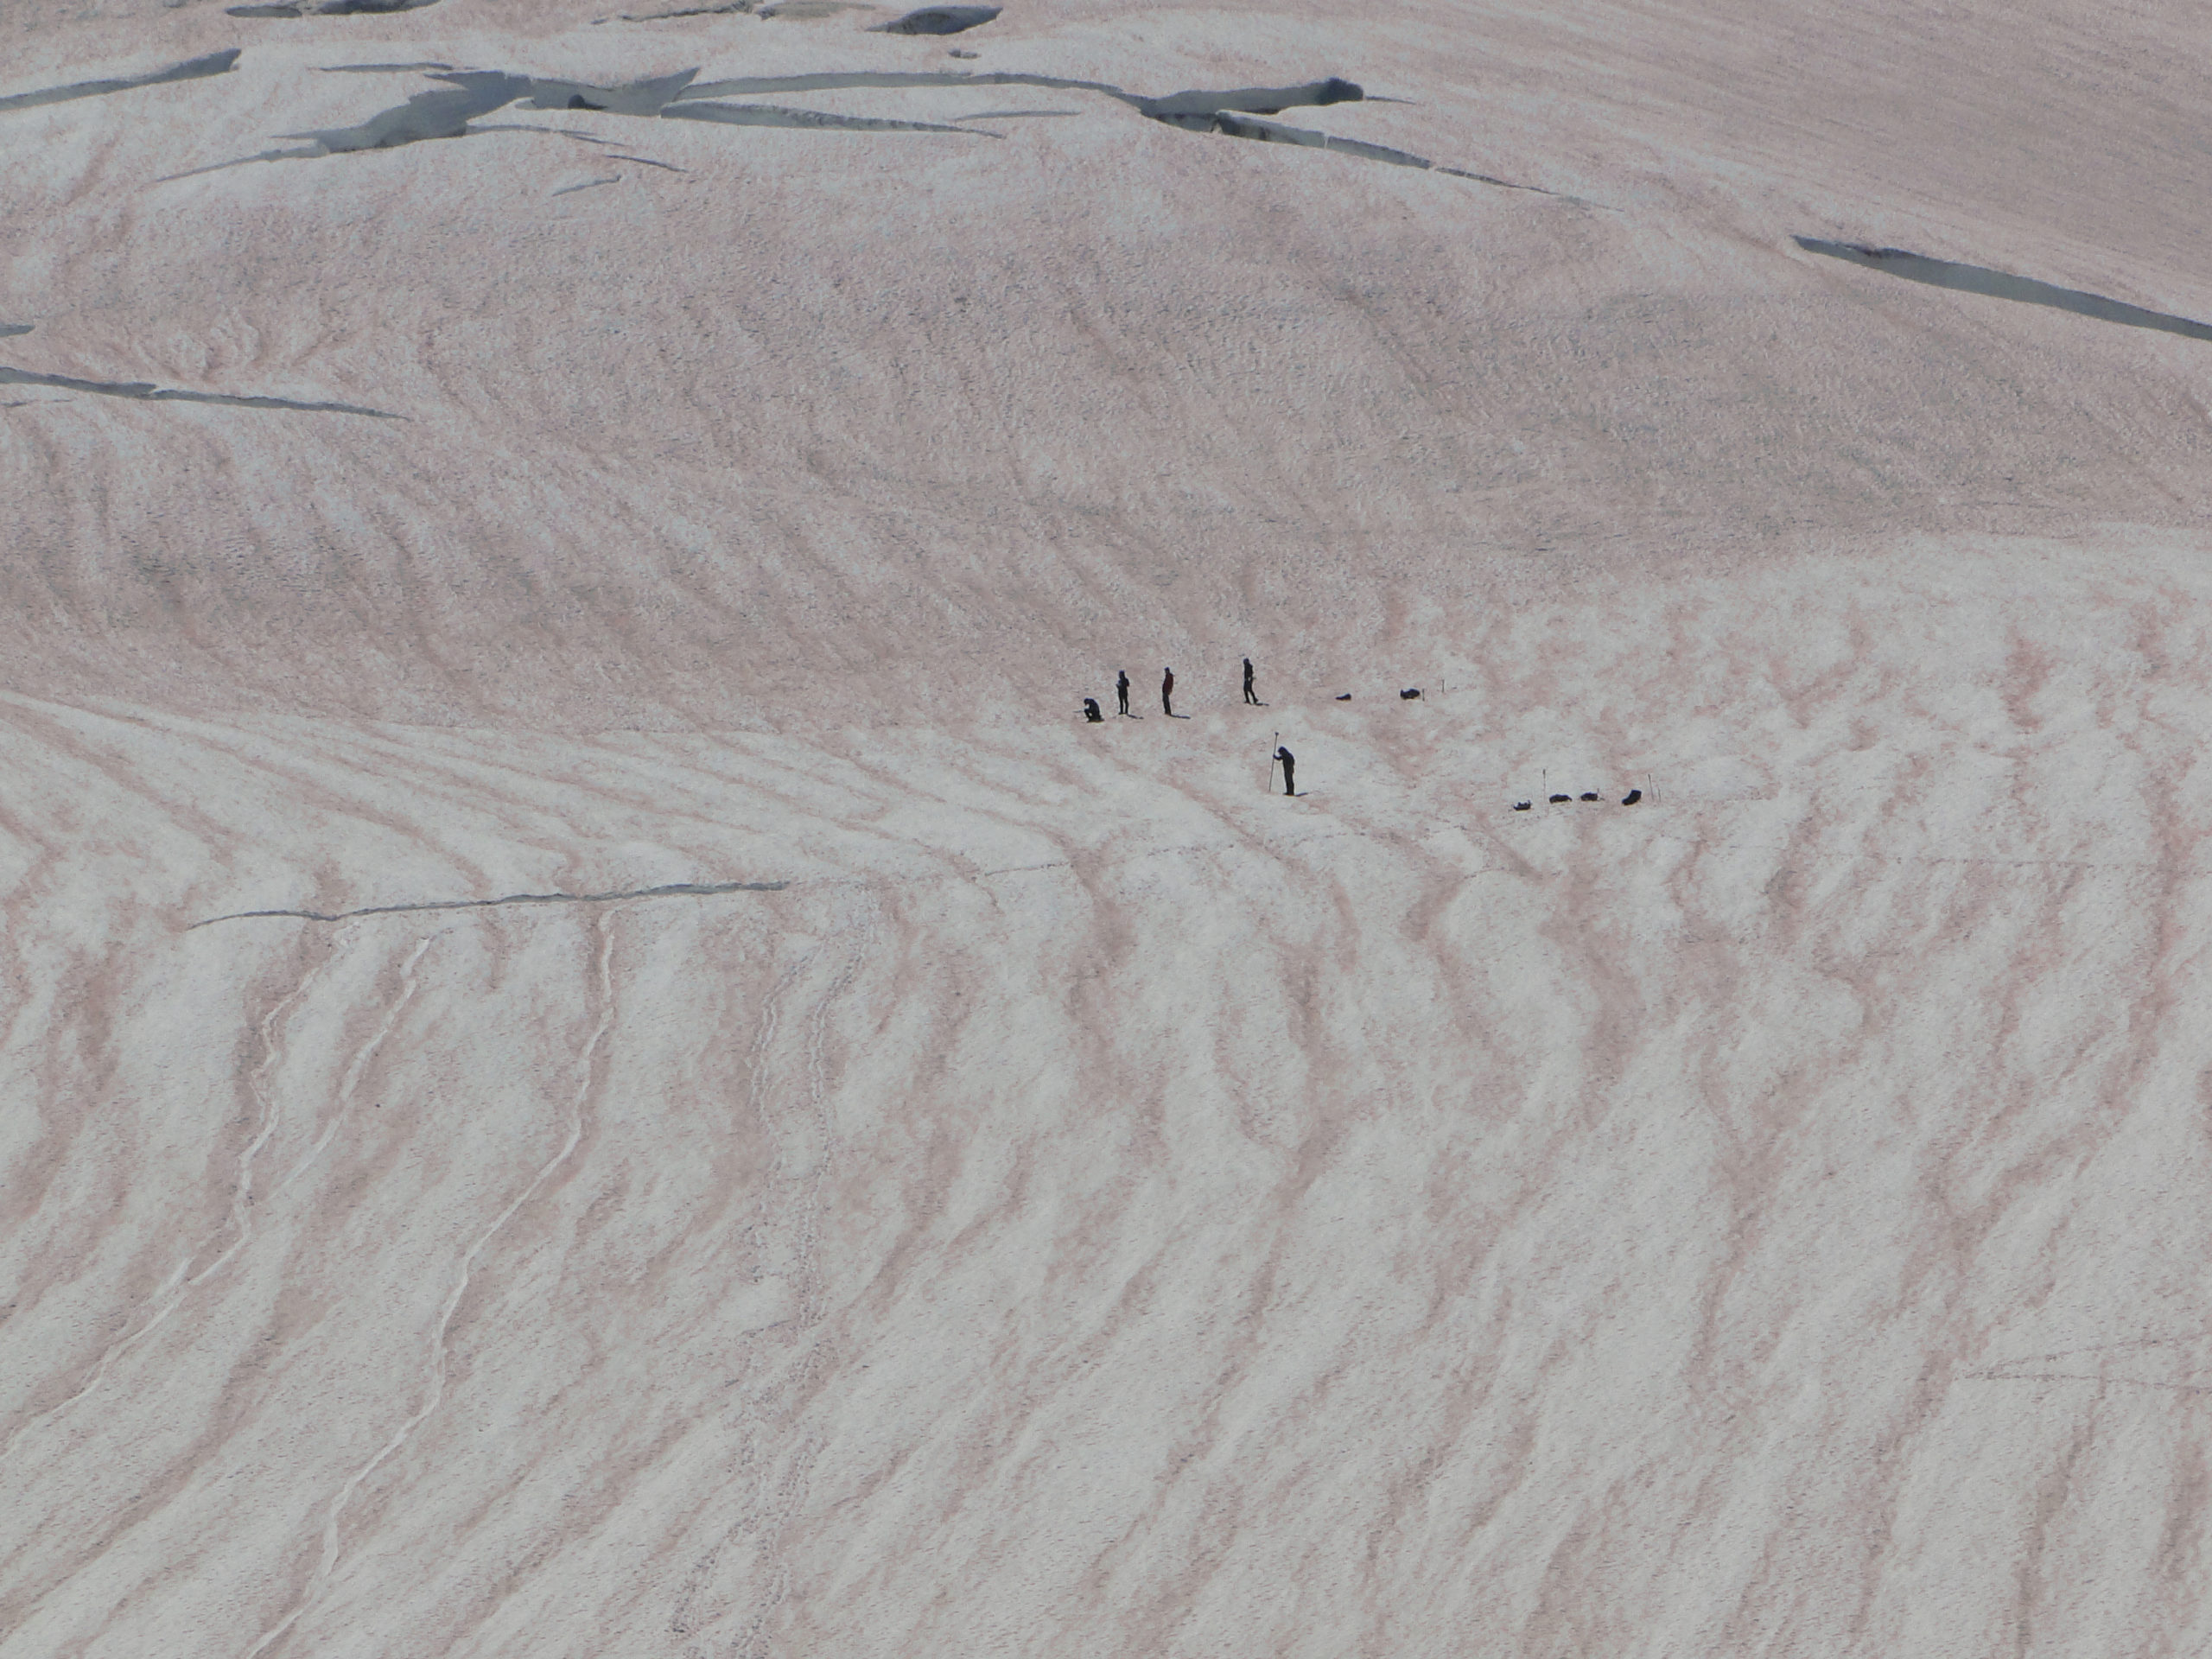
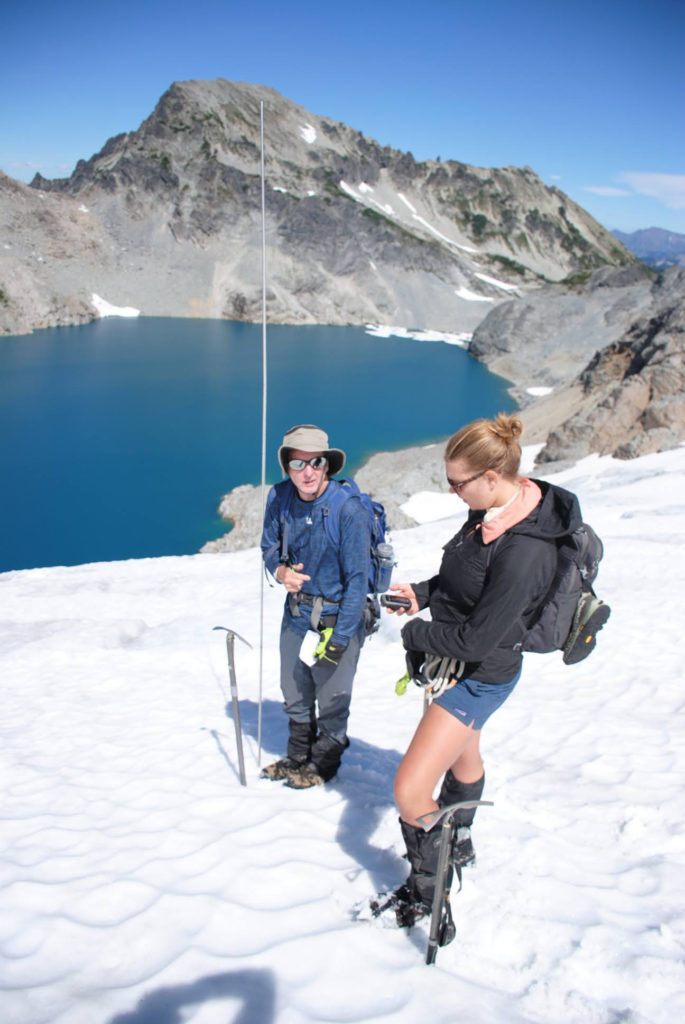
Snow depth measurements  in meters on Rainbow Glacier using crevasse stratigraphy, adjacent Park and Mazama Glacier drain the upper part of Mount Baker. Average depth at 2000 m was 5.25 m, 3.15 m water equivalent. The terminus of the glacier continues to retreat rapidly, but was buried by avalanche debris at the time of our survey in 2022.

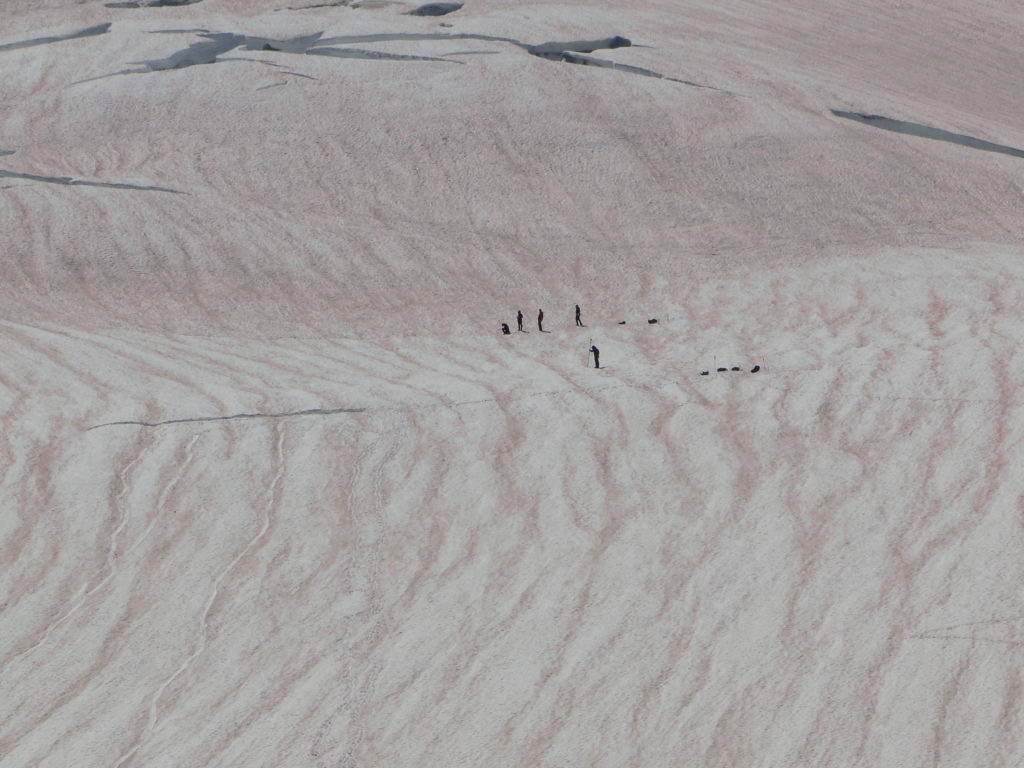
Alia Khan’s Western Washington University team assessing a red algae zone on Rainbow Glacier, we led them through the icefall to this location, where they sample impurities on the glacier surface and relate that to remote sensing products.

Jill’s sketch of Rainbow Glacier and Mount Baker from trail above Lake Ann.

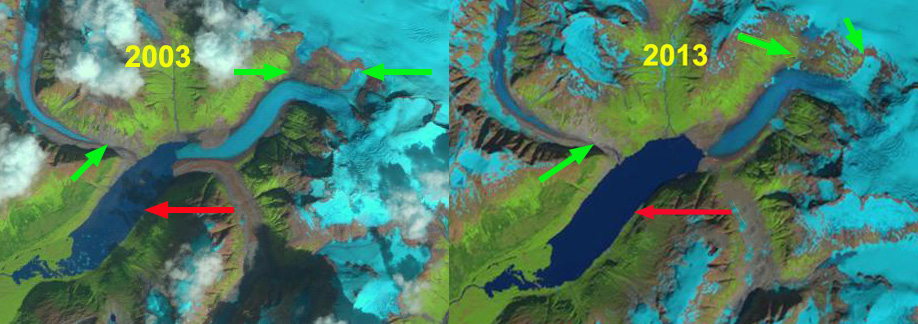
Lower Curtis Glacier indicating recession since 1985. The glacier has thinned considerably in the lower section since the 2003 image below.

Navigating through the icefall region on Lower Curtis Glacier where we are mapping snow pack depth and crevasse depth. 

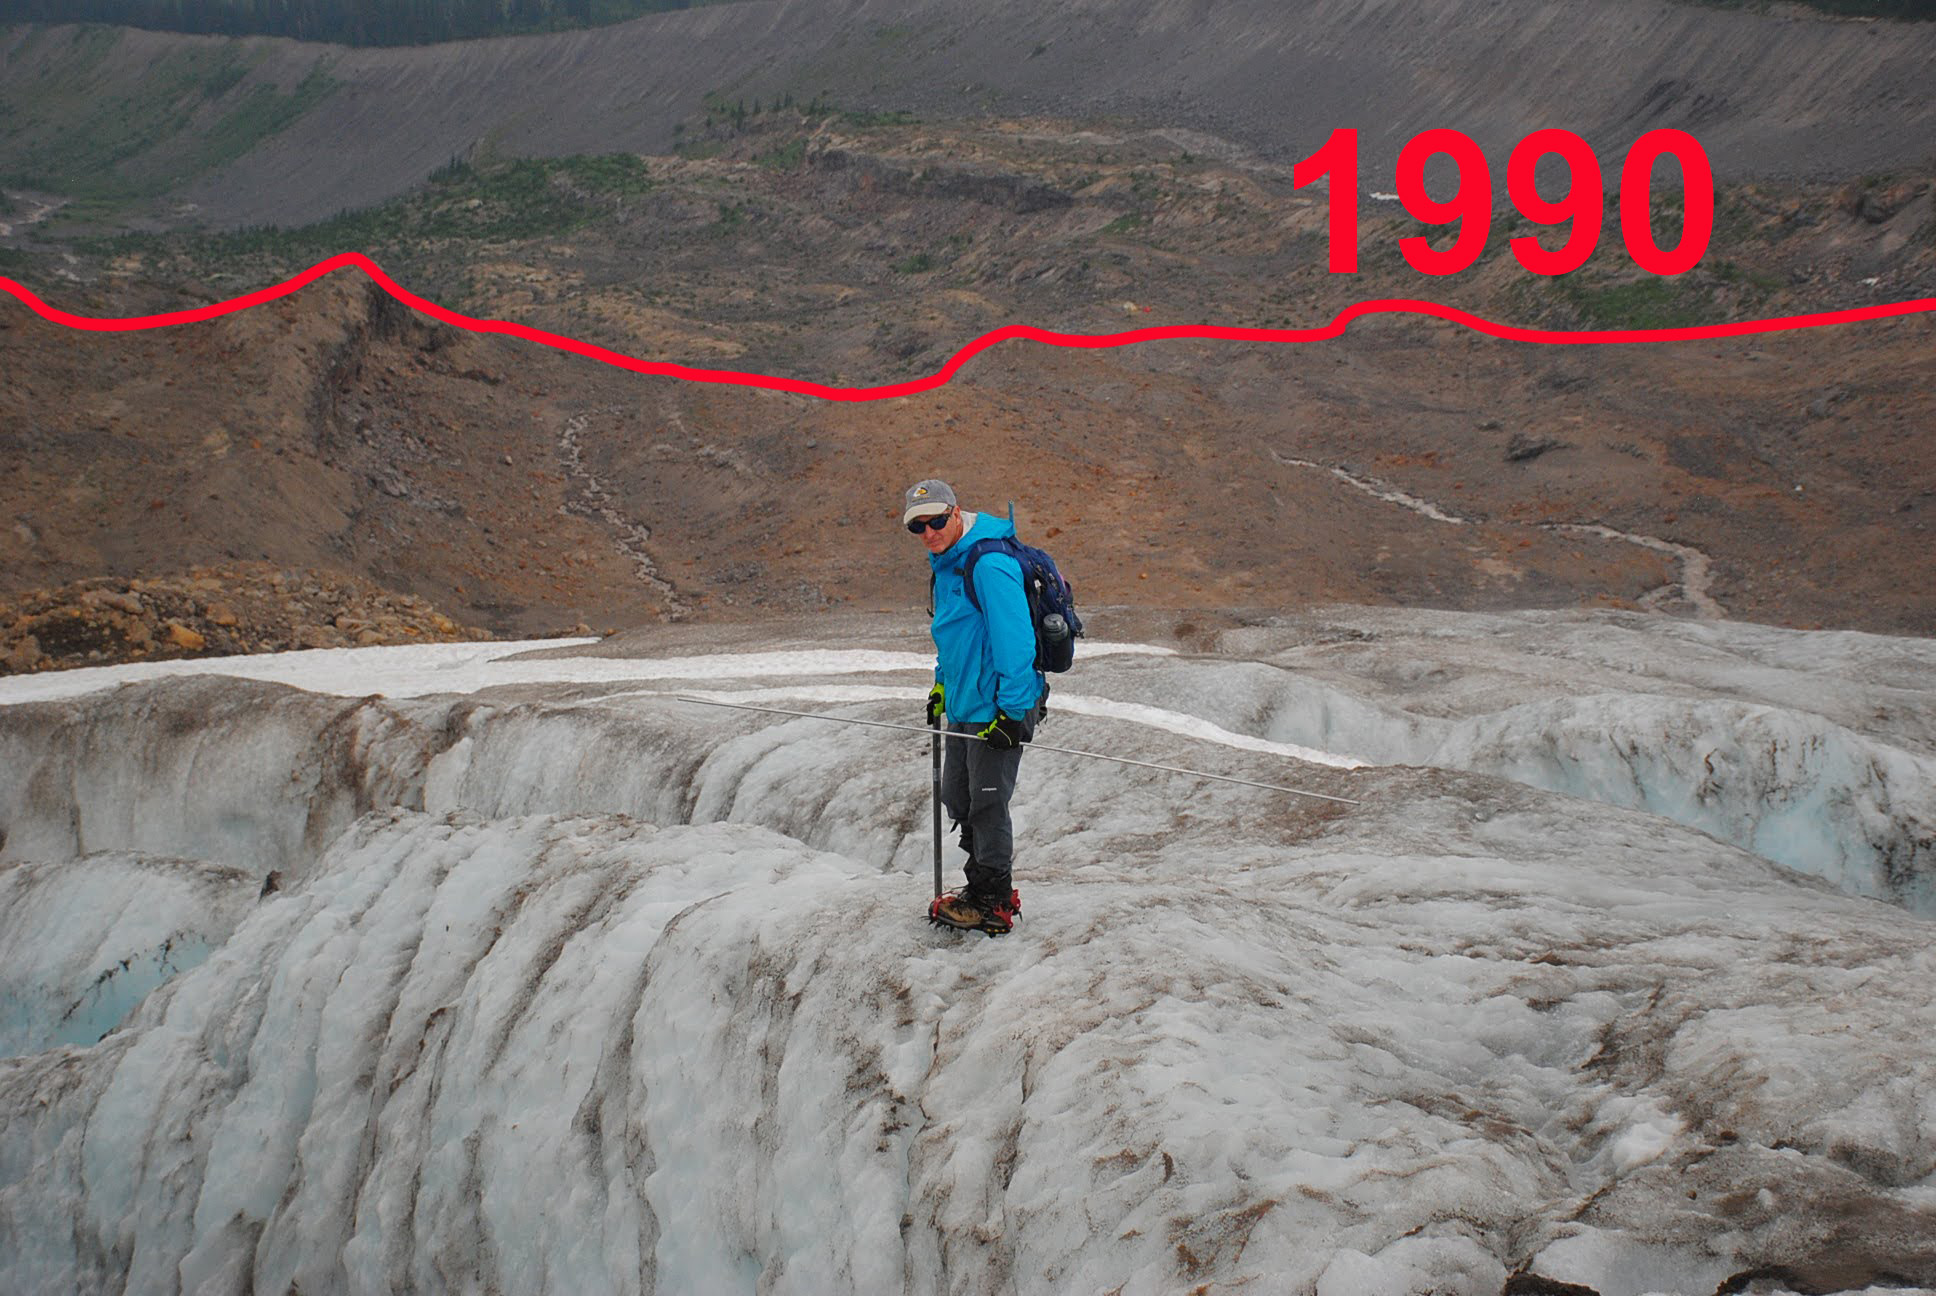
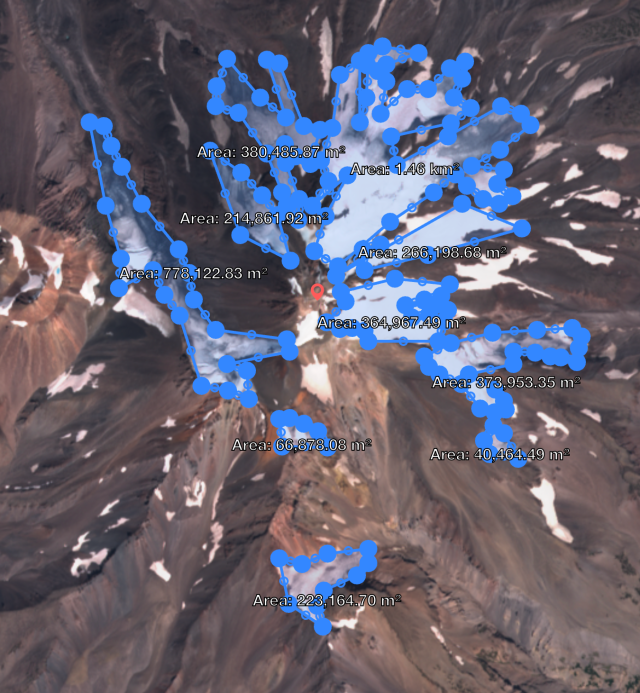
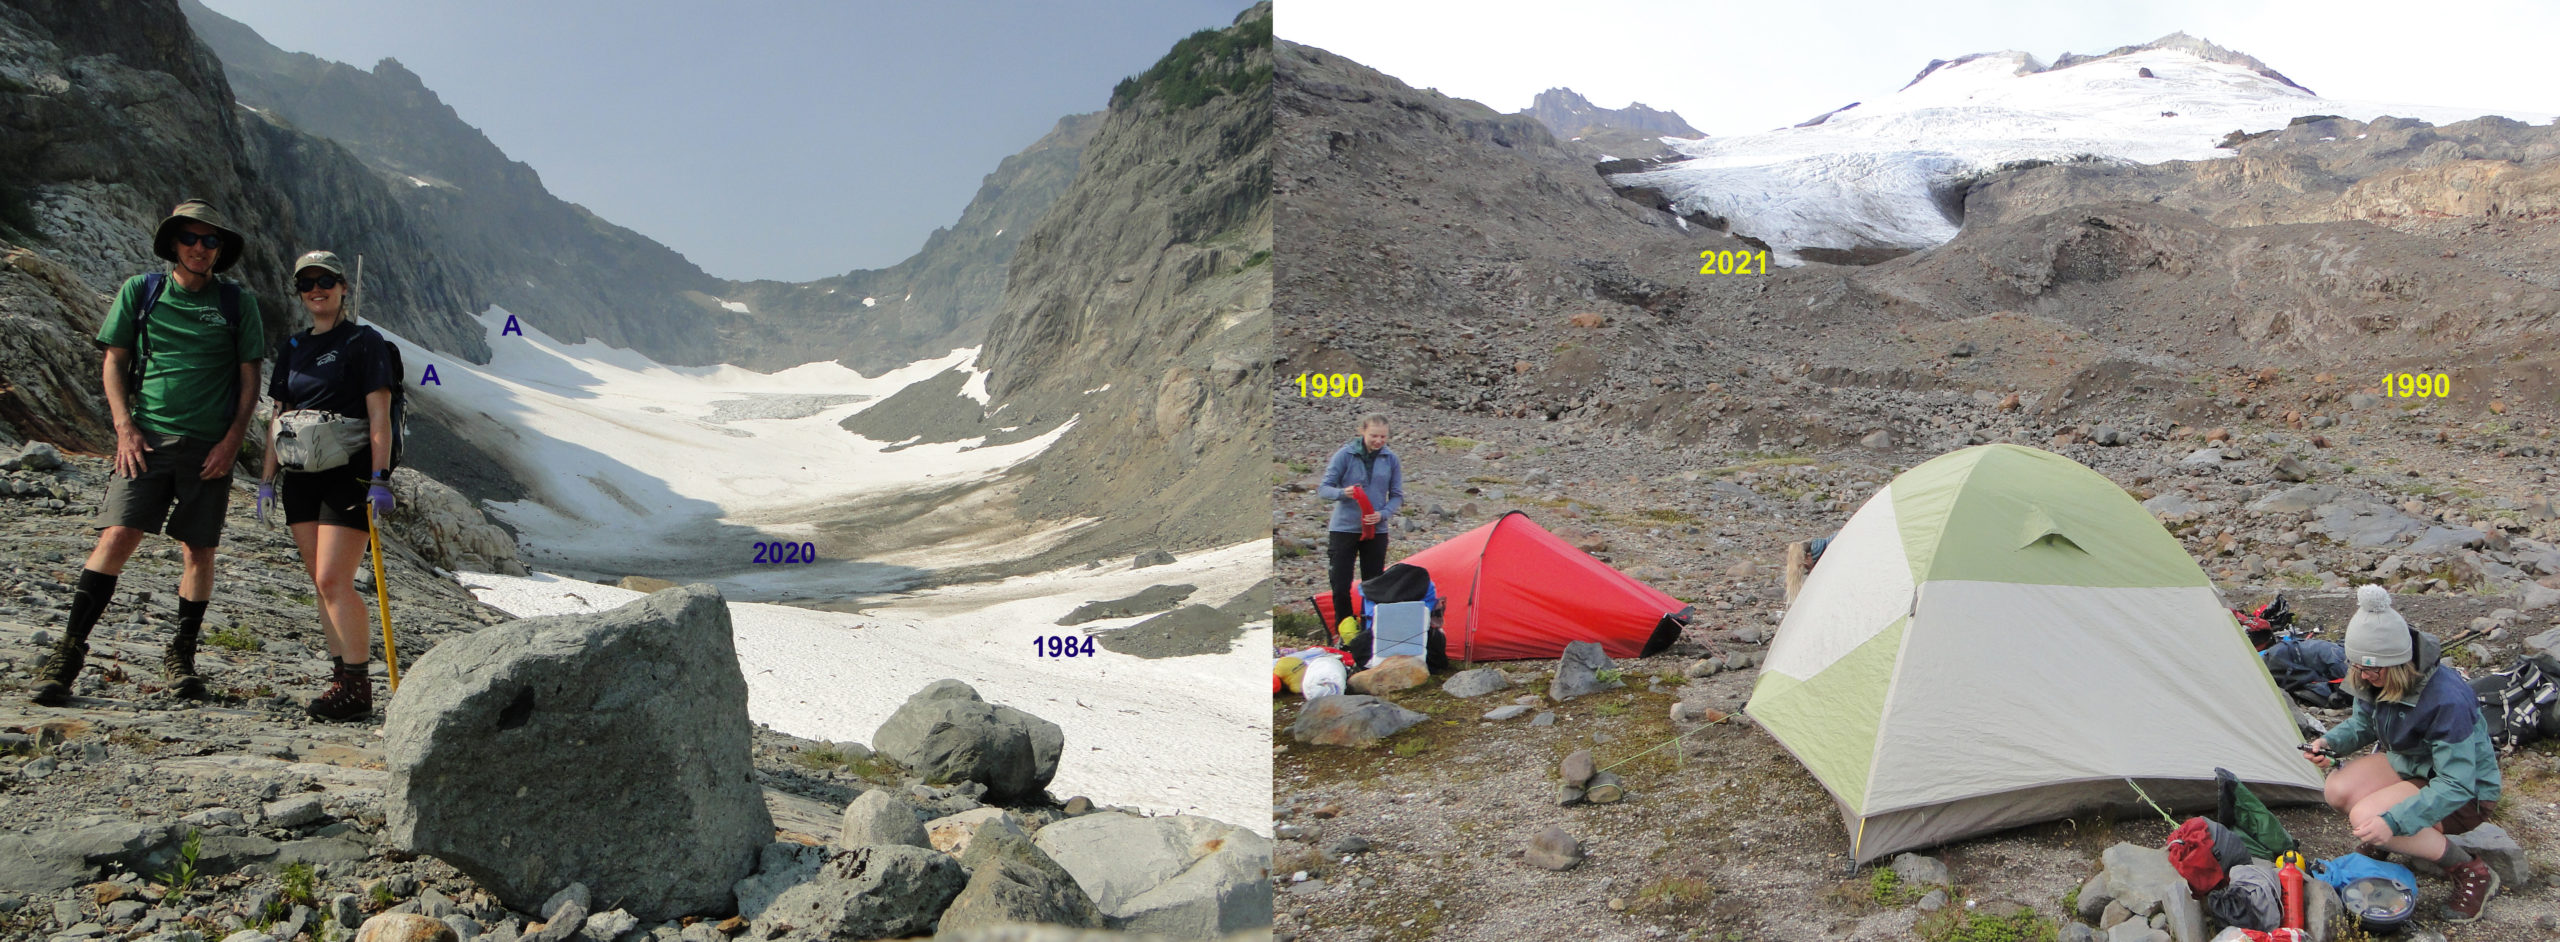
Deglaciated terrain since 1990 below Easton Glacier. We mapped this at 0.18 square kilometers in 2022.

We have observed crevasse depths for a decade and have seen both their number and depth decline in icefalls on Easton and Lower Curtis Glacier due to glacier thinning and reduced velocity. Deepest crevasses are at the top of the convex slope change, 25-30 m deep.

Claire Giordano painting Easton Glacier crevasse ‘blues’ at top of lowest icefall.

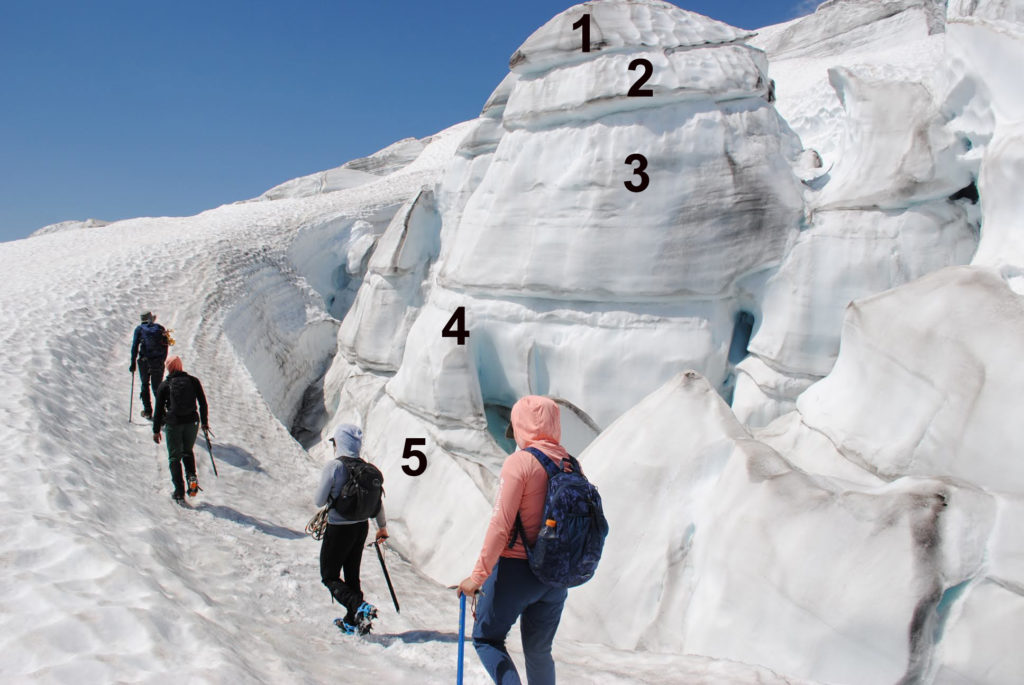
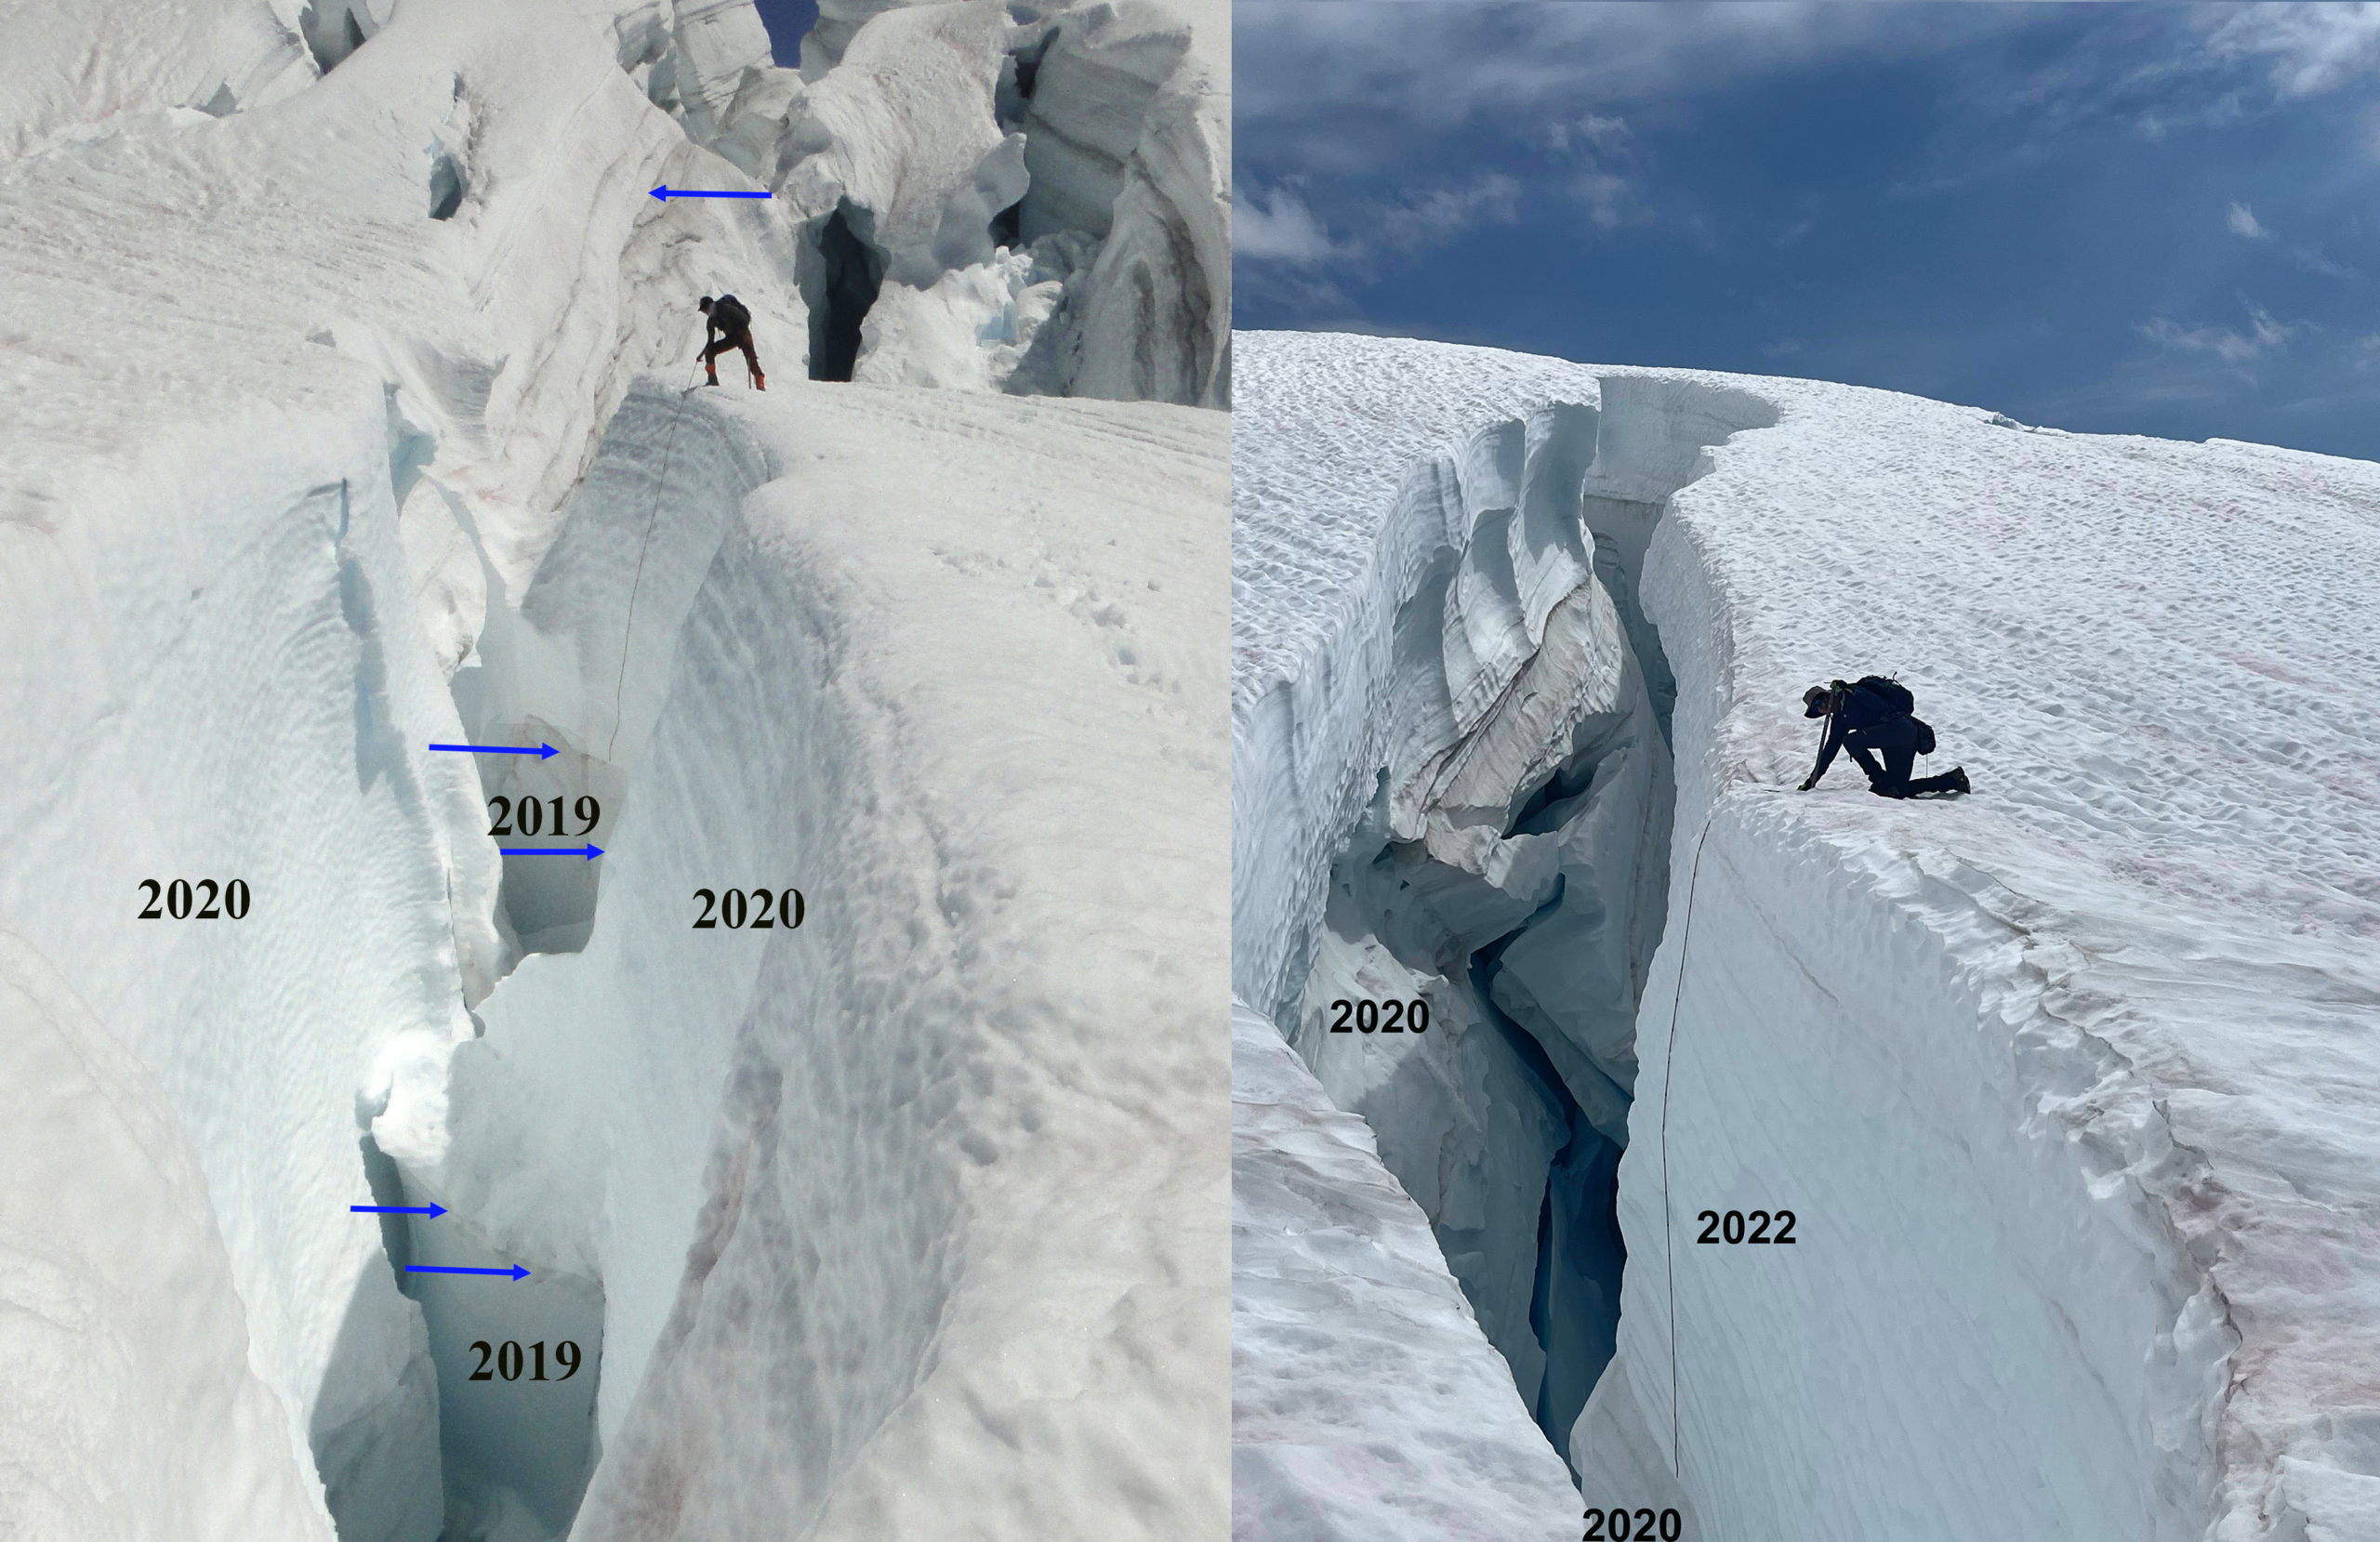
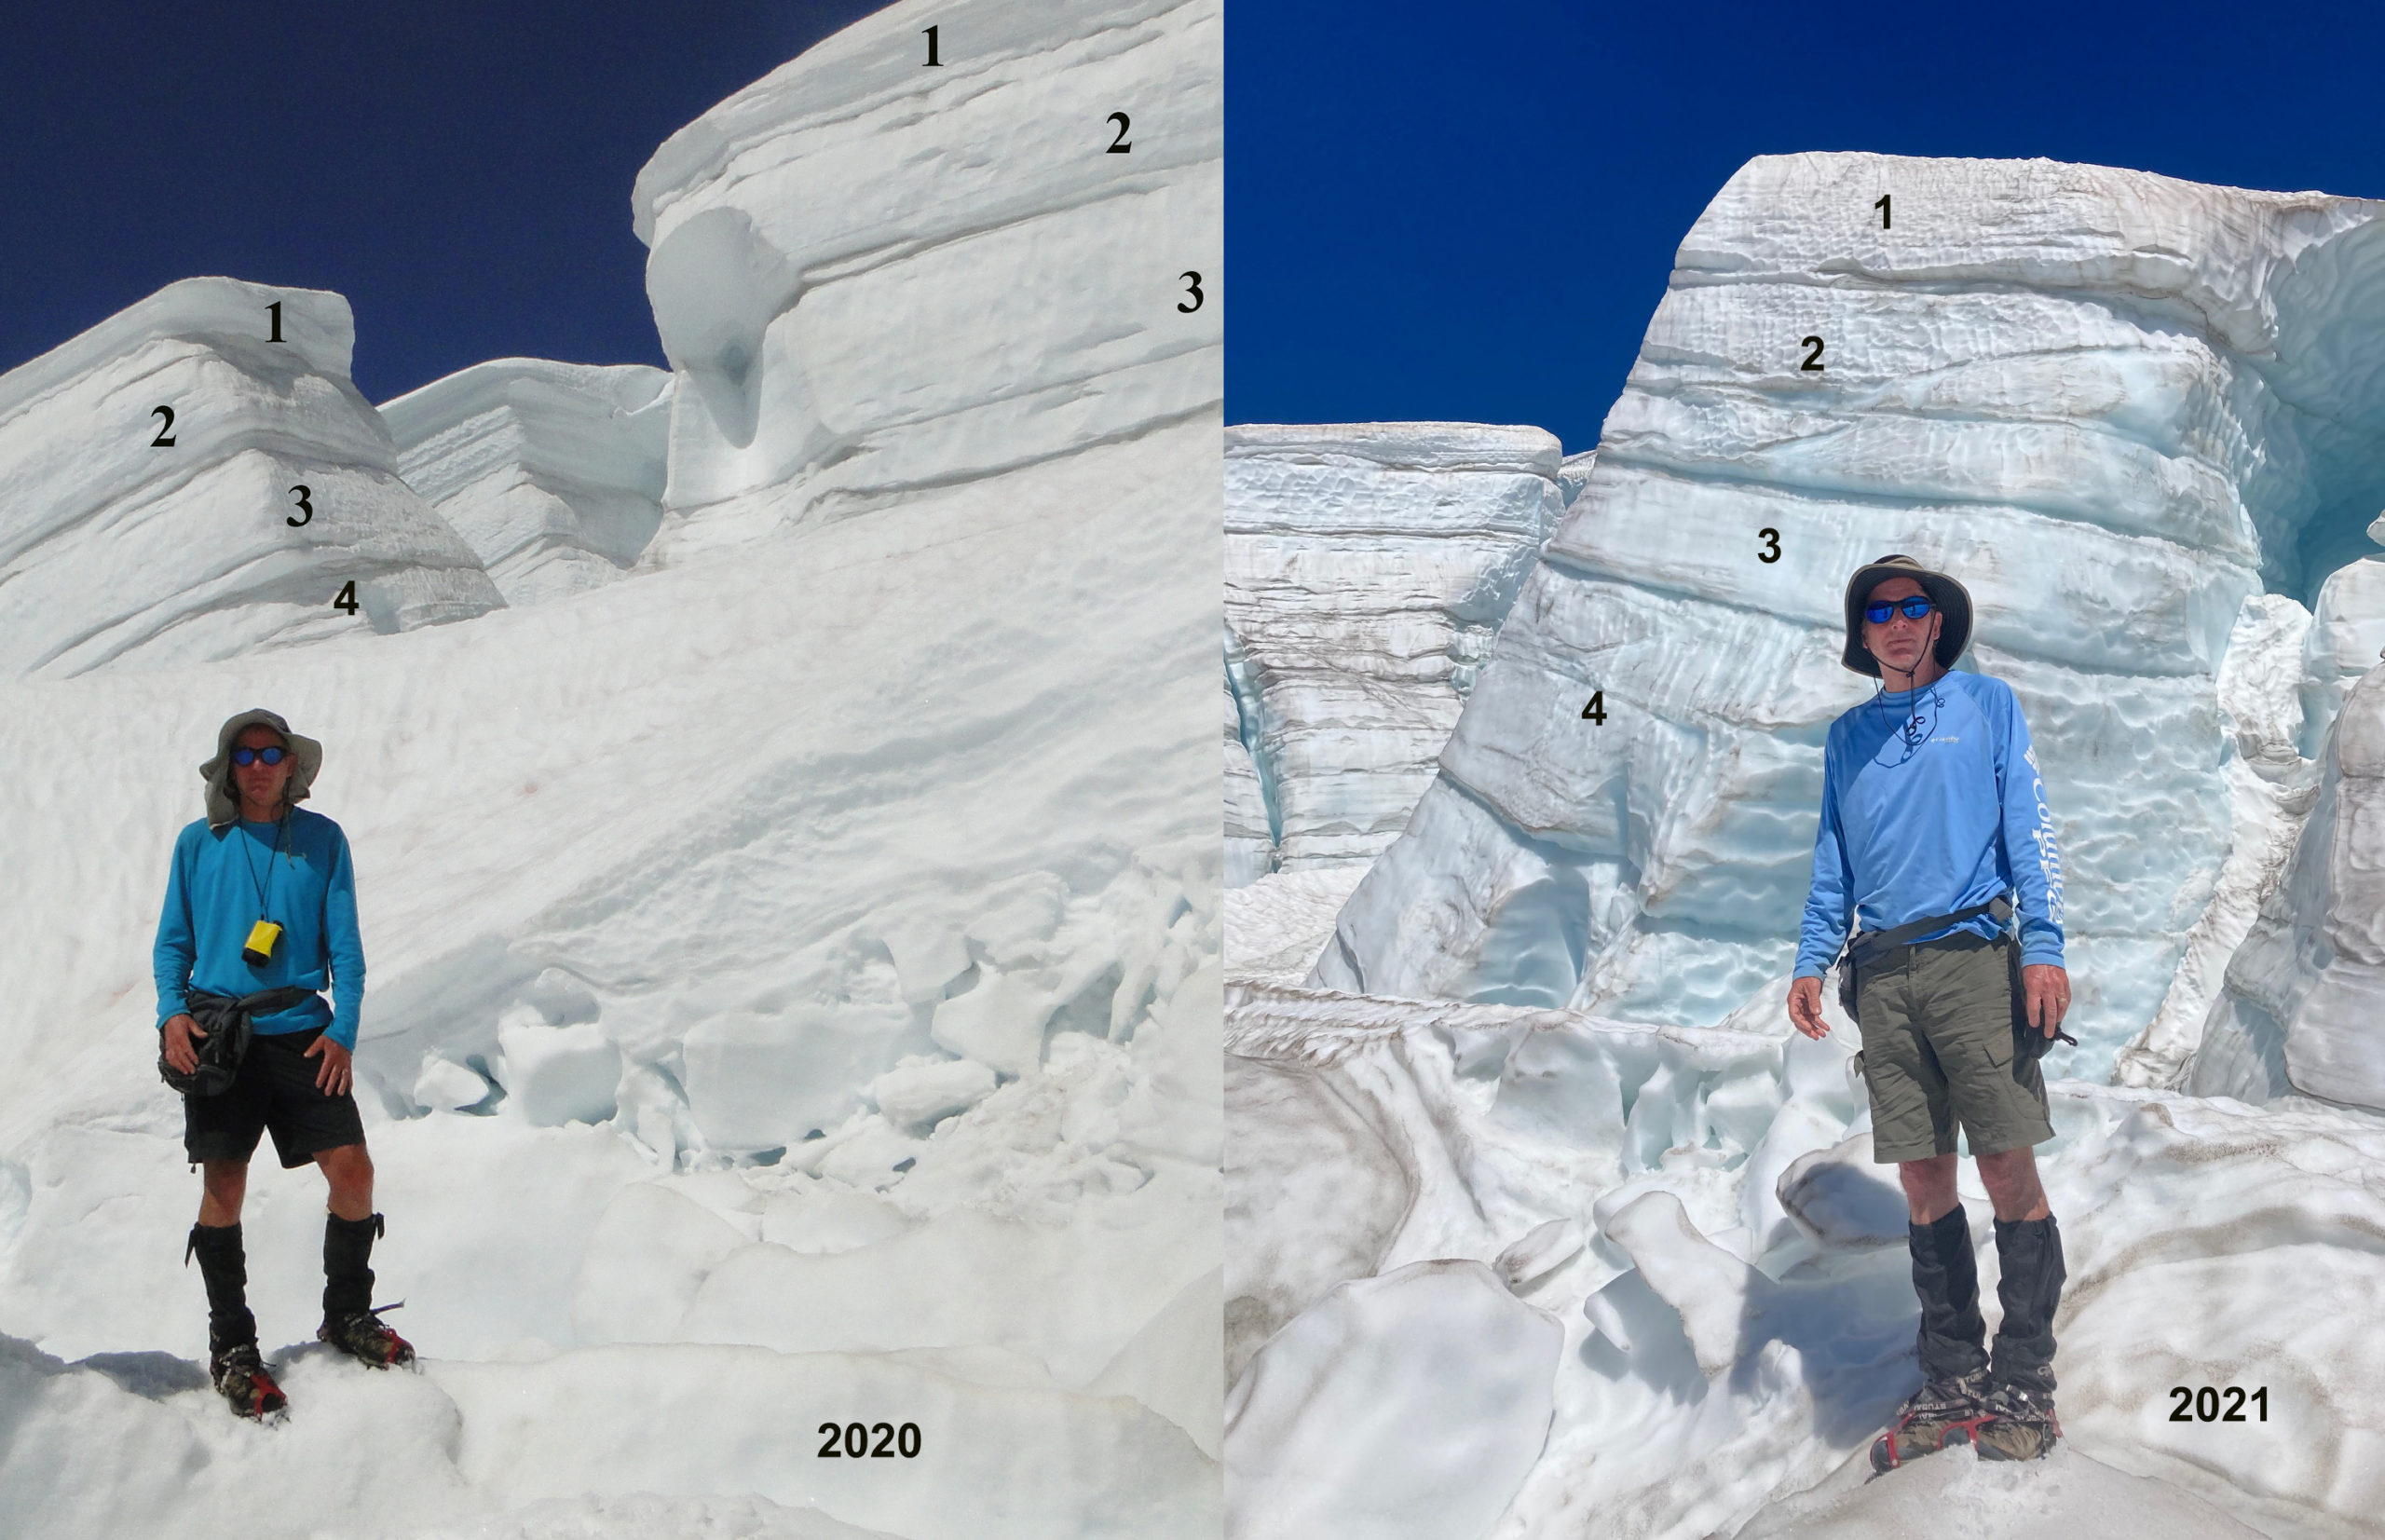
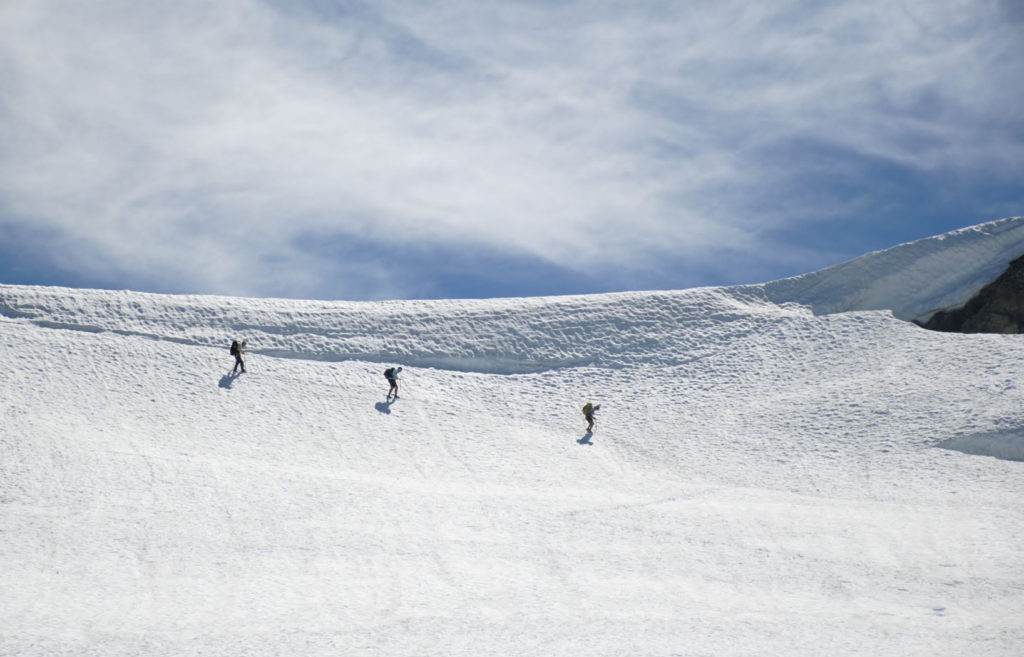
Ascending into Easton Icefall with five annual layers exposed on serac.

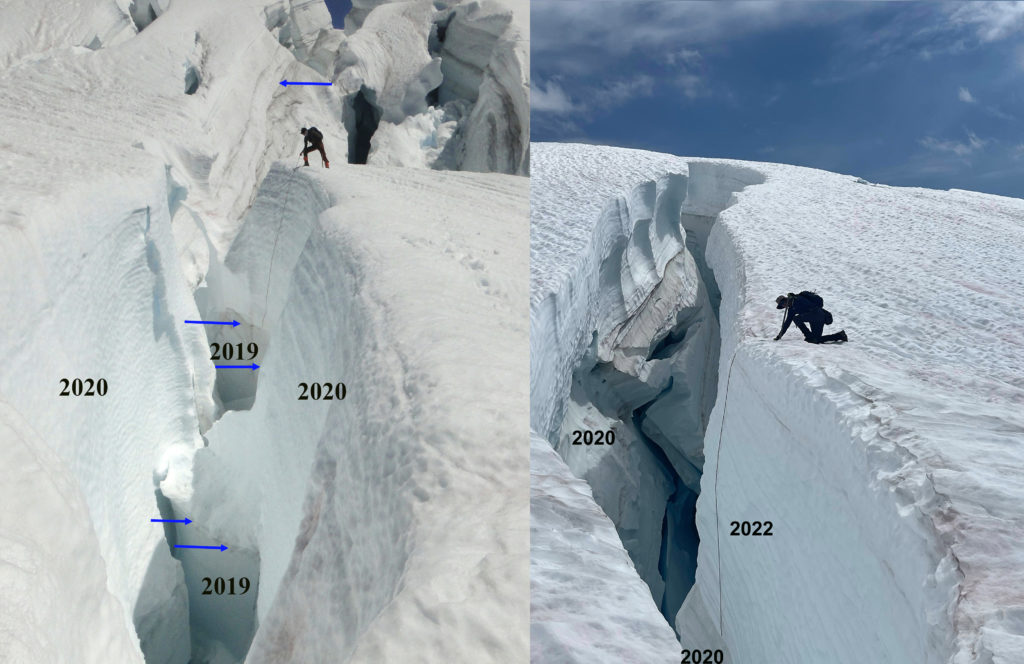
Snow depth assessment in specific crevasse at 2500 on Easton Glacier. No snow was retained here in 2021. Avergage depth in 2020 in this region 5.5 m, 4.75 m in 2022.

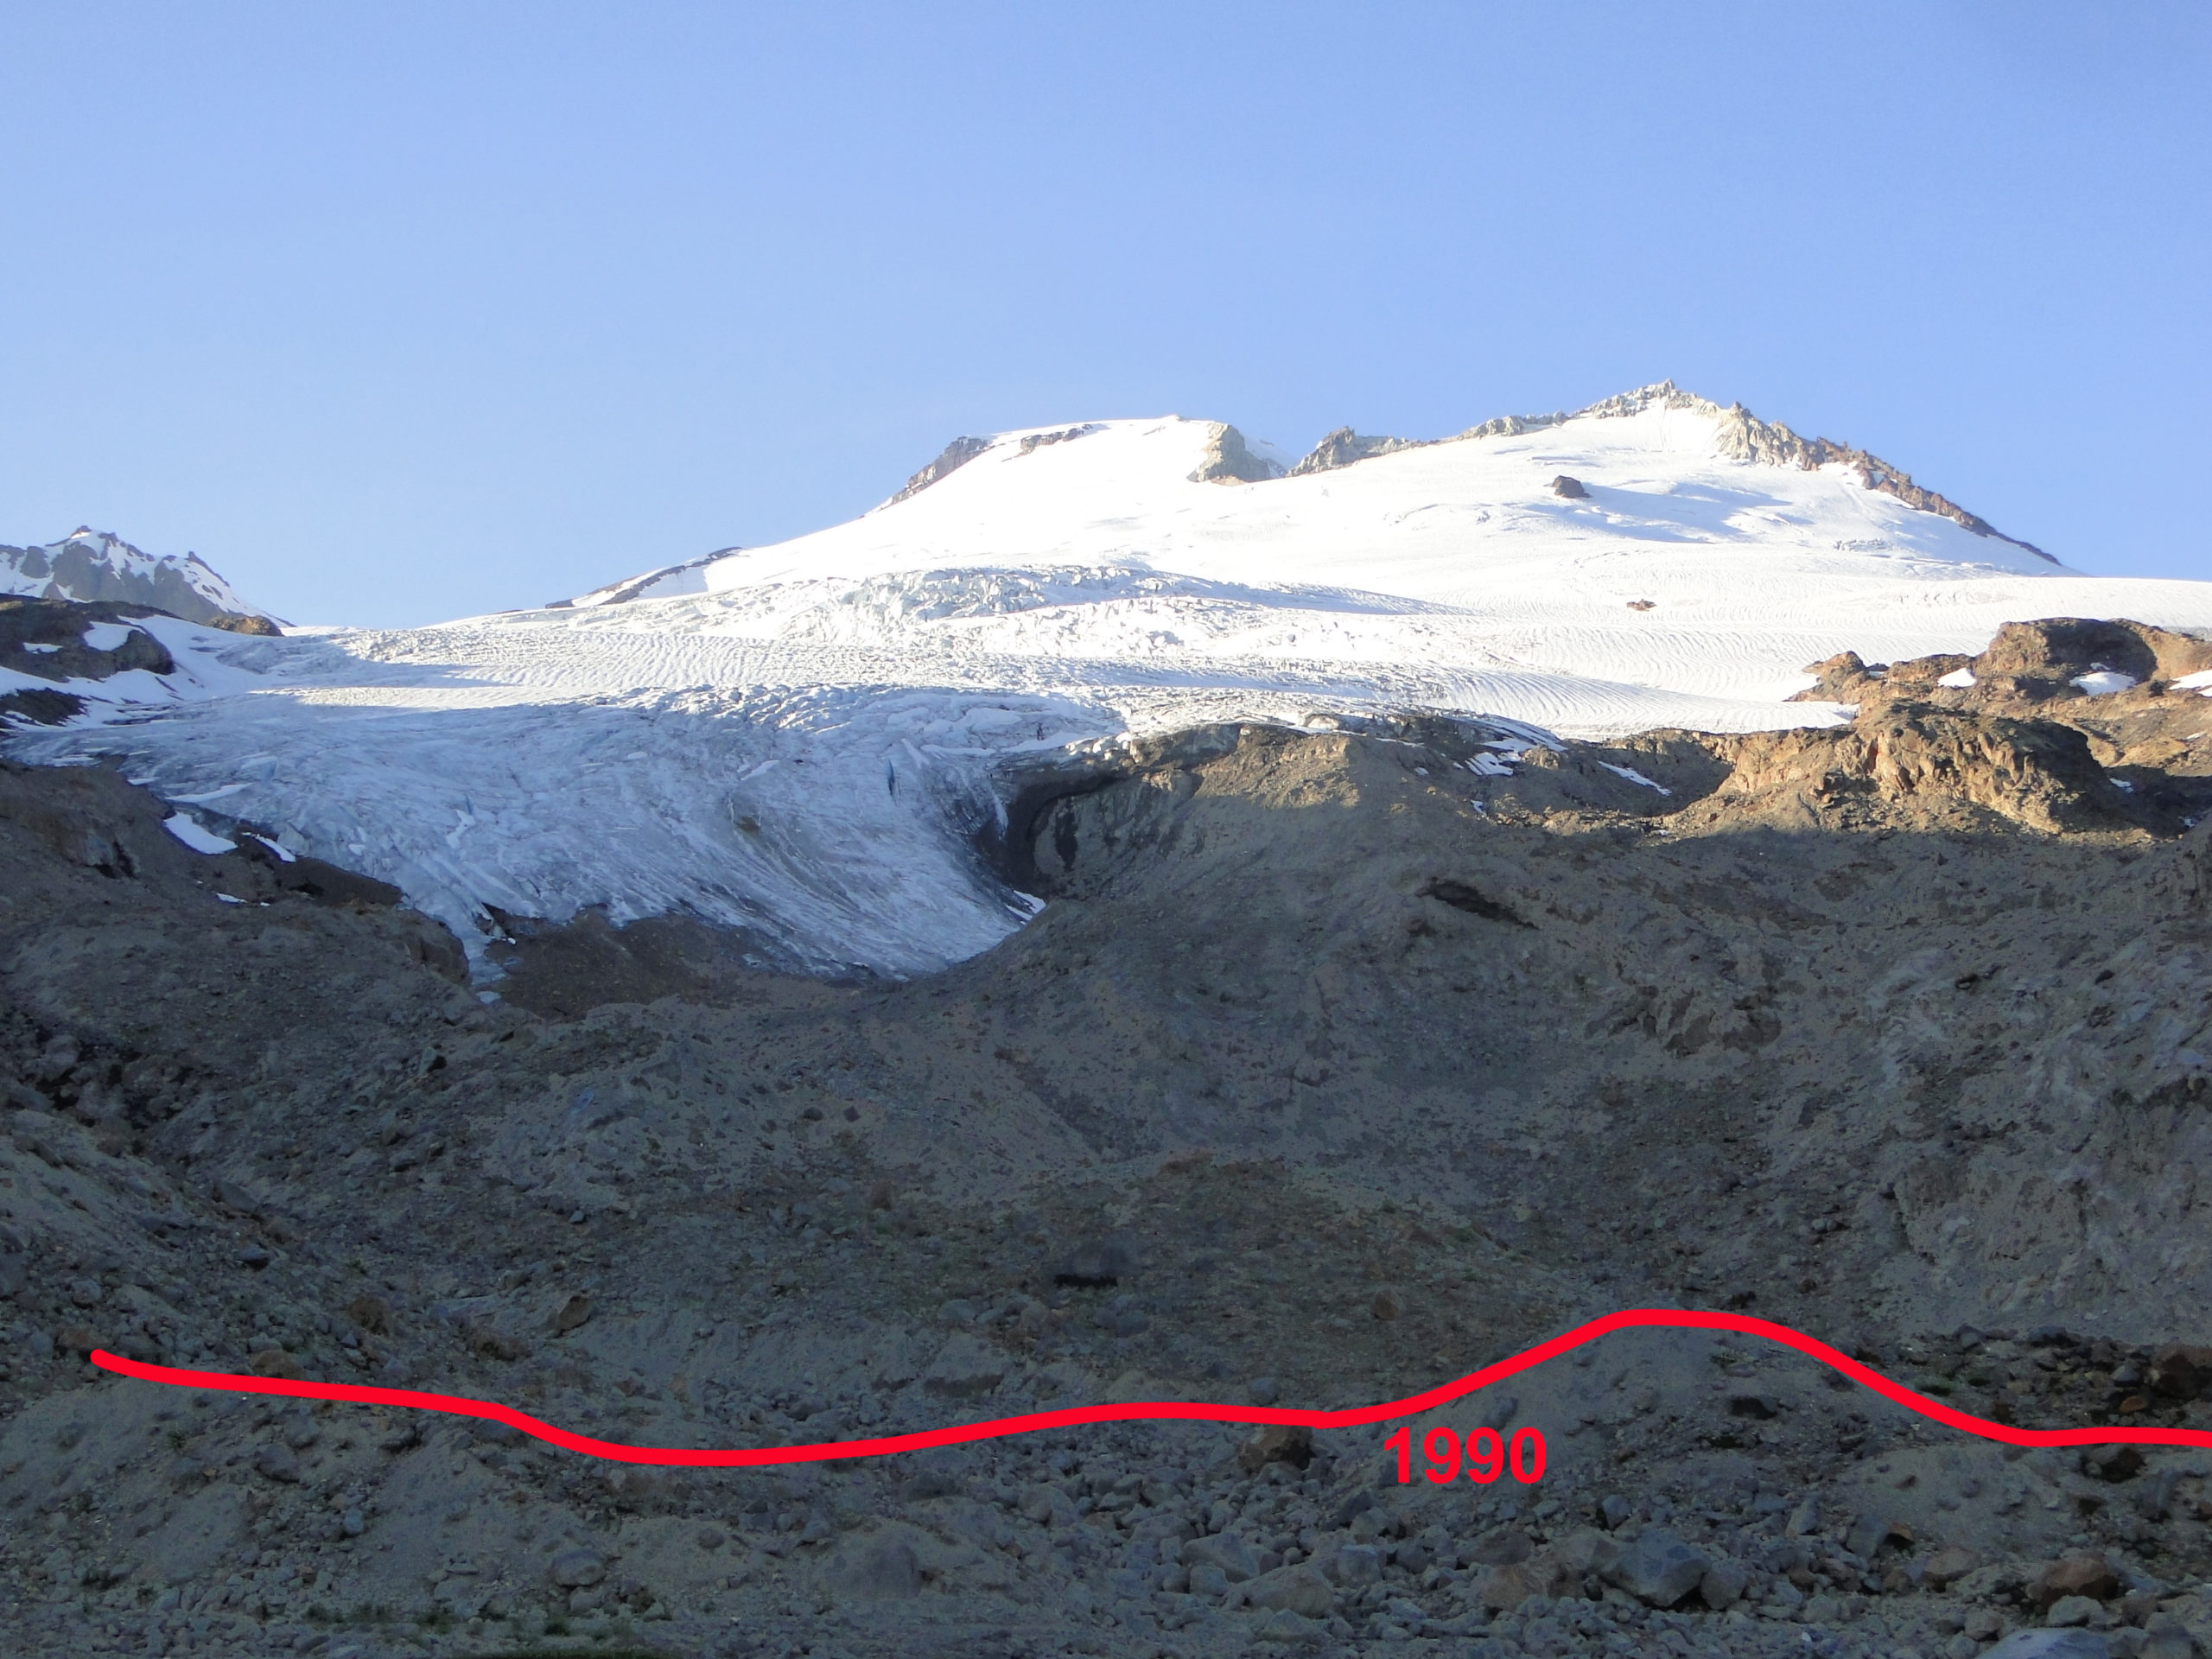
Easton Glacier has retreated 470 m from 1990-2022. Above is 2022 and below is 2003 image.

Ice Worm Glacier on Mount Daniel was fully snowcovered. We completed a grid of 72 snow depth measurements with a mean of 2.1 m in depth. The glacier continues to recede faster on its upper margin than at the terminus.

Descending onto Lynch Glacier, which had an accumulation area ratio of 83% in mid-August. Average snow depth 2.5 m.

Probing snow depth and surveying blue ice margin on Lynch Glacier.

Daniel Glacier was fully snowcovered in mid-August. Consistent snow depths of 1.8-2.5 m.

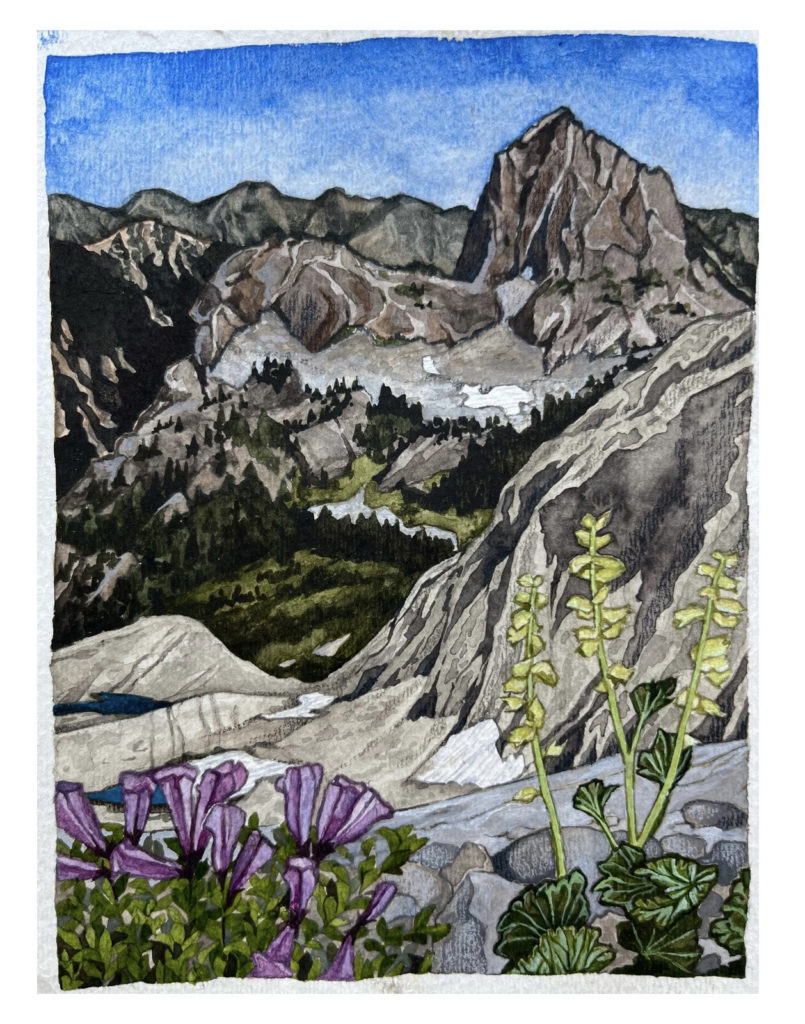
Jill’s field watercolor and colored pencil. This piece was done below the small Iceworm Glacier, on Mt. Daniel. It looks out towards the prominent Cathedral rock and Alpine Lakes Wilderness. Jill really enjoyed making this piece — to start she sketched the landscape, and then temporarily moved in front of the purple penstemon and the pale elmira flowers to capture them in the foreground. A while after she began painting, the wind dropped, and the mosquitoes arrived in force. Jill had to stop painting for the evening and went back to camp. Because Jill then finished at home, it was fun to add some more detail to this piece.

In the vicinity of Peggy’s Pond near our Mount Daniel base camp are a dozen shallow ponds, 10-20 cm are average that typically endure through the hatch of tadpoles in late August or early September. The primary inhabitants are frogs (Rana Cascadea) and their tadpoles. In 2022 despite a wet spring and early summer that had the ponds brimming with water, right above, tadpoles were observed, where typically there are several hundred, and the frog numbers were ~50% of usual. This followed the dried beds of these ponds in 2021, at left.  Maybe this is in part why mosquitoes were swarming here.

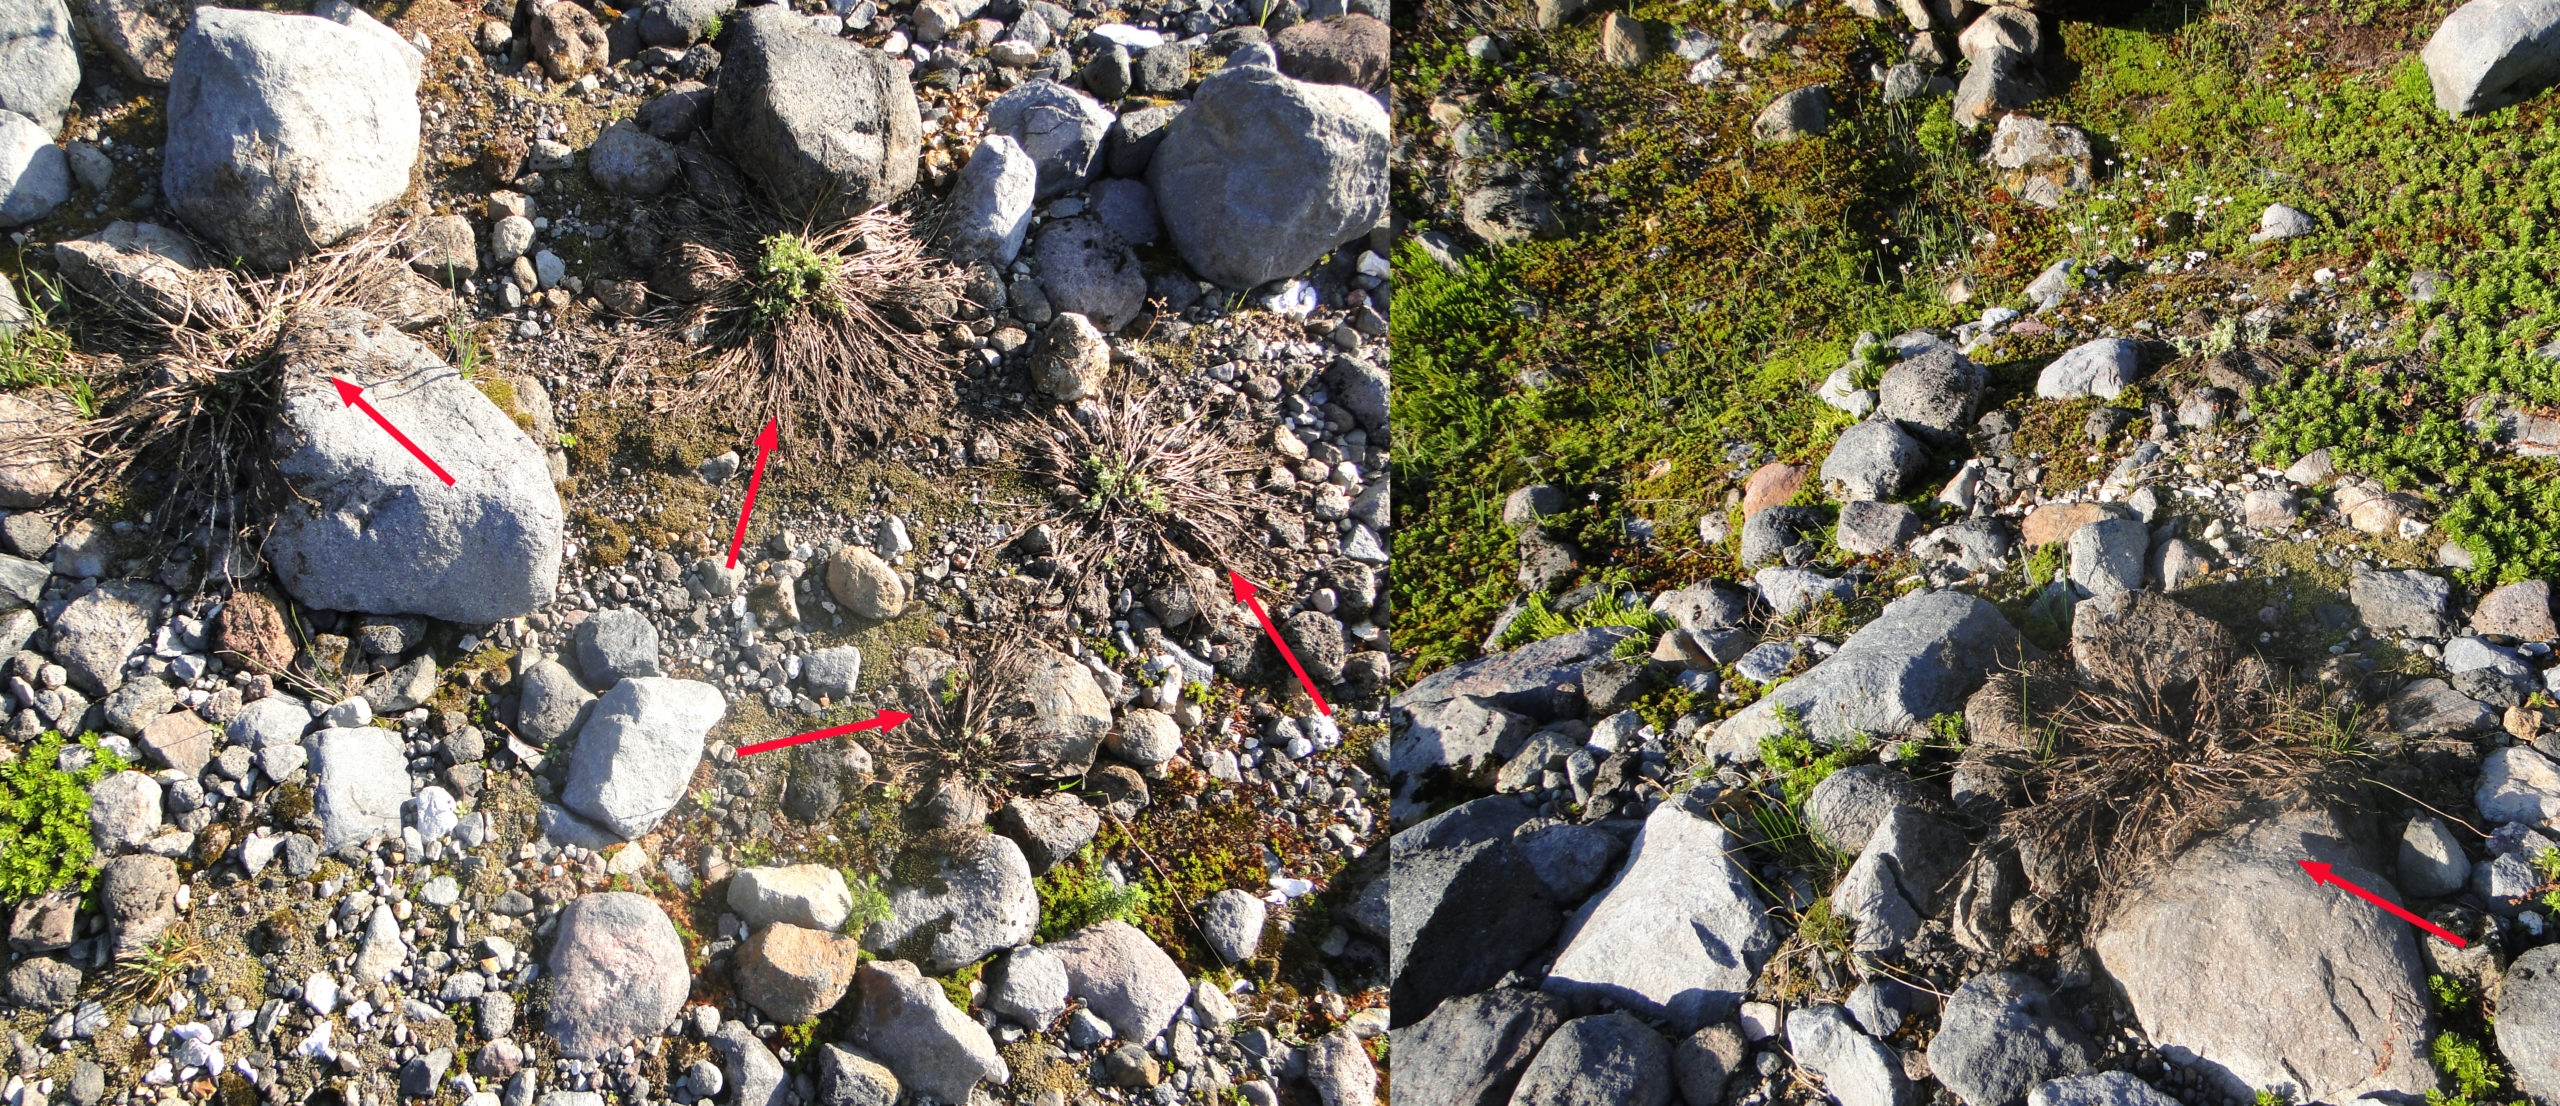
In 2021 below Easton Glacier we noted a number of alpine plants that had emerged just before or during the record June heat wave, had been dessicated/cooked by the heat in this are of relatively barren volcanic rock. Most notably lupine. This year in the same region we noted that ~30% of the lupine had failed to develop by August 2022, despite a cool wet spring. In contrast the evergreen alpine plants in the same area penstemon, saxifrage, pink and white heather, and partridge-foot all were fine.

Alpine Glaciers Section-State of the Climate 2021

The 32nd annual State of the Climate report was published today. For the 14th year I have written the Alpine Glacier section chronicling their response for the the hydrological 2020/21 utilizing the World Glacier Monitoring Service (WGMS) data sets. WGMS reference glaciers (30+ years of continuous observation) experienced a mass balance loss of -900 mm w.e., compared to -700 mm w.e. in 2019/20. From 1970-2021 the eight most negative mass balance years were recorded after 2010.

Figure 1. illustrates glacier mass balance for the WGMS global reference glaciers with more than 30 continued observation years for the time-period 1970-2020. Global values are calculated using a single value (averaged) for each of 19 mountain regions in order to avoid a bias to well observed regions.

In 2021, a negative annual mass balance was reported from 31 of the 32 reference glaciers reported to the World Glacier Monitoring Service (WGMS). The mean annual mass balance of the 32 reference glaciers reporting is -900 mm w.e., this includes data from 12 nations on four continents. This value is not the final regionally averaged global value. This will make 2021 the 34th consecutive year with a global alpine mass balance loss, and the 13th consecutive year with a mean global mass balance below -500 mm w.e..

The rate of thinning increased from 527 mma−1 for 2000-2009 to – 896 mma−1 for 2010-2019 (WGMS, 2021). This agrees well with the satellite survey of 200,000 alpine glacier by Hugonnet et al (2021) who identified a thinning rate excluding ice sheet peripheral glaciers of 360 ± 210 mma−1 in 2000 to 690 ± 150 mma-1 in 2019. Alpine glaciers lost a mass of 267 ± 16 Gta-1 from 2000-2019, equivalent to 21 ± 3 per cent of the observed global sea-level rise (Hugonnet et al, 2021).  More frequent and intense heat waves continue to take a toll on alpine glaciers.

All 17 reporting glaciers in the Alps had a negative mass balance averaging – 682 mm in 2021. In Austria in 2020, of the 92 glaciers with annual terminus observations 85 (93.4%) withdrew and seven remained stationary (Lieb and Kellerer-Pirklbauer, 2021).  This retreat trend will continue in 2021, with another year of mass balance loss.

In Norway the six reporting glaciers all had a negative mass balance yielding an average mass balance of -671 mm in 2021.  On Svalbard the mean loss of the four reporting glaciers was -227 mm. Iceland completed surveys of nine glacier, all nine had negative balances with a mean mass balance of -1160 mm.

In the Western Canada and the United States and Washington all 14 glaciers observed in 2021 had a negative mass balance averaging -1635 mm.  The exceptional heat wave during late June and early July set the stage for the large glacier mass loss. In Alaska three of the four glaciers had a negative mass balance with a mean annual balance of -528 mm.

Upper portion of Easton Glacier with a month left in the melt season

In South America, 2021 mass balance data were reported from three glaciers in Argentina, two glaciers in Chile, and one in Columbia, all were negative with a mean of -861 mm.  This is greater than the 2000-2018 average loss observed in the Andes of −720 ± 220 mma-1 (Dussaillant et. al., 2019).

In the High Mountain Asia fifteen of eighteen glaciers reported negative balances in 2021. The average mass balance was-468 mm. Early winter of 2021 was warm and dry across the Himalayan Region. This was capped off by record warmth in the Mount Everest region leading to the snow line on glaciers rising and snow free glaciers up to 6000 m (Pelto, et al., 2021). This illustrates that the ablation season no longer always ends when winter begins. The importance of winter conditions was further noted by Potocki et al (2022) who report on an ice core drilled on South Col Glacier on Mount Everest at 8020 m revealing a contemporary sublimation driven thinning of ~2000 mma-1.

References

Dussaillant, I., Berthier, E., Brun, F., Masiokas, M., Hugonnet, R., Favier, V., Rabatel, A., Pitte, P.and Ruiz, L.,2019: Two decades of glacier mass loss along the Andes. Nat. Geosci. 12, 802–808. https://doi.org/10.1038/s41561-019-0432-5

Hugonnet, R., McNabb, R., Berthier, E. et al 2021: Accelerated global glacier mass loss in the early twenty-first century. Nature 592, 726–731. https://doi.org/10.1038/s41586-021-03436-z

Lieb, G.K. and A. Kellerer-Pirklbauer 2021: Sammelbericht über die Gletschermessungen des Österreichischen Alpenvereins im Jahr 2020. Letzter Bericht: Bergauf 2/2020, Jg. 75 (145), S. 6–15, https://www.alpenverein.at/

Pelto, M.; Panday, P.; Matthews, T.; Maurer, J.; Perry, L.B., 2021: Observations of Winter Ablation on Glaciers in the Mount Everest Region in 2020–2021. Remote Sens. 13, 2692. https://doi.org/10.3390/rs13142692.

Potocki, M., Mayewski, P.A., Matthews, T. et al, 2022: Mt. Everest’s highest glacier is a sentinel for accelerating ice loss. Nature Clim. Atmos. Sci., 5, 7. https://doi.org/10.1038/s41612-022-00230-0.

WGMS 2021: Global Glacier Change Bulletin No. 4 (2018-2019). Zemp, M., Nussbaumer, S. U., Gärtner-Roer, I., Bannwart, J., Paul, F., and Hoelzle, M. (eds.), ISC(WDS)/IUGG(IACS)/UNEP/UNESCO/WMO, World Glacier Monitoring Service, Zurich, Switzerland, 278 pp., doi:10.5904/wgms-fog-2021-05.

World Glacier Monitoring Service: Fluctuations of Glaciers (FoG) Database

DOI for current scientific data (Identifier): 10.5904/wgms-fog-2021-05

https://wgms.ch/data_databaseversions/


Edgeøya, Svalbard Ice Caps Snow Free in 2022; Fragmentation Ongoing

Langjokulen (La), Kvitisen (Kv), Bergfonna (Be) and Blaisen (Bl) ice caps on Edgeøya in Landsat images from 1990 and 2022. Two years of excepational melt where the ice caps lost all of their snow cover. Here the changes in the ice caps are reviwed at Points A-J.

Edgeøya, Svalbard is ~40% ice covered had a number of ice caps some reaching tidewater and others in the interior (Dowdeswell and Bamber 1995). Here we focus on four inland ice caps that have there summits between 440 and 570 m. Thinning is prevalent across the Edgeøya ice caps with significant thinning even at the highest elevations, though less than at lower elevations (Morris et al, 2020). Here we examine the changes of four inland ice caps Bergfonna, Blaisen, Kvitisen and Langjokulen with Landsat imagery from 1990, 2020 and 2022. The lack of retained snow cover is evident.  The annual layering is even more apparent in Sentinel imagery.

Point A- In 1990 a small glacier 0.15 km2 exists that dissapears by 2022.

Point B and C are valleys occupied by ice from Bergfonna outlet tongues that are gone by 2022.

Point D is the valley that Bergfonna terminated in along its southern margin that is now lost most of its ice infill.

Point E and F are valleys occupied by ice from Langjokulen that have lost that ice by 2022.

Point G and H are locations where Blaisen Ice Cap is fragmenting from 1990 to 2022.

Point I is where new bedrock is emerging as Kvitisen thins.

Point J is the location of an expanding proglacial lake now with an area of 0.3 km2 on the northwest side of Kvitisen.

Langjokulen (La), Kvitisen (Kv), Bergfonna (Be) and Blaisen (Bl) ice caps on Edgeøya in Sentinel image from 8-20-2022 illustrating the lack of snowcover, limited firn areas and numerous annual layers. This pattern of annual layers due to glaciers being stripped of snow cover is becoming increasingly frequent. Note Andes last winter and Pacific Northwest summer 2021.

Because of the low top elevation and relatively flat slopes their ability to survive is dependent on much of meltwater generated on the higher plateau areas being refreezing within the firn instead of escaping the glacier (Noel et al 2020). In 2020 the snowcover was lost and the firn thickness diminished. In August 2022 the snowcover again has been lost and there is little evident firn that could lead to refreezing of meltwater. This will drive substantial volume loss of these ice caps in 2022. The MAR Arctic ice caps surface mass balance model illustrates the excess melt from Svalbard as over 1 m in 2022.

TopoSvalbard map and August 2020 Landsat image of the ice caps. This is after a recent small snow event and some drifted snow is evident, though 95% of the ice caps are snow free. 

Whitney Glacier, Mount Shasta snow free again in 2022

shasta 8-25-2022

Whitney Glacier on August 25, 2022 in Sentinel image. Green arrows separation points, yellow arrows remaining snowpack

The summer of 2021 proved to be catastrophic for Whitney Glacier on Mount Shasta, California in terms of volume loss, ~15% leading to long term impacts, such as the 50% area reduction and 1000 m retreat since 2005.  The glacier lost 100% of its 2021 snowpack and was in the process of separating into three segments. In 2022 it was important for the glacier to offset some of this loss with a healthy retained snowpack through the sumer. Unfortunately by mid-August it is evident that the glacier will again be snow free by end of summer in 2022.  This will continue the rapid area and volume loss and continue the separation process.

Here we examine local weather records and Sentinel imagery to illustrate the conditions in 2022. The winter of 2022 started off well with near record December snowfall, followed by limited snowfall and temperatures averaging +3 C in Shasta County, until another big month in April. The results was well below average snowpack in early spring. A cool wet April and May preserved the limited snowpack. July experienced average temperatures 2.2 C above normal in Shasta County (NCEI-NOAA County Mapping)whtiney glacier 2020-2022

Whitney Glacier in  Sentinel images from 8-30-2020, 8-31-2021 and 8-15-2022. Green arrows separation points, yellow arrows remaining snowpack and T=terminus location,.

shasta glacier area 9-5-2018

Screenshot

Fragmentation of the glaciers  is evident in the comparison from 9-4-2018 and 9-4-2022, there are seventeen fragments left, six fragments that have melted away also.

A comparison of August snowcover from 2020-2022 illustrates the small patch that remained in 2021, yellow arrow, and the small patches left in mid-August of 2022. The ongoing separation is evident at two locations sho.w with green arrows. From August 2020-August 2022 the glacier area has declined from 0.72 km 2 to 0.57 km 2 a ~20% loss.  The width of the glacier at the two arrows has been reduced by ~50% to 50 m at the lower elevation of 3250 mand 100 m at the upper elevation of 3600 m. A key issue this summer again has been the high temperatures in July and August, in particular the high minimum temperatures, preventing the snow surface from freezing at night and shutting off the melt. At Gray Butte, 2450 m, the remote weather station indicates a period from July 9-August 7 where the temperature never dropped below 10 C (50 F).

shasta summer temps at Gray Bowl 8600 feet

Gray Butte summer temperatures at an hourly interval (Data from Mount Shasta Avalanche Center)

The velocity in two primary icefalls above each of the separation points is declining based on the NASA_IT’s LIVE application. The reduced flux combined with high summer melt in 2021 and 2022 will continue to accelerate the separation.

shasta icefall velocity

Velcoity data for two icefall locations on Whitney Glacier 2019-early 2022, from NASA_ITs-LIVE application

whtiney glacier 2022 photograph

Whitney Glacier Icefall at the green arrow seen on 8-15-2022 ( Mount Shasta Avalanche Center). Note the thin upper arm of the glacier.

Speel Glacier Retreats out of Alaska

Speel Glacier in 1984 and 2022 Landsat images illustrating lake expansion and detachment of tributaries A-C. Red arrow is 1984 terminus location and yellow arrow is 2022 terminus location.

In 1984 I observed Speel Glacier while flying into Juneau, AK to work with the Juneau Icefield Research Program. Speel Glacier is south of the Taku Inlet and the Juneau Icefield draining west from a shared accumulation area with Wright Glacier. Unlike the map on my lap, there was now a big lake at the terminus of the glacier. This post examines the retreat of this glacier across the international boundary, out of Alaska, and the expansion of the unnamed lake at its terminus using Landsat images.

Speel Glacier terminus on 8-18-2022 with the Alaska/British Columbia boundary in blue.

In 1948 Speel Glacier ended at the head of a braided outwash plain, generated by the Speel River. Upglacier in 1948 there was a small side valley lake impounded by the glacier, Speel Lake. The lower part of the glacier was heavily debris covered and stagnant in 1948.  I  In the 1984 Landsat image the glacier had retreated 3 kilometers from the 1948 position and was fed by four separate tributaries flowing into the glacier A-D.  n 1984 the original Speel Lake had drained and a new lake had formed filling the valley that the glacier had filled in 1948. The proglacial lake was 2.2 km long. By 2003 the glacier had retreated an additional 1.8 km from 1984 to where the lake bends east, and the main tributary from the north separated from the glacier prior to 1984. By 2013 tributaries A and B had been completely separated.  In 2022 the glacier has retreated  6.35 km since 1948, 3.3 km since 1984 and the connection with the three of the four tribuaries had been lost A-C.  The tributary detachments have led to continued retreat, have reduced input to the main glacier, which by the summer of 2022 resulted in the glacier retreating across the international boundary from Alaska into British Columbia. The new lake is now over 7 km long, and should be called Speel Lake again. The retreat of this glacier fits the pattern of other glaciers in the region Field, Gilkey, and Tulsequah Glacier  (Pelto (2017). The  detachments are frequent and significanly impact ice dynamics on the Juneau Icefield (Davies et al 2022). There we found 176 such detachments/disconnections in the outlet and valley glaciers of the Juneau Icefield Davies et al (2022).

Speel Glacier in 1948 USGS map.

.

Speel Glacier in 2003 and 2013 Landsat images illustrating lake expansion and detachment of tributaries A-C. Red arrow is 1984 terminus location and green arrows are detachment of tributaries.


NORTH CASCADE GLACIER CLIMATE PROJECT 2022-39th Annual Field Program

Mount Baker camp for Rainbow and Sholes Glacier (Illustration by Megan Pelto)

Science Director: Mauri S. Pelto, mspelto@nichols.edu
Art Director: Jill Pelto, pelto.jill@gmail.com

2022 Field Season: For the 39th consecutive summer we are heading into the field to measure and communicate the impact of climate change on North Cascade glaciers. We will complete detailed measurements on 10 glaciers, three of which are part of the World Glacier Monitoring Service reference glacier network (42 glaciers globally), which have 30+ consecutive years of mass balance observations.

Who we are? NCGCP was founded in 1983 to identify and communicate the response of North Cascade glaciers to regional climate change. We are a fieldwork-based project with a focus on measuring changes in mass balance, glacier runoff, and terminus behavior. The project has an interdisciplinary scope — collaborating with a range of natural scientists, artists, journalists, and conservationists. The goal of this is to best document and share our research with a broad audience. We aim to bring stories of these places and their changes to as many people as we can, making our research feel personal to more than just our team. The North Cascades glaciers are important for the ecosystem, as a water resource to Washington, and as a place of recreation for so many. By monitoring them every year, we continue to provide critical data on glacier response to climate change and informed stories of their health that reveal the impacts of our warming world.

2021 Field Team for Rainbow Glacier

Why study glaciers in the North Cascades? Glaciers are one of the world’s best climate monitors and are a critical water resource to many populated glaciated regions. This is particularly true in the North Cascades where 700 glaciers yield 200 billion gallons of summer runoff and glaciers have lost 30 % of their area in the last century.  This has reduced glacier runoff in late summer in the region as the reduction in glacier area has exceeded the increase in melt rate. During heat waves this role is even more profound with the glacier fed North Fork Nooksack River discharge rising ~24% due to greater melt, while adjacent unglaciated South Fork Nooksack River discharge declines by ~20% (Pelto et al., 2022). The increased discharge limits the rise in river temperature during heat waves to 0.7 C in the North Fork, with the South Fork increasing by 2 C. This increases stress on the salmon in the South Fork (Pelto et al., 2022).

Terminus Change at Columbia and Easton Glacier.

This field season follows the 2021 season that featured a historic heat wave at the end of June and a period of extended warm weather that lasted until Mid-August. The heat led to a greater exposure of bare ice on glaciers earlier in the summer, particularly at higher elevations.  For ice surfaces with a higher albedo and greater density the observed melt rates are 7-9 cm per day water equivalent during warm weather events vs 4-6 for snow surfaces. This led to substantial mass losses on North Cascade glaciers, -2 m.

This summer we will have an opportunity to assess the long-term ramifications of the 2021 summer and measure the response of glaciers to the weather of 2022. This winter snowpack remained below average until a late season surge from April into May. The month of May and June had below normal temperatures leading to an above average snowpack. A hot July has melted into this snowpack and we will observe how much remains on the glaciers.

Field Team 2021:

Jill Pelto is an artist and scientist from New England who grew up loving winter sports and trips to the mountains. She incorporates scientific research and data into paintings and prints to communicate environmental changes. Her multi-disciplinary work weaves visual narratives that reveal the reality of human impacts on this planet. She completed both her B.A. degrees in Studio Art and Earth and Climate Science and her M.S. focused on studying the stability of the Antarctic Ice Sheet at the University of Maine, spending two field seasons at a remote camp in the southern Transantarctic Mountains. Jill will be joining the project for her 14th field season. She is excited about continuing to document the change in North Cascade glaciers that she has witnessed each of the last ten years — through science and art.

Mauri Pelto has directed the project since its founding in 1984, spending more than 700 nights camped out adjacent to these glaciers. He is the United States representative to the World Glacier Monitoring Service, author of the AGU blog “From a Glacier’s Perspective”, and associate editor for three science journals.  He is on the Science Advisory Board for NASA’s Earth Observatory. His primary position is Associate Provost at Nichols College, where he has been a professor since 1989.

Echo Allen is a rising Junior at UC Berkeley studying Architecture and Sustainable Design. Her studies deal with urban ecology and environmental justice in relationship to physical design. Echo finds inspiration for her studies in the backcountry as a NOLS backpacking student, avid rock climber, and kayak guide. Echo is currently working with the City of Richmond and SHAC (Sustainable Housing at Cal) to design and construct an affordable and scalable model of a solar-powered off-grid capable tiny house that will be used as affordable housing in Richmond CA. She hopes to help people understand the impact of climate change and implement possible mitigation strategies through her work in outdoor education and architecture.

Ellie Hall (she/her) is a recent graduate from the University of Colorado – Boulder with a BA in Environmental Studies, a minor in Geology, and a certificate in Arctic Studies. She is interested in researching and documenting the nuanced impacts of climate change on cold regions, and especially learning more about the relationship between decreasing snowpacks and increasing wildfires. She has spent the past two summers researching these areas, interning with INSTAAR’s Arctic Rivers Project and NASA’s ABoVE Campaign. She is excited to get into the field this summer to see the theoretical knowledge she’s learned be put into practice to collect valuable data. Ella’s other interests include backcountry skiing, mountain and gravel biking, rock climbing, and water sports.

Jenna Travers (she/they) is about to start her final year as a marine biology major at the University of Oregon. Her research focuses on the impacts of glacier retreat on salmon, how communities are affected by glacier loss and salmon declines, and how climate issues are communicated to the public. They are currently working as a writer with GlacierHub and a salmon identification contractor with the Wild Salmon Center, and they have also worked as a legislative intern for the Oregon State Legislature, a Water Justice intern with a local nonprofit. In her free time, Jenna enjoys hiking, skiing, rock climbing, and playing games with her roommates.

Field Partners 2022

Alia Khan’s research team including grad students Sally Vaux and Shannon Healy focus on environmental chemistry in the cryosphere, including black carbon and snow algae to document global change of glacier and snow melt in mountainous and polar regions. Western Washington University Cryosphere Studies and Aquatic Biochemistry Lab.

Claire Giordano is an environmental artist, writer, and educator creatively telling the stories of science, climate change, and the modern experience of nature. From creating rain-dappled sketches in an old growth forest to filming a watercolor class beside a glacier, careful observation of nature inspires her goal is to connect people and place through art.  In 2021 she founded the Adventure Art Academy – a series of virtual watercolor classes filmed outside – to invite others into the joy of painting outside.

Jaclyn Baer is an artist and photographer in the PNW. She is new to the climate change artist role, but excited to learn and share. She loves painting with gouache in her studio and watercolor out in the field. Besides painting, she spends her free time hiking and backpacking with her husband Ryan.

Nooksack Indian Tribe, for the 11th consecutive year, we will be conducting field work aimed at providing field validation and streamflow calibration data below Sholes Glacier for the ongoing work of the tribe.

Crevasse Stratigraphy on Easton Glacier

 2022 Field Schedule

Jul 31:  Hike in Columbia Glacier
Aug. 1:  Columbia Glacier
Aug. 2:  Columbia Glacier
Aug. 3:  Hike Out Columbia, Hike in Ptarmigan Ridge
Aug. 4:  Sholes Glacier
Aug. 5:  Rainbow Glaciern
Aug. 6:  Rainbow Glacier
Aug.7:   Hike out, Hike in Lower Curtis Glacier
Aug. 8:  Lower Curtis Glacier
Aug. 9:  Hike out, Hike in Easton Glacier
Aug. 10: Easton Glacier
Aug. 11: Easton Glacier
Aug. 12: Hike out Easton/Hike in Daniel
Aug. 13: Ice Worm Glacier Survey
Aug. 14: Daniel and Lynch Glacier Survey
Aug. 15: Ice Worm ablation, Hike out
Aug. 16: Field season concludes


Deming Glacier Icefall Deceleration 2017-2022 Driven by Mass Balance Loss

Deming Glacier velocity from NASA MEaSUREs ITS_Live at four locations from below icefall at blue X to above icefall at red X. There is not a significant change in velocity above the icefall (red X), but significant deceleration in the icefall and below the icefall. 

The Deming Glacier drains the southwest side of the summit of Mount Baker a stratovolcano in the North Cascades of Washington, with a massive icefall feeding the lower valley terminus reach of the glacier. The icefall begins at 2200 meters and descends to 1600 meters. The glacier feeds the Middle Fork Nooksack River which provides water supply to Bellingham, WA. I first observed the Deming Icefall from the terminus area of the glacier in 1987. This visit demonstrated that it is not safe to hike to the terminus of this glacier. In 1990 we began annual observation of Deming Glacier. Each summer we monitor the adjacent Easton Glacier in detail including mass balance, while also taking several specific observations of Deming Glacier including terminus position, and accumulation between 2400-2700 m. This combined with mass balance assessment on Easton Glacier provides an annual assessment of the meltwater provided by the glacier to the Nooksack River system. During heatwaves the tributaries of the Nooksack fed by glaciers have had the impacts mitigated, while those without glaciers have seen significant temperature increase and discharge decrease (Pelto et al 2022).

Pelto and Brown (2012)  identified a mean annual mass balance loss of -0.52 m/year from 1990-2010 on Mount Baker glaciers. From 2013-2021 the mass loss had more than doubled to -1.30 m/year. The declining mass balance is less pronounced above the icefall. The icefall transitions the glacier from the accumulation zone to the ablation (melt) zone at the bottom of the icefall. Above the icefall at 2400-2700 meters the average snow depth left at the end of the summer based on several thousand crevasse stratigraphy measurements from 1990-2013 had been 2.75 meters, from 2014-2021 the average depth has been 2.4 m.

The result of the declining mass balance of the entire glacier and the upper glacier will be glacier deceleration. The NASA Measures ITS_LIVE application uses feature tracking to determine glacier velocity. An examination of velocity change from the top of the icefall to the bottom on Deming Glacier from 2015-2022 indicates deceleration at the three points within or below the icefall, but no change at the top of the icefall.  At the top of the icefall red X velocity has declined ~20%. In the middle of the icefall, green X, velocity has also declined ~20% since 2017. Near the base of the icefall, orange X, velocity has a chaotic signal lacking a clear trend.  Below the icefall at the blue X, velocity has declined by ~20-30%.  The resulting reduction in flux to the terminus will continue the rapid retreat.  Pelto and Brown (2012) measured a 360 m retreat of Deming Glacier from 1979-2009, ~20 m/year. From 1979-2021 the glacier has retreated 725 m, with the rate of retreat from 2009-2021 of ~30 m/year.

View of the Deming Glacier from terminus to top of icefall in 2019. Jill Pelto at left, Abby Hudak and Mauri Pelto at right. X’s mark the velocity locations, Point A ties this to the upper glacier view, red arrow is the 1987 terminus location.

The icefall sweeps around a bedrock with an east and a west arm splitting above and rejoining below the knob.

The Deming Glacier from the top of the icefall to the summit of Mount Baker in 2020.

In mid-August 2022 snowpack was particularly low right to the top of Deming Glacier. Comparison with 2020 which was an average year for the last decade, but still a significant mass balance loss.

Deming Glacier terminus annotated to show retreat from 2004 to 2019 in photographs from Mauri Pelto

Terminus of Deming Glacier in 2004 and 2019 illustrating the ongoing retreat of the terminus, 725 m from 1979-2021.

Jill Pelto measuring Crevasse depth and snowpack thickness in Crevasse at 2500 m on Deming Glacier.

Glacier Landslides and Collapses Preconditioned by Warming

Lamplugh Glacier, Alaska in 2015 (before) and 2016 (after) landslide in Landsat images. The Landslide covered 17 km2 of the glacier, yellow dots. B=Brady, L=Lamplugh, R=Reid Glacier.

Ice whether as permafrost, in a glacier, filling cracks or coating surfaces literally helps stabilize materials on mountain slopes. Climbers who ascend glaciated peaks have long practiced early starts to avoid the heat of the day. The goal to avoid falling, rock, ice and snow all made more prevalent by the rising temperatures of the day, which leads to thawing/weakening the ice and snow binding materials together and to the mountain. Working on steep alpine glaciers each summer for 40 years, we do not go below a steep convex icefall or terminus after the sun is on it. These approaches are a risk accommodation to short term diurnal changes. This combination of hazards has been playing itself out on the small scale altering the climbing routes from Mont Blanc to Mount Kenya and Mount Rainier generating more frequent large-scale avalanches/landslides/glacier collapses in glaciated mountain ranges.  On Mont Blanc massif Maurey et al (2019) found that 93 of 95 climbing routes had been affected by climate change, 26 greatly and 3 no longer existed.

Long term climate change also leads to preconditioning that increases opportunities for thawing/melting and weakening of the bonds between mountains and the rocks, snow and ice perched on and within their slopes. Atmosphere and ocean warming over the past century are driving rapid glacier thinning and retreat of the majority of alpine glaciers destabilizing hillslopes and increasing the frequency of landslides from unconsolidated, unstable sediments often perched on slopes. Jacquemart et al (2020) conclude that as “meltwater production increases with rising temperatures, the possible increase in frequency of glacier detachments has direct implications for risk management in glaciated regions.”

The long term preconditioning has led to a number of  large avalanches/landslides/glacier collapses from 2015-2021.  Each has a unique story, but each is connected to warming.

Leones Glacier, Chile sequence of Landsat images illustrating the landslide and its evolution.

Flat Creek, AK

Flat Creek, Alaska is in the Wrangell Saint Elias National park. Jacquemart and Loso (2018) detailed a series of events from 2013-2016 generating debris flows. They identified in satellite images, that large parts of the glacier that occupied the head of Flat Creek disappeared during the August 2013 and August 2015 events. In 2013 shows that the front third of the glacier tongue went missing and in 2015, the ice in the central trough of the glacier disappeared altogether.   The combined events transported 24.4–31.3 × 10⁶ m3 of ice and lithic material from Flat Creek Glacier (Jacquemart et al 2020), who concluded this event was triggered by unusably high meltwater input. In 2016 the event was smaller, but the resulting debris flow/slushalanche was caught on video .

Taan Fjord, AK

Taan Fjord is a newly developed fjord in Icy Bay, Alaska resulting from glacial retreat in recent decades that has exposed unstable slopes and allowed deep water to extend beneath some of those slope. The Tyndall Glacier had retreated 17 km from 1961 to 2015, stranding lose deposits of glacial sediments on the slopes (Williams and Koppes, 2020). Slope failure at the terminus of Tyndall Glacier on 17 October 2015 sent 180 million tons of rock, 60 × 106 m3  into Taan Fiord,  (Dufresne et al 2017) . The resulting tsunami reached elevations as high as 193 m.

Lamplugh Glacier, AK

Lamplugh Glacier terminates in Glacier Bay, Alaska. In 2016 Southeast Alaska had its warmest spring ever. On June 28, 2016 a landslide triggered by the collapse of a rock face occurred. After accelerating downslope the debris hit the ice on the glacier and kept sliding bulldozing snow and ice as it went. Seismic analysis, indicated a landslide of about 120 million metric tons (Morford, 2016). The Landslide covers an area of 17 km2 and is 7.5 km long on the Lamplugh Glacier (Pelto, 2016)

Eliot Creek, BC

Rapid glacier retreat set the stage for a slope failure to occur in  Eliot Creek, a steep mountain valley in the Coast Range of British Columbia on November 28, 2020, about 18 million m3 of rock descended 1000 m down the steep slop, then across the toe of a glacier before entering a 0.6 km2 glacier lake displacing water that produced a >100-m high run-up (Geertsema et al 2022). A water saturated debris flow overtopped the lake outlet and scoured a 10-km long channel before depositing a 2 km2 fan below the lake outlet. Floodwater and associated debris entered the fjord where it produced a 60+km long sediment plume and altered turbidity, water temperature, and water chemistry for weeks. The outburst flood destroyed forest and salmon spawning habitat throughout the valley (Geertsema et al 2022).

Joffre Peak, BC

Two catastrophic landslides occurred in quick succession on May 13 and 16, 2019 from the north face of Joffre Peak in the Southern Coast Mountains, British Columbia. Beginning at 2560 m and 2690 m elevation as rock avalanches each rapidly transformed into debris flows along Cerise Creek. The toe of the main debris flow deposit travelled 4 km from the origin, with debris flood materials reaching 5.9 km downstream. Photogrammetry indicates the source volume of each event is 2–3 Mm3, with combined volume of ~5 Mm3 (Freile et al 2020). The slope was pre-conditioned by progressive glacier retreat and permafrost degradation, with precursor rockfall activity noted at least ~6 months previous. The 13 May landslide followed a  rapid snowmelt, with debuttressing from the first slide triggering the 16 May event (Freile et al 2020).

Chamoli, India

Nanda Devi region glaciers in 10-16-2020 image indicating the snowline at between 5800 and 6000 m on all the glaciers in the upper Rishi Ganga: Bethartoli (B), Dakshini (D), Ramani (R), Rinti (Ri), Trisul (T), Uttar Nanda Devi (UN), Uttar Rishi (UR).

On 7 February 2021, a catastrophic mass flow descended from the steep north face of Ronti Peak and then descended the Rishiganga, and Dhauliganga valleys in Chamoli, Uttarakhand, India, causing widespread devastation and severely damaging two hydropower projects (Shugar et al 2021). This event occurred after a post-monsoon season featuring high snowlines on adjacent glaciers and the warmest January in the last six decades  in Uttarakhand, India. and warmth across the region (Pelto et al, 2021; Matthews et al, 2021). By mid October the snowline on the glaciers had risen to ~5800-6000 m on glaciers in the region which is above the landslide initiation location,  see above.  More than 200 people were killed or are missing. The~27 × 106 cubic meters of rock and glacier ice collapsed and rapidly transformed into an extraordinarily large and rapidly moving debris flow that scoured the valley walls up to 220 meters above the valley floor (Shugar et al 2021).

Aru Glacier, Tibet

A 3 km long glacier collapsed in an ice avalanche on July 17, 2016, killing nine herders living in their summer pasture at Aru Village, Xizang Autonomous Region, China (Tian et al 2016). The Aru Glacier, ranged in elevation from 5250 to 6150 m. The collapsed ice flowed/slid downslope within 4–5 min over the narrow terminus tongue and swept across the gently-sloping alluvial fan, reaching Aruco Lake. The average depth of the deposits was estimated to be 7.5 m indicating a total volume of fallen ice of at least 70 million m3, or equivalent to an average glacier thickness loss of ~21 m (Tian et al 2016). Both glaciers had a mass balance gain in years prior to the collapse.

Air temperature at the nearest state-run meteorological station had increased by ~1.5°C over the past five decades. The total precipitation in the area prior to the accident had been the highest in the 2010–16 period exceeding the average value by 88% (Tian et al 2016).The event occurred in the midst of the summer monsoon during a period of wet weather. The warm wet weather likely pre-conditioned the event. There is no evidence of a previous event at this site.(Jacquemart et al 2020) concluded this event was triggered by unusably high meltwater input.

Leones Glacier, Chile


Leones Glacier in March 2015, Jill Pelto Photograph

Leones Glacier is a lake terminating outlet glacier on the east side of the Northern Patagonia Icefield. In late 2014 or early 2015 a landslide spread onto the Leones Glacier from an adjacent mountain slope. My daughter Jill took this image out a plane window returning from field work in the Falkland Islands, illustrating the landslide.  Landsat images from 2014 (before) and 2015 (after) indicate the 1.5 km2 size of the landslide debris cover on the glacier. By 2020 the landslide had migrated downglacier, but there is also debris cover further upglacier suggesting an additional smaller landslide, from a bedrock ridge in an icefall area. The glacier had been thinning 1 m/year and had a high snowline averaging above 1300 m in 2013, 2014 and 2015, which would further debuttress the mountain slope (Glasser et al 2016: Pelto, 2017).

Amalia Glacier, Chile

Amalia Glacier is a rapidly thinning outlet glacier of the Southern Patagonia Icefield. A 2019 landslide from the northeast slopes of Reclus Volcano with a volume of 262 ± 77 × 106 m3  disrupted 3.5 km2 of Amalia Glacier’s surface (Van Wyck de Vries et al 2022). Retreat had debuttressed the ice marginal mountain side that failed. The glacier briefly accelerated and then decelerated after the landslide.

Santa Lucia, Chile

On December 16, 2017 a rock landslide was triggered that transitioned into a debris flow incorporating much of a glacier before destroying most of Santa Lucia killing 18 people (Duhart et al 2019). The landslide occurred following an intense rainfall event with 122 mm of rain in 24 hours and a two week period of high temperatures. The flow had a volume of 7.2 million m3 with a flow velocity of 72 km/hour.


Swiss Alps Exceptionally High Glacier Snowlines Mid-July 2022

Rhone Glacier snowline at end of 2003 melt season, July 9, 2022 and July 17, 2022.

Rhone Glacier Sentinel images indicating the snowline position mid July 2021 and 2022 and mid-June 2022.

Rhone Glacier Sentinel images indicating the snowline position at the end of the melt season in 2018 and July 18, 2022. 

Rhone Glacier is a temperate valley glacier and is the primary headwaters for the Rhone River. Easy access to this glacier has resulted in terminus observations since 1880 (GLAMOS, 2021). From 1880-2020 the glacier has retreated 1575 m. The glacier experienced a minor advance from 1963-1987. From 1988-2020 retreat has been continuous totaling 520 m (GLAMOS, 2021; WGMS). This has been driven by ongoing mass balance losses, 15 consecutive years from 2007-2021, the entire period of record. Currently the glacier terminates in an expanding proglacial lake. The Glacier Monitoring in Switzerland (GLAMOS), led by Matthias Huss is the most comprehensive of any nation in the world, and their documentation of this exceptional summer of melt will be vitally important. Here we examine the snowline on the Rhone Glacier this summer compared to 2003 and 2018 the previous most extensive melt years.

In 2003 the snowline at the end of the melt season averaged 3100 m, there is a considerable area of firn above the bare ice line in the Landsat image. In 2018 the end of summer snowline averaged 3150 m. In mid-July 2021 a relatively average year the snowline is at 2800 m.  The mid-June 2022 snowline is already at 2800 m, by July 9 the snowline has reached 2950 m, rising to 3050 m by July 17 and 18 2022.  This post will be updated in one week with additional imagery illustrating the snowline position at the end of the heat wave. The rate of rise of the snowline during the recent heat waves can be used to determined ablation when the balance gradient is known (Pelto, 2011). There is relatively little firn exposed below this elevation, just bare glacier ice, because the snowline has often reached this elevation in recent years stripping the glacier down to bare glacier ice. In the six weeks as the snowline rises, there will an area of firn exposed.  The problem for the glaciers as we have seen over and over in recent summers is the loss of snowpack early in the summer, results in greater exposure of the more rapidly melted glacier ice, compared to snow (Pelto, 2022).  In the case of Haut d’Arolla Glacier and many other Austrian, French and Swiss alpine glaciers, by mid-July 2022 there is little snowpack remaining. This will increase mass loss. The increasing frequency and intensity of heat waves and their impact on glaciers has been a point of emphasis for our research.

Rhone Glacier retreat data from WGMS.

In 2003 the snowline in Landsat image is at m near the end the ablation season. On Sept. 18 2018 the snowline reached its highest elevation averaging 3100 m. On July 18 2021, the snowline on Rhone Glacier was at 2800 m, a typical elevation. On June 18, 2022 the snowline had already reached 2800 m, a month earlier than in 2021. By July 15, 2022 just as the latest heat wave was beginning the snowline had risen to an average of 2950 m.

Arolla Glacier snowline end of summer 2020 and 2021 and mid-July 2022 in Sentinel images.

Alsek Glacier, Alaska Releases its own Fireworks-Iceberg Discharge July 2022

Alsek Glacier, Alaska in a Sentinel Image from July 1, 2022 indicating an area of rapid recent calving, red dots. The northern tongue has accelerated in the last six year (NASA ITS_Live).

Alsek Glacier descends from the Fairweather Range terminating in Alsek Lake on the coastal plain. The glacier terminated at Gateway Knob (G) near the outlet of Alsek River from Alsek Lake in the early part of the 20th century (Molnia, 2005). At that time it had a joint terminus with Grand Plateau Glacier. The glacier retreated 5-6 km by 1984 along the central margin from Gateway Knob. In 1960 the glacier had a single terminus joining downstream of an unnamed island in Alsek Lake, that Austin Post told me reminded him of a boats prow. This “Prow Knob” (P) much like Gateway Knob a century ago stabilizes the terminus.  Retreat from this knob will lead to an increase retreat of Alsek Glacier.  Loso et al (2021) note that retreat of Grand Plateau Glacier will change the outlet of Alsek Lake from Dry Bay to the Grand Plateau Lake. Here we examine the change from 1984-2022 with Landsat and Sentinel imagery updating Pelto (2017)

Alsek Glacier retreat from 1984-2022 in Landsat images. Red arrows mark the 1984 terminus location, yellow arrows the 2022 terminus location, pink arrows indicate tributary separation, AR=Alsek River, GP=Grand Plateau, G=Gateway Knob, A=glacier junction, B=tributary separation, C=tributary separation, D=tributary confluence.

In 1984 the terminus location is denoted with red arrows it has separated into two termini on either side of “Prow Knob”. The northern terminus tongue is located on a narrow island on the north side of Alsek Lake. The southern tongue merges with the northern arm of Grand Plateau Glacier in 1984. Two tributaries at the pink arrows merge with the main glacier. By 1999 the northern tongue has retreated from the narrow island, which exposes the terminus to enhanced calving. The southern terminus has separated from the Grand Plateau Glacier. By 2013 the northern terminus has retreated to the northern end of “Prow Knob” and the southern terminus is directly south of “Prow Knob” in a 1.8 km wide channel.  By 2018 two tributaries of Alsek Glacier are fully detached from the glacier, pink arrows. In 2018 the northern terminus tongue has retreated 3.7 km since 1984 into the 2.0 km wide channel on the northeast side of “Prow Knob”. The center of the southern terminus has retreated 2.5 km since 1984 and remains in the channel on the south side of “Prow Knob”. The length of the calving front has declined from an 8 km long calving front in 1984 to a 4 km calving front in 2018. By 2021 further retreat has led to a 2.8 km wide calving front, and a 1.6 km long contact with Prow Knob. From 1984-2022 the retreat and loss of area has been: 4.3 km and 8.6 km2 respectively for the northern terminus,  2.7 km and 5.1 km2 for the southern terminus and 7 km and 13.1 km2 for the northern arm of Grand Plateau Glacier.

In 2022 the northern terminus arm has accelerated within 1 km of the calving front, note the two red X, marking velocity locations. This has generated additional calving and rifting, that is evident in the June 28 image. The NASA ITS_LIVE velocity measurement tool uses Landsat and Sentinel images to determine velocity using feature tracking. The rifting and acceleration is producing enhanced calving and retreat. The area of enhanced calving on July 1 is 0.3 km2. The acceleration and rifting is typically an indication of a greater degree of terminus flotation that can be due to thinning and/or reduced contact with Prow Knob. This will lead to additional calving events this summer as the glacier progressively detaches from Prow Knob.


Alsek Glacier retreat from 1999-2013 in Landsat images. Red arrows mark the 1984 terminus location, yellow arrows the 2022 terminus location, AR=Alsek River, GP=Grand Plateau, PK=Prow Knob, G=Gateway Knob, A=glacier junction, B=tributary separation, C=tributary separation, D=tributary confluence.

Alsek Glacier retreat from 2018-2021 in Landsat images. Red arrows mark the 1984 terminus location, yellow arrows the 2022 terminus location, pink arrows indicate tributary separation, AR=Alsek River, GP=Grand Plateau, PK=Prow Knob, G=Gateway Knob, A=glacier junction, B=tributary separation, C=tributary separation, D=tributary confluence.

Sentinel images from June 2022 illustrating the development of rifting at yellow arrow, that leads to the July 1 calving event. A=glacier junction, B=tributary separation, C=tributary separation


Zarilang Glacier, China Retreat and Lake Expansion

Zarilang Glacier in 1998 and 2021 Landsat images illustrating glacier retreat and lake expansion. Point A marks the junction of two tributaries.

Zarilang Glacier, China  flows north from the Bhutan border is in the Yarlung Zangbo River watershed draining the northwest flank of Kula Kangri. Yarlung Zangbo which becomes the Brahmaputra River supplies the Zangmu Dam (510 MW), online in 2015, that produces 2.5 billion kwh of electricity a year. Wang et al (2021) observe a significant increase in discharge of Yarlung Zangbo due to glacier melt and permafrost degradation.  Zhang et al (2020) observed glacier retreat leading to lake expansion averaging 20 m/year in the Himalaya for the 2008-2016 period, with Yarlung Zangbo basin having the highest average rate of lake expansion.

In 1998, Zarilang Glacier terminated in a proglacial lake that was 1.0 km long with an area of 0.24 km2, 1.8 km upglacier from the terminus was a significant junction at Point A, with a medial moraine marking the boundary extending to the terminus.  In 2001 the calving front is 400 m wide and has retreated ~100 m since 1998. By 2014 the glacier has retreated into a narrowing portion of the lake. By 2018 the medial moraine marks the eastern margin of the glacier, which means the eastern tributary is no longer reaching the lake. In 2021 the glacier has retreated 700 m and the lake is now 1.7 km long and has an area of 0.50 km2. In 2022 the calving front is 200 m wide and the glacier terminates 900 m from the junction at Point A, and the eastern tributary ends 100 m short of the lake. The lake area has doubled since 1998, which is a higher rate than the already high rate of 51% globally for glacial lakes noted by Shugar et al (2019) for glacial lakes 1990-2018.

Sun et al (2022) rated the hazard of a glacier lake outburst flood from this lake as low. The retreat is similar in scope to that of other glaciers retreating in expanding lakes in this region of China such as Sepu Kangri  and  Quiaqing Glacier. Examining glacier mass loss in the Himalaya King et al (2019) noted that lake terminating glaciers lost 30% more volume than other Himalayan glacier from.

Sentinel images in 2022 of Zarilang Glacier and the glacial lake. On May 31 there is some lake ice left. Note the medial moraine now is the eastern margin of the terminus.

Zarilang Glacier in 2001 and 2018 Landsat images illustrating glacier retreat and lake expansion. Point A marks the junction of two tributaries.