Porcupine Glacier, British Columbia Southern Terminus Breakup

Porcupine Glacier, British Columbia in a July 4, 2021 Sentinel image illustrating the retreat from 2015-2021 and new iceberg breakup (B). Red arrow is 2015 terminus location and yellow arrows 2021 terminus locations of both branches.

Porcupine Glacier is a 20 km long outlet glacier of an icefield in the Hoodoo Mountains of Northern British Columbia that terminates in an expanding proglacial lake. During 2016 the glacier had an unusually large 1.2 km2 iceberg break off  (A) the iceberg is still present. NASA  generated better imagery to illustrate this observation. The southern branch of the glacier has a tongue poised to breakup at that time (B). Menounos et al (2018) identified a mass loss for glaciers in this region of ~0.6 m year from 2000-2018 which is driving retreat. Here we examine the  change in terminus position and iceberg deterioration from 2015-2021  using Landsat and Sentinel images.

In 2015 the glacier had retreated 3.1 km from the 1988 location (Pelto, 2016).  In 2015 there are two tongues of the glacier vulnerable to calving at Point A and B.  In 2016 Iceberg A has calved generating an immediate retreat of 1.7 km. In June of 2017 the iceberg size has been reduced 10-15%, with little change in position.  The iceberg is plugging smaller icebergs from moving down the lake. In August 2018 the iceberg because of its size has still drifted little and at 0.6 km2 has lost half of its area in the two years.  This has enabled smaller icebergs to move past the iceberg down the lake. In July of 2019 the iceberg has diminished further to 0.45 km2, but is enmeshed in a melange of other icebergs as well.  The glacier has continued to retreat from 2016 to 2019 as expected, ~500 m.  The glacier tongue at Point B  narrowed considerably from 2015 to 2019 and is poised to separate.  The narrowness and potentially shallower depth of this inlet may make it difficult for a single iceberg to emerge from the collapse of this glacier tongue. Iceberg B calved in the summer of 2020 and by July of 2021 is in four main pieces.  The retreat of the main terminus from 2015-2021 is  2000 m and for the southern branch it has been 1600 m.

The retreat rate is greater than that at Dawes Glacier to the west in Alaska or Jacobsen Glacier to the south in British Columbia.

Porcupine Glacier in Landsat images from 2015 and 2020.  Ice tongue  A and B are indicated for 2015 and then Iceberg A and B for 2020.

Porcupine Glacier in Landsat images from 2016 and 2018 and 2019 Sentinel Image.  Iceberg A and Ice tongue B are indicated on each. The haziness in 2019 is forest fire smoke. The yellow arrows mark the 2019 terminus location.

Pacific Northwest June 2021 Heat Wave Current and Enduring Glacier Impact

Streamflow observation site below Sholes Glacier on August 6, 2015.  We have measured flow at this site for 30 years, the last 10 years in conjunction with the Nooksack Indian Tribe (Grah and Beaulieu, 2013; Pelto, 2015).

The exceptional record breaking Pacific Northwest heat wave of June 2021 had an impact on snow melt both on and off glaciers in the North Cascade Range of Washington and consequently on alpine rivers. Here we examine the specific snow melt, streamflow and stream temperature in the Nooksack Basin, near Mount Baker, from this week.  We compare that to our observations of glacier melt and glacier runoff during summer heat waves, that are typically later in summer over the last 37 years.

Glacier runoff is a major source of streamflow during the summer low-flow season and mitigates both low flow and high water temperatures (Pelto, 2015). This is particularly true during summer heat waves, but this ability has been diminishing in the region (Moore et al 2020)  For the last 37 summers we have been in the field monitoring North Cascade glaciers response to climate change including during heat waves (Pelto, 2018). In the last decade we have made synchronous observations of glacier ablation and stream discharge immediately below Sholes Glacier, Mount Baker (Pelto, 2015). This in conjunction with observed daily discharge and temperature data from the USGS stations on the ~6% glaciated North Fork Nooksack River (NFN) and the unglaciated South Fork Nooksack River (SFN), contrasts and quantifies the ameliorating role of glacier runoff on discharge and water temperature during 23 late summer heat wave events.  Map of the region below indicates the differences including a mean altitude of  1311 m in NFN being vs 914 m for SFN which leads to higher snowpack and glacies in NFN.

Snowpack loss during the June 21-June 28 period at the Middle Fork Nookack, USDA Snotel site at 1515 m and the Heather Meadows, Northwest Avalanche Center site at 1285 m.

Durng the June 2021 heatwave from June 21-289 maxium daily stream temperature in SFN warmed 3 C, vs 0.8 C for NFN.  This illustrates that a greater proportion of snowmelt, which NFN recieves, has limited the temperature rise.  This is similar to that observed for 23 summer heat waves occurring from Late July on, where the mean water temperature increase was 0.7o C in the NFN and 2o C in the SFN.

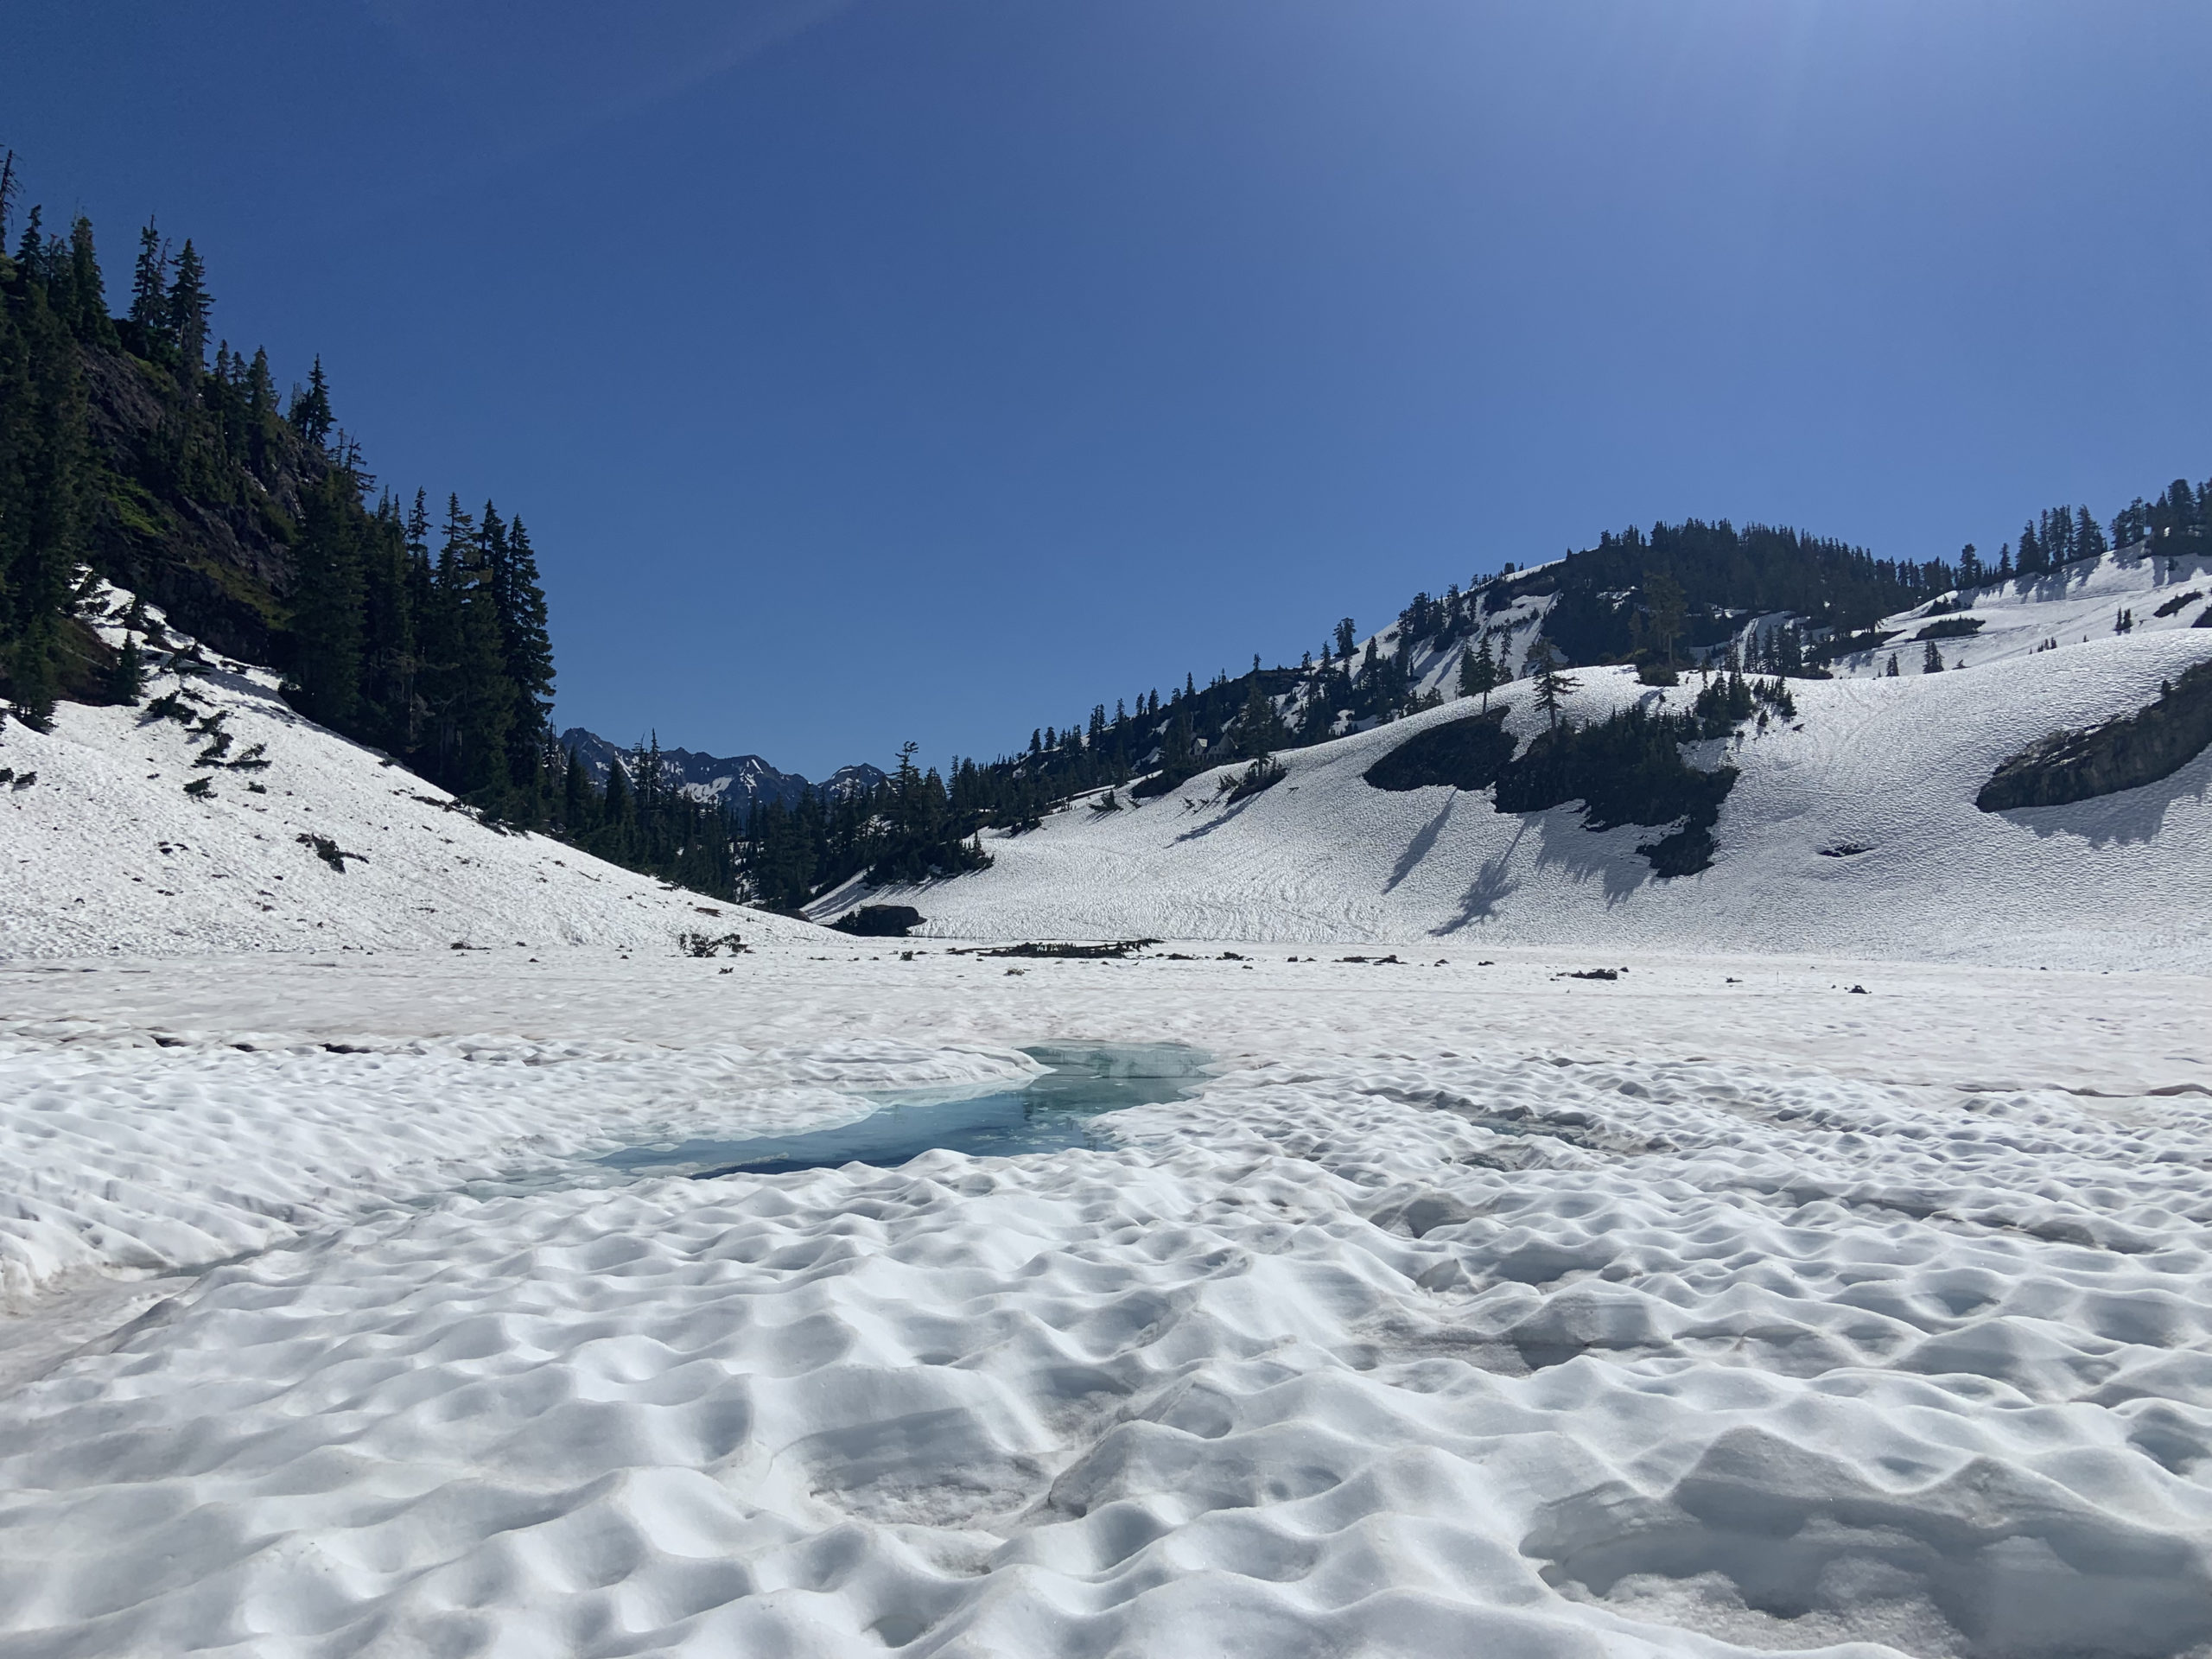
For this period discharge in the SFN first increased 100 cfs from June 23 to June 25 and then by June 28 declined back to the June 23 levels.  The initial increase indicated an increase in snowmelt rate as temperatures rose.  The decrease by June 28 despite high temperatures indicates a decrease in snowmelt volume as the area of snowcover declined more than the increase snowmelt rate. in SFN. For NFN discharge during the week increased from 2500 cfs to 3500 cfs as snowmelt volume increased due to a higher melt rate, and then began to decline on June 29 as snowcover was reduced.  This is a 40% increase in discharge.  During the 23 previous summer warm weather events the discharge increased an average of +23% in the NFN and decreased an average of 20% the SFN.  For the NFN discharge increased by more than 10% during 18 of the 23 periods.  In the SFN discharge decreased by more than 10% during 21 of the 23 periods.  For discharge SFN did not decline from start to end of the heat wave, but did rise and then drop to the pre heat wave level.  For NFN the 40% increase in discharge exceeds the 23% average increase in discharge for summer heat waves later in the summer when glaciers play a larger role and snowpack much less. Snow melt during the June 2021 heat wave in the 1300-1600 m range averaged 15 cm per day in depth and 8 cm water equivalent per day.  Snow cover in the basin on June 21 was nearly complete above 1200 m on June 23, see image below from near 1300 m at Bagley Lakes.  This compares to obseved snow melt rates of 4.5 to 6.5 cm water equivalent per day during heat waves on Mount Baker glaciers in the 1600-2000 m range. For ice surfaces with a higher albedo and greater density the observed melt rates are 7-9 cm per day water equivalent.


USGS streamflow data from 6-21-2021 to 6-29-2021 for the North Fork Nooksack River and South Fork Nooksack.  Discharge in CFS is above and stream temperature is below.

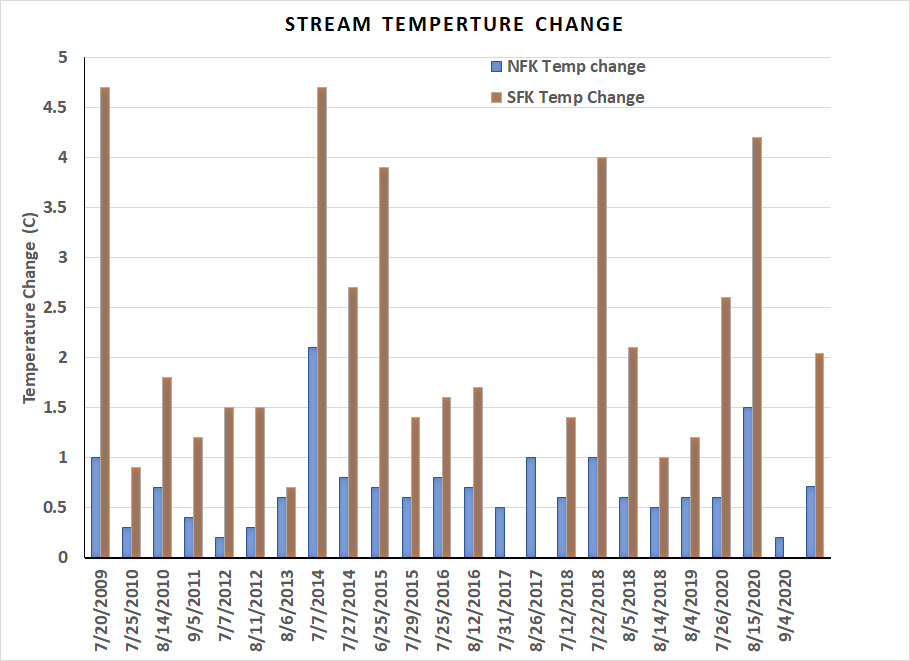
Change in daily stream temperature in the North Fork Nooksack (NFK) and South Fork Nooksack (SFK) during the 23 warm weather events from the beginning of the period to the maximum observed daily temperature.  

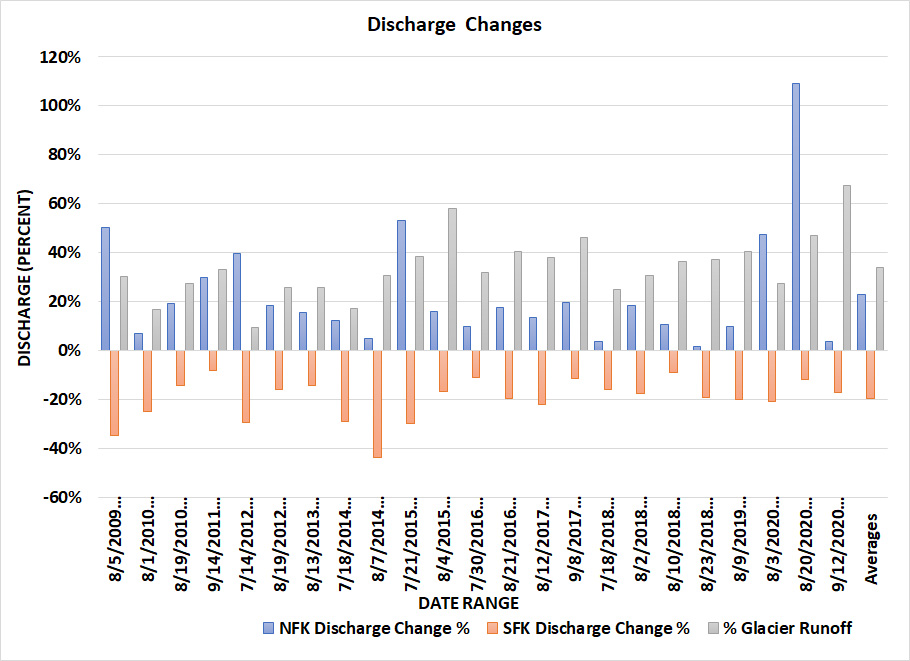
Change in discharge in the North Fork Nooksack (NFK) and South Fork Nooksack (SFK) during the 23 warm weather events.  The percent of North Fork Nooksack discharge generated by glacier runoff is also indicated.

The identified ablation rate is applied to glaciers across the North Fork Nooksack (NFN) watershed, providing daily glacier runoff discharge to the North Fork Nooksack River.  For the North Fork glacier runoff production was equivalent to 34% of the total discharge during the 23 later summer heat wave events.  As glacier area declines, this production will decline (Moore et al 2020) .  This summer the ability of the heat wave to expose bare glacier ice earlier, which has a higher melt rate than snow will be key to determining how much mass the glaciers lose.  The primary response to these summer heat waes is increased discharge in the heavily glaciated NFN, and increased stream temperature in the unglaciated SFN.

For the 38th consecutive summer we will be in the field to determine the specific impact and annual balance of North Cascade glaciers. Certinaly this event represents a significant volume loss in the 10-15% range of typical summer ablation, in one week. We have ablation stakes in place to measure ablation on the glaciers,  that will be checked when conditions are safer to work on the glaciers. Ongoing climate change will cause further decreases in summer baseflow and an increase in water temperature potentially exceeding tolerance levels of several Pacific salmonid species (Grah and Beaulieu, 2013).

Snowpack on June 26 at Bagley Lakes Basin, image from Sally Vaux, Western Washington U, who will be working with us in the field this summer.

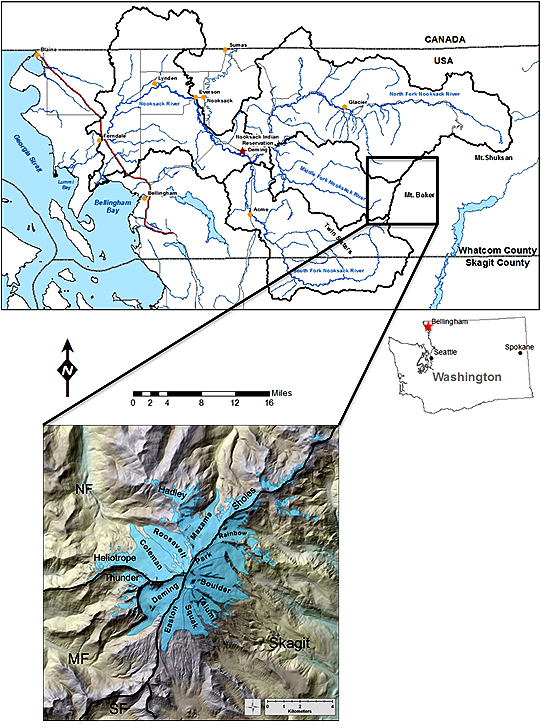
Map of Nooksack River and Mount Baker glaciers.

Paarliit Sermia, Southern Greenland Terminus Separation

Paarliit Sermia in 2000 and 2020 Landsat images.  The red arrow indicates the 2000 terminus location and the yellow arrow the 2020/21 terminus location. A denotes the junction of two main glacier branches, while B,C and D indicate tributaries

Paarliit Sermia is one of the most southerly tidewater glaciers in Greenland.  It is an outlet glacier of a mountain icefield and not part of the main ice sheet.  Similar to other icefield outlet glaciers whether in Alaska  (Dawes Glacier) or Patagonia (Upsala) retreat is leading to glacier separation. Greenland tidewater outlet glaciers in this region have experienced substantial retreat since 1990, Weidick et al (2012) and Howat and Eddy (2011).  There was also an increase in sea surface temperature (Straneo et al, 2013).  Moon et al (2020) noted a there is a rapid reconfiguration of the Greenland Ice Sheet Coastal margin due to retreat. The retreat of glaciers in southern Greenland is changing the physical geography and hence the physical oceanography of the fjords.  Here we examine Landsat imagery from 2000-2021 to identify the changes of Paarliit Sermia.

The Greenland Topographic map indicates the terminus down fjord from tributary B, 6.5 km from the main junction of two glacier branches at Junction A.  Tributary B, C and D all feed the main glacier. By 2000 the glacier has retreated beyond tributary B and C.  The snowline is between 550 m and 600 m in 2000 and 2002. In 2017 the glacier has retreated beyond Tributary D, and the snowline is slightly above 600 m. The two main branches are still joined, with the terminus now just 1 km from Junction A. Former Tributary C and D no longer reach tidewater. In 2020 the two main branches have separated and Point A is no longer a junction glacier has separated into two branches, the snowline is at ~600 m. In mid-June of 2021, the snowline is already at 500 m, despite being early in summer.  Paarliit Sermia has retreated 2.4 km from 2000-2021, a rate of ~200 m/year.

Nearby Kangersuneq Quingordleq Glacier retreated 2.8 km from 1999-2016. To the northeast Qaleraliq has experienced a 3.2 km retreat of its west arm and 1.2 km of its east arm from 1992 to 2012.   To the northeast Tingmiarmiit Glacier’s retreat from 1999-2015 has led to complete separation of the western and northern tributary. The western tributary is the main glacier and has retreated 2.4 km and the northern tributary has retreated 2.2 km in the 16 year period. In the case of nearby Tasermiut Fjord retreat has led to the fjord losing its tidewater connection.

Paarliit Sermia in 2002 and 2017 Landsat images.  The red arrow indicates the 2000 terminus location and the yellow arrow the 2020/21 terminus location. A denotes the junction of two main glacier branches, while B,C and D indicate tributaries

Paarliit Sermia in 1980’s Greenland Topographic map (from Nuna GIS) and 2021 Landsat images.  In the Landsat image the red arrow indicates the 2000 terminus location and the yellow arrow the 2020/21 terminus location.  On both map and image A denotes the junction of two main glacier branches, while B,C and D indicate tributaries

Dawes Glacier, Alaska Retreat Driven Separation

Dawes Glacier retreat in 1985 and 2020 Landsat images. Red arrow 1985 terminus, yellow arrow 2020 terminus. Point 1-3 are tributaries joining the main glacier. The glacier is about to separate into two calving termini.

Dawes Glacier terminates at the head of Endicott Arm in the Tracy Arm-Fords Terror Wilderness of southeast Alaska. Endicott Arm is a fjord that has been extending with glacier retreat, and is now  58 km long.  Dawes is a major outlet glacier of the rapidly thinning Stikine Icefield. Melkonian et al (2016) observed a rapid thinning of the Stikine Icefield of -0.57 m/year from 2000-2014.  Here we compare Landsat imagery to identify changes from 1985-2020. Endicott Arm is host to a population of harbor seals that prefer hauling out on icebergs during the day supplied by Dawes Glacier (Blundell and Pendleton, 2015)

In 1985 the glacier terminated at the red arrow in each image, the tributaries at points 1,2 and 4 connected with the main glacier. Point 3 is the junction point of two tribuataries. The northern arm is 1.3 km wide and the eastern arm is  2.5 km wide.  The snowline was at 1100 m.  In 1987 the snowline on the glacier was at 1150 m.  By 1999 the glacier had retreated 900 m since 1985 and the snowline was at  1300 m.  In 2019 the tributaries at Point 1, 2 and 4 have detached from the the main glacier. At Point 3 the northern arm has declined to 0.7 km wide and the eastern arm is  1.8 km wide.  In 2019 the snowline is at a record 1450-1500 m.This fragmentation of Dawes Glacier will continue, which leads to a reduced ice flux to the terminus reach. By 2020 Dawes Glacier has retreated 3.8 km since 1985, a rate of 105 m/year. The snowline is again exceptionally high at 1400-1450 m. Of equal importance the glacier terminus is separating into two individual calving termini, that could become fully separate this summer of 2021.

McNabb et al (2014) reported a thinning of 62 m/year from 1985-2013. The reduced inflow and up glacier thinning is ongoing and has driven the increased retreat rate despite a reduction in water depth at the cavling front. A key mechanism for retreat over the last century has been calving. The 2007 Hydrographic map of the area indicates water depth at the calving front still over 100 m, with a depth of 150 m 1 km down fjord of the terminus (see bottom image). The  depth more recently has declined to 60 m at the calving front in 2013 (Melkonian et al 2016), yet retreat has increased driven by enhanced melting. The glacier thinning is continuing, but the retreat rate will decline as the fjord head is approached.

At the glacier front the velocity was 13 m/day in 1985, increasing to 18 m/day by 1999 and declining to 5 m/day by 2014 (Melkonian et al 2016).

This reduction will reduce calving and iceberg production. As icebergs are reduced harbor seals will be disappointed as they prefer icebergs to haul out on. The Alaska Department of Fish and Game has been monitoring harbor seals in the fjord and noting that females travel to pup on the icebergs in the spring and also utilize them for mating.  ADFG attached satellite tags to harbor seals to monitor their movements beyond the breeding and puppin season finding  that that adult and sub-adult seals captured in Endicott Arm spent the late summer and fall months in Stephens Passage, Frederick Sound, and Chatham Strait. How will a reduction in icebergs affect this population overall?

The retreat leading to separation is also happening at other outlets of Stikine Icefield such as Baird Glacier and Sawyer Glacier.

Dawes Glacier retreat in 1985 and 2020 Landsat images. Red arrow 1985 terminus, yellow arrow 2020 terminus and purple dots the snowline. Point 1-4 are tributaries joining the main glacier.

Dawes Glacier retreat in 1985 and 2020 Landsat images. Red arrow 1985 terminus, yellow arrow 2020 terminus and purple dots the snowline. Point 1-4 are tributaries joining the main glacier.

Dawes Glacier in June 2021 Sentinel image. Indicating the impending separation of the terminus.

Hydrograh of Endioctt Arm from 2007.

Jacobsen Glacier, BC Separation Nearly Complete

Jacobsen Glacier in Landsat images from 1987 and 2019. Red arrow 1987 terminus location, yellow arrow 2019 terminus location and pink dots the snowline. Point A indciates ice marginal lake in 1987, Point C is the glacier junction, Point B an emerging rock rib and Point D a nunatak.

Jacobsen Glacier is part of the Monarch Icefield of the Coastal Range of British Columbia. VanLooy and Forster (2008) noted that the glacier retreated at a rate of 30 meters/year from 1974 to 1992 and 47 meters/year from 1992-2000. Menounos et al (2018) identified a mass loss for glaciers in this region of ~0.5 m year from 2000-2018 which is driving retreat. The glacier is at the headwaters of jacobsen Creek, which joins the Talchako River and then Bella Coola River.  The Bella Coola River is one of the most important salmon producing rivers on the British Columbia’s central coast. It supports the largest chinook and chum salmon populations, surveyed at 23k and 190k in surveys during the last decade (Pacific Salmon Foundation, 2021)  The sockeye and pink salmon runs have largely collapsed this century (Pacific Salmon Foundation, 2021). In this post we examine Landsat satellite imagery from 1987-2019 and Sentinel imagery from 2021 to illustrate the changes.

In 1987 the glacier terminated in a 1.8 km long proglacial lake at an altitude of ~1080 m .  The north margin had a separate terminus in the proglacial lake at Point A.  The terminus in the main proglacial lake 900 m wide. At Point B there is an icefall, but not exposed bedrock. The snowline was at 2050 m.  By 1995 the glacier had retreated 500 m.  The glacier was in contact with the proglacial lake at Point A.  The snowline was at 2100 m. By 2000 the glacier has retreated from the proglacial lake at Point A, due to thinning.  In 2016 the snowline is at 2150 m.  The glacier is now separated from the proglacial lake at Point A by ~500 m.  The southern tributary no longer reaches the expanding proglacial lake. In 2018 there is bedrock exposed at Point B.  The snowline is at 2100 m.  In 2019 the proglacial lake has expanded to a length of  3.3 km, a retreat of 1500 m from 1987-2019. The retreat and lake expansion has been 1500 m from 1987-2019, a rate of 47 m/year, only a slight change from the 1990-2000 reported rate. The snowline is at 2100 m. In May 2021 the Sentinel image indicates the medial moraine has widened to the point there is no interaction between the northern and southern tributary of Jacobsen Glacier.  The terminus in the expanding lake is now 400 m wide. The lake basin likely ends before Point C, based on surface slope changes of Jacobsen Glacier.

The retreat rate during this period is  less than the ~120-130 m/year at Bridge Glacier, Franklin Glacier or Klinaklini Glacier, and slightly more than at Bishop Glacier and Klippi Glacier. The combined loss in glacier area impacts glacier runoff particularly in late summer. Moore et al (2020) examining the Columbia River basin headwaters of Canada noted, “that glacier-melt contributions to August runoff have already have passed peak water, and that these reductions have exacerbated a regional climate-driven trend to decreased August streamflow contributions from unglacierized areas.”

Jacobsen Glacier in Landsat images from 1995 and 2018. Red arrow 1987 terminus location, yellow arrow 2019 terminus location and pink dots the snowline. Point A indciates ice marginal lake in 1987, Point C is the glacier junction, Point B an emerging rock rib and Point D a nunatak.

Jacobsen Glacier in Landsat images from 2000 and 2016. Red arrow 1987 terminus location, yellow arrow 2019 terminus location and pink dots the snowline. Point A indciates ice marginal lake in 1987, Point C is the glacier junction, Point B an emerging rock rib and Point D a nunatak.

Sentinel Image from May 2021