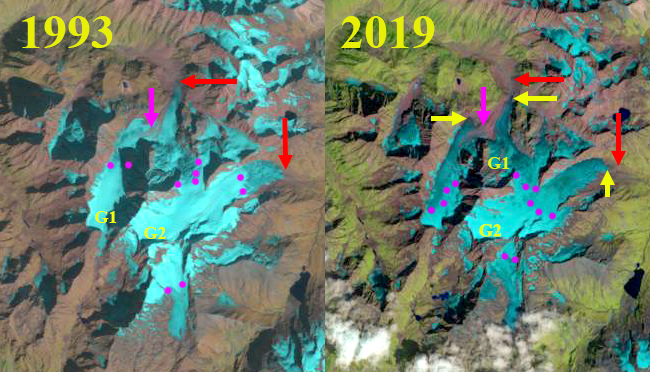
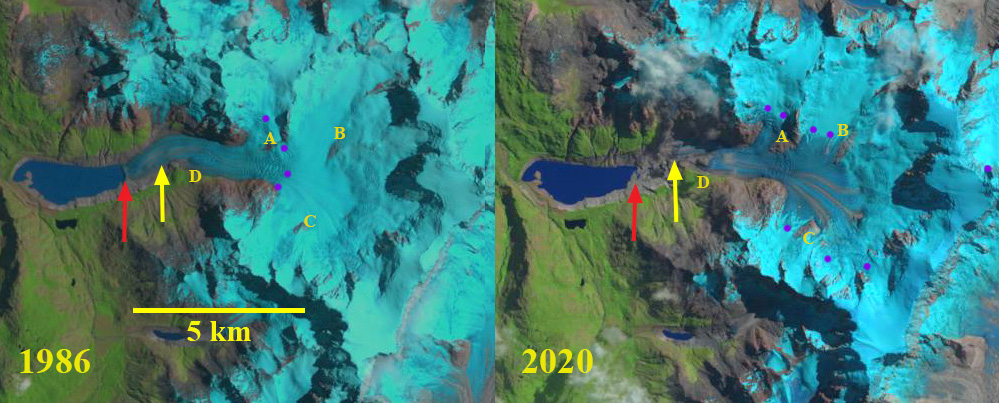
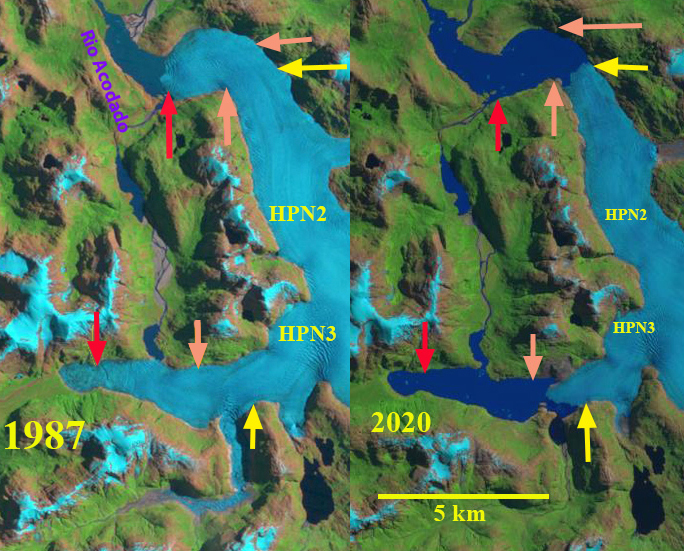
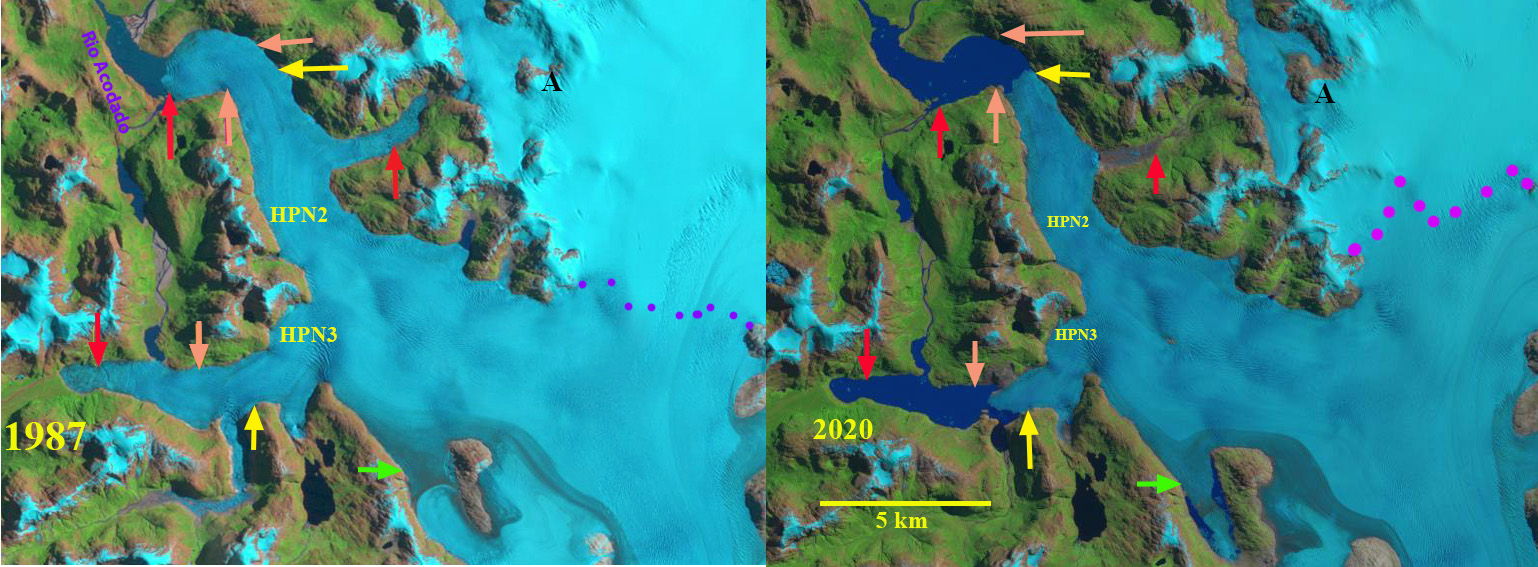
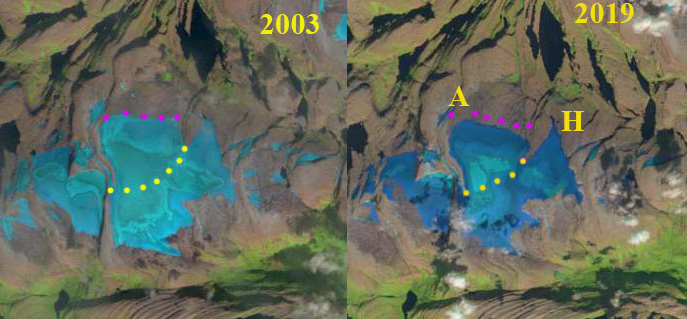
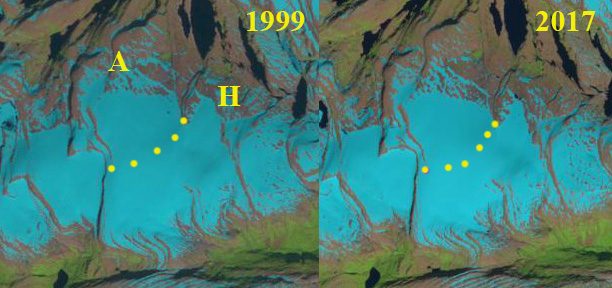
Vern Ritchie (VR) and Battle Glacier (B) in 1987 and 2019 landsat images. Three proglacial lakes have expanded at Points 2-5. WN=West Nunatak Glaier, Y=Yakutat Glacier N=Novatak Glacier, purple dots indicate snowline and green arrows indicate glacier flow direction.
Vern Ritchie and Battle Glacier flow from the Alaska/Canada border of the St. Elias Mountains towards the Alsek River. In 1987 the two glaciers that share both an accumulation zone and a terminus area terminated in small proglacial lakes at 240 m. The main flow path of Battle Glacier connects to West Nunatak Glacier and Novatak Glacier, Alaska at a low elevation saddle at 750-800 m. The Vern Ritchie Glacier is 45 km long and extends north parallel to the border to an elevation of 1800 m. A portion of this higher elevation accumulation is separated by a nunatak at Point 1 at ~850 m and joins the Battle Glacier 20 km from the terminus. Here we utilize Landsat images from 1987-2019 to identify the impact of climate change on these two glaciers. Trussel et al (2015) noted an extremely high thinning rate of 4.4 m/year on the adjacent Yakutat Glacier from 2000-2010, and it retreated 7 km losing 45 km2, of area from 2000-2018 (Pelto, 2018). Glaciers of the Glacier Bay region lost ~0.6 m/year from 1995-2011 (Johnson et al 2013).
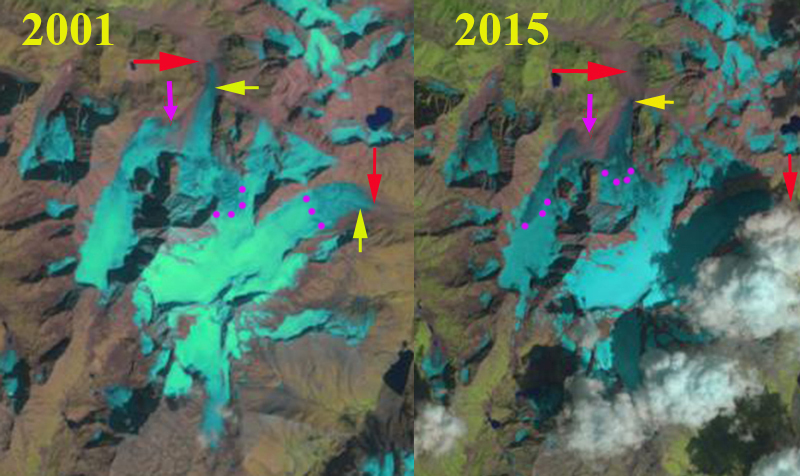
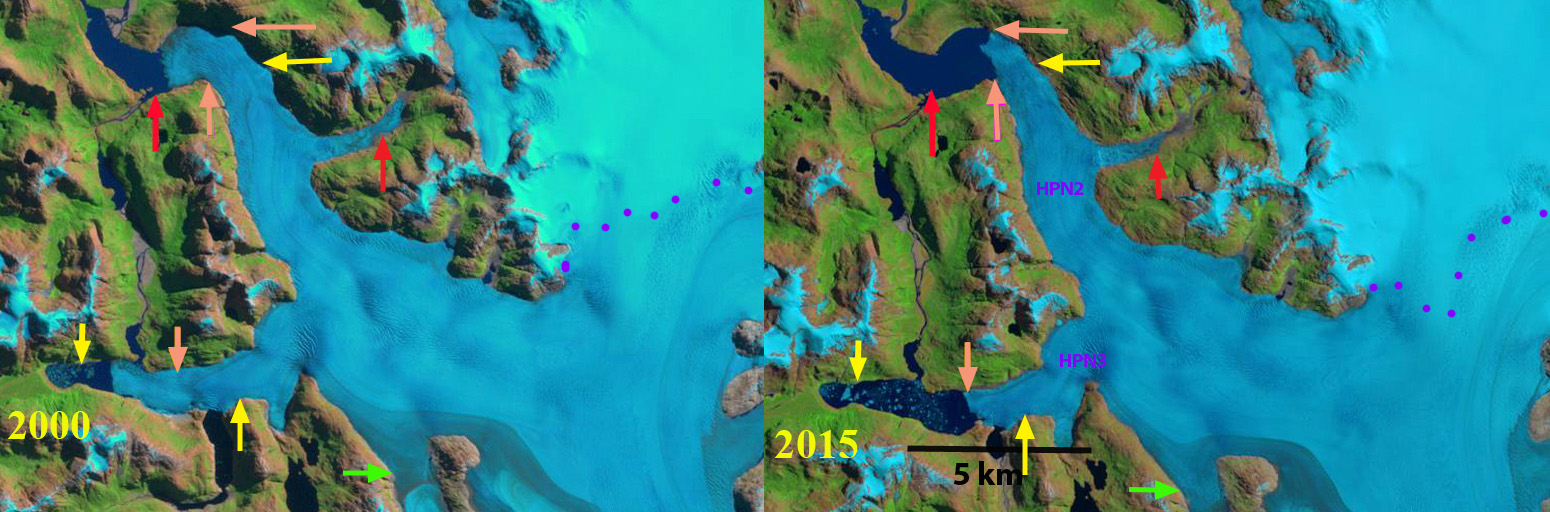
Un 1987 Vern Rithcie Glacier’s northern terminus near Point 4 rested on an outwash plain. The southern terminus near Point 3 terminated in a 2.5 km2, proglacial lake. Battle Glacier terminated in a narrow fringing proglacial lake with an area of less than 1 km2. The divide between Battle Glacier and West Nunatak Glacier was in the ablation zone. The connection at Point 6 to Novatak Glacier is km wide. The snowline in 1987 on Vern Ritchie Glacier was at 1000 m. In 1998 both lakes had expanded significantly as thinning and retreat accelerated. The snowline is at 800 m in early August on Vern Ritchie Glacier and is at 750 m on Battle Glacier covering the divide with West Nunatak Glacier. At Point 6 the connection to Novatak Glacier remains wide. By 2015 a proglacial lake had formed at the northern terminus at Point 4 with an area of ~2 km2. The southern terminus glacial lake has expanded to ~6 km2, and has several large icebergs evident. Battle Glacier at Point 5 now terminated in a ~5 km2 lake that has a few icebergs. The snowline is at 1100 m on Vern Ritchie Glacier.
In 2018 and again in 2019 record snowline elevations since 1946 were noted at Taku Glacier near Juneau, AK (Pelto 2019). In 2018 the nearby Lowell Glacier exhibited a substantial snow swamp (NASA, 2019). The snowline was the highest observed on Vern Ritchie Glacier at 1340 m. At Point 6 the connection to Novatak Glacier continues to narrow. The Vern Ritchie northern terminus lake has expanded to 2.7 km2. The southern terminus lake in 2019 has an area of ~7 km2, a 225% increase since 1987, and again has several icebergs. Battle Glacier has receded to Point 2 a retreat of 3800 m since 1987 and the lake now has an area of ~6 km2 . The lake also has several significant icebergs.
The main portion of Battle Glacier is fed by flow from the divide region with West Nunatak and Novatak Glacier, which is no longer retaining accumulation on a consistent basis and this portion will melt away. The connection to Vern Ritchie at Point 1 remains wide, but there is a sill here, that is becoming more evident indicating a reduction in flow. Vern Ritchis continues to retain snowpack on the upper reaches of the glacier. The retreat of this glacier is less spectacular than nearby Melbern Glacier or Yakutat Glacier.
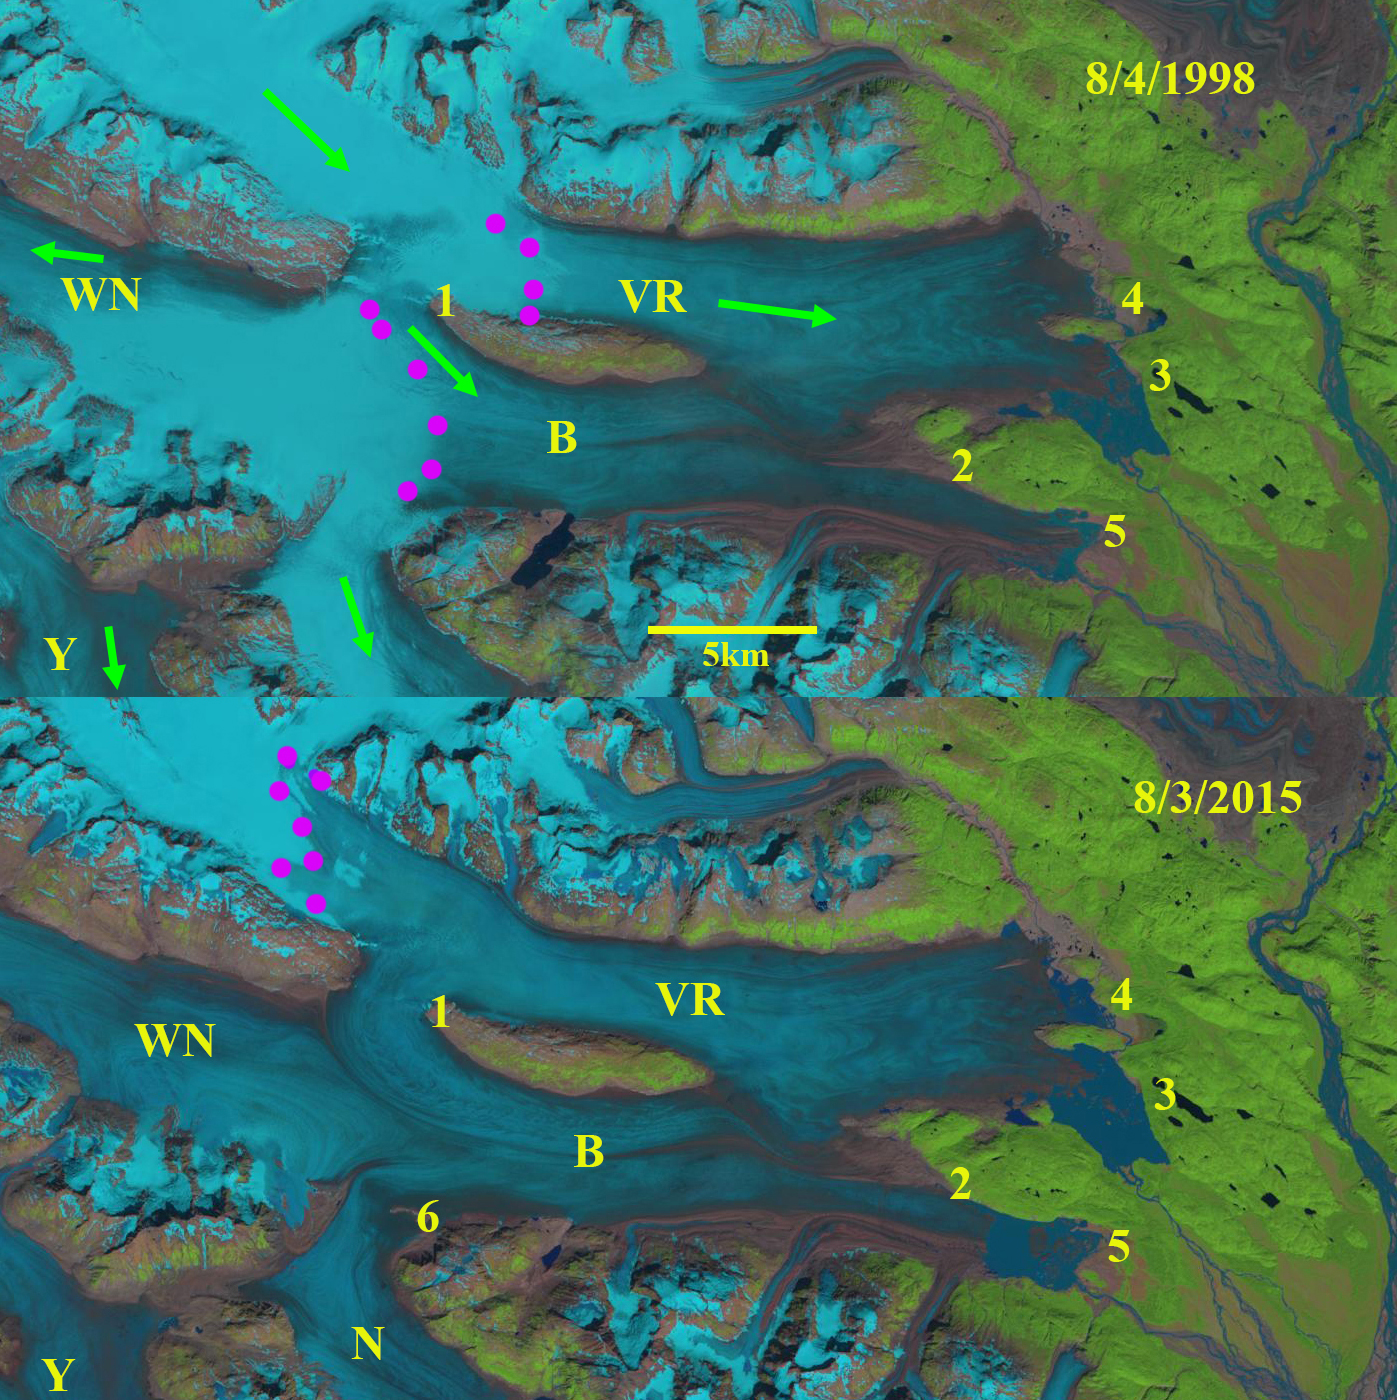
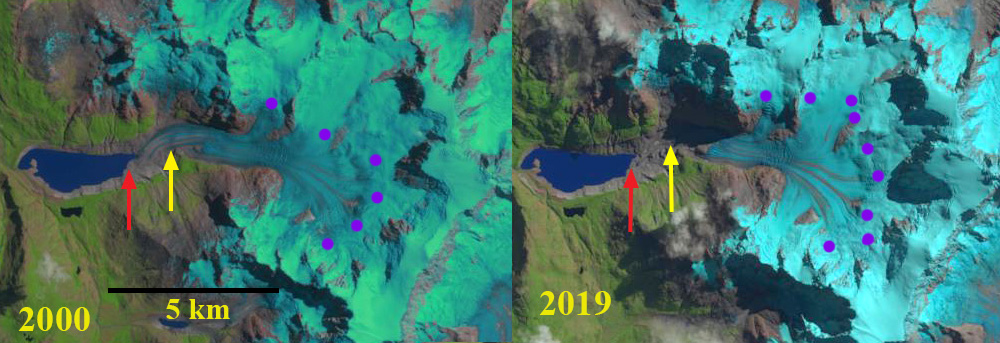
Vern Ritchie (VR) and Battle Glacier (B) in 1998 and 2015 landsat images. Three proglacial lakes have expanded at Points 2-5. WN=West Nunatak Glaier, Y=Yakutat Glacier N=Novatak Glacier, purple dots indicate snowline and green arrows indicate glacier flow direction.

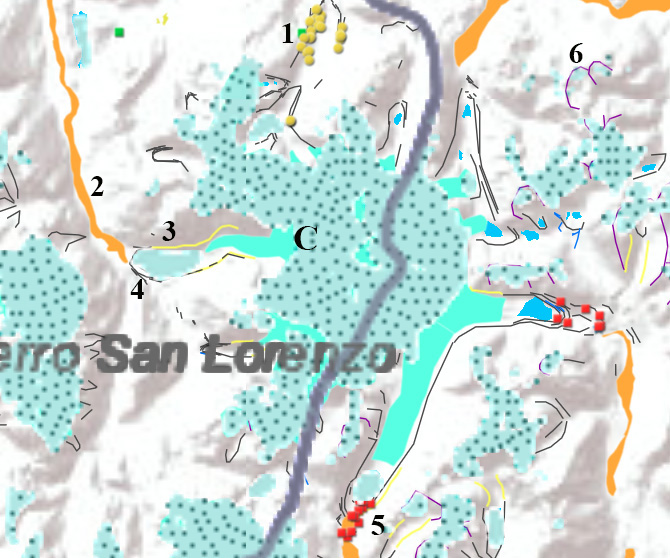
Canada Topographic map of the terminus region from Atlas of Canada