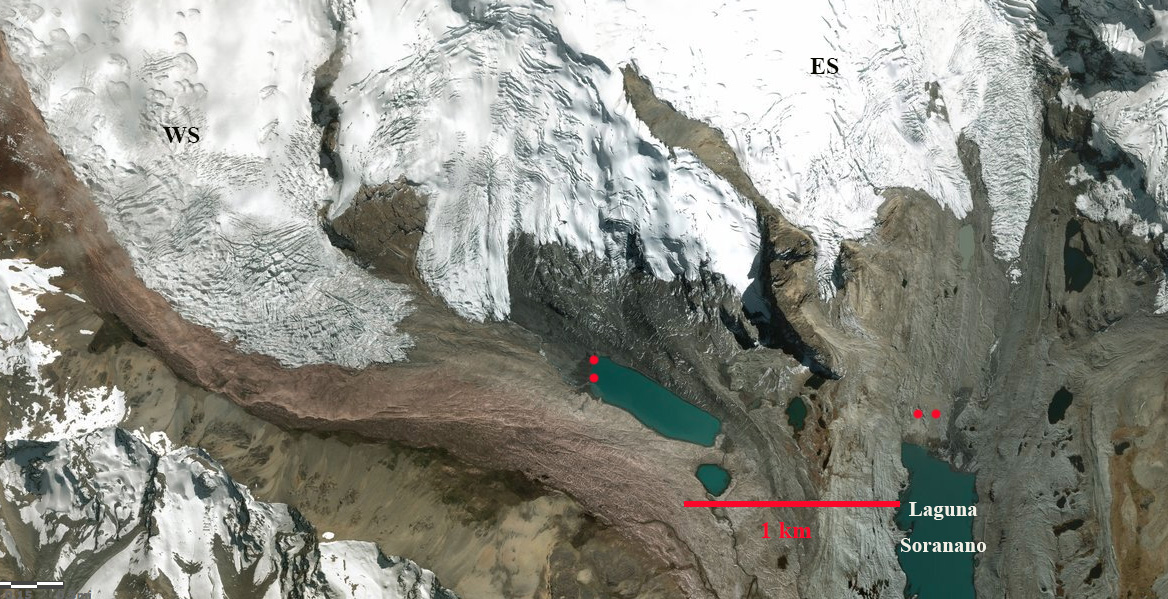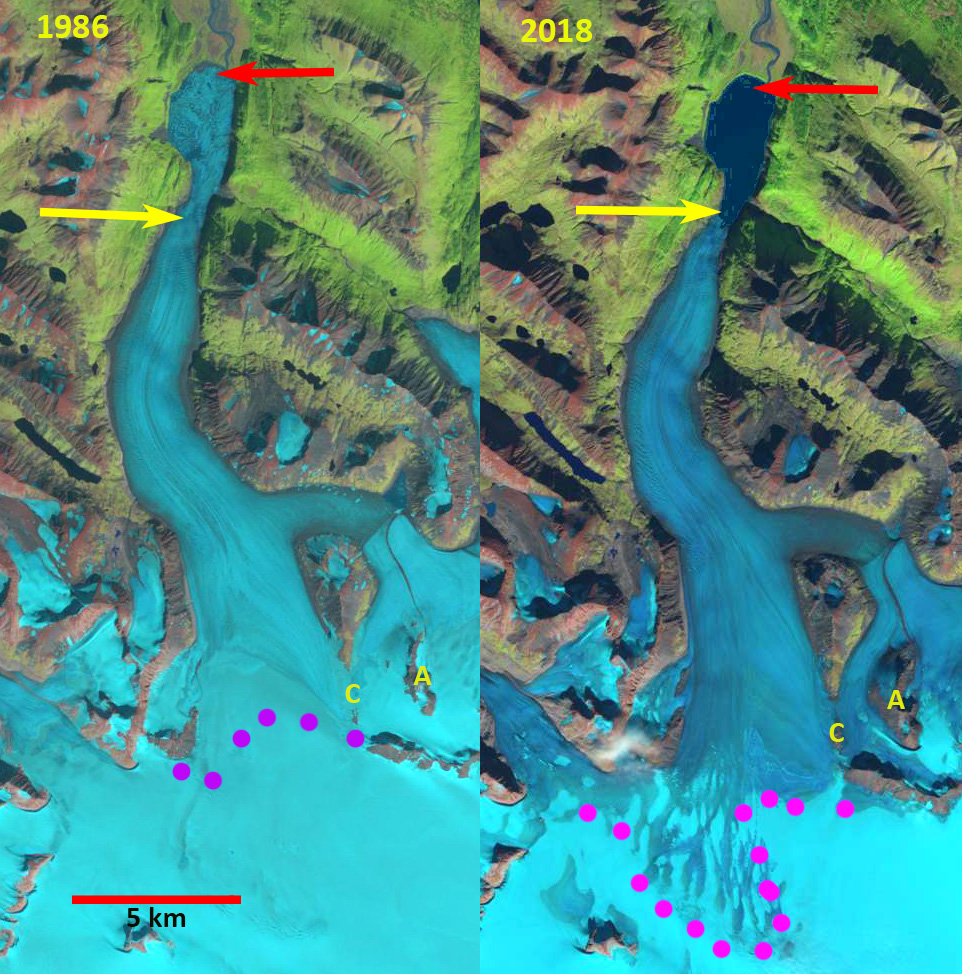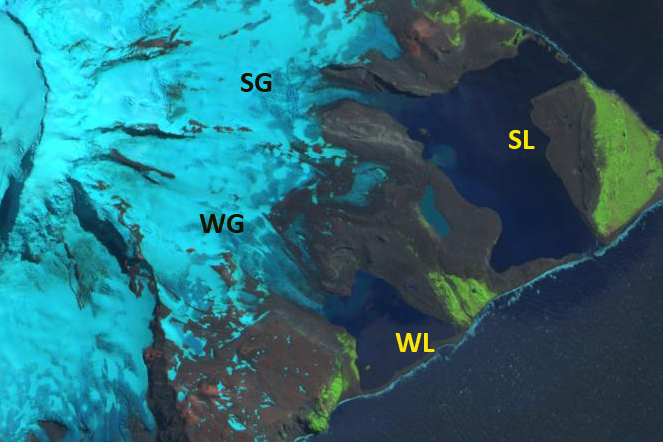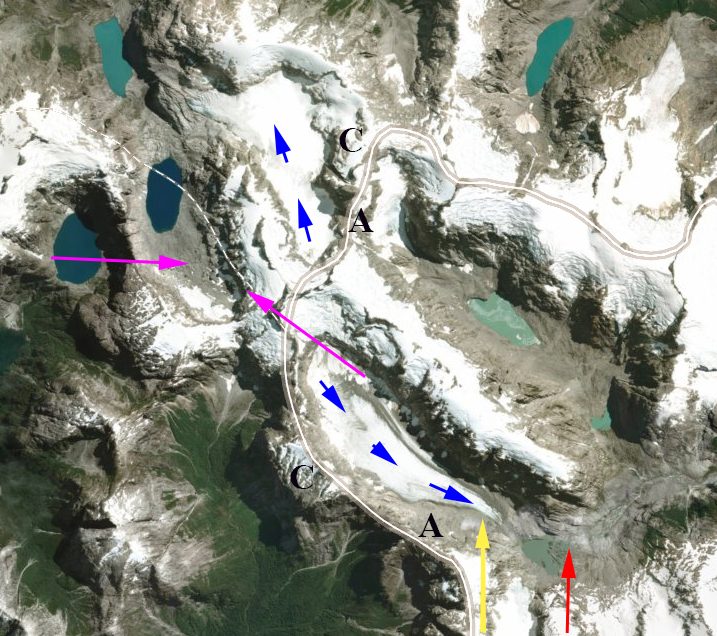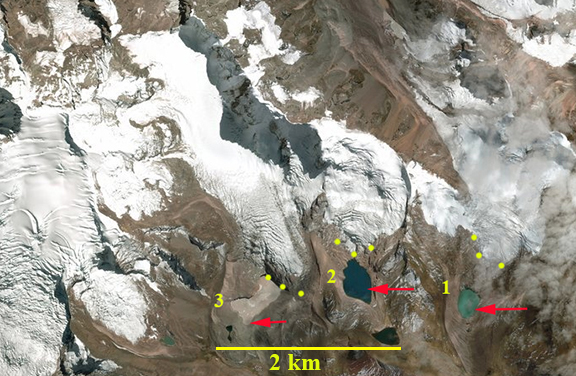
Digital Globe image of Ausangate Glaciers. Red arrows indicate 1995 terminus location and yellow dots the 2018 terminus location.
Here we examine three Ausangate Glaciers, Peru descending south from the Nevado Ausangate group of peaks in the Cordillera Vilcanota. A circumnavigation trek around Nevado Ausangate is a favorite for visitors to the Machu Picchu area. The glaciers are just west of Laguna Sibinacocha, and drain into the Rio Vilcanota. Retreat of glaciers in the Cordillera Vilcanota has been rapid since 1975, Veettil et al (2017) noted that ~80% of glaciated area below 5000 m was lost from 1975-2015 and glacier area overall area had declined 48%. Henshaw and Bookhagen (2014) observed that from 1988-2010 glacial areas in the Cordillera Vilcanota declined annually by ~ 1% per year.
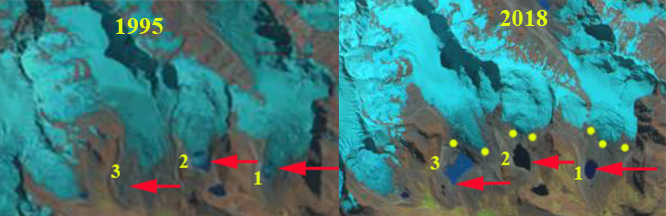
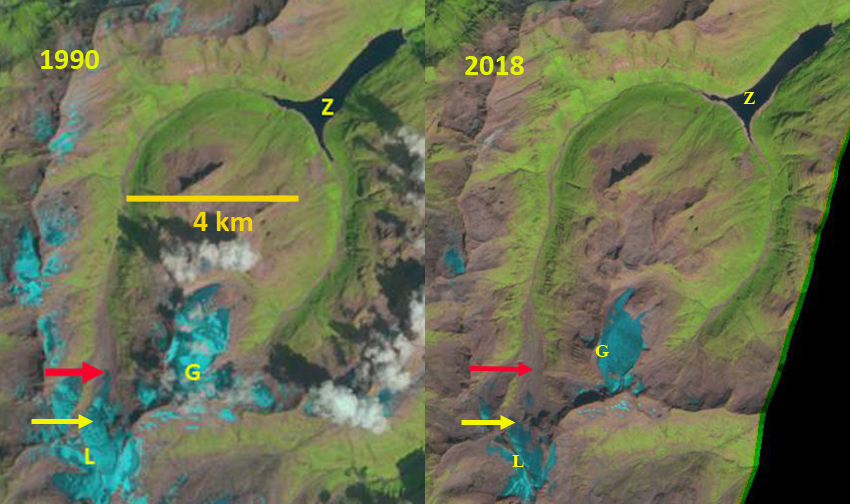
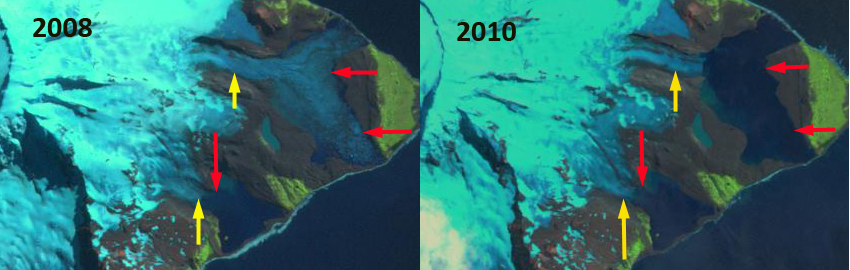
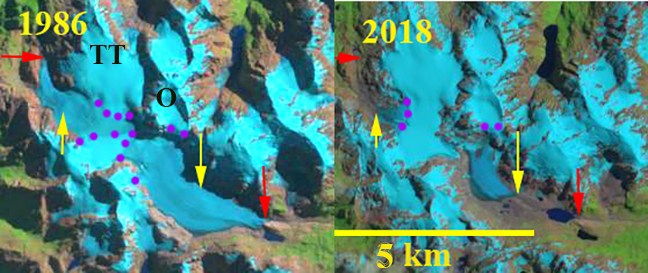
Ausangate Glaciers in 1995 Landsat and 2018 Sentinel image. Red arrows indicate 1995 terminus location and yellow arrows the 2018 terminus location. The development of three proglacial lakes at the terminus of each glacier is evident.
In 1995 the three glaciers all terminate in incipient proglacial lakes. The terminus of #3 is debris covered. By 2000 each of the glaciers is still terminating in an expanding proglacial lake. Glacier #1 and #2 have developed to a size of ~0.1 square kilometers. Glacier 3# still shows limited lake development. By 2018 Glacier #1 has retreated 450 m and is now separated from the lake. Glacier #2 has retreated 400 m and no longer reaches the lake. Glacier #3 is still in contact with the lake which still has debris covered stagnant ice covering a portion of the basin. This lake has an area of 0.13 square kilometers, and could reach an area of ~0.2 sq. kilometers depending on debris cover thickness. The terminus of each glacier has retreated above 5000 m since 1995. The glaciers each has extensive crevassing and maintains a snow covered accumulation zone, indicating they can survive current climate. Veettil et al (2017) noted that glacier area above 5300 m was relative stable, for Ausangate Glaciers the area above 5200 m is in the accumulation zone and has been relatively stable.
The formation of new lakes and the retreat from proglacial lakes has been a common occurrence in recent decades for Andean glaciers in Peru such as Manon Glacier and Soranano Glacier. The key role of glaciers to runoff is illustrated by the fact that 77% of lakes connected to a glacier watershed have maintained the same area or expanded, while 42% of lakes not connected to a glacier watershed have declined in area Henshaw and Bookhagen (2014). The Ausangate Glaciers supply runoff to the Machupicchu Hydroelectric Power Plant managed by EGEMSA, which has an operating capacity of 90 MW. The Vilcanota River becomes the Urubamba River further downstream.
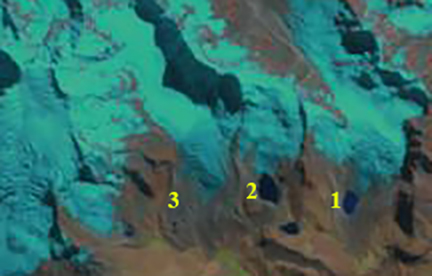
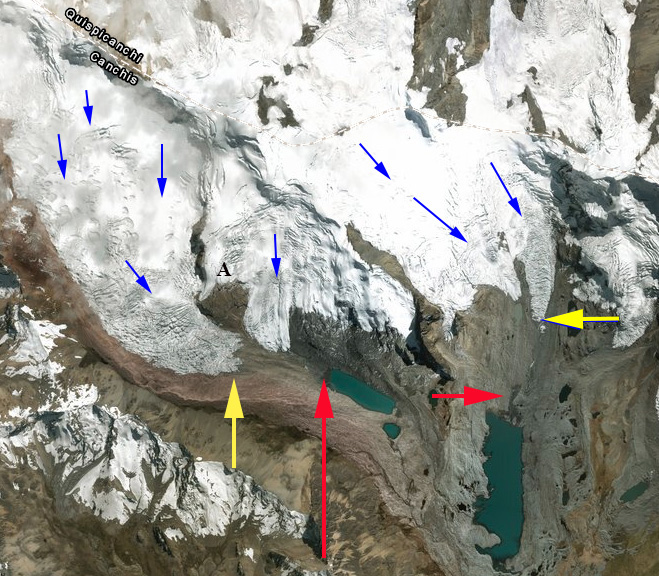
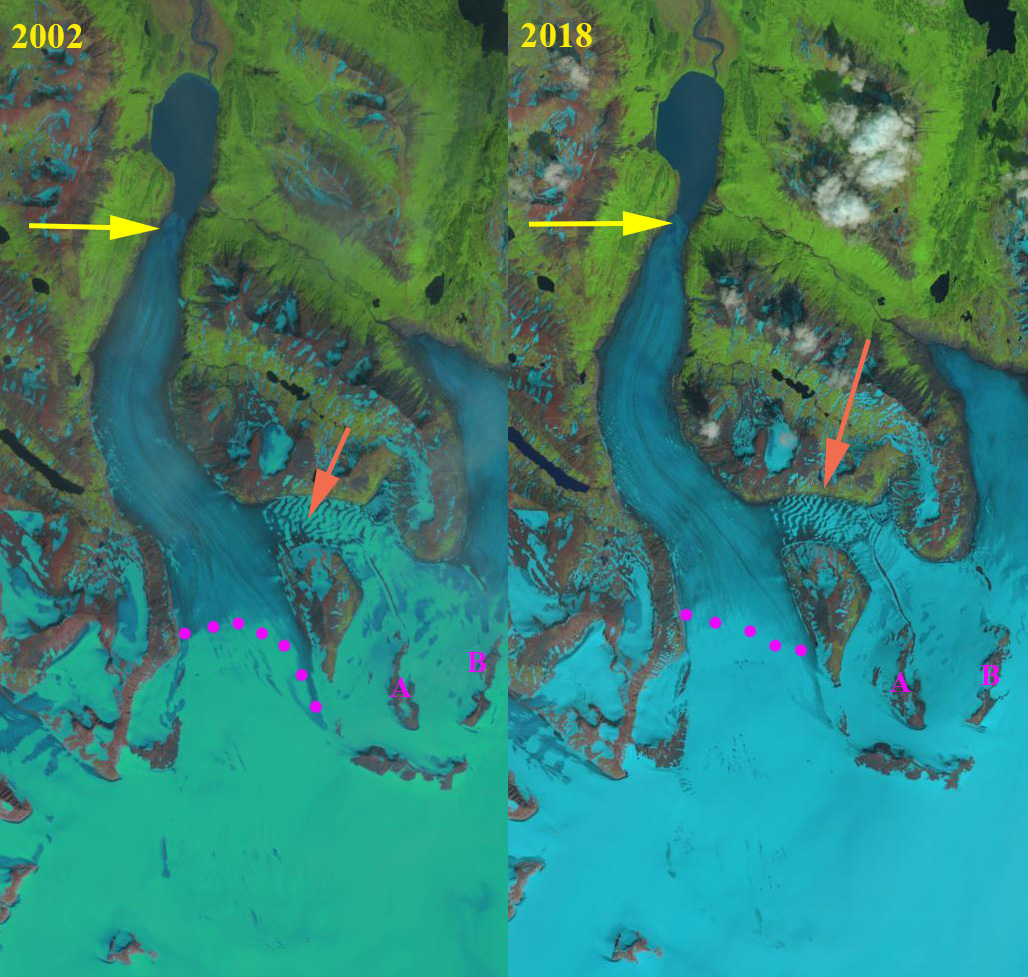
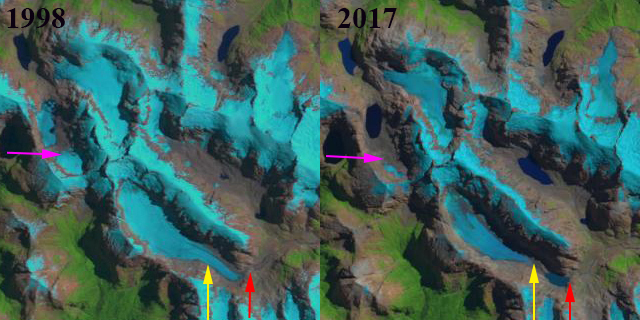
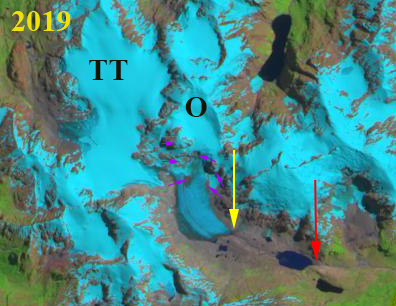
Ausangate Glaciers in 2000 Landsat The development of two of the three proglacial lakes at the terminus of each glacier is evident.