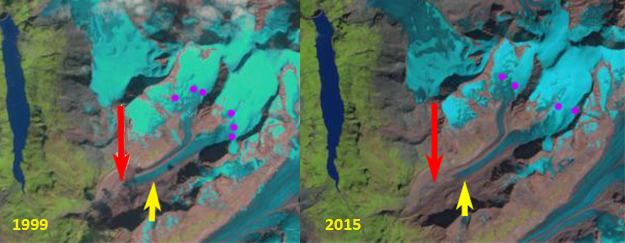
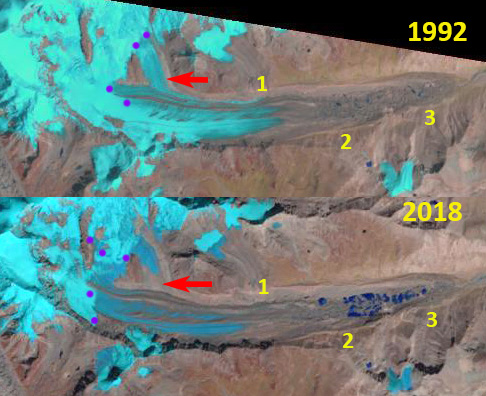
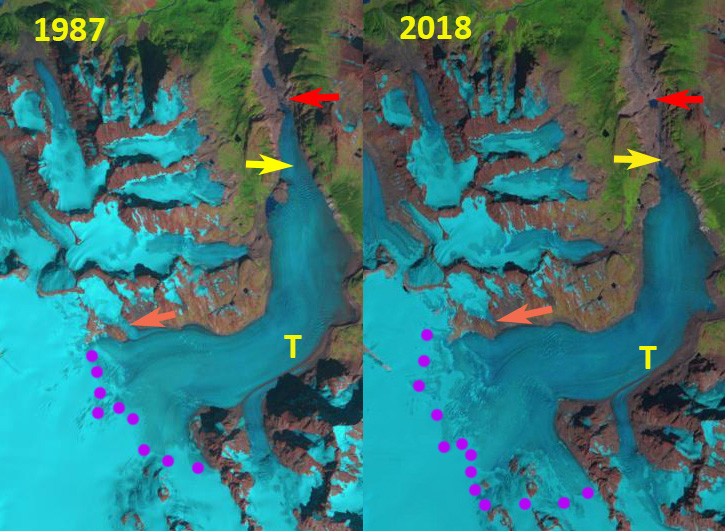
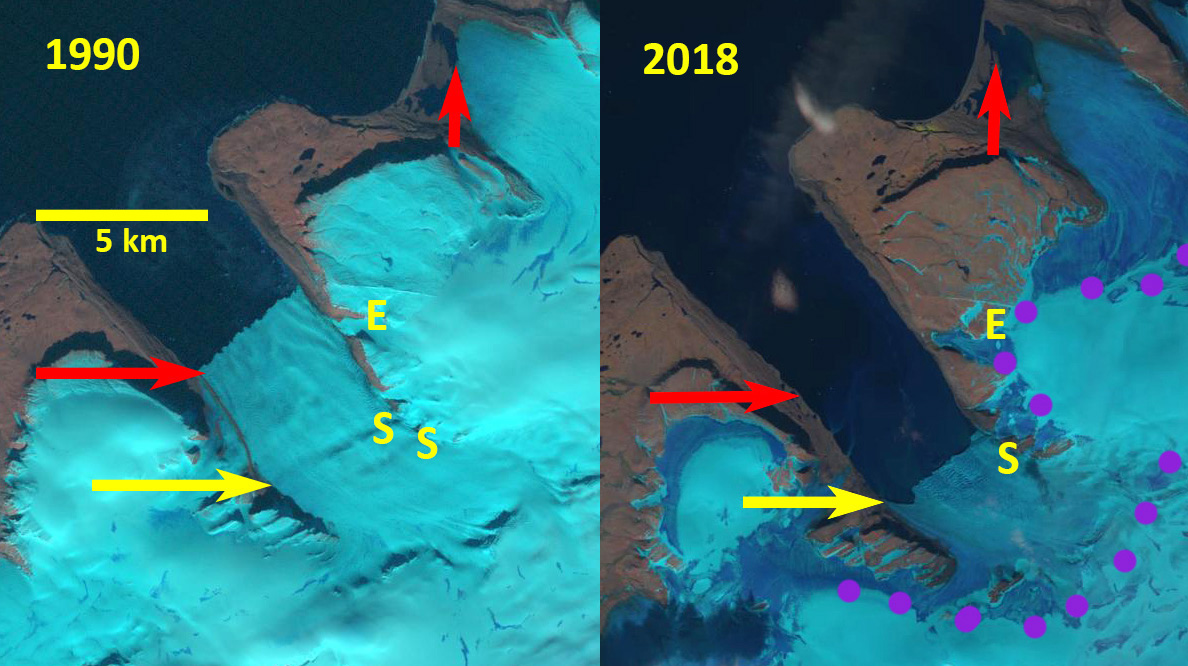
Cerro Tronador glaciers in Landsat images from 1985, 1998 and 2018. A=Alerce, CO=Castana Overo, VN=Ventisquero Negro. Red arrows mark the 1985 glacier terminus locations, yellow arrows the 2018 terminus location of VN, pink arrow the location of the 2009 dam breach outwash plain deposit, and purple arrow location of a bedrock outcrop.
Cerro Tronador with a summit elevation of 3428 m straddles the Chile/Argentina border east of Lago Todos los Santos. The peak is heavily glaciated including three glaciers that flow into the Alerce River basin of Argentina, Ventisquero Negro (VN), Castana Overo (OV) and Alerce (A). Paul et al (2014) observed a 25% decrease in glacier area and the formation of over 100 new proglacial lakes in Northern Patagonia. Worni et al (2014) report on a moraine dam breach below Ventisquero Negro in 2009 and model this event. Here we examine Landsat imagery from 1985 -2018 to identify changes.
In 1985 there is no lake at the terminus of Ventisquero Negro with the debris covered terminus extending across the entirre basin. The pink arrow indicates the vegetated valley below the moraine. Alerce Glacier extends over a topographic step at 1600 m and extends to a proglacial lake at 1350 m. Castana Overo Glacier terminus broadly extends over the topographic step at 1600 m. By 1998 Ventisquero Negro has developed a small fringing proglacial lake. Alerce Glacier has lost its lowest valley tongue that extended to the proglacial lake. The width of the Castana Overo Glacier terminus has been reduced.
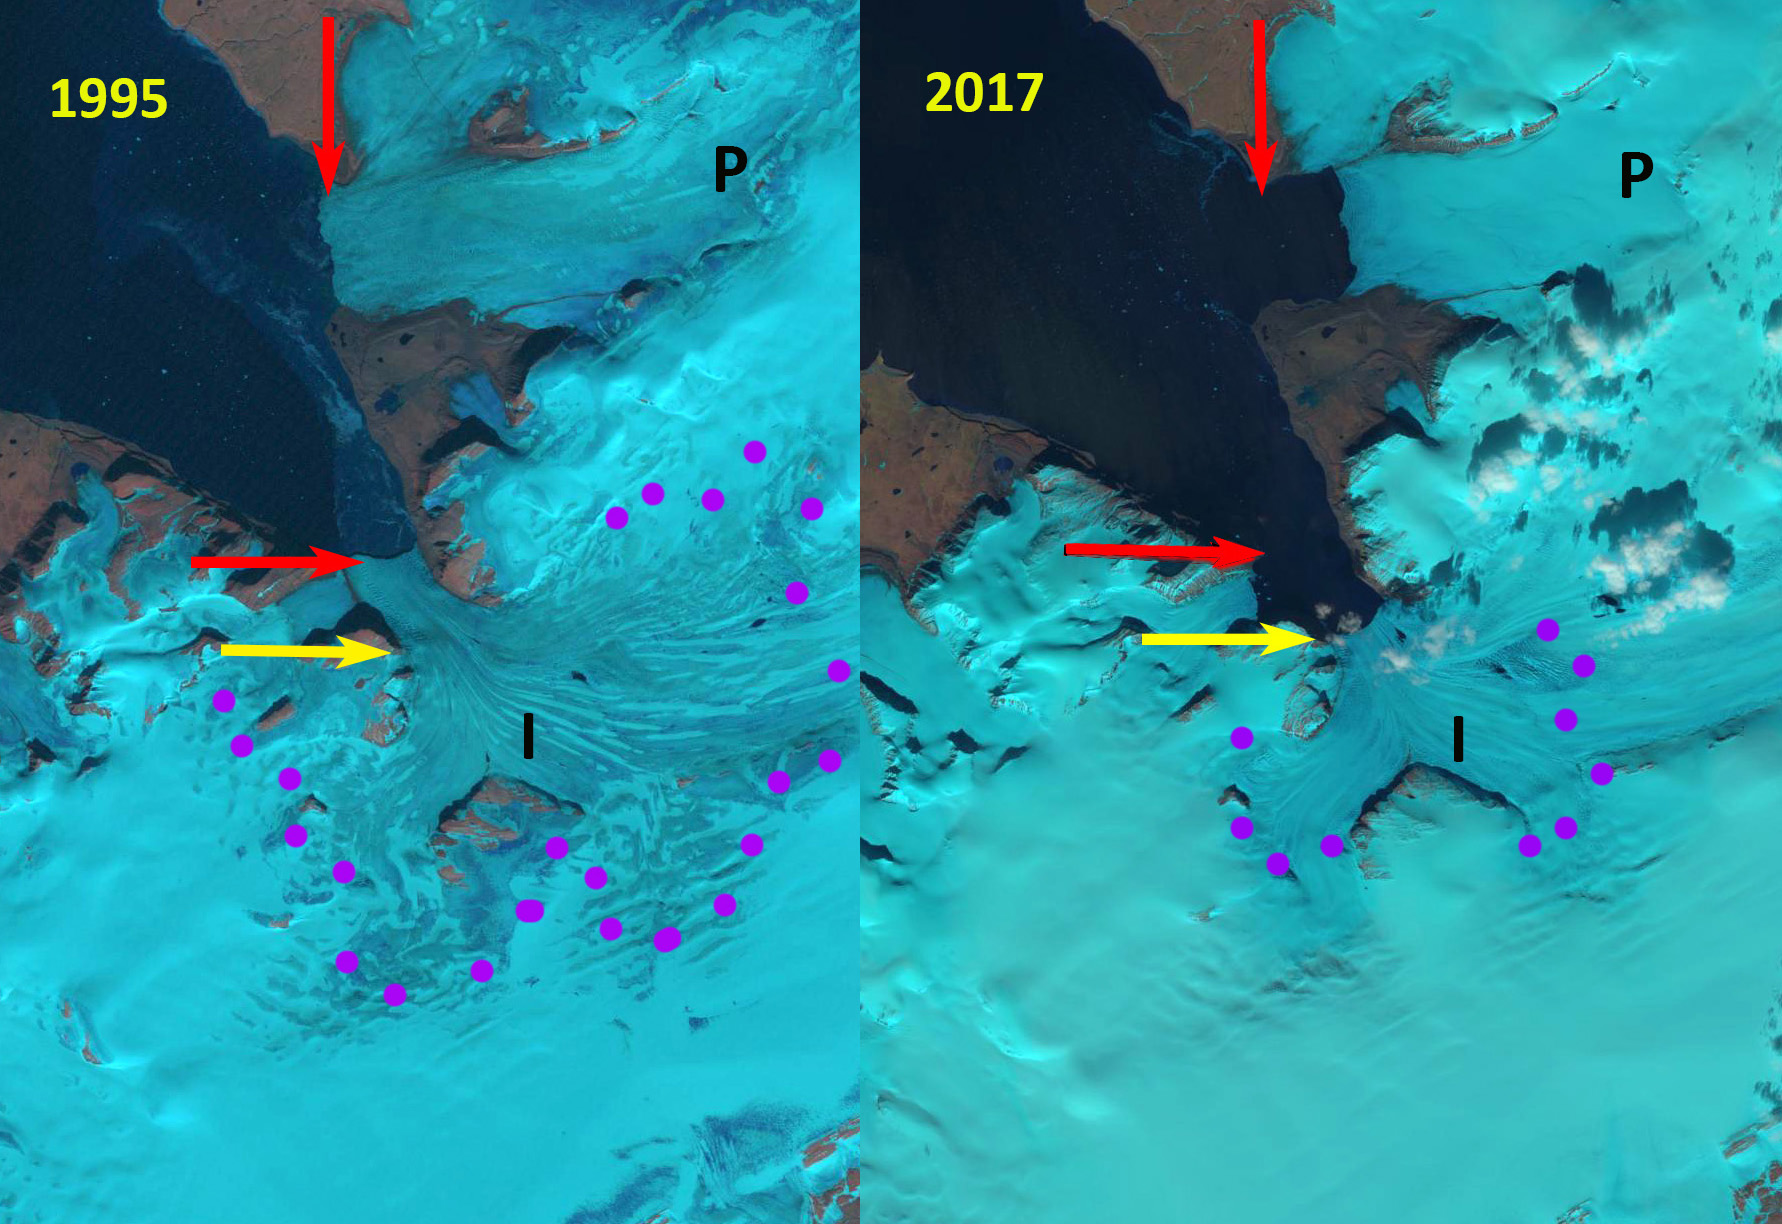
By 2012 below the moraine dam breach has occurred depositing a significant outwash plain that is evident at the pink arrow just downstream of Ventisquero Negro. A substantial proglacial lake has also formed that is 1.2 km long, Lago Manso. Alerce Glacier has retreated to the top of the 1600 m step. A new bedrock outcrop, purple arrow has appeared on the ridge between Alerce and Castana Overo Glacier at 2100 m. In 2016 the snowline extends to the new bedrock outcrop. By 2018 Ventisquero Negro has retreated 1450 m since 1985, with the proglacial lake still growing. Alerce Glacier has retreated 800 m since 1985 and Castana Overo Glacier has retreated 400 m. All three glaciers have significant crevassing indicating substantial retained accumulation being transported down slope. The debris covered tongue of Ventisquero Negro will continue to disintegrate and the Lago Manso will continue to expand.

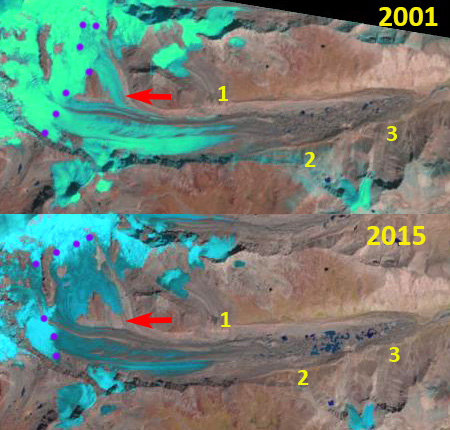
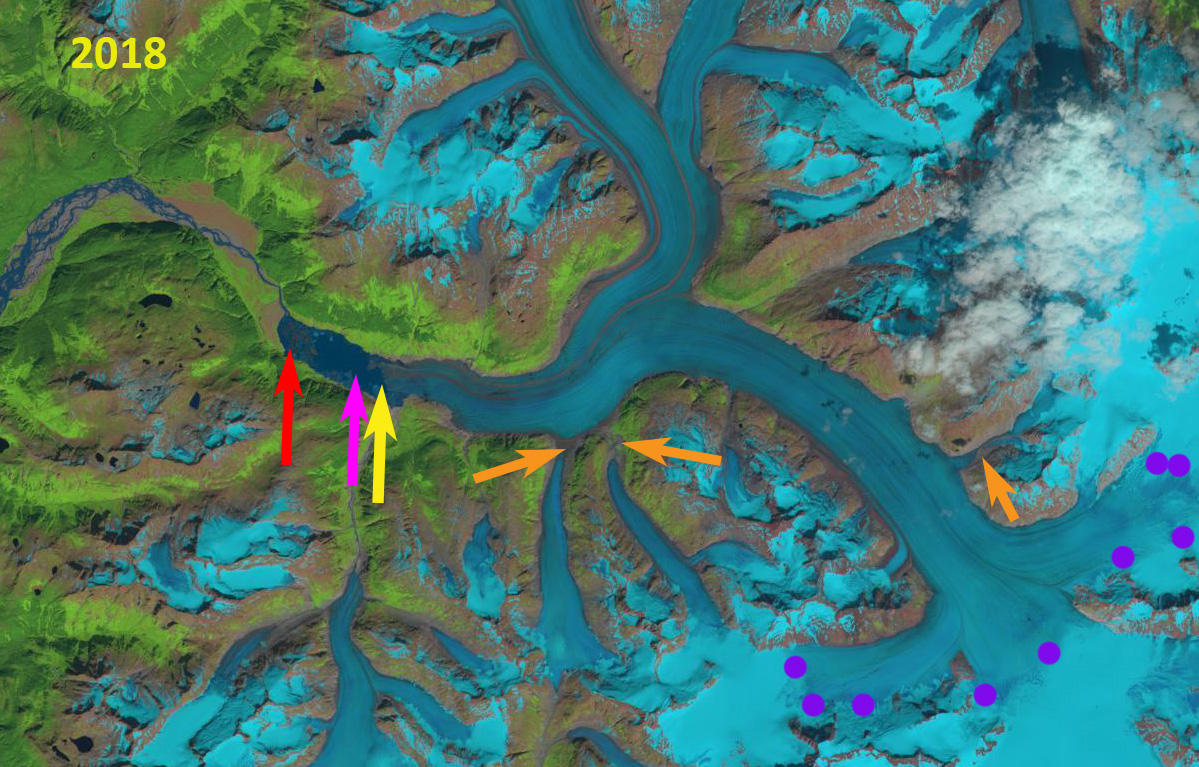
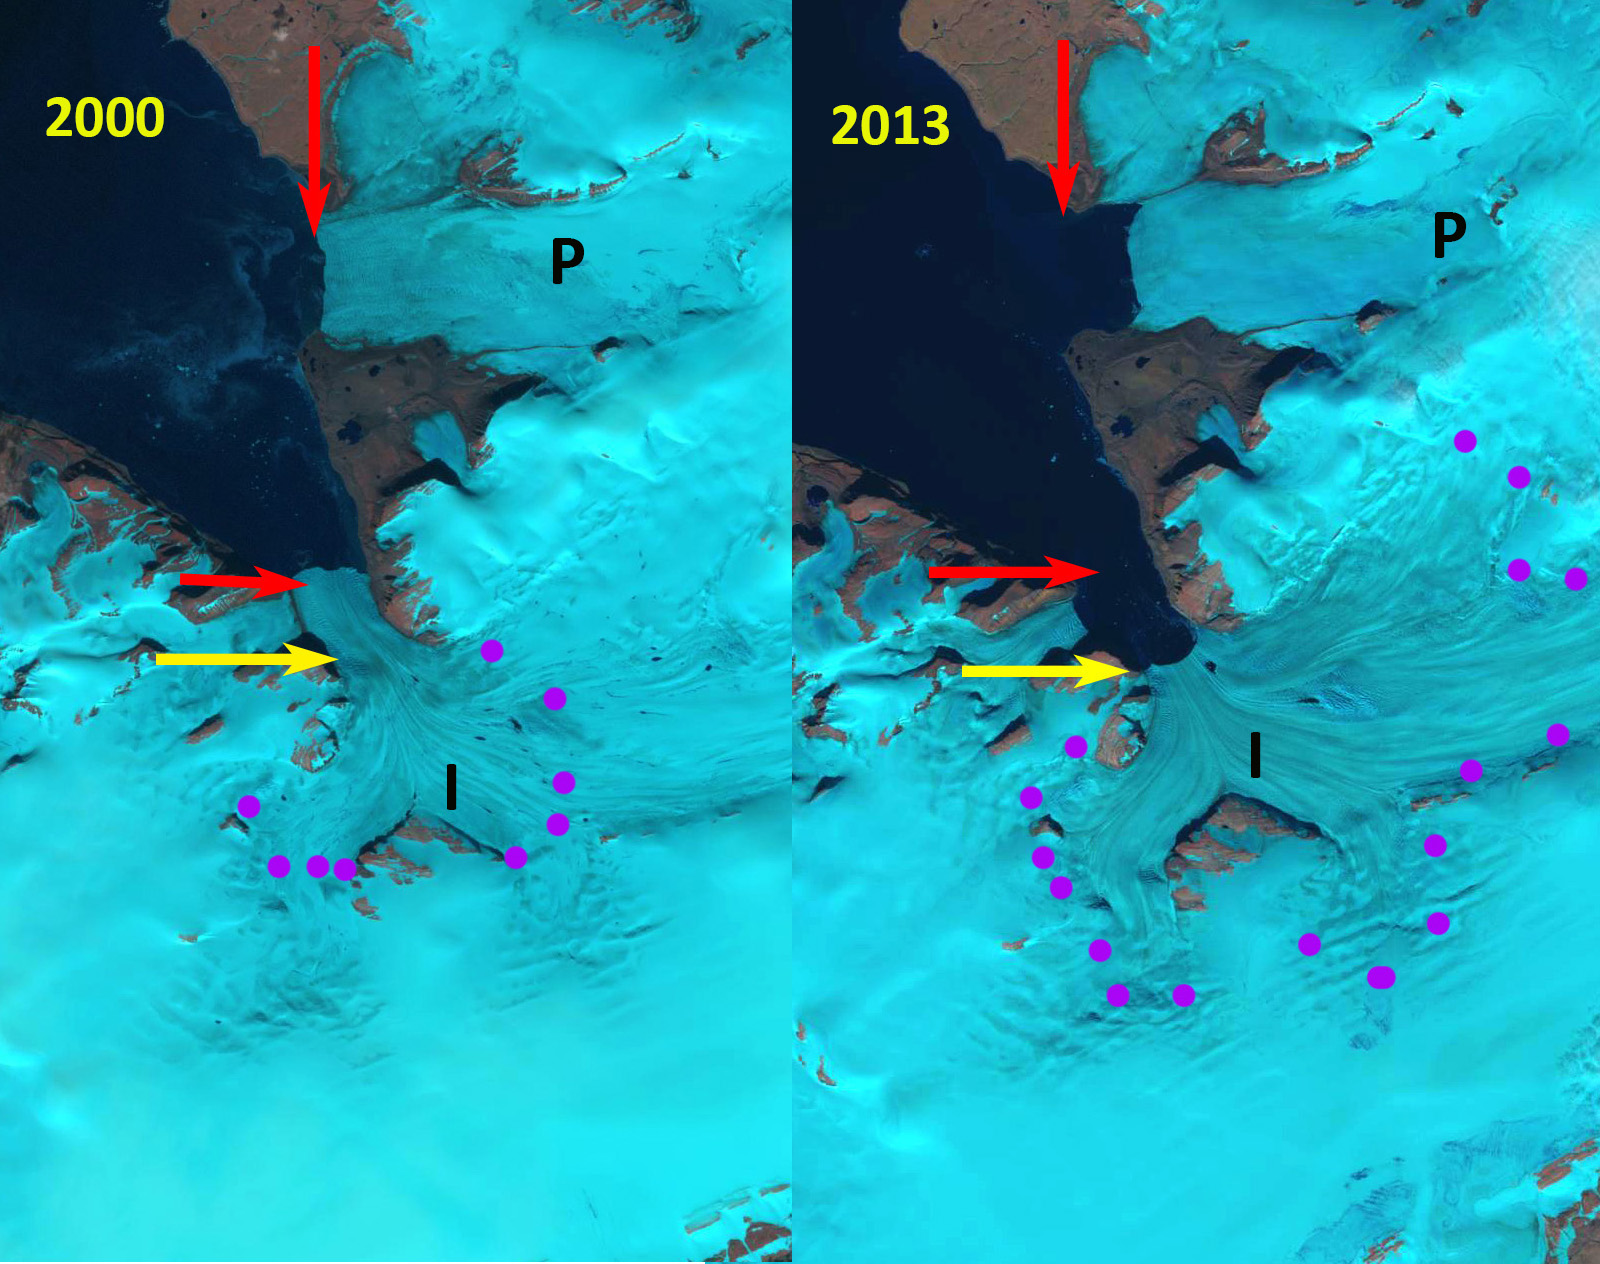
Cerro Tronador glaciers in 2012 Google Earth image. A=Alerce, CO=Castana Overo, VN=Ventisquero Negro. Red arrows mark the 1985 glacier terminus locations, , pink arrow the location of the 2009 dam breach outwash plain deposit, and purple arrow location of a bedrock outcrop.

Cerro Tronador glaciers in 2016 Digital Globe image. A=Alerce, CO=Castana Overo, VN=Ventisquero Negro. Red arrows mark the 1985 glacier terminus locations, , pink arrow the location of the 2009 dam breach outwash plain deposit, and purple arrow location of a bedrock outcrop.