March 21, 2025, the “World Day for Glaciers”, is part of the UN International Year for Glaciers’ Preservation.” Rapid and accelerating glacier loss this century led to this day. In 2023 and 2024 for the first time all 58-reporting Global Reference glaciers had a negative mass balance. Acceleration of glacier’s disappearing led to creation of an extinct glacier data layer in GLIMS global glacier inventory.
To preserve a glacier, we have to understand how a glacier is formed. Easton Glacier, Mount Baker is our sample location, we’ve monitored this Global Reference for four decades. Easton still has an accumulation zone and may survive current climate at a reduced size. We’ve observed 28 North Cascade glaciers disappear this century, including Ice Worm Glacier after visiting every year for 40 years, lost in 2023.
Recipe: Creating a North Cascade Glacier
Location with cold temperatures 7+months/year.
Substantial snowfall 10 m on slope of 10-30O.
Let stand 2-4 decades, with melting, refreezing and burial creating dense ice, until thickness exceeds 20 m and a volume over 500,000 m3.
Movement will commence and crevasses develop.
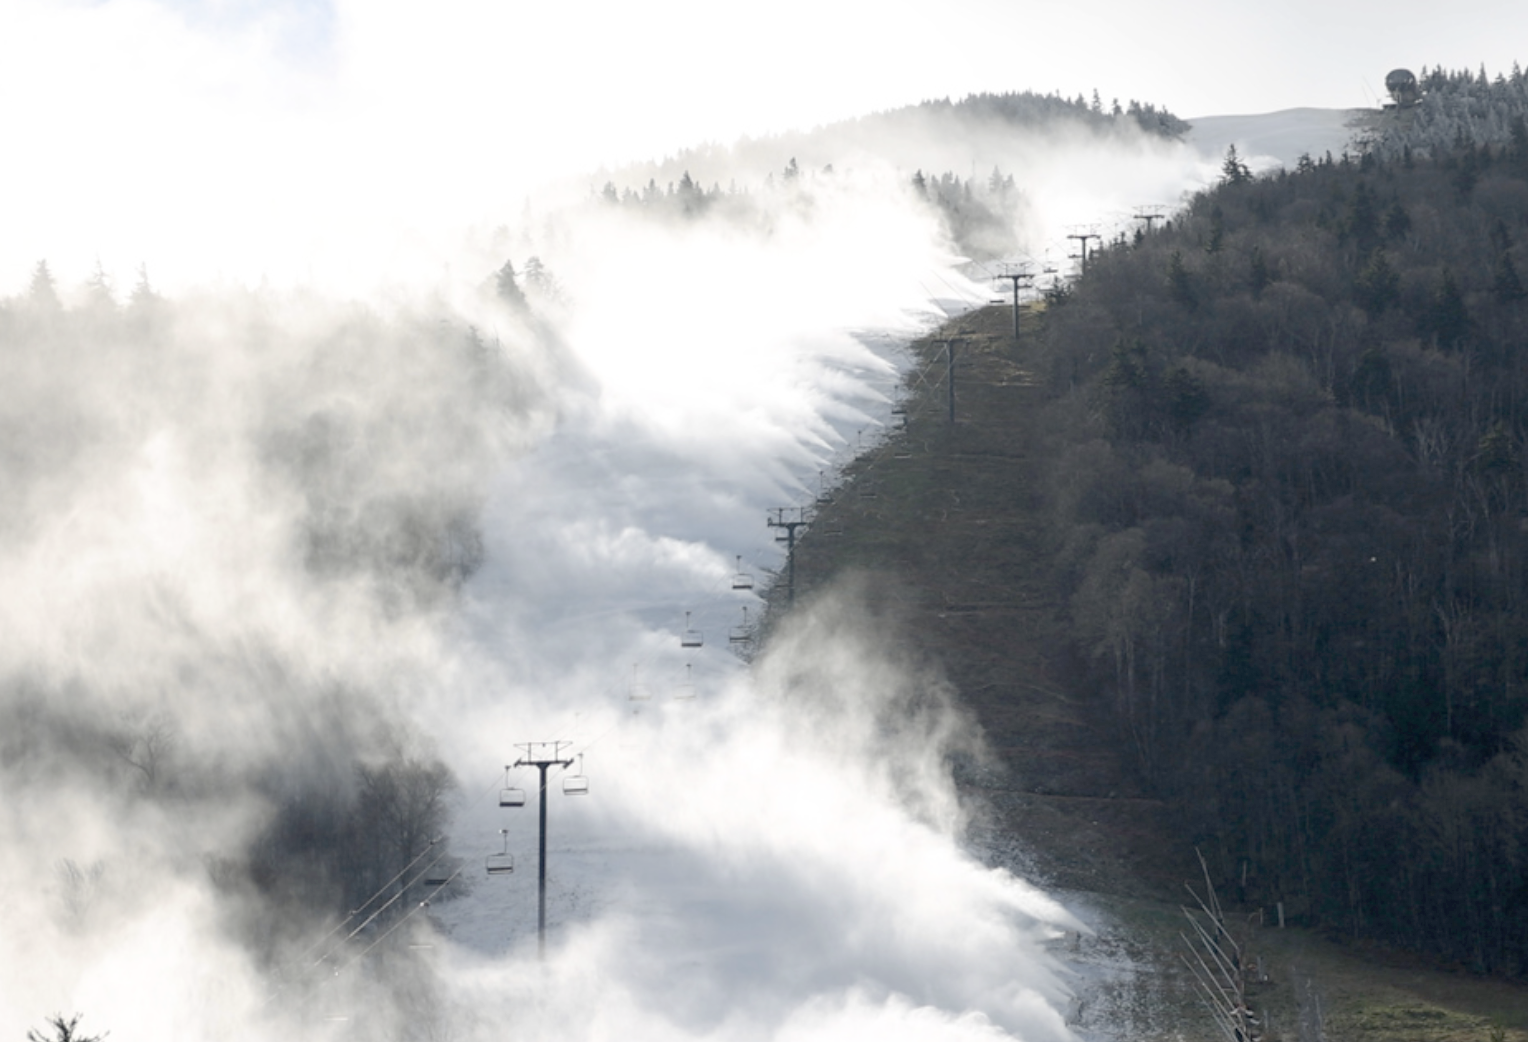
Snowmaking
Easton Glacier area is 2.5 km2 and is losing 1.5 m water equivalent thickness annually, this is 3.75 million m3 of water equivalent snow.
Largest snow making operation is Killington, VT, daily maximum capacity of 35,000 m3 of water converted to snow.
At max-capacity the 2000+ snow guns require 108 days to produce 3.75 million m3.
Address environmental laws and logistics of deployment and maintenance for water piping, snow gun placement and electricity in harsh environment of avalanches and crevasses.
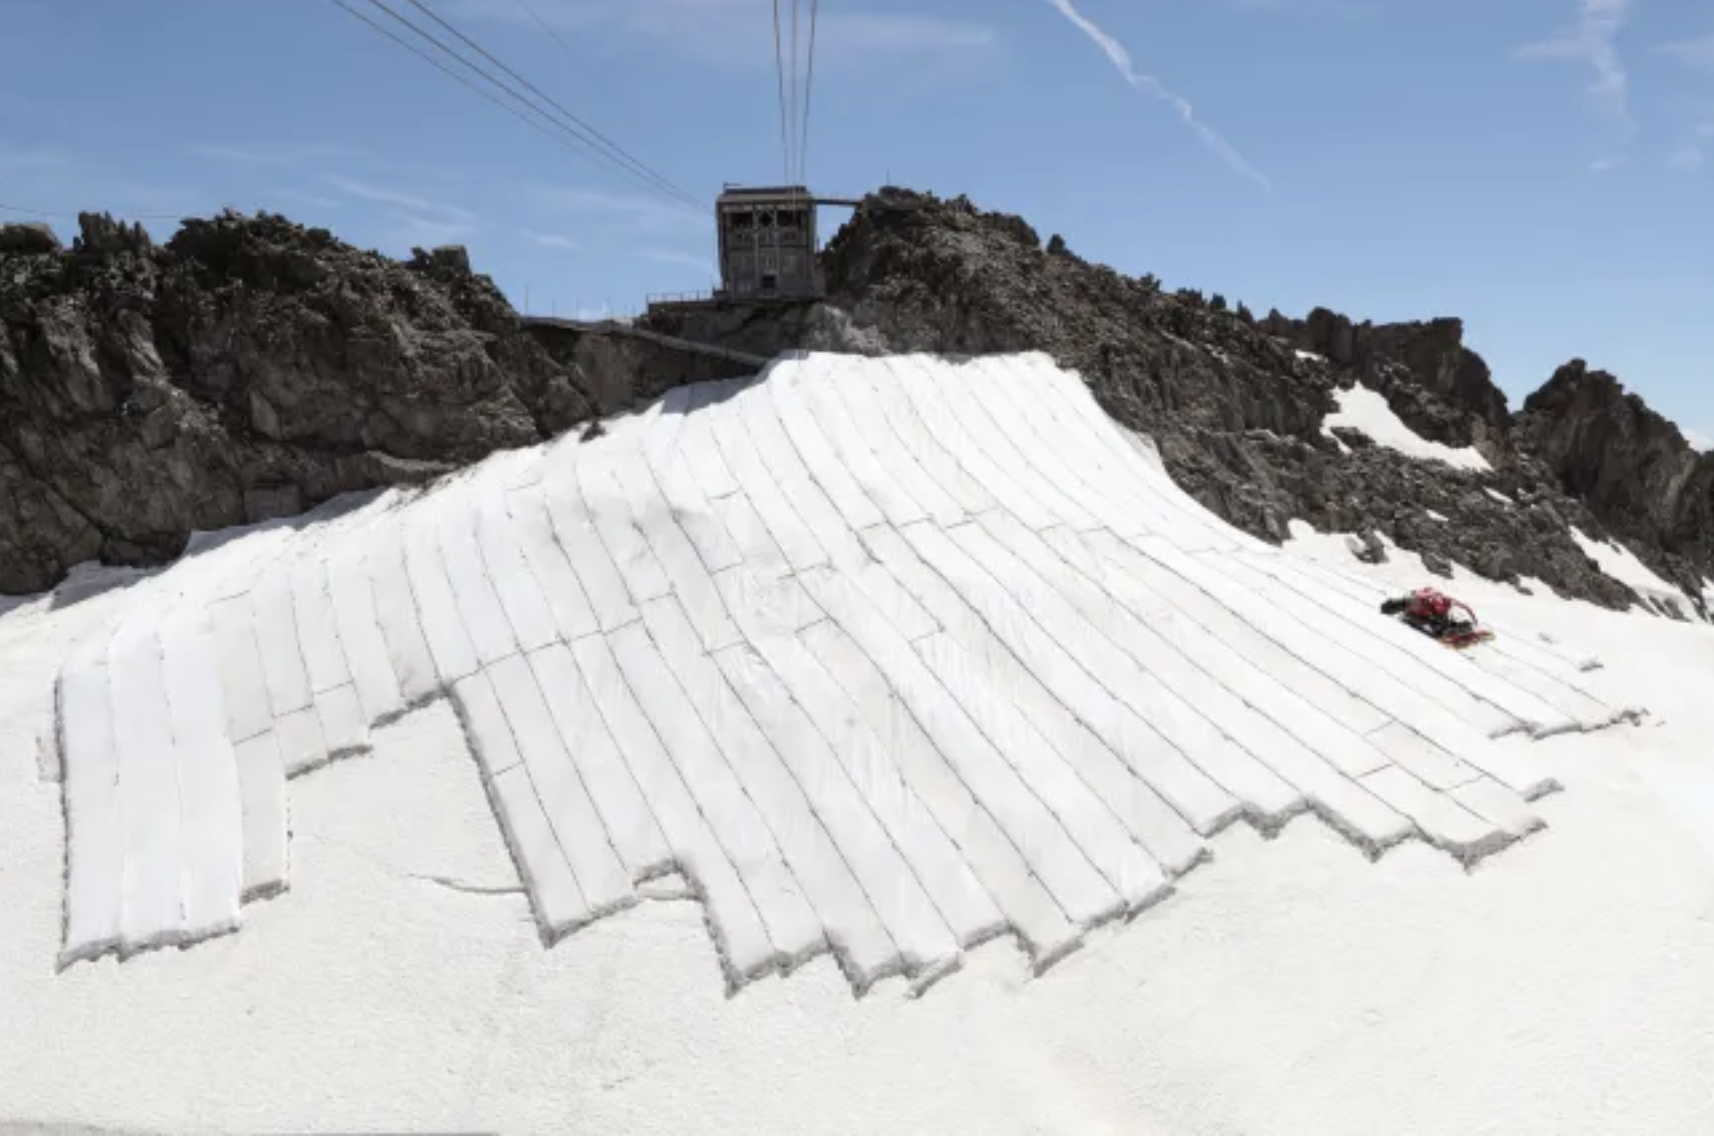
Geotextile:
Cover 1.5 million m2 (60%) of Easton Glacier with geotextiles installed each summer and removed in winter.
Summer recreation would no longer viable.
The short-lived geotextiles cost ~$2 m2.
Anchoring and connecting on a crevassed glacier very difficult,
Renewables:
When I began in 1984 solar and wind power were not significant electricity sources.
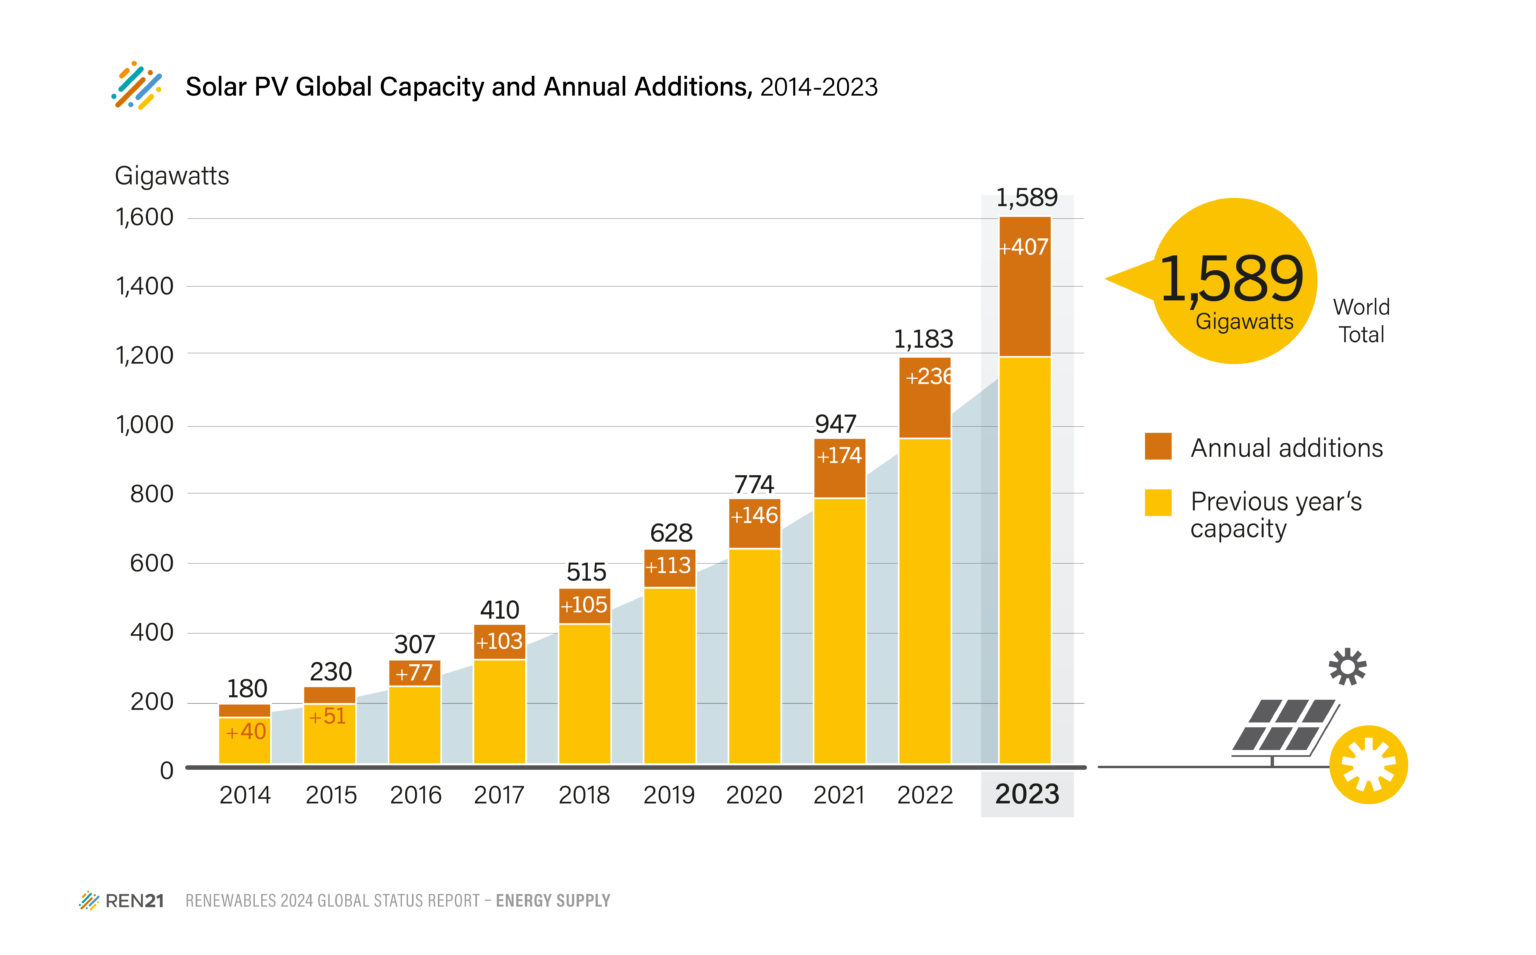
Global Solar Photovoltaic energy production capacity rose from 4 GW in 2004 to 1600 GW in 2023.
Global Wind power capacity rose from 48 GW in 2004 to 1070 GW in 2023.
With 500 MW added in 2023 this is a preservative that can work in concert with power grid improvement.
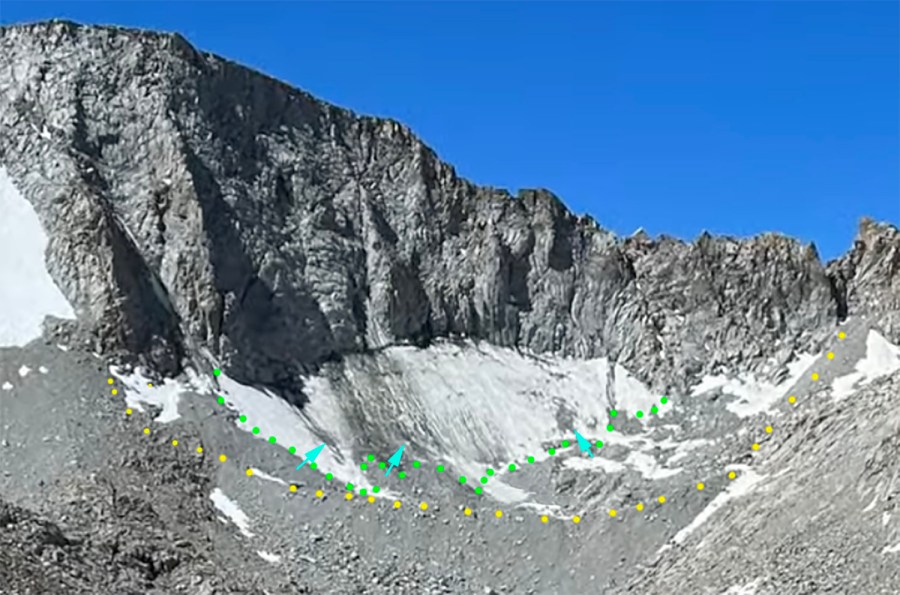
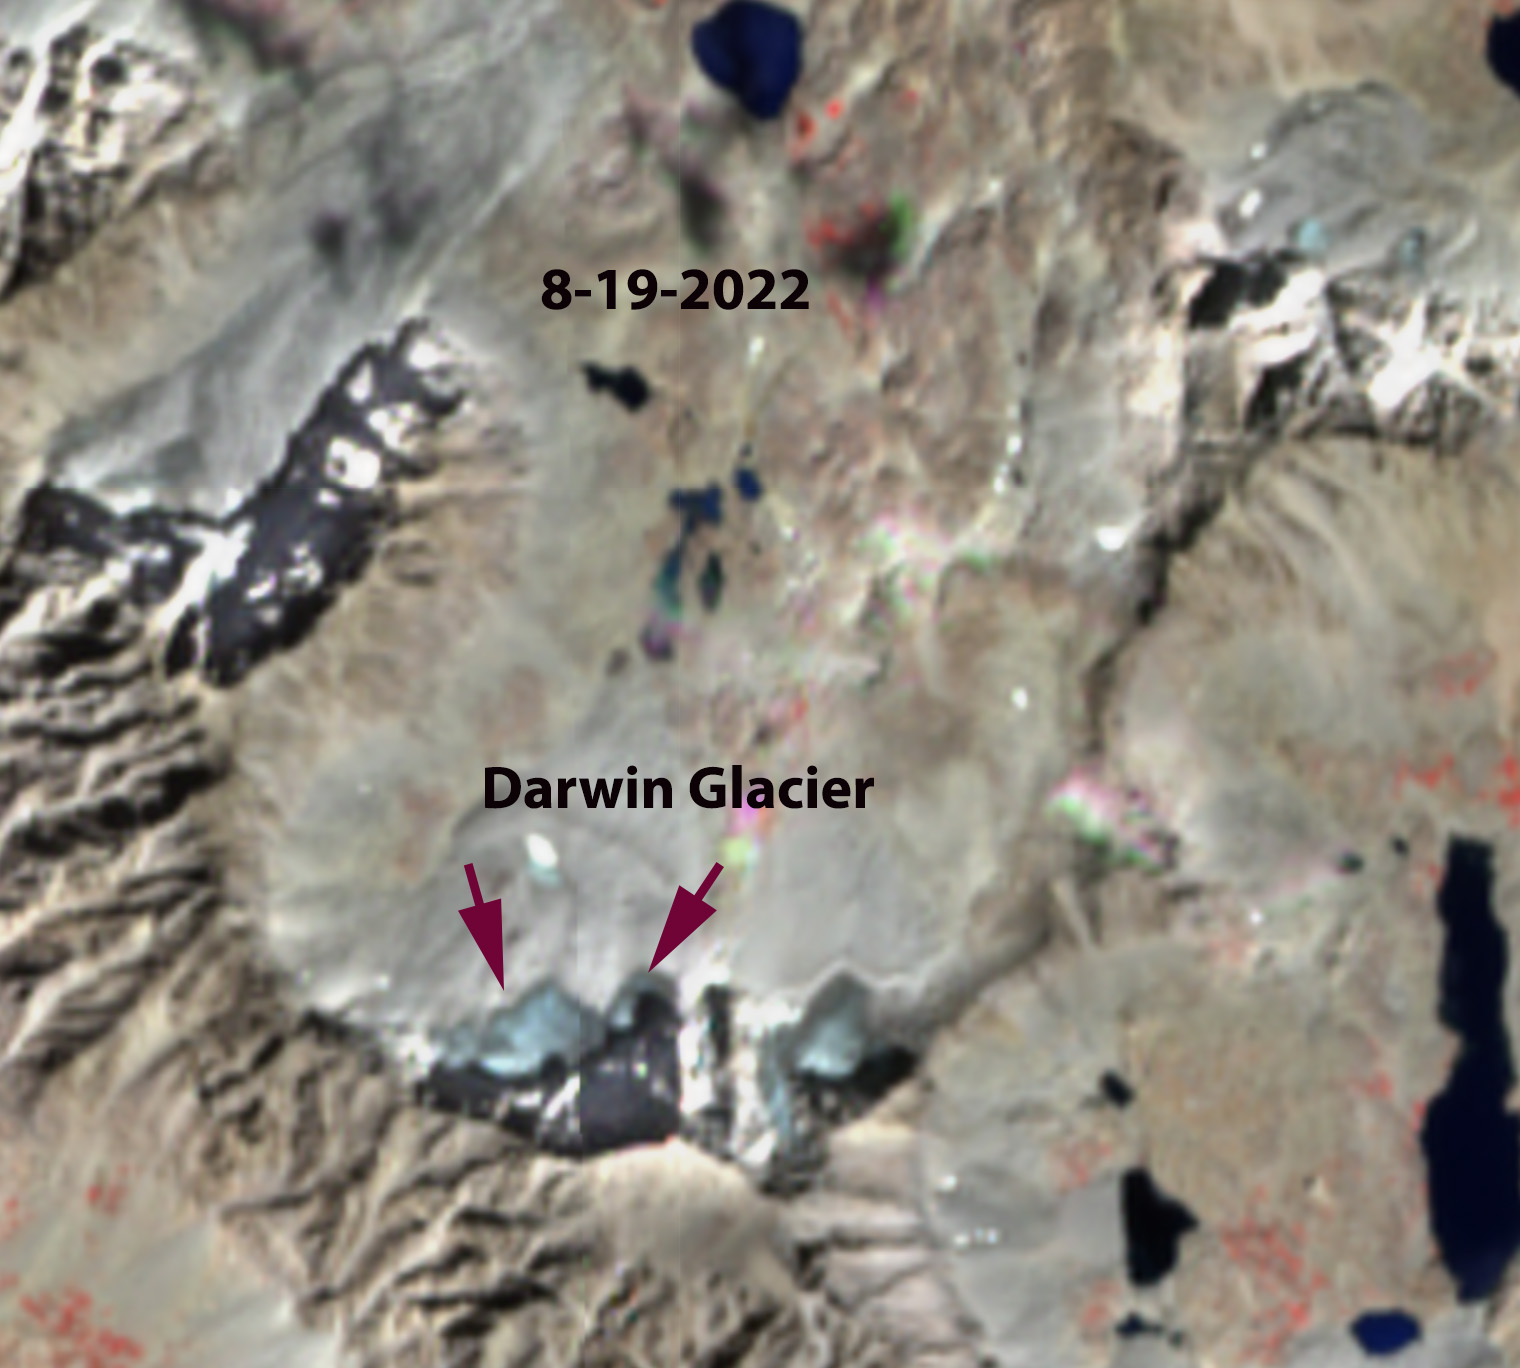
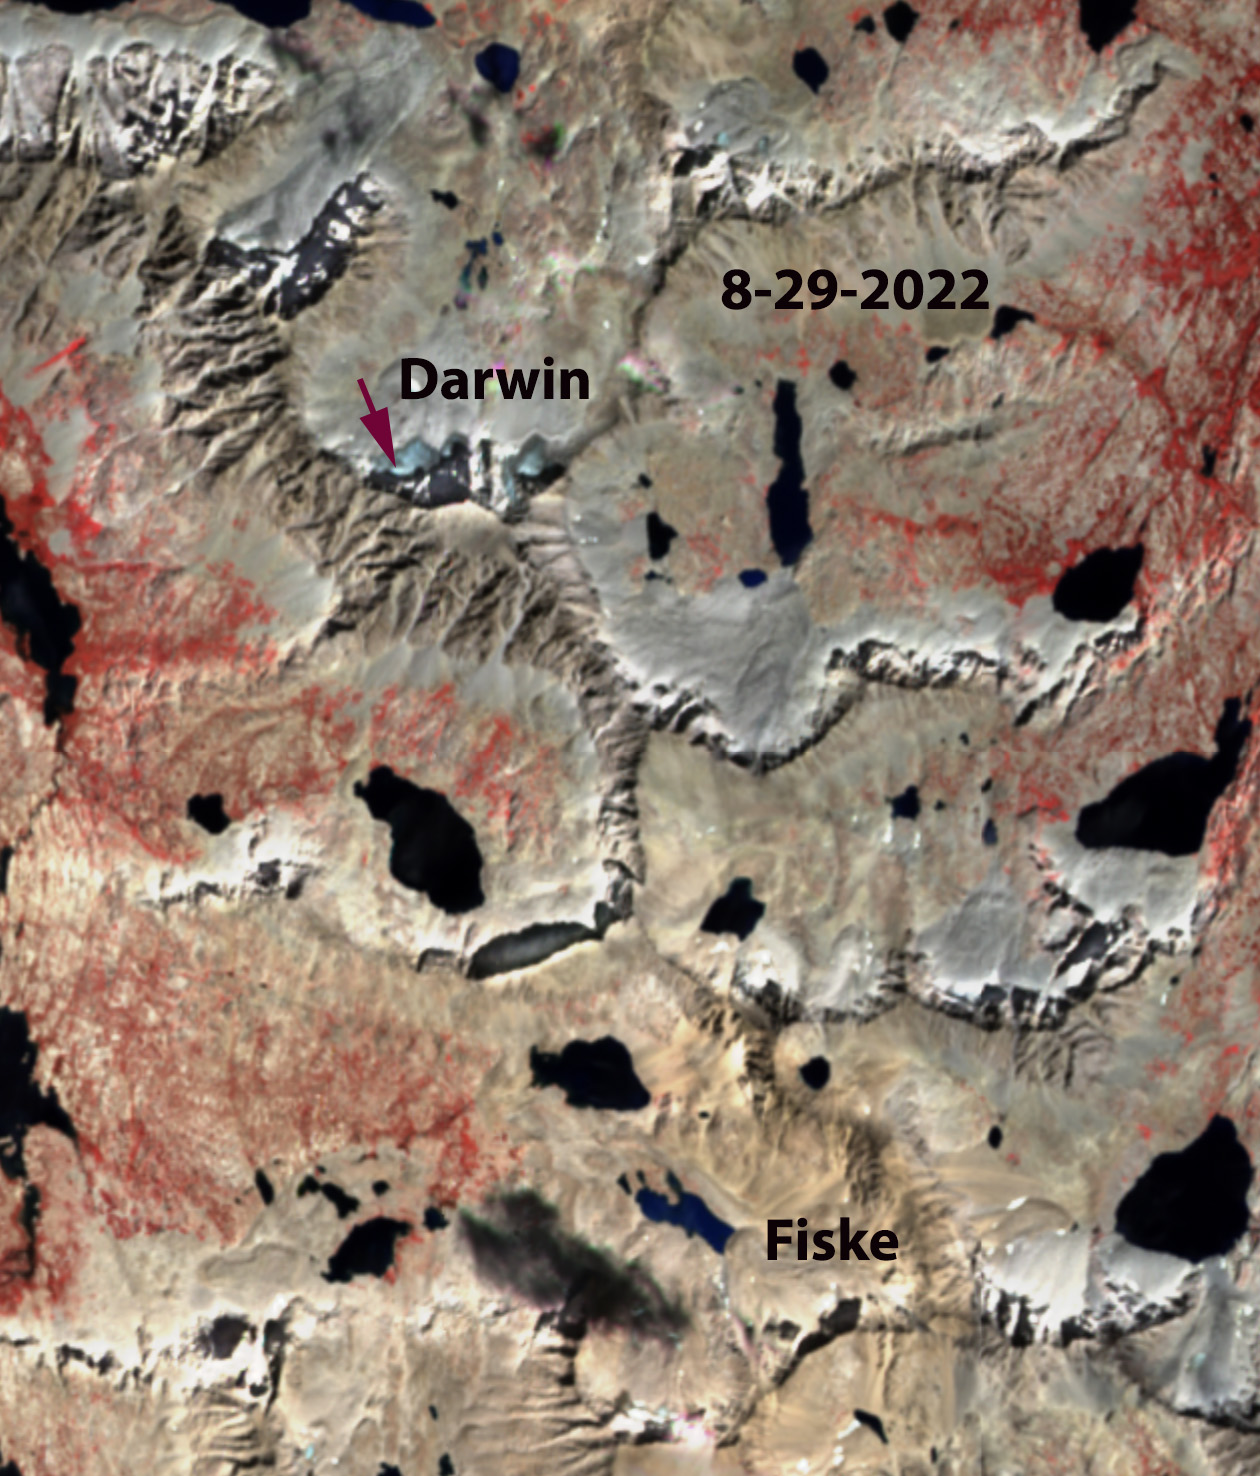
Darwin Glacier on 8-29-2022 in Sentinel False Color image with area reduced to 0.026 km2. No longer a glacier there is still relict ice clinging to the slope, in the next six weeks further melt reduced volume significantly.Darwin Glacier on July 19, 2022 with the moraine that the glacier was in contact with in the 1990s-yellow dots, and curent margin green dots. The blue arrows indicate rock area emerging as glacier thins. Slope has steepened and bergshrund is melting out (sierralara.com, image)
The Sierra Nevada, California has a number of small glaciers that have clung to the north facing slopes of the High Sierra. Darwin Glacier is one of those glaciers on the north side of Mount Darwin. named for Charles Darwin. The glacier is in Kings Canyon National Park and drains into the San Joaquin River.
In 1903 the glacier had an area of 0.25 km², declining 40% by 1948, 0.14 km2Basagic and Fountain (2011). The glacier expanded beginning in the 1970s and ending in the 1990s, with an area of 0.157 km² in 1976 (GLIMS), and then had declined slightly in 2001 had an area of 0.135 km², 5-10% greater than in 1948. In 2004 area loss was increasing with the area measured in the field by Basagic and Fountain (2011), at 0.114 km2 .
With a steep slope of ~30 degrees, the glacier depends on snow sloughing/avalanching off the north face of Mount Darwin and piling up against a moraine. Retreat from this moraine after 2004 has led to steepening of the glacier with less snowcover retained on its surface. From 2004 to 2022 the glacier rapidly lost volume and area. In 2014 the glacier area had declined 50% to 0.057 km² (GLIMS), in 2018 the glacier area was 0.048 km². The particularly warm summers of 2021 and 2022 led to further rapid decline to 0.038 km² in 2021 and 0.026 km² in 2022. At this time Darwin Glacier and was no longer a glacier with less than 20% of relict ice left from 2004, and with movement having ceased. The glacier bergshrund is also melting out. Bare rock was was also being exposed at several areas amidst the glacier area in 2022.
Just to the south Mount Fiske Glacier has disappeared as well, along with the glacier that was in the cirque on the north side of Mt. Mendel. The high snowfall winters of 2023 and 2024 have been offset by continued warm summers, preventing any significant volume increase.
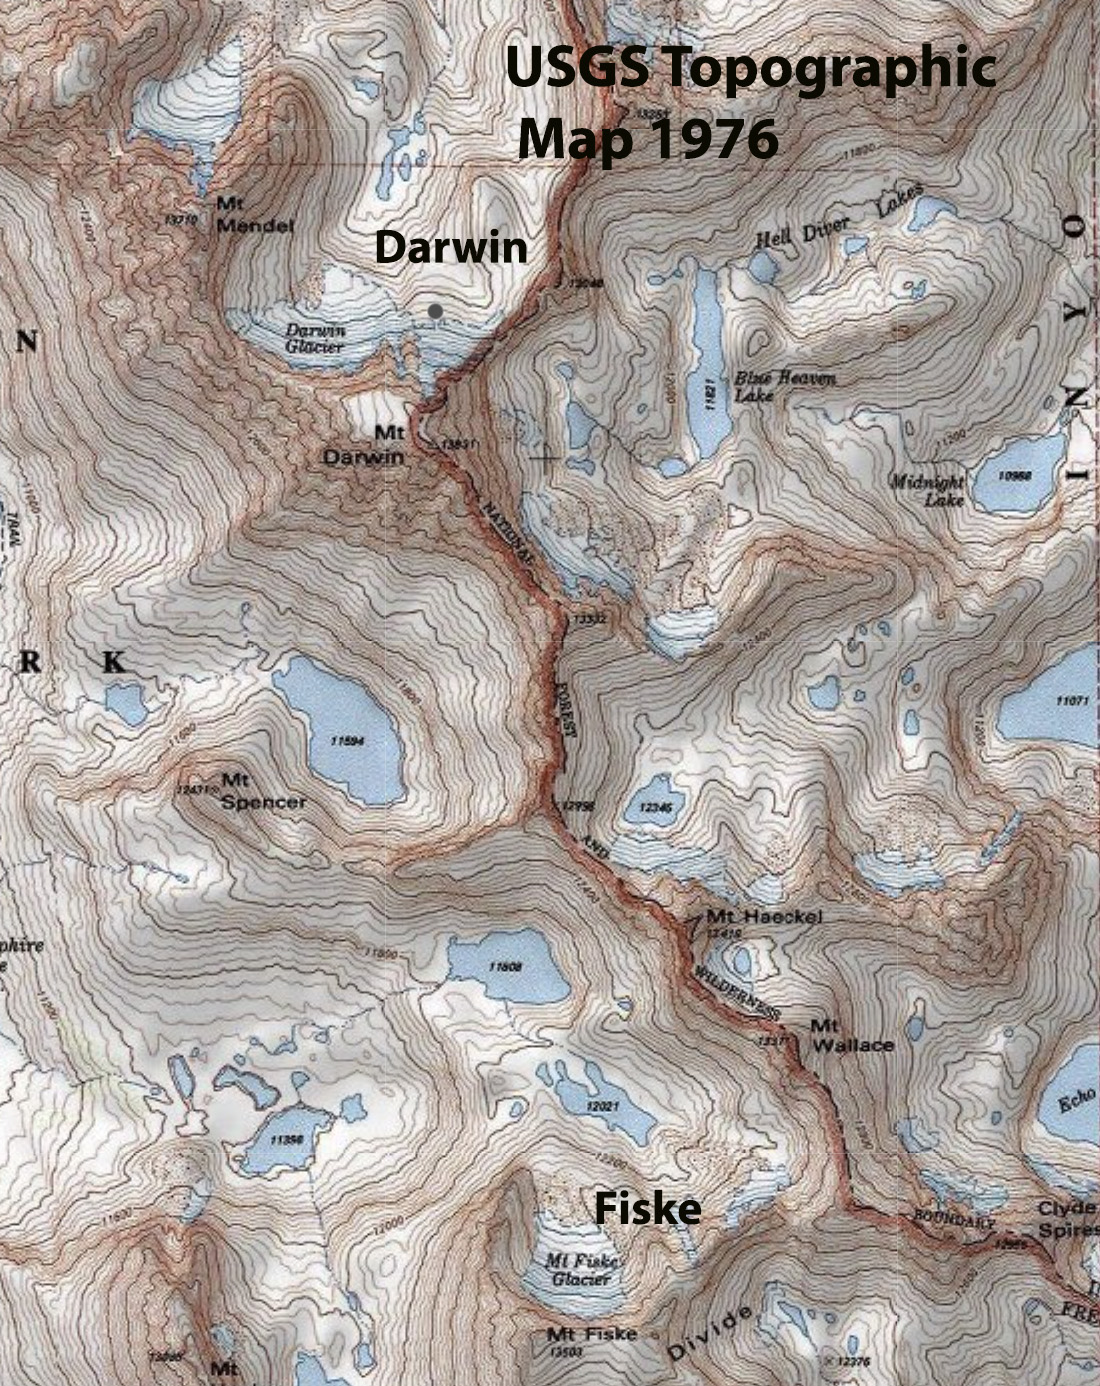
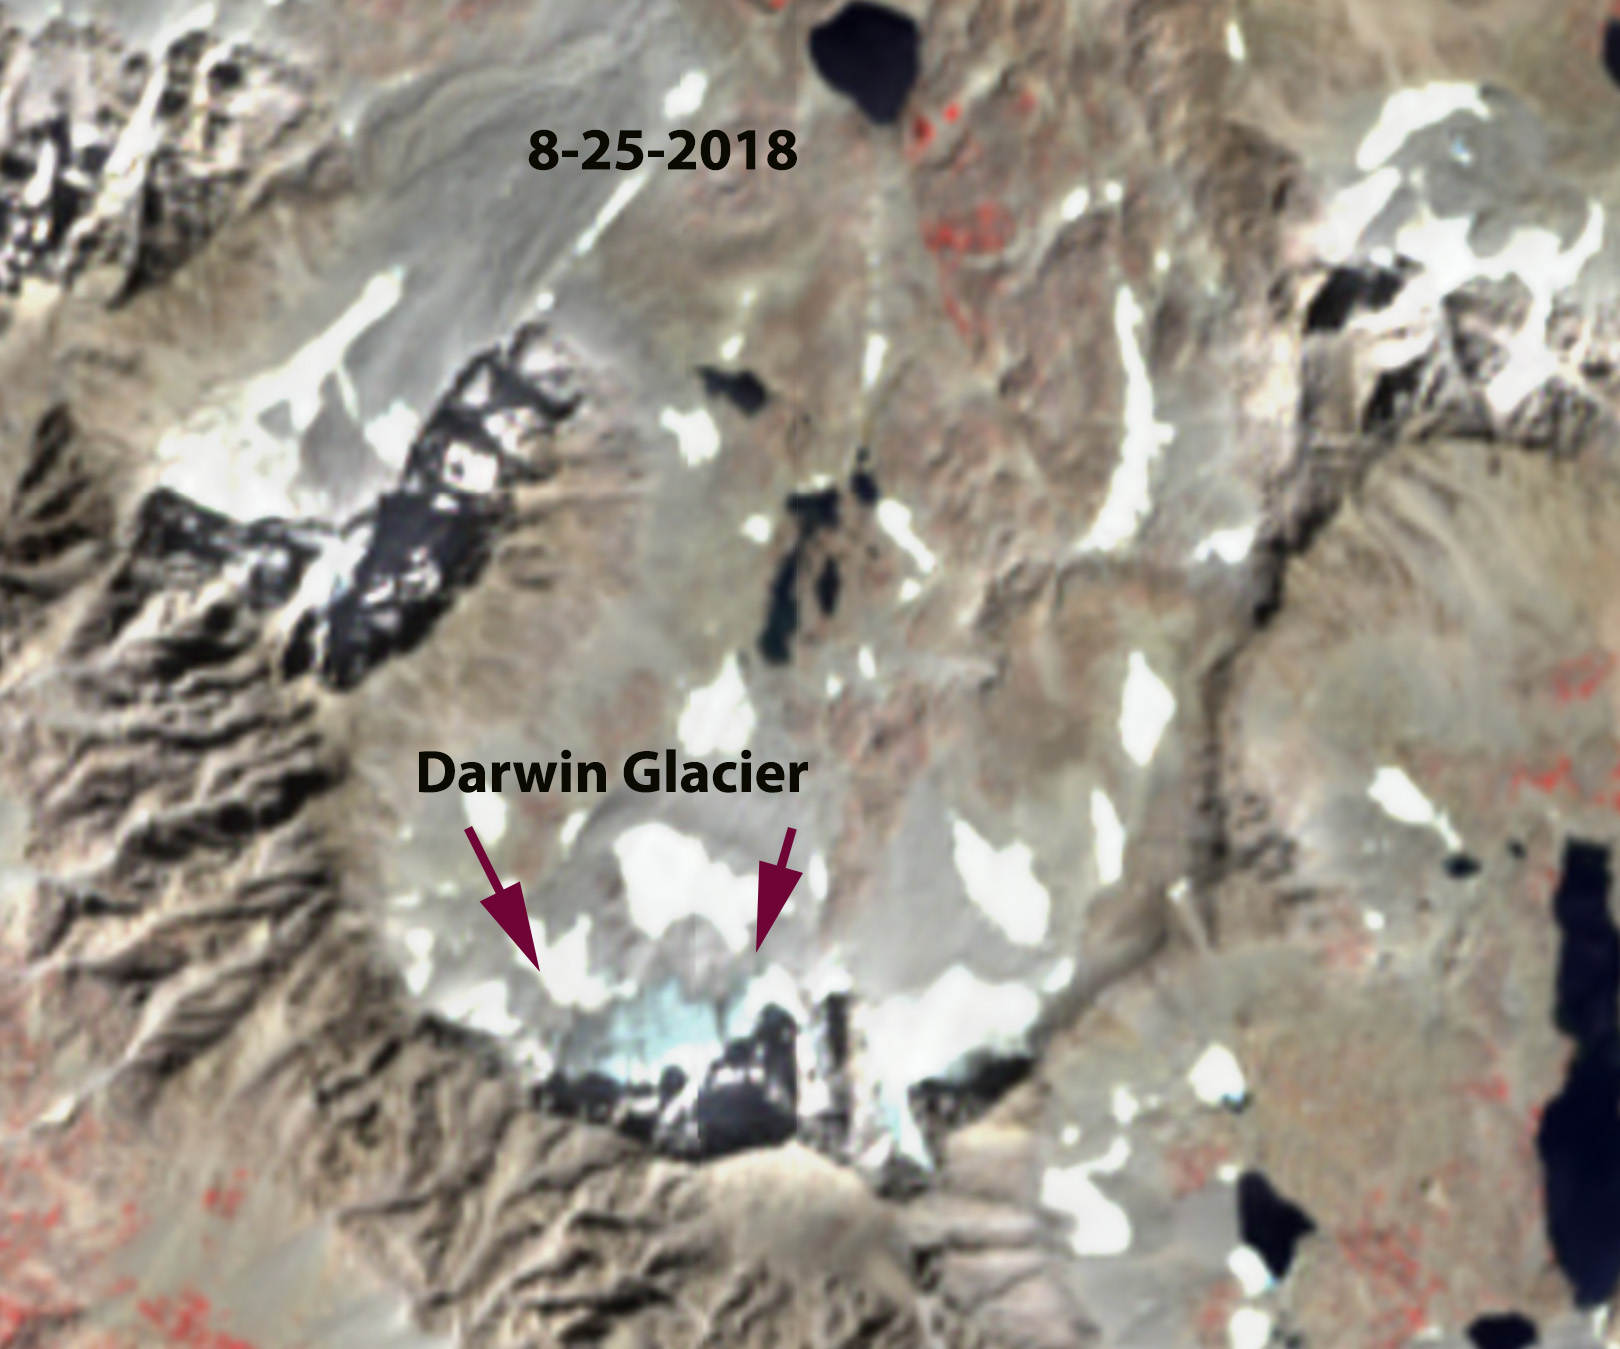
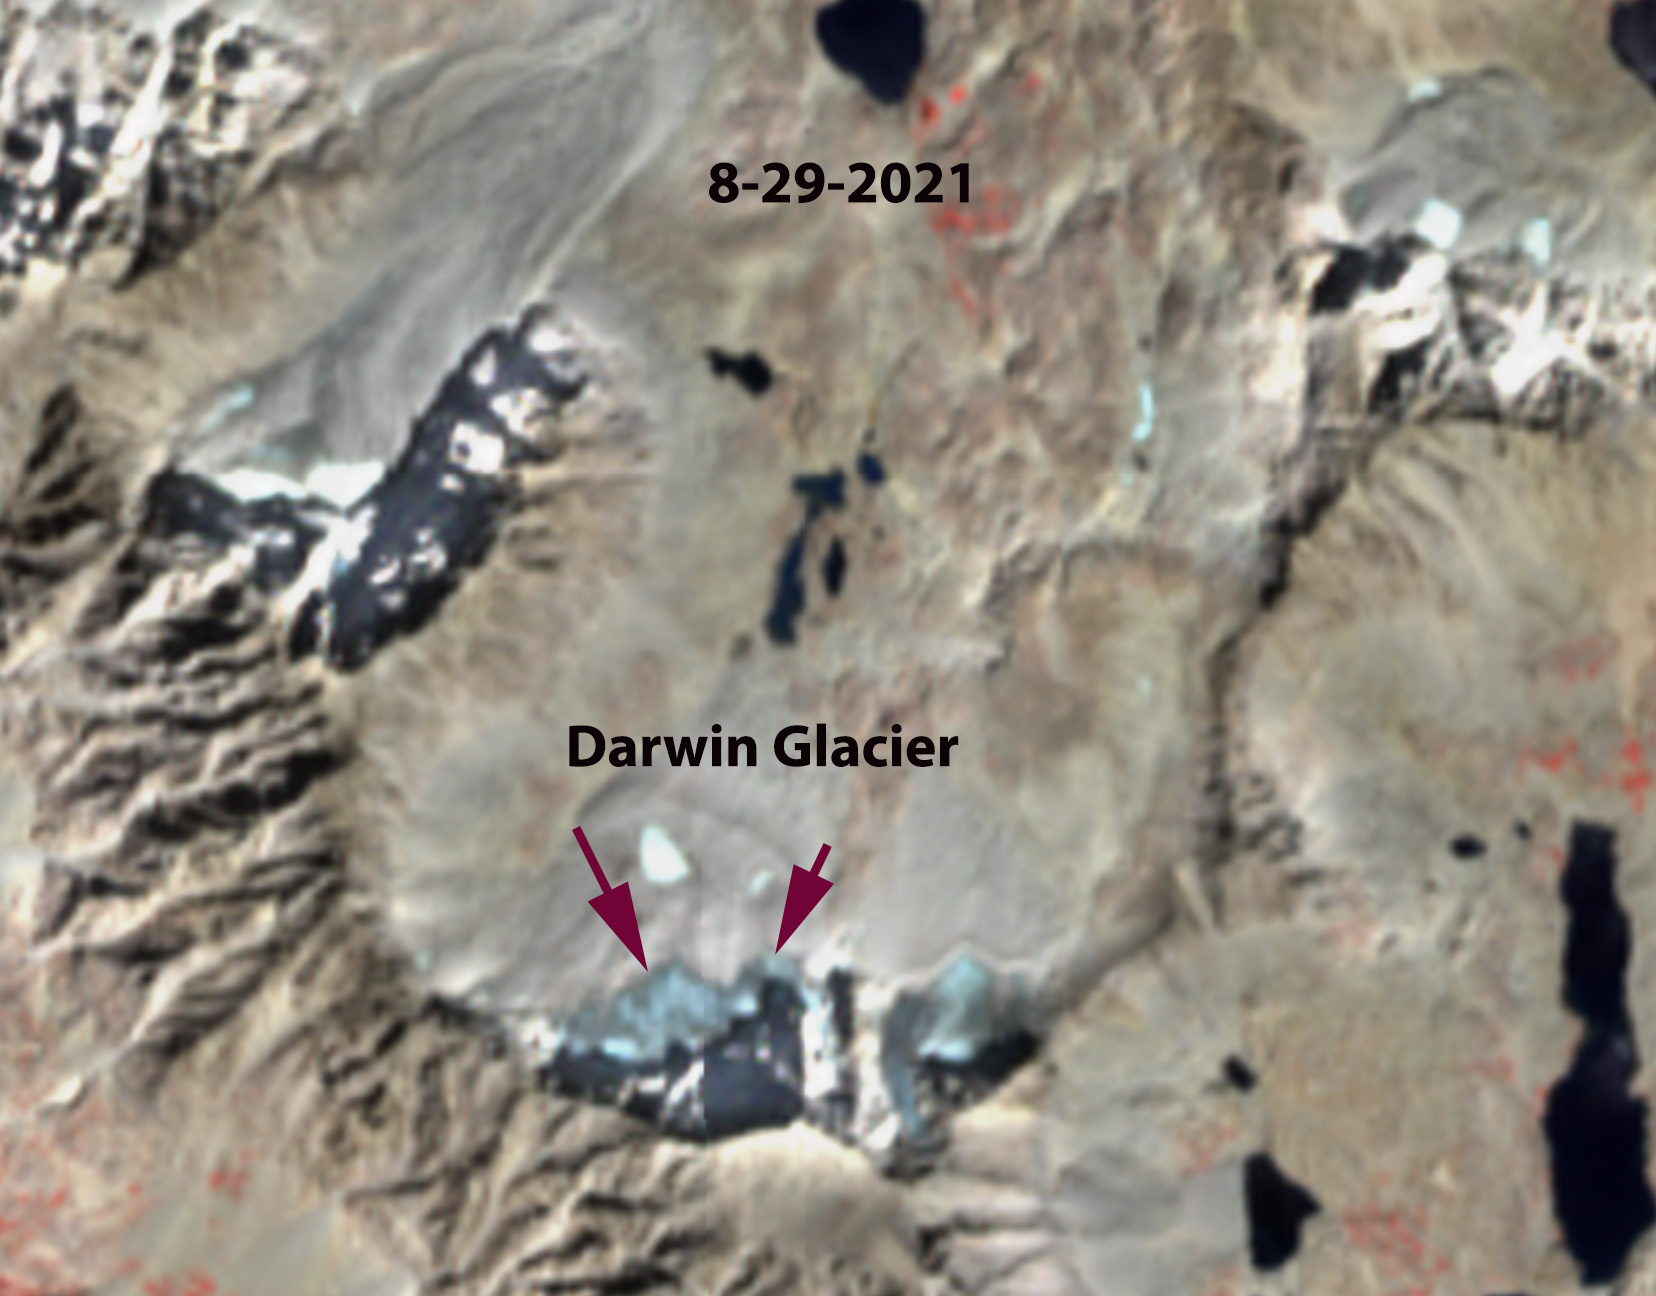
Darwin and Mt. Fiske Glacier on 1976 USGS Topographic map with areas of 0.16 km2 and 0.08 km2 respectively.Darwin Glacier in 2018 Sentinel false color image with an area of 0.048 km2.Darwin Glacier and Fiske Glacier no longer have sufficient area to qualify as glaciers at 0.026 km² for Darwin Glacier and 0.008 km² for Fiske Glacier. No retained snowcover in 2021 or 2022. Darwin Glacier on August 29, 2021 in Sentinel false color image. There is no retained snowcover and area has declined to 0.036 km2.Darwin Glacier on August 28, 2024 in Sentinel false color image. There are two areas where area loss from 2022 is evident, despite 60% of the glacier still having snow cover.
These losses are similar to those observed on Whitney Glacier, Mount Shasta. The NCEI NOAA Division 5 climate data for this area indicates that meltseason temperatures have been the primary cause of the recent decline, though declining accumulation season precipitation has been as well, see bottom.
California Division 5 Average Temperature May-September 1950-2022.
Ice Worm Glacier from the same location in 1986 and 2023, Bill Prater in 1986 image.
Ice Worm Glacier is an east-facing cirque glacier on the east flank of Mount Daniel, WA. Mount Daniel is on the crest of the North Cascade Range of Washington, the crest separates the dry east side that drains to the Columbia River and the wet west side that drains to Puget Sound. The glacier is at the headwaters of Hyas Creek, which drains into the Cle Elum River and the Cle Elum Reservoir. The Cle Elum Reservoir has a storage volume of 538,900,000 m3 and is primarily used for flood control in spring, and agricultural irrigation in summer. This reservoir is the largest in the Yakima River Basin and provides irrigation to 180,000 hectares of agricultural land. The glacier is located in the Alpine Lakes Wilderness area which prohibits the use of mechanized equipment. The Ice Worm Glacier cirque floor is at 1940 m and the headwall at 2050 m. There is a bench at 2150–2300 m that held a glacier/perennial icefield prior to 2015. The glacier is accessed by backpacking 8 km from the Cathedral Rock trailhead with the same base camp used each year at 1700 m on the bank of Hyas Creek. Detailed publication by Mauri and Jill Pelto at: Loss of Ice Worm Glacier, North Cascade Range, WA USA, 2025.
The glacier is fed by wind drift accumulation along the ridge that was just above the top of the glacier during the 1944-2000 period. Avalanching from the slopes below the East Peak of Mount Daniel and from the ridges extending along the north and south flank of the glacier have also been significant. The glacier is part of the Mount Daniel-Mount Hinman Glacier Complex just south of Highway 2 and sits astride the Cascade Divide. This complexcomprised of 9 glaciers covering 3.8 km2 in 1984. This was the biggest cocentration of glaciers between Mount Rainer and Glacier Peak. At the end of the summer 2023 melt season only three of these remain as glaciers, Daniels, Foss and Lynch Glacier. We began monitoring these glaciers along with Ice Worm Glacier in 1984.
Ice Worm Glacier Evolution
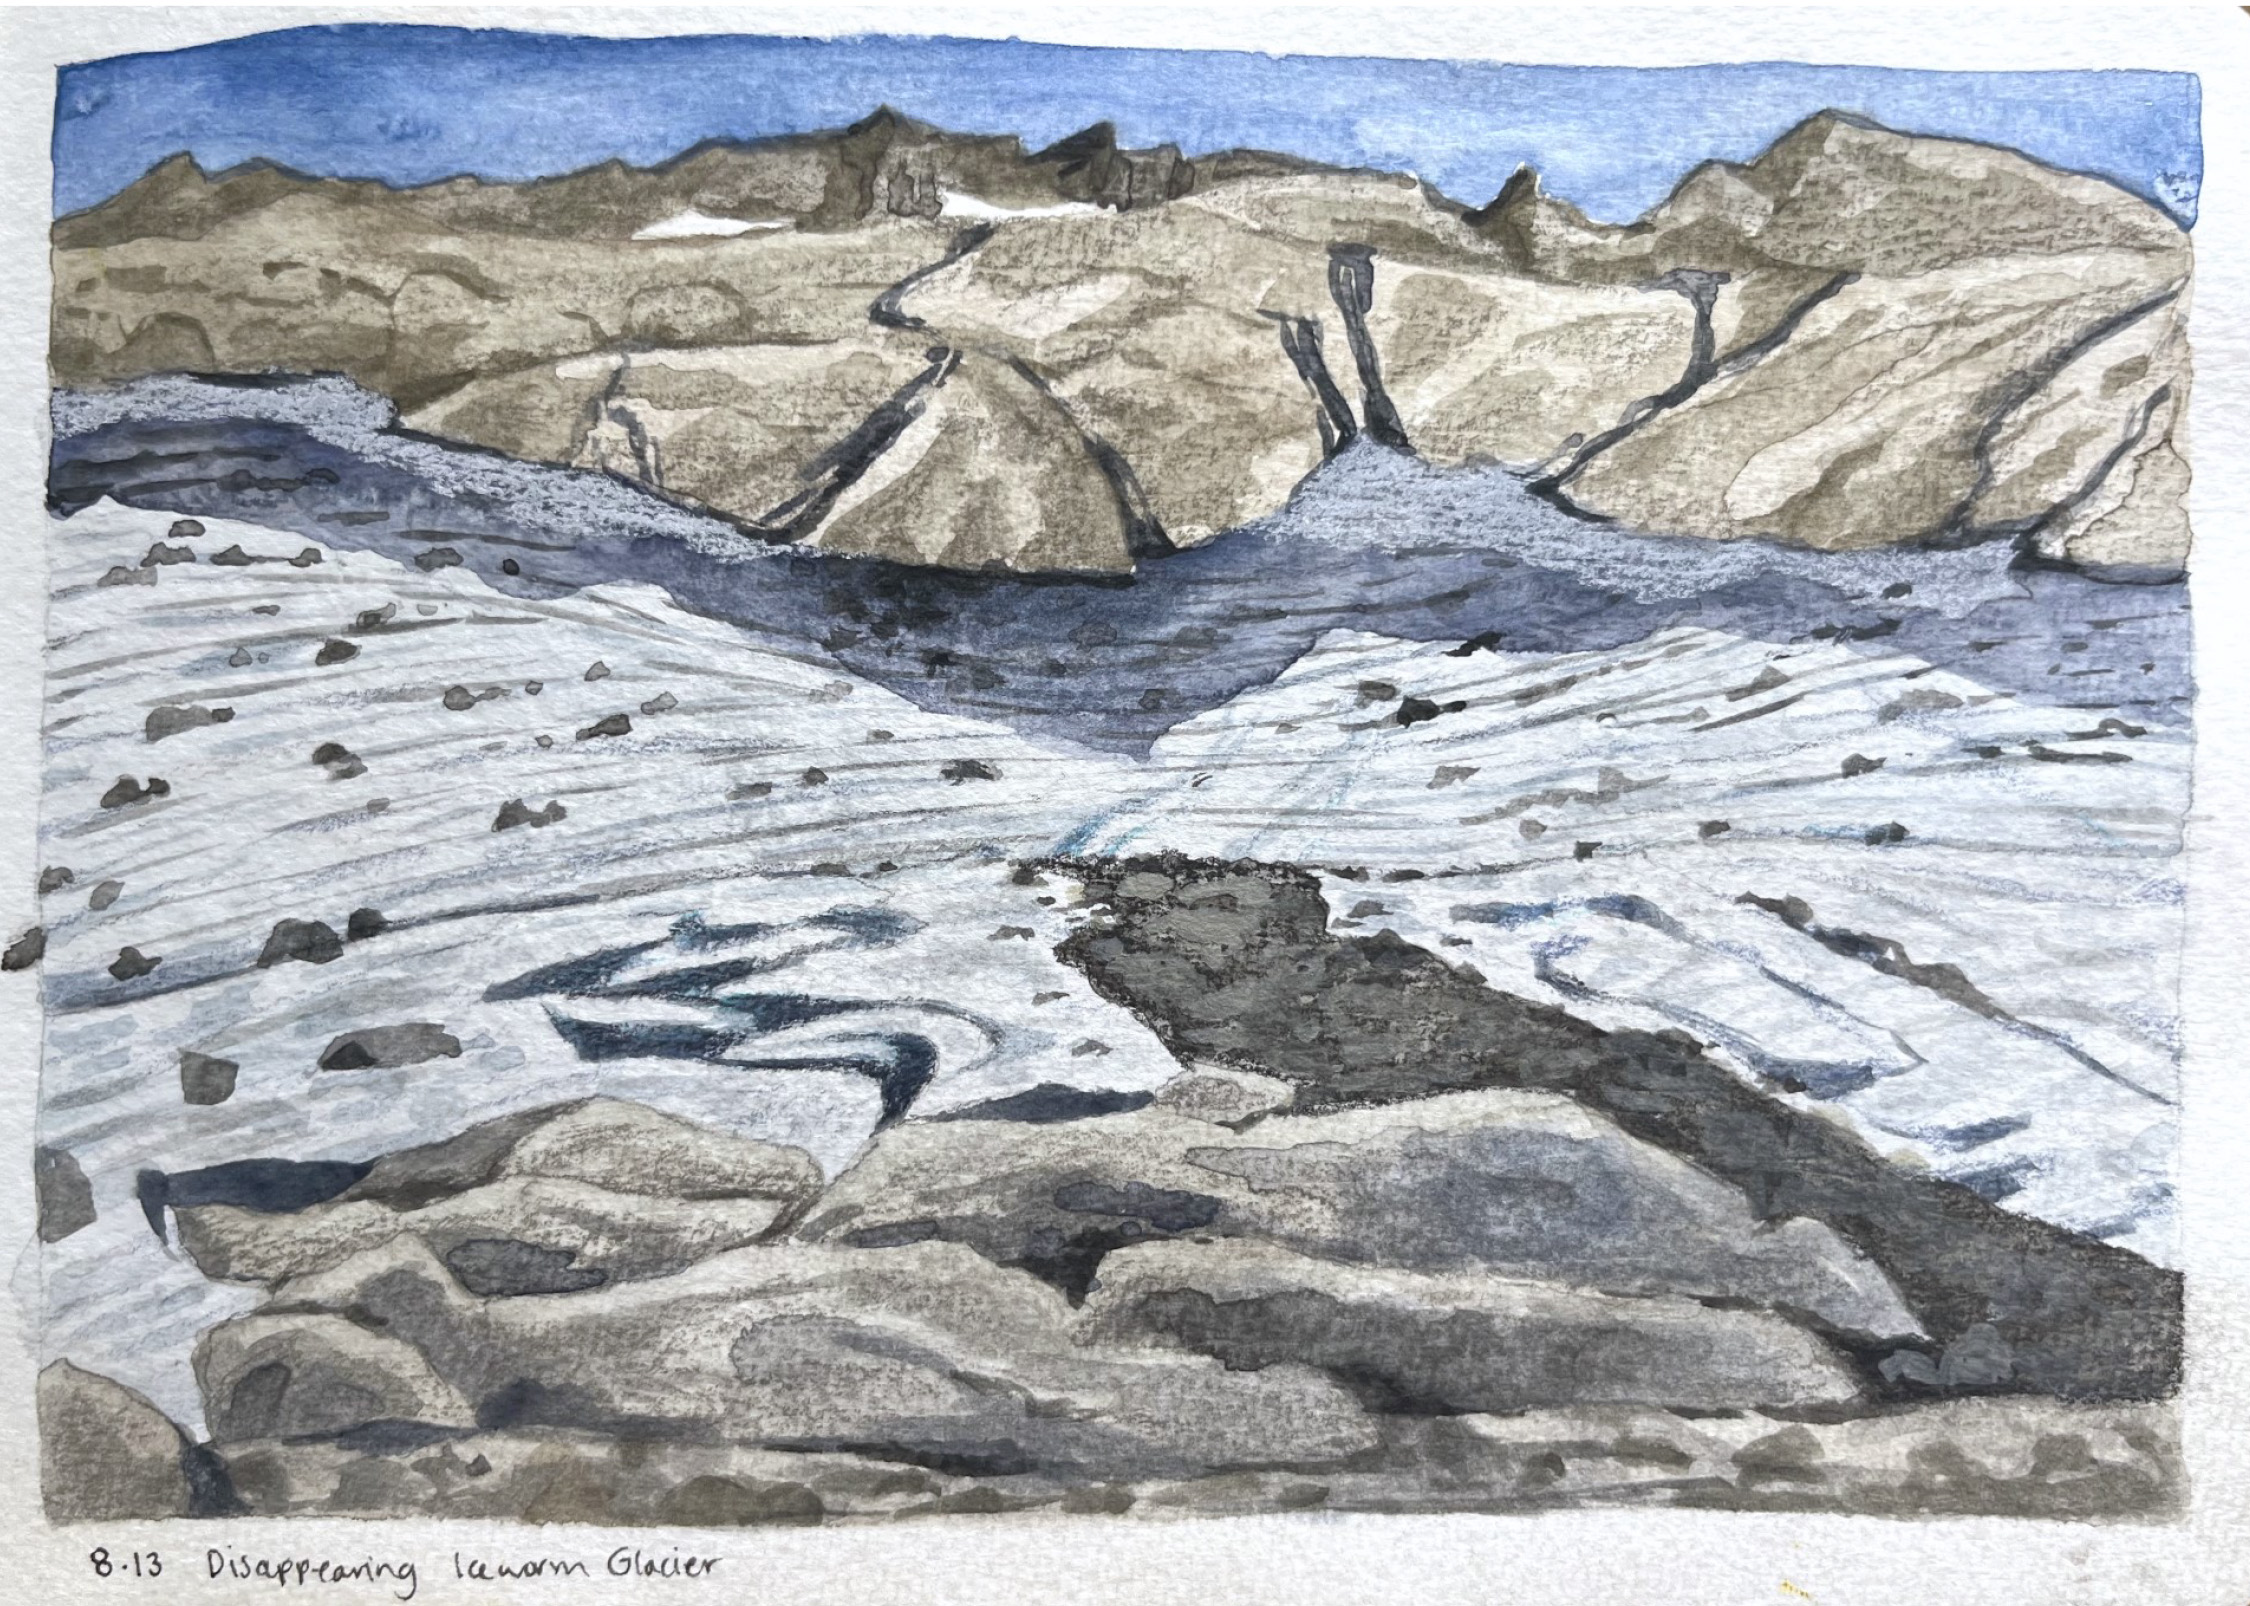
Ice Worm Glacier field sketch by Jill Pelto in 2023.
In 1986 William (Bill) Prater, who had made many first ascents in the area between 1944 and 1960, joined us in the field. Bill also had invented and patented (1973) the first snowshoe with a claw attached to its binding, the Sherpa Snowshoe. Comparing images from these early visits with the current margin of Ice Worm Glacier indicated that there had little change in this glacier from 1944-1986. The mapped area in 1958 was 0.19 km2 (GLIMS, 2023), in 1986 we mapped the area at 0.18 km2.
Each summer during the third week in August we measure the mass balance of this glacier. Because the glacier lacks crevasses we simply grid the glaciers with measurements made 50 m apart along transects running up the glacier and across the glacier along the margins. We also completed a longitudinal profile running up the glacier from a fixed location on the bedrock at the below and at the top of the glacier. The surface elevation was determined at the specific 50 m points to identify thinning of the glacier. During the first decade the glacier extended to within 10 m of the ridge on the south side of the glacier, allowing us to ski off of the ridge, see 1990 image below.
Glacier Area Change
View of the south ridge across Ice Worm Glacier in 1990 above and 2006 below, note recession of the top of the glacier from this ridge.
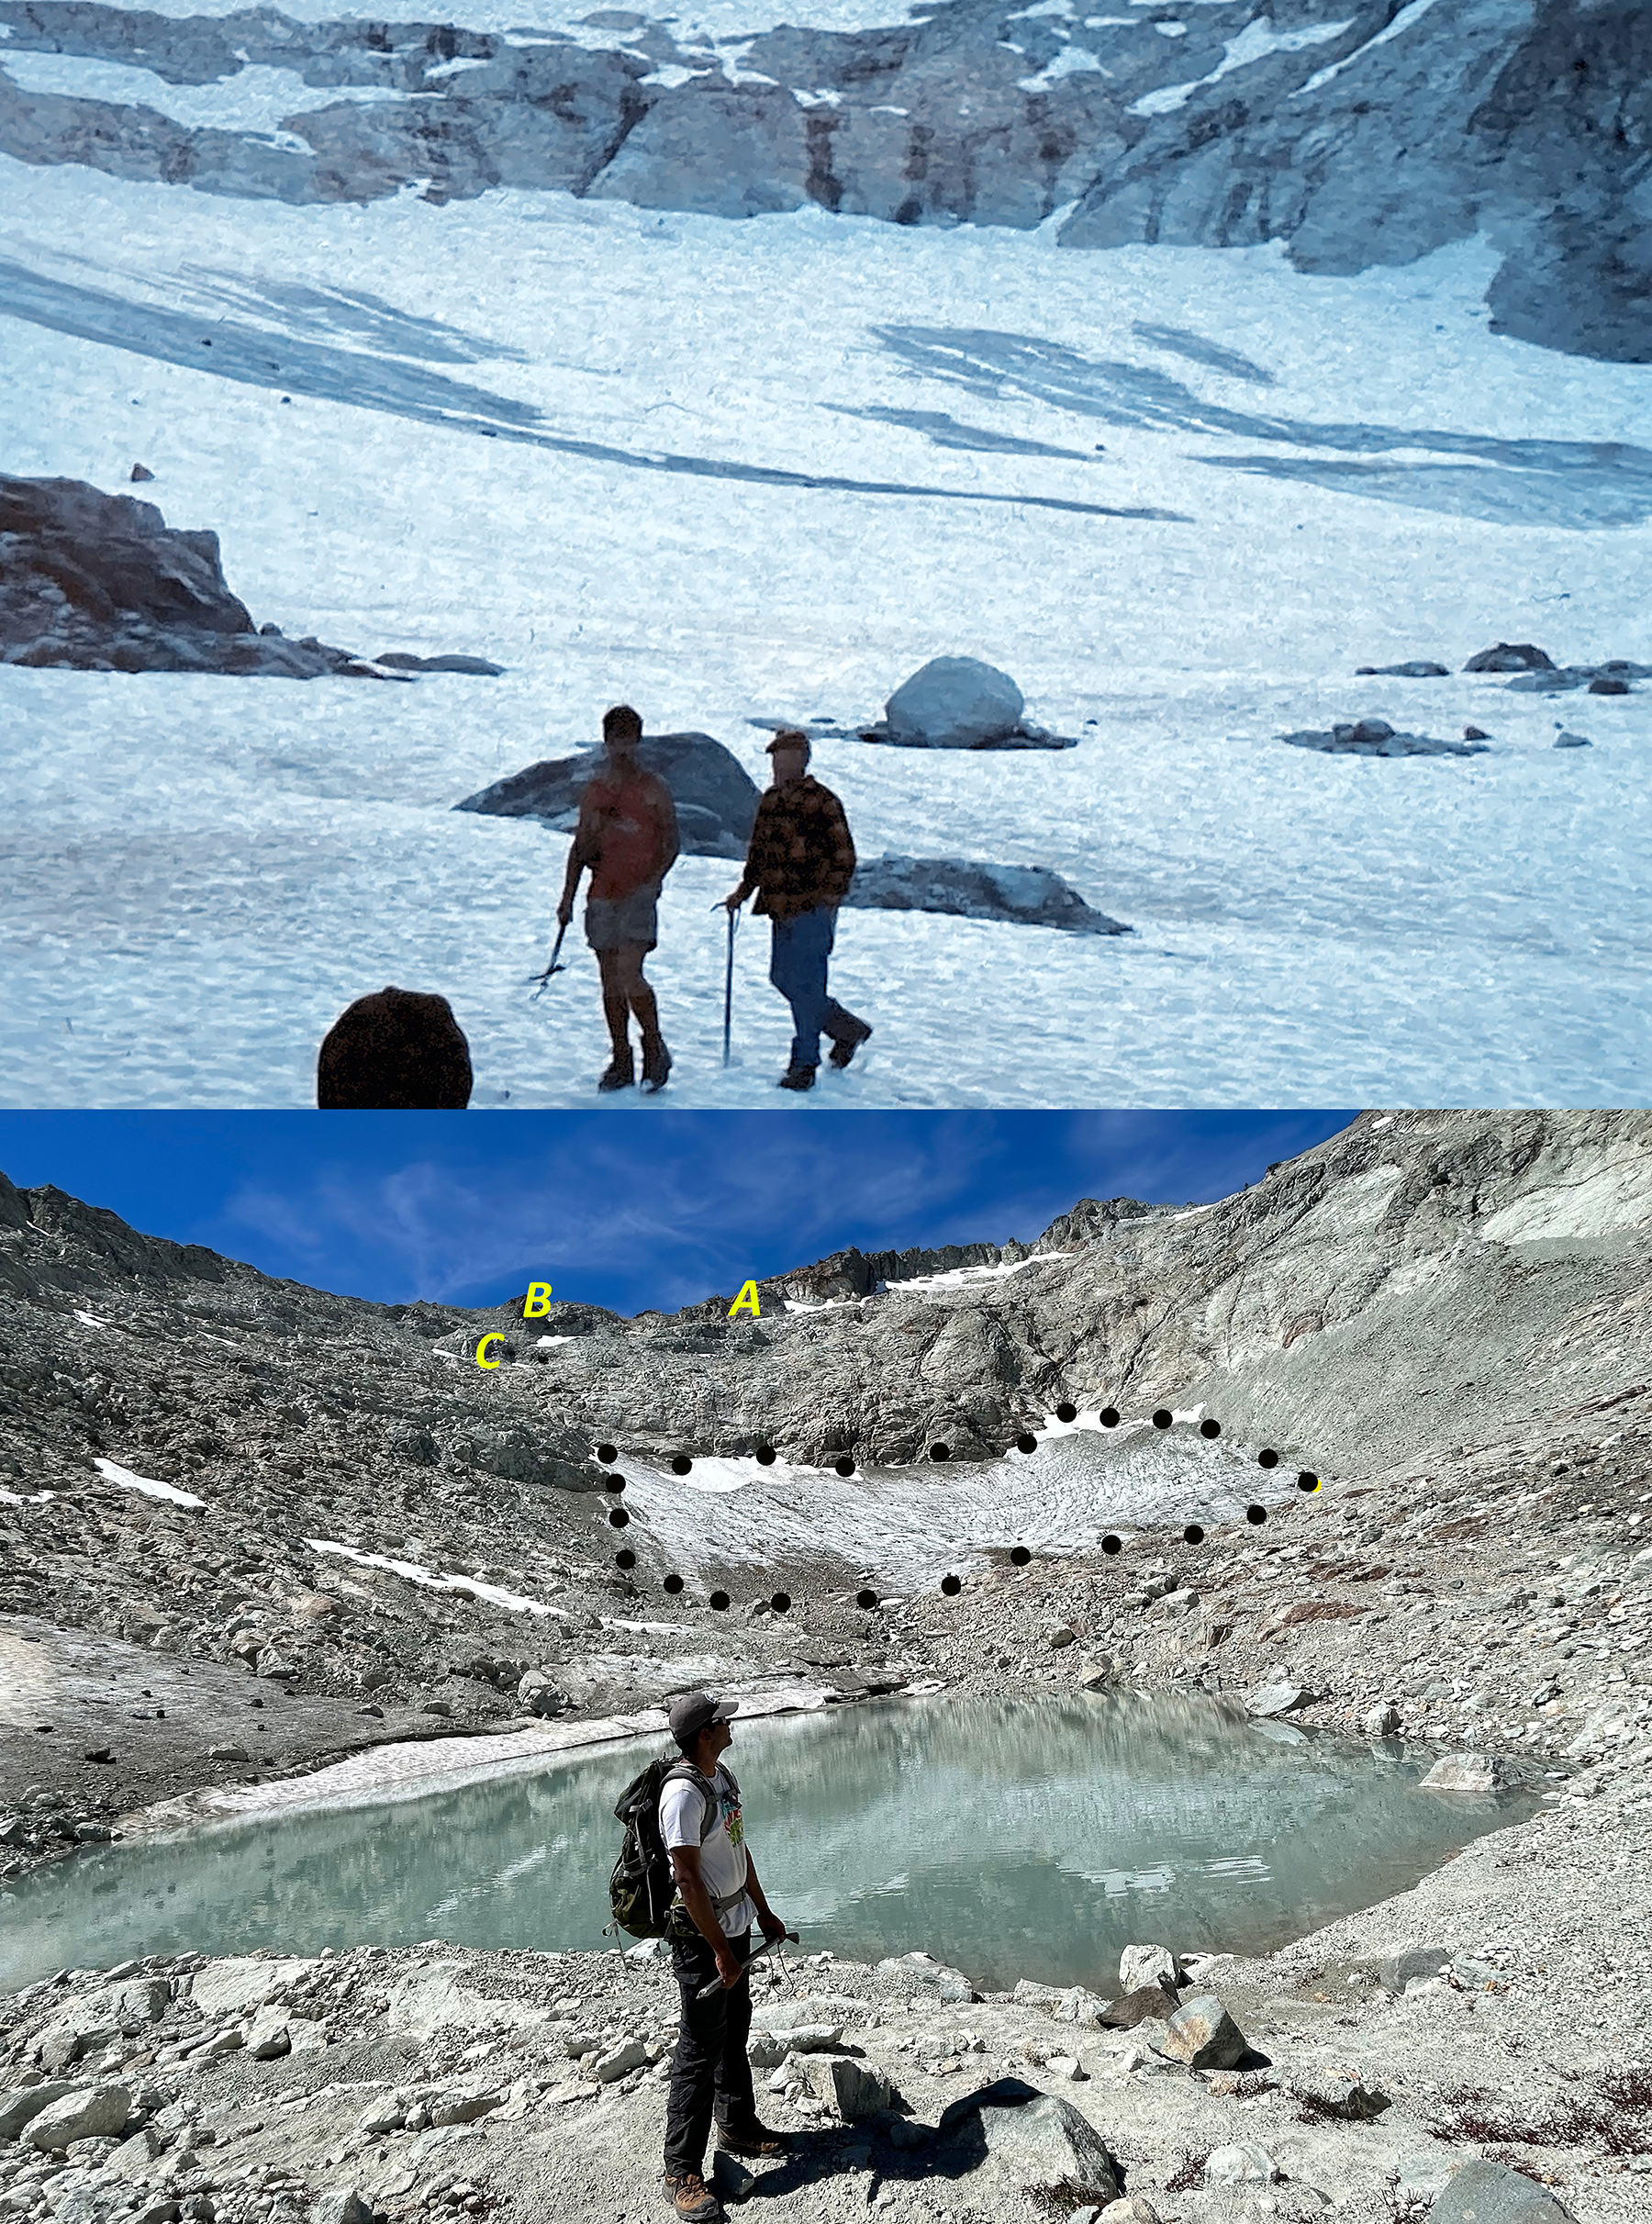
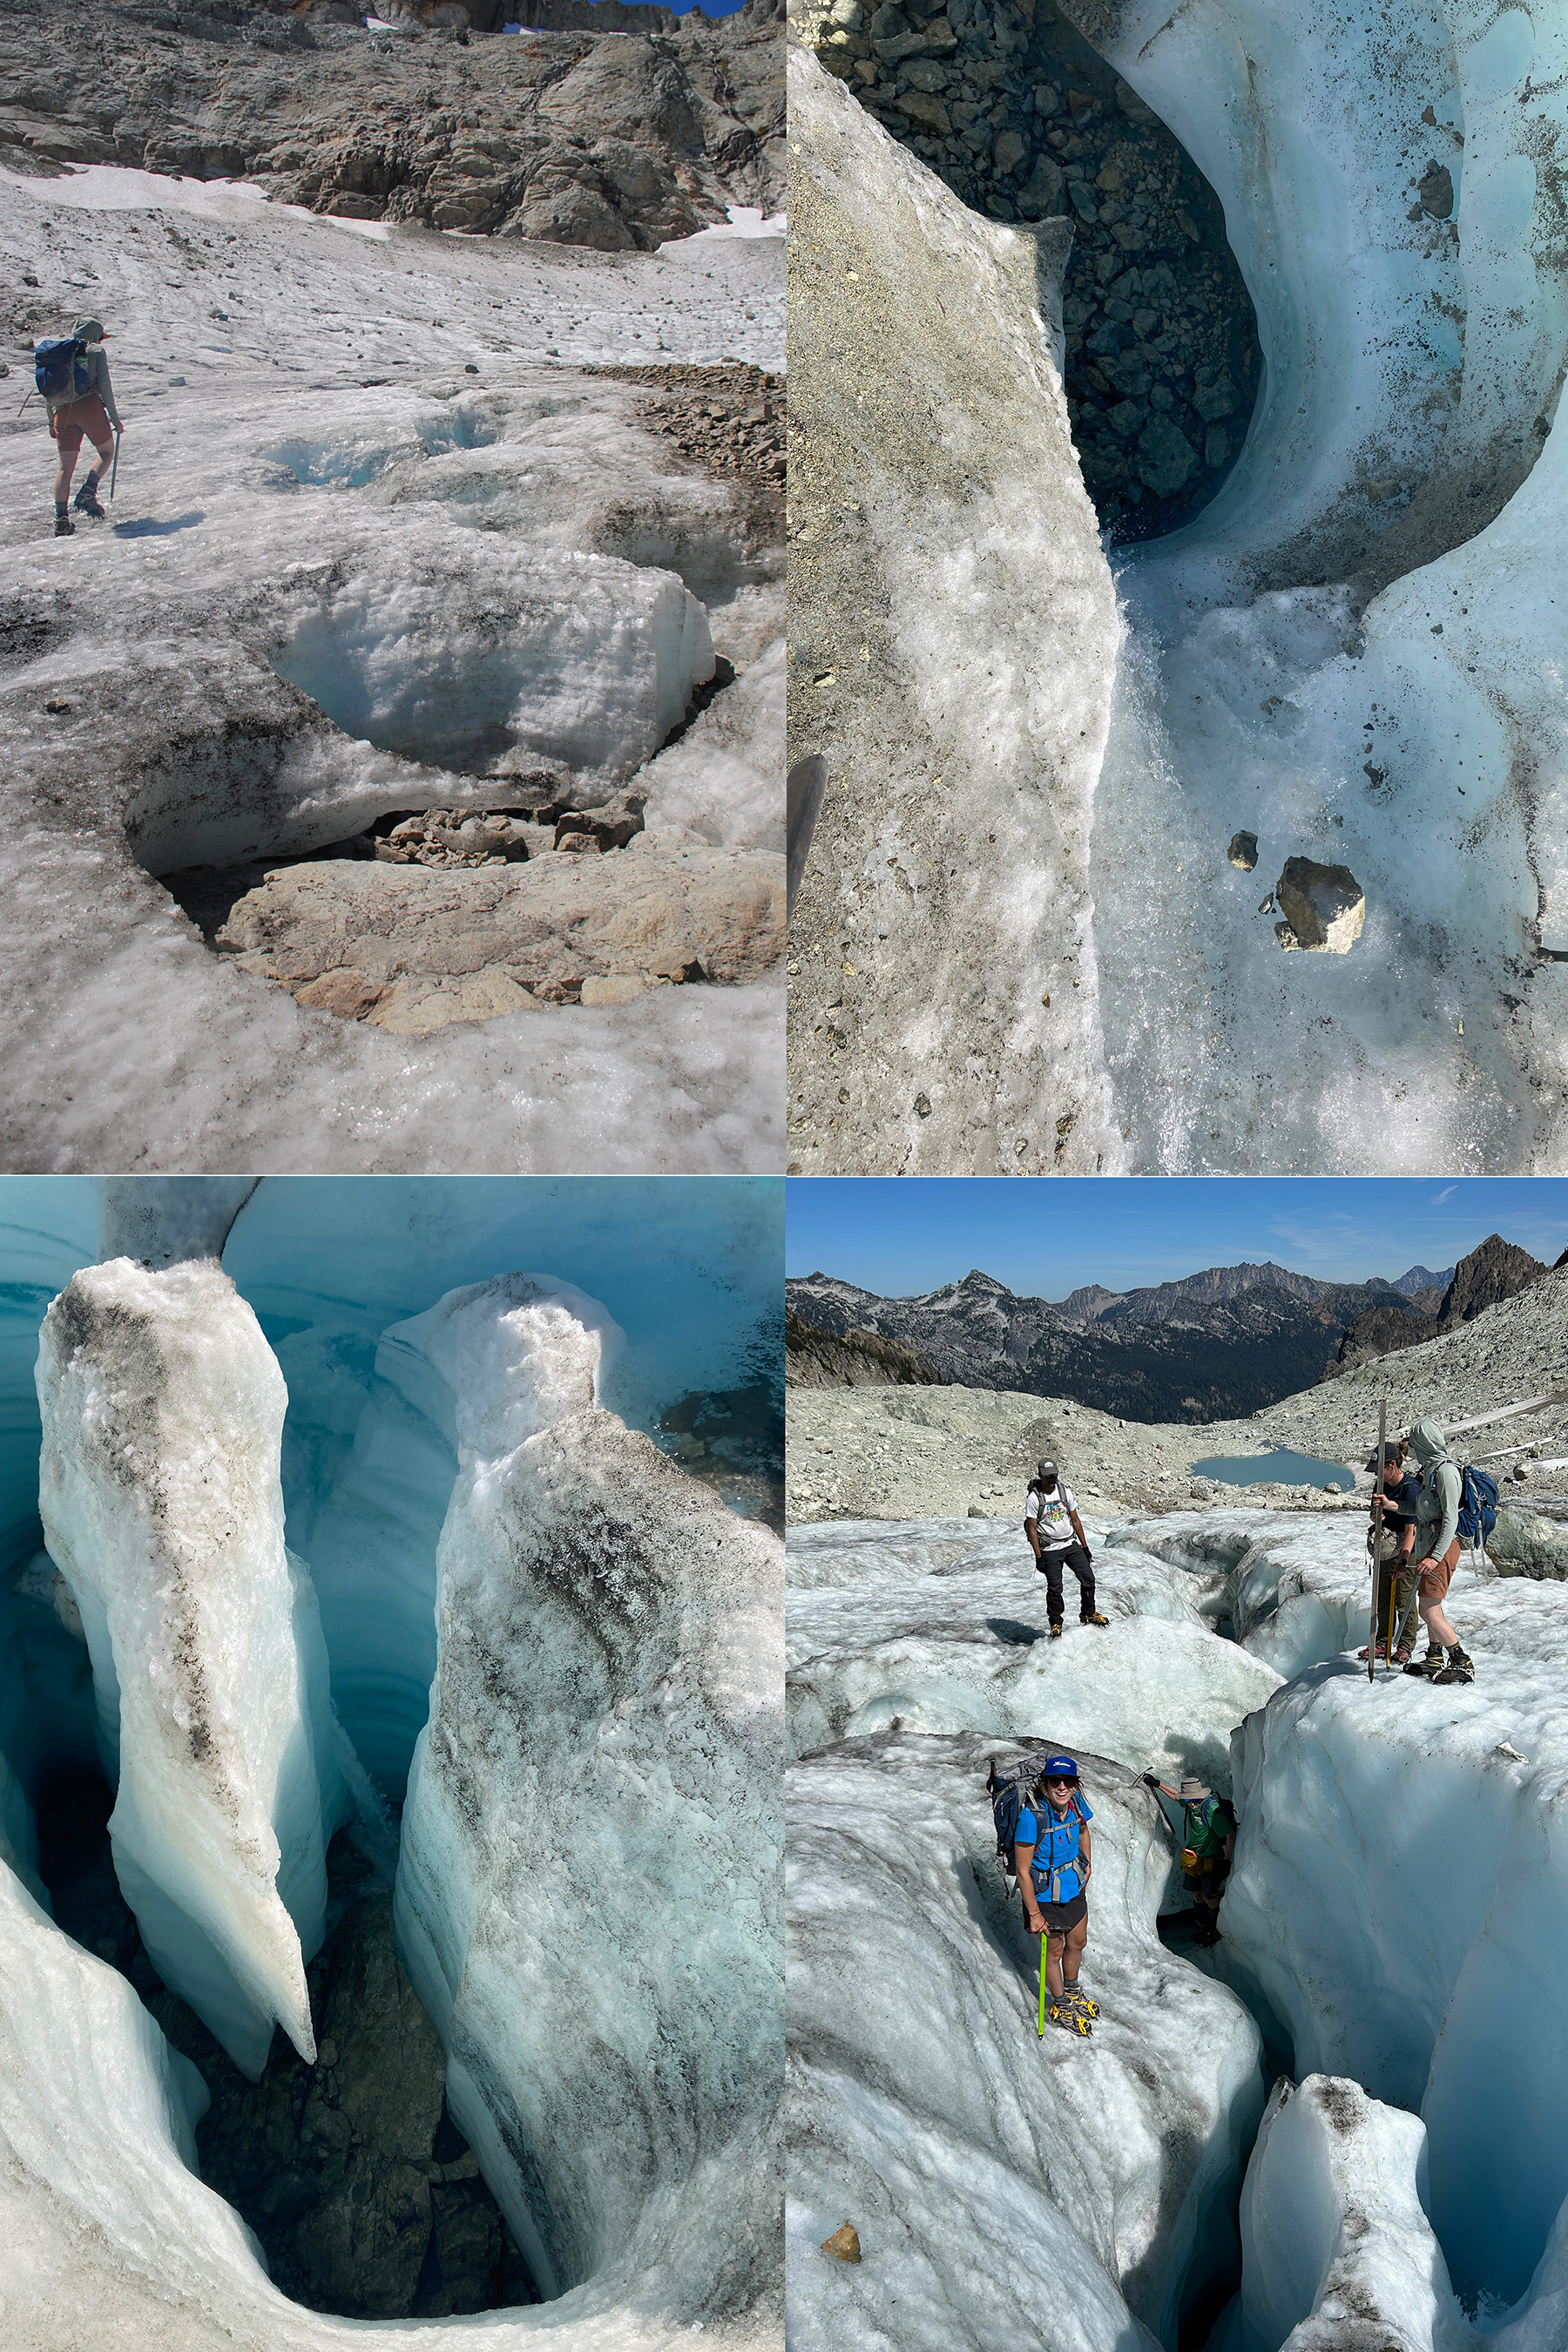
From 1984 to 1992, the glacier extended to within 15 m of the ridge on the south side of the basin. By 1995 this was no longer possible as the top of the glacier was retreating as fast as the bottom of the glacier. In 2006, the recession from this ridge was greater than the recession at the terminus. The glacier perimeter was surveyed in the low snow years of 2005 and 2015, identifying the glacier area to be 0.15 km2 and 0.110 km2, respectively. In 2015, the inventory for RGI noted an area of 0.106 km2. Annually, from 2021 to 2024, low snow cover allowed for mapping of the glacier perimeter during a rapid decline from 0.09 km2 to 0.03 km2. The area loss from 1986 to 2015 was 0.07 km2, which is less than the area loss from 2015 to 2023 of 0.08 km2. provides a photo comparison of the change from 1986 to 2023, with the people standing in the same location in each case. The observed area determined in the field from the GPS position locations closely matches the RGI inventory area in 2015 and the area derived from overlaying the points on Sentinel 2 imagery from August 2021 to 2024, which have a 10–30 m resolutionThis summer we observed a dozen holes that reached the bottom of the glacier 4-6 m below, indicating how thin the ice is. There is no movement, the size and thickness are too low to generate future movement, hence this is no longer a glacier. A glacier is a body of snow and ice that is moving, this requires a persistent thickness of 20-30 m, which is typically associated with snow/ice areas of ~50,000 m² or larger. As a glacier becomes thinner or smaller than this movement will not be sustained.
Table 1. The observed area of Ice Worm Glacier from field measurements. The area of Ice Worm Glacier from previous inventories and Sentinel 2 imagery.
Year
Field Mapped Area (m2)
Validating Aerial/Satellite Image Area (m2)
1958
190,000 (GLIMS)
1986
180,000 (±10,000)
Field Observation only
1992
170,000 (±10,000)
Field Observation only
2005
150,000 (±5000)
Field Observation only
2015
110,000 (±5000)
106,000 (RGI)
2021
88,000 (±2000)
90,000 (Sentinel)
2022
68,000 (±2000)
Field Observation only
2023
41,000 (±2000)
40,000 (Sentinel)
2024
32,000 (±2000)
30,000 (Sentinel)
We have measured discharge at a natrual weir below Ice Worm Glacier since 1986. Average August daily runoff has declined 60% by 2022.
Glacier Base Observations
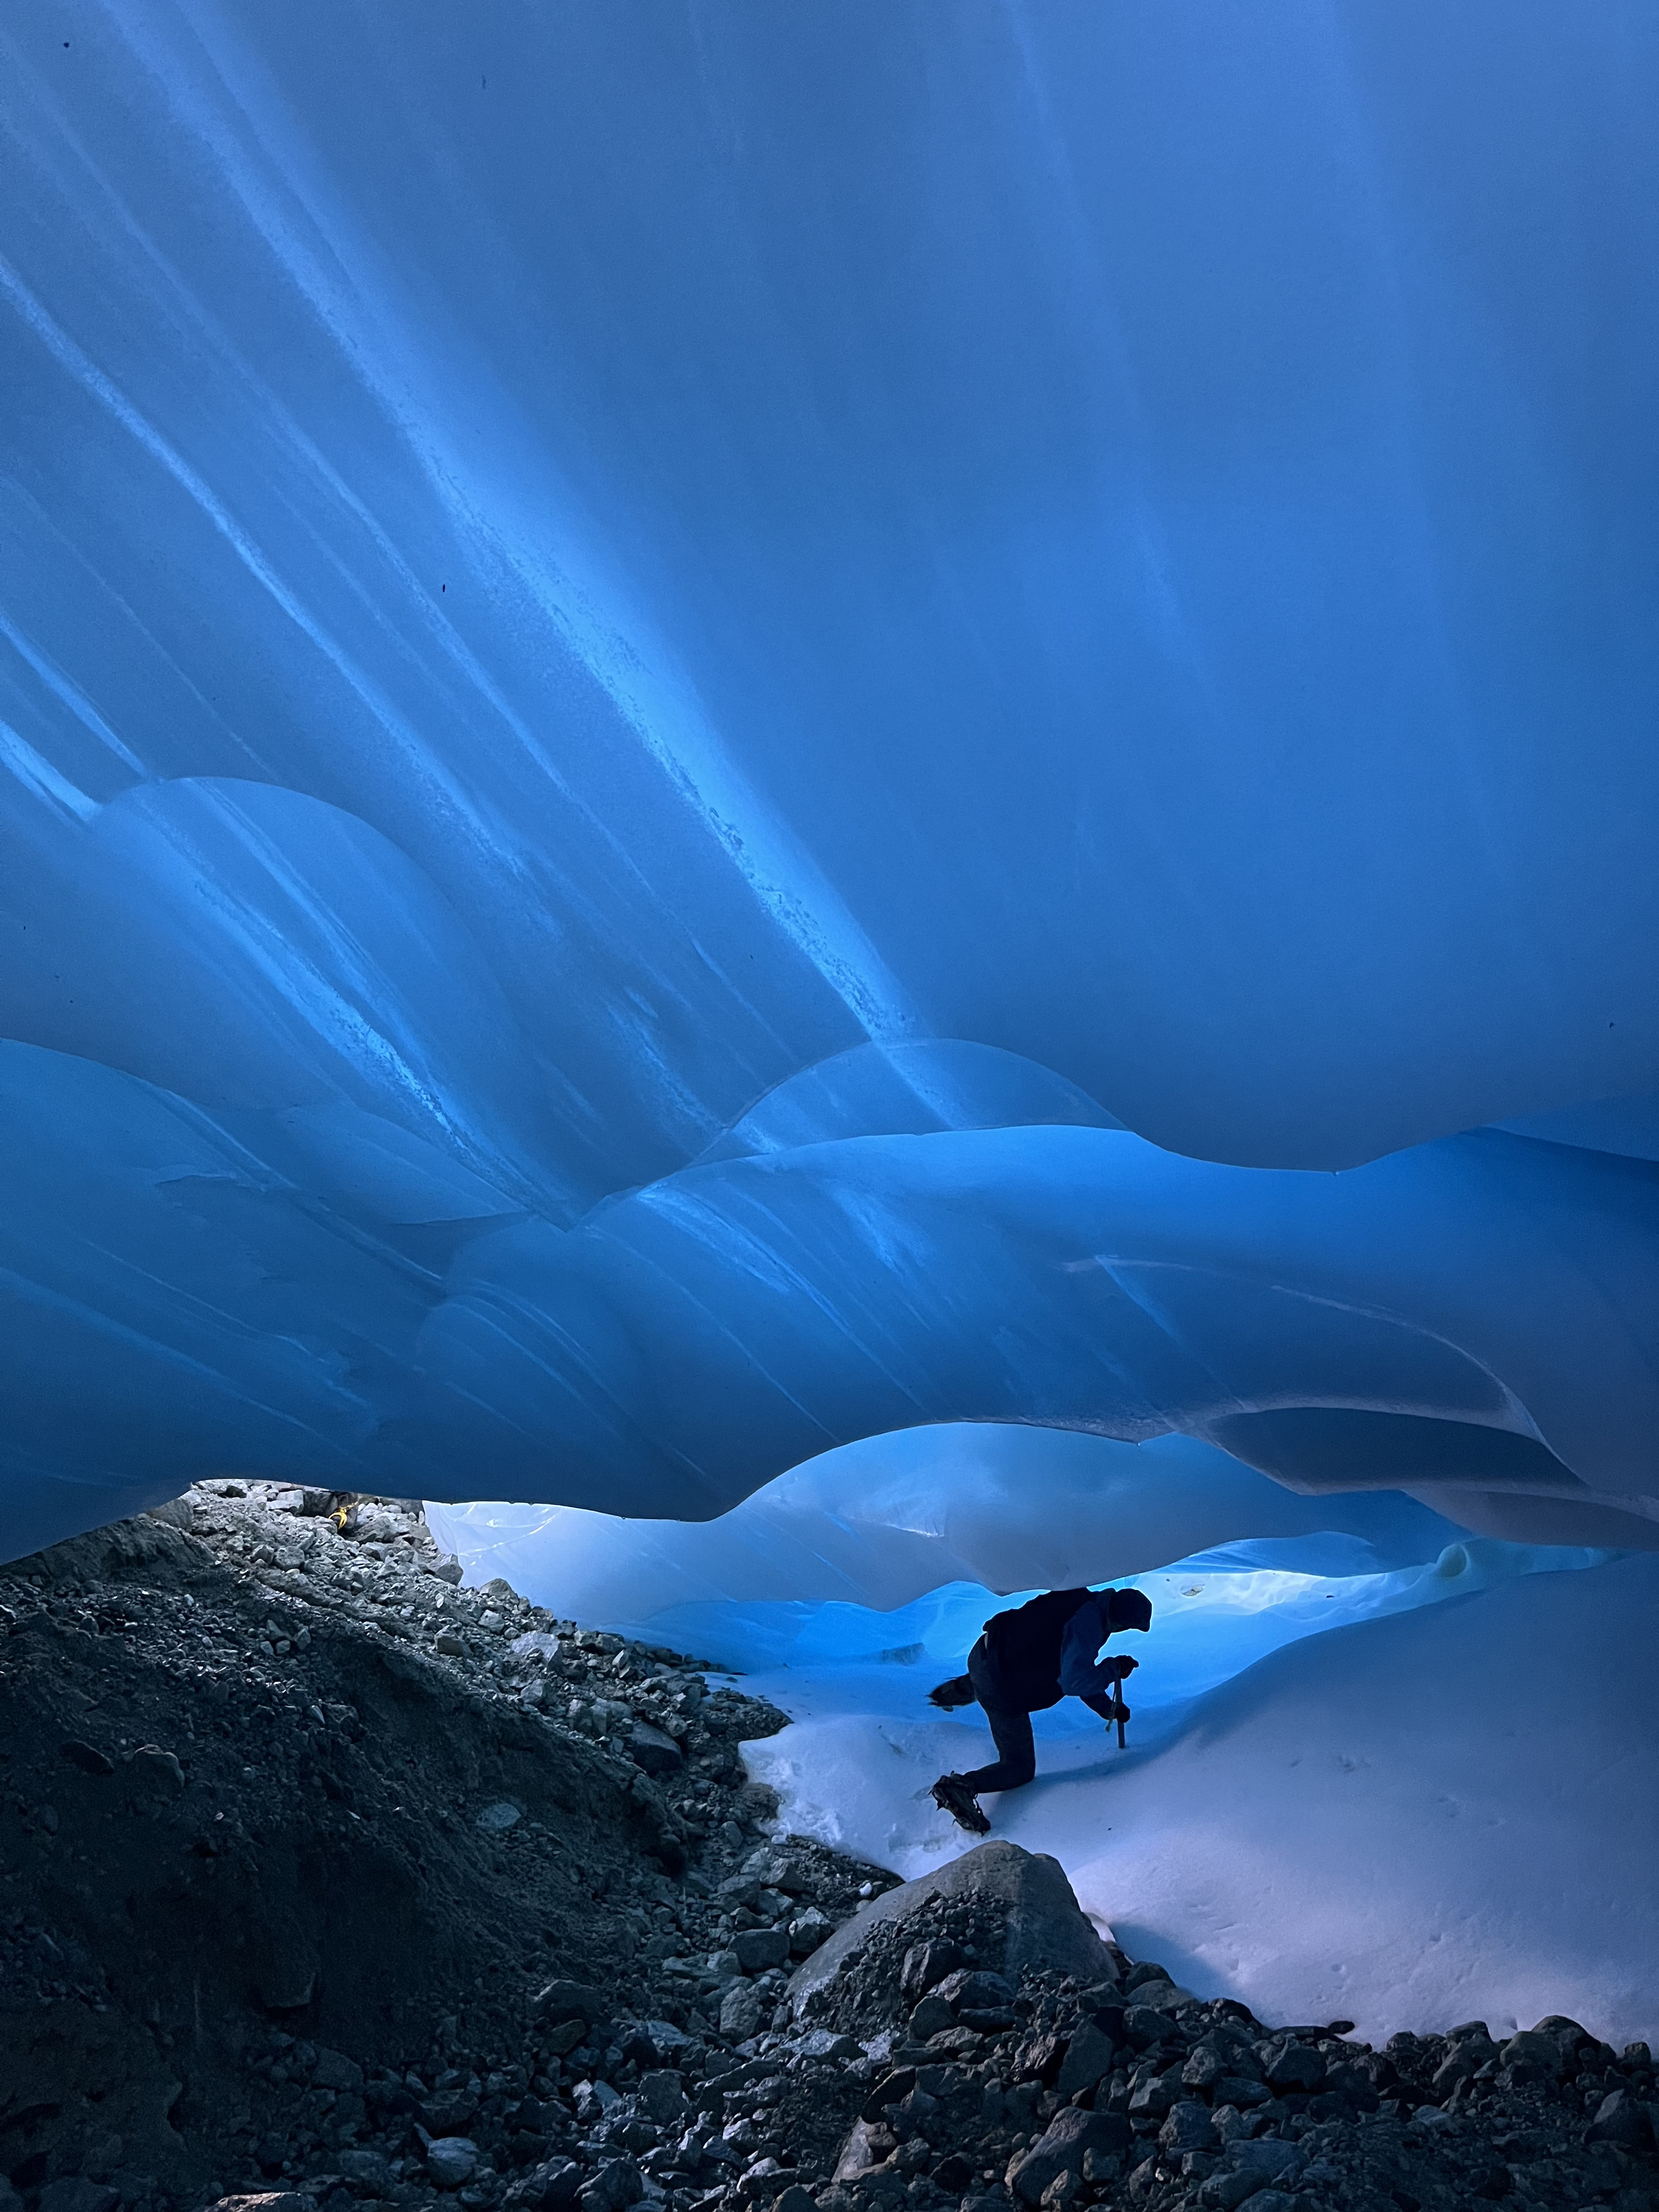
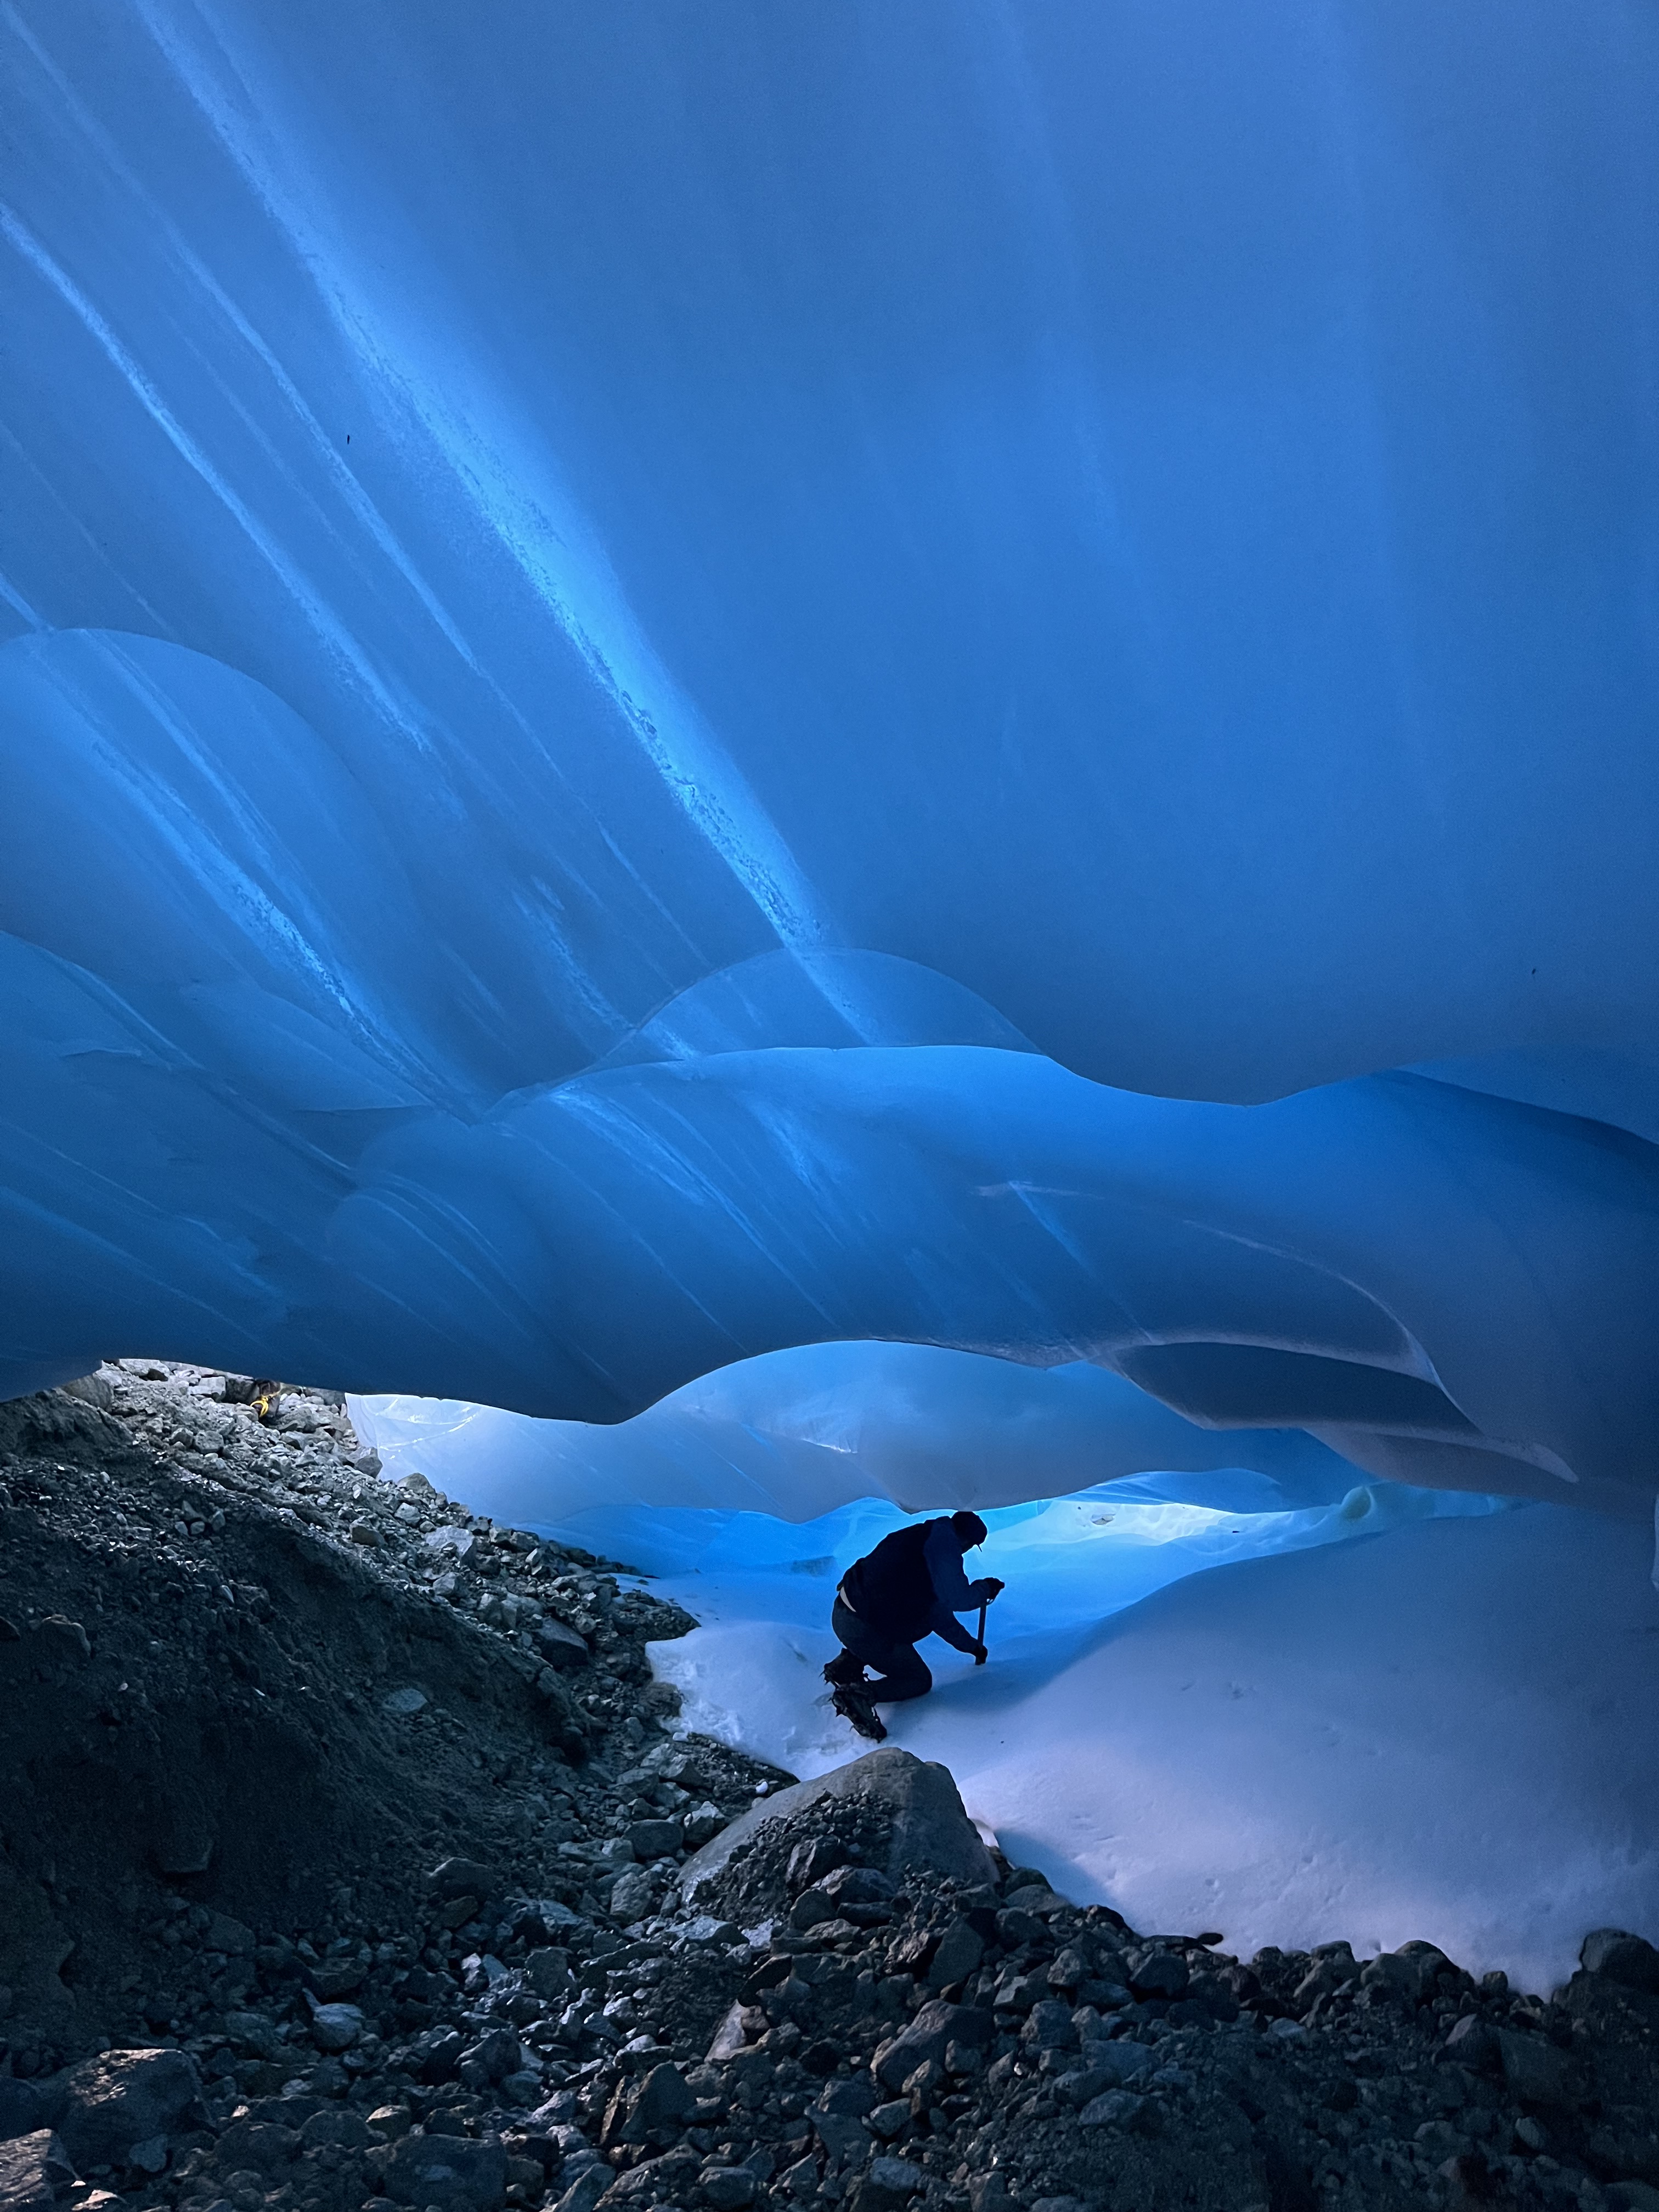
Ice Cave in 2024 that extended from top to the end of the glacier.
Beginning in 2015, we routinely assessed how deep each moulin, crevasse or supraglacial stream channel was on the glacier. One measure of a glacier no longer being a glacier is when crevasse features and stream channels consistently reach the bedrock below the glacier. In 2023, we examined 24 of these features and each reached bedrock at depths of 2–10 m. These features were distributed widely across the glacier. There are undoubtedly limited areas of thicker ice. In 2024, we explored an ice cave that extended 250 m from the top of the glacier to the end of the glacier. The cave roof was 1–4 m above bedrock, and the roof was consistently less than 2 m thick allowing light to penetrate from the glacier surface into the cave. An extensive ice cave transecting the entire glacier such as this cannot exist in a current glacier because ice movement would lead to ice cave closure.
Streams channel reaching bedrock at base of Ice Worm Glacier.
Each year in mid-August, stream discharge has been observed immediately below the 1986 terminus position of Ice Worm Glacier at 11 a.m., 2 p.m. and 5 p.m. during the field visit. This stream is also fed by perennial snowfields and, before 2015, a small glacier. These observations are insufficient to quantify daily runoff, but because of the consistent timing and methods, do allow for comparison. The glacier is located on the dry side of the range and has not experienced rainfall during any of our field observation periods, which would contribute to stream discharge. From 1985 to 2002, streamflow was observed on 36 days, with the average discharge being 0.12 m3 s−1. From 2021 to 2024, discharge was observed on 6 days with the average discharge being 0.03 m3 s−1. This roughly 75% decline in August runoff is similar to the 60% loss in runoff modeled for the loss of small glaciers in basins in the Alps and observed when the Lewis Glacier, North Cascade Range was lost. The change in summer streamflow in Hyas Creek near our base camp is apparent, as it had been a challenging stream crossing to keep your feet dry until 2013, and now is a simple step across. There has also been a marked increase in algae coating the substrate of the stream with the lower flow, clearer and warmer water, which is expected.
Climate Drivers
Trends in summer temperature at Western Cascade weather stations for the 1896 to 2024 period indicate that seven of the ten warmest melt seasons (June–September) have occurred since 2013. Melt season temperatures from 2014 to 2024 were 1.3 °C above the 1896 to 2022 mean. The long-term winter temperature trend from 1896 to 2024 has been 1.2 °C. From 2014 to 2024 winter temperatures were 0.9 °C above the long-term average, the warmest decadal period of the record.
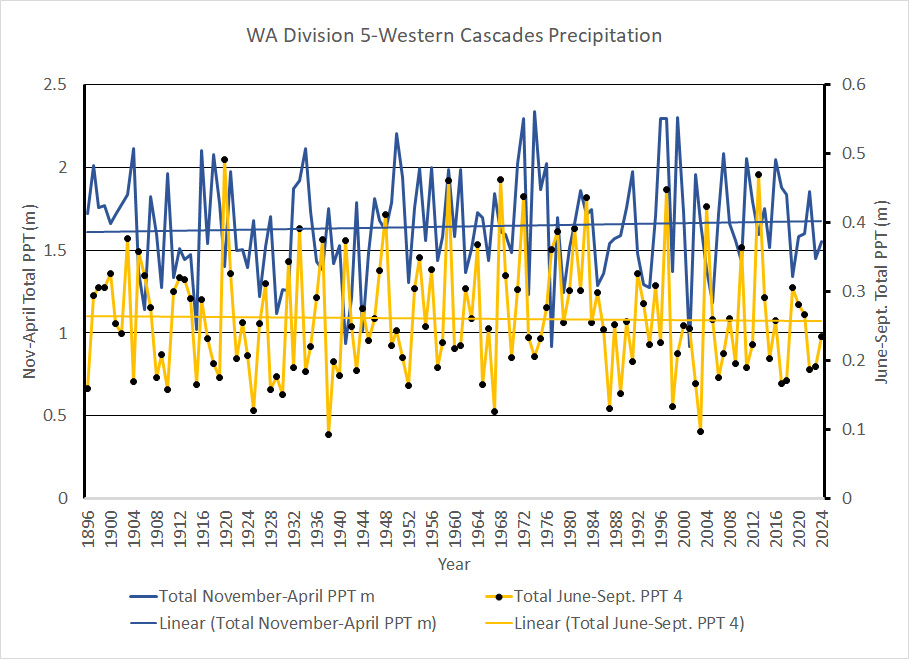
During the 1896 to 2024 period from June to September, precipitation exhibited no significant trend. For the November–April (winter season) there was a 3% increase in precipitation from 1896 to 2024. From 2014 to 2024 winter precipitation averaged 1.68 m vs. the long-term average of 1.65 m. April 1 SWE from six long-term SNOTEL stations where April 1 SWE has a declining trend of 30% from 1946 to 2023, with a 10% decline since 1984. The April 1 SWE loss reflects increased melting of the snowpack or rain events during the winter season.This indicates that it is temperature rise that is driving the glacier mass balance loss, retreat and eventual disappearance of Ice Worm Glacier.
Washington State Division 5 -Cascade West-Temperature trends.Washington State Division 5 -Cascade West-Precipitation trends.
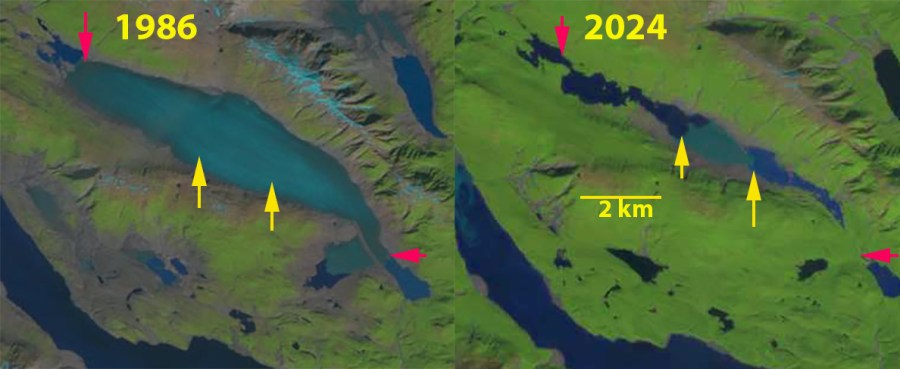
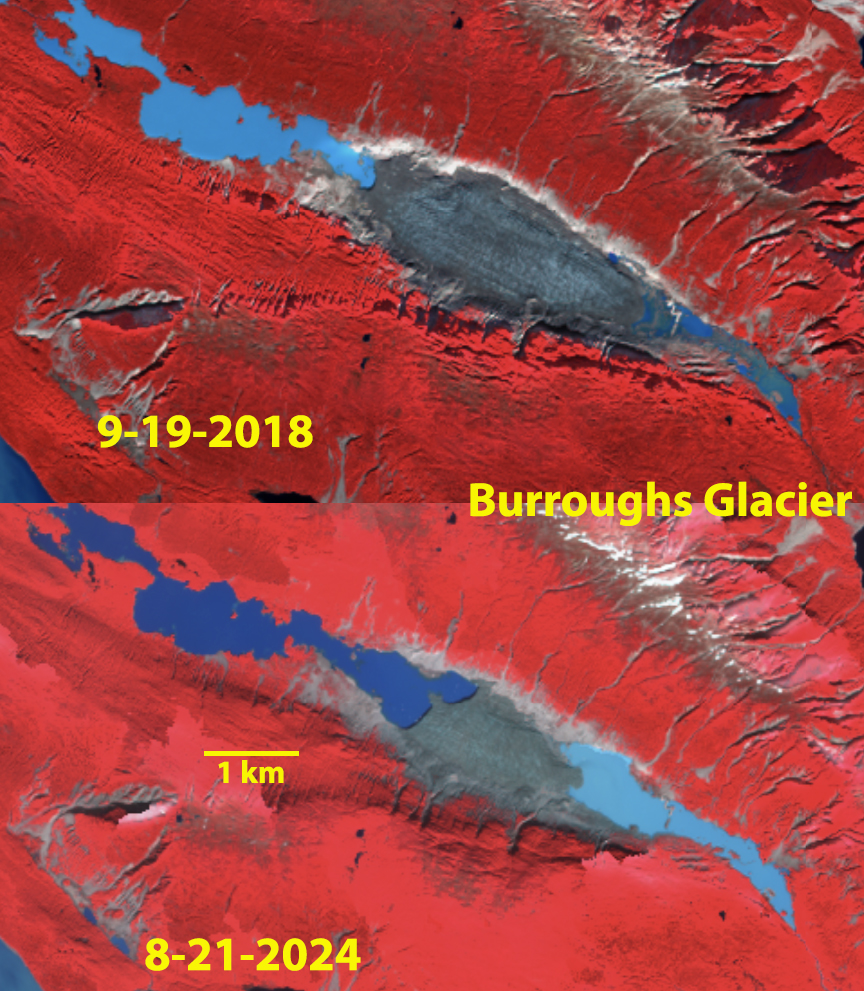
Burroughs Glacier in 1986 and 2024 Landsat images. The red arrow marks terminus in 1986 and yellow arrows the 2024 terminus. Yellow dots mark the outline of the glacier in 2022. Glacier area declined from 12.5 km² to 1.2 km² during this 38 year period.
Burroughs Glacier in Glacier Bay National Park, Alaska has been retreating since 1892 when it was part of the Muir Glacier complex. The glacier is named for naturalist John Burroughs, who accompanied John Muir to the areain 1899 on the Harriman Expedition. The glacier is unusual in that it has not had an accumulation zone this century, where snow persists through the year. Without an accumulation zone a glacier cannot survive (Pelto, 2010). Mickelson (1971) summarized the retreat of the glacier from 1892-1960. In 1892 the Burroughs ice plateau was assessed as a 10 km by 25 km ice cap. By 1960 it had thinned by as much as 750 m and its calving margin had retreated 27 km. In the 1960s crevasse extension were still active (Taylor, 1963). By the end of the 1970’s the glacier was essentially stagnant (Molnia, 2008). In 1982 I briefly visited the western terminus, which provided a still imposing slope, made more so by the rain and clouds lowering onto its surface, active crevasses were still evident indicating some movement. John Burroughs in writing the narrative of the Harriman Expedition noted about vanishing glaciers “It is dead or motionless, and is therefore free from crevasses. Its rim comes down to the gravel like a huge turtle shell and we stepped up on it without difficulty. (page 45)”.
Here we examine the glacier in Landsat imagery from 1986 to 2024to illustrate the retreat, the lack of snowcover and the thinning. In the 1948 map of Burroughs Glacier, the glacier is 12.1 km long, and much of the glacier is already stagnant, the glacier has both a north and south terminus, purple arrows.
Burroughs Glacier in 1948 USGS map. Purple arrow indicate terminus locations. Former Plateau Glacier (P).
In 1948 Burroughs Glacier has an area of 22 km² and is 12.5 km long, with the crest of the glacier at 425 m. In 1986 Burroughs Glacier has an area of 12.5 km² and has no snowcover by mid-summer. The glacier terminates in proglacial lakes at both the north and south terminus and is 9 km long, purple arrows indicate 1948 terminus. In 2004 Burroughs Glacier again lacks any snowcover. The southern terminus has retreated 2.2 km from the lake, and the northern terminus has retreated into a second lake basin. The glacier is 6.3 km long, half of its length in 1948. In 2010 snowcover is lacking and retreat has continued shrinking the glacier to 5.4 km in length. The glacier was assessed with an area of 2.9 km² and a median elevation of 313 m (1025 feet) by GLIMS, in 2010. In 2013 the glacier lacks snowcover in this September Landsat image even though snow has returned to the surrounding mountains. This indicates how far below the snowline the glacier lies. Portions of a glacier are supposed to be the first locations that receive snowcover. The terminus has continued to retreat and the glacier was 4.6 km long in 2013. The northern terminus was retreating into a third basin of the proglacial lake. By 2018 the glacier area has been reduced to 2.7 km², then 1.5 km² in 2022 and 1.2 km² in 2024., 5.5% of its area remaining from 1948, 10% of its area from 1986 and 1% of the 1892 area. The length of the glacier in 2024 is 2.3 km, only 50% of the length just a decade ago, and ~20% of the 1948 length.
Thinning of this glacier from 1948-2016 is evident from a comparison of topographic maps. Thinning in remaining glacier are averages 225 m during this period, that is a rate of ~3.3 m/year. Larsen et al (2007) had found a thinning rate of ~3 m/year for the 1948-2000 period. Satellite imagery allows identification of glacier area, which declined at a linear rate from 2004-2024, correlation coefficient of 0.98. This his linear rate indicates the glacier will disappear in 2029 or 2030.
Burroughs Glacier has not been in equilibrium with climate the past century. Its retreat has been hastened by the rising snowline of the last decade note by Pelto et al (2013) on Brady Glacier. This glacier area has declined by 90% since 1986, with volume loss being even larger. Retreat usually increases as elevation declines and as the size of the remnant ice declines. There is no debris cover or persistent snowcover to slow the loss.
Overlay of 1948 (blue labeled contours) and 2014 elevation map (brown labeled contours) for Burroughs Glacier.
Burroughs Glacier area from Landsat and Sentinel images from 2004 to 2024. This is a strongly linear decrease, that projected beyond 2024 hits bottom in 2029 or 2030.
2004 Landsat image of Burroughs Glacier. The red arrow marks the west margin in 1986 and the yellow arrow the east margin.
2010 Landsat image of Burroughs Glacier. The red arrow marks the west margin in 1986 and the yellow arrow the east margin.
2013 Landsat image of Burroughs Glacier. The purple arrows mark the 1948 margin, red arrow the west margin in 1986 and the yellow arrow the east margin in 1986, pink arrows the 2013 margin.
2022 false color Sentinel image of Burroughs Glacier. The ice is dirty but not debris covered at this point, glacier area 1.5 km2.
2018 and 2024 false color Sentinel image of Burroughs Glacier. The ice is dirty but not debris covered. Area declined from 2.7 km2 to 1.2 km2
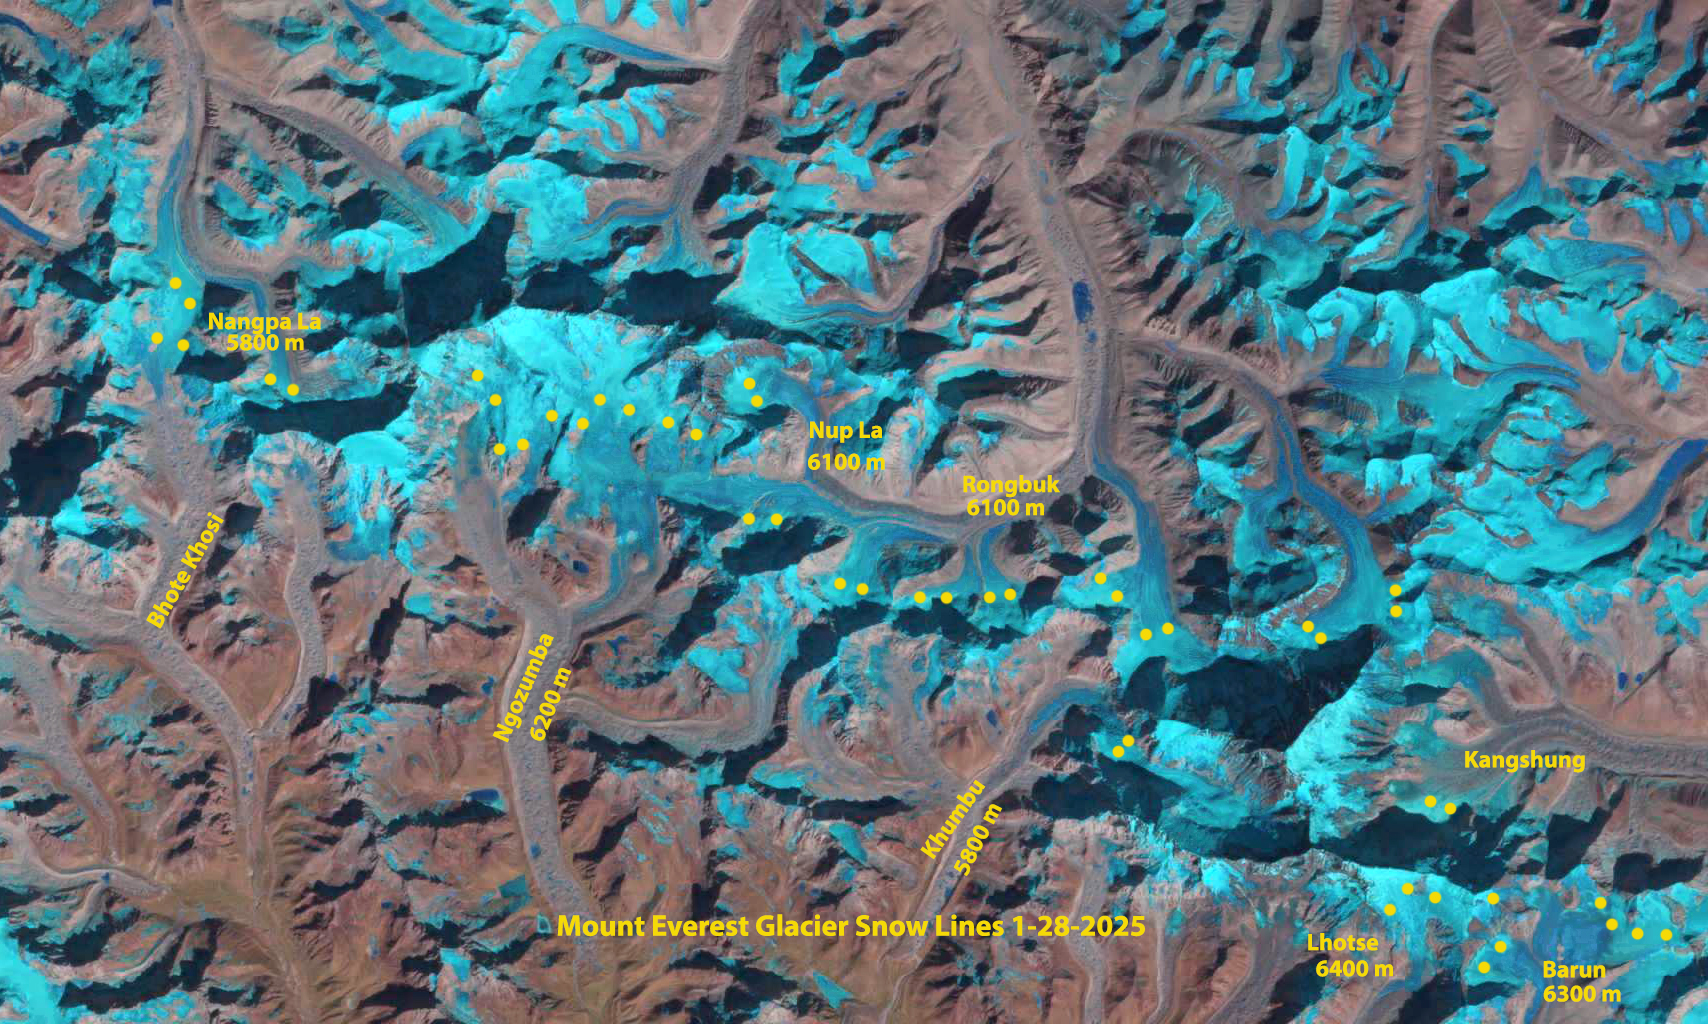
The snow line on Mount Everest Region glaciers on Jan. 28, 2025 indicated by yellow dots on the Landsat image. Note t Nup La-5900 m is snow free. The average snow line is 6100 m, 150 m higher than on Dec. 11, 2024.
This is a update to a previous post examining persistent high snow lines through the winter on Mount Everest Region glaciers. Here we examine imagery from October 2023 through early January 2025 illustrating the rise in snow line through January in both 2024 and 2025. The persistent high snow line during winter indicate a lack of snow accumulation during the winter season. This is a dry season in the Himalayan region, yet typically an extensive snow cover develops, though not particularly deep. A combination of warmer and drier conditions have been more prevalent in recent winters including 2021, 2023, 2024 and 2025 (Kathmandu Post, 2025). These conditions are driving both reduced snow cover, higher elevation snow lines and increased forest fires (Nepali Times, 2025).
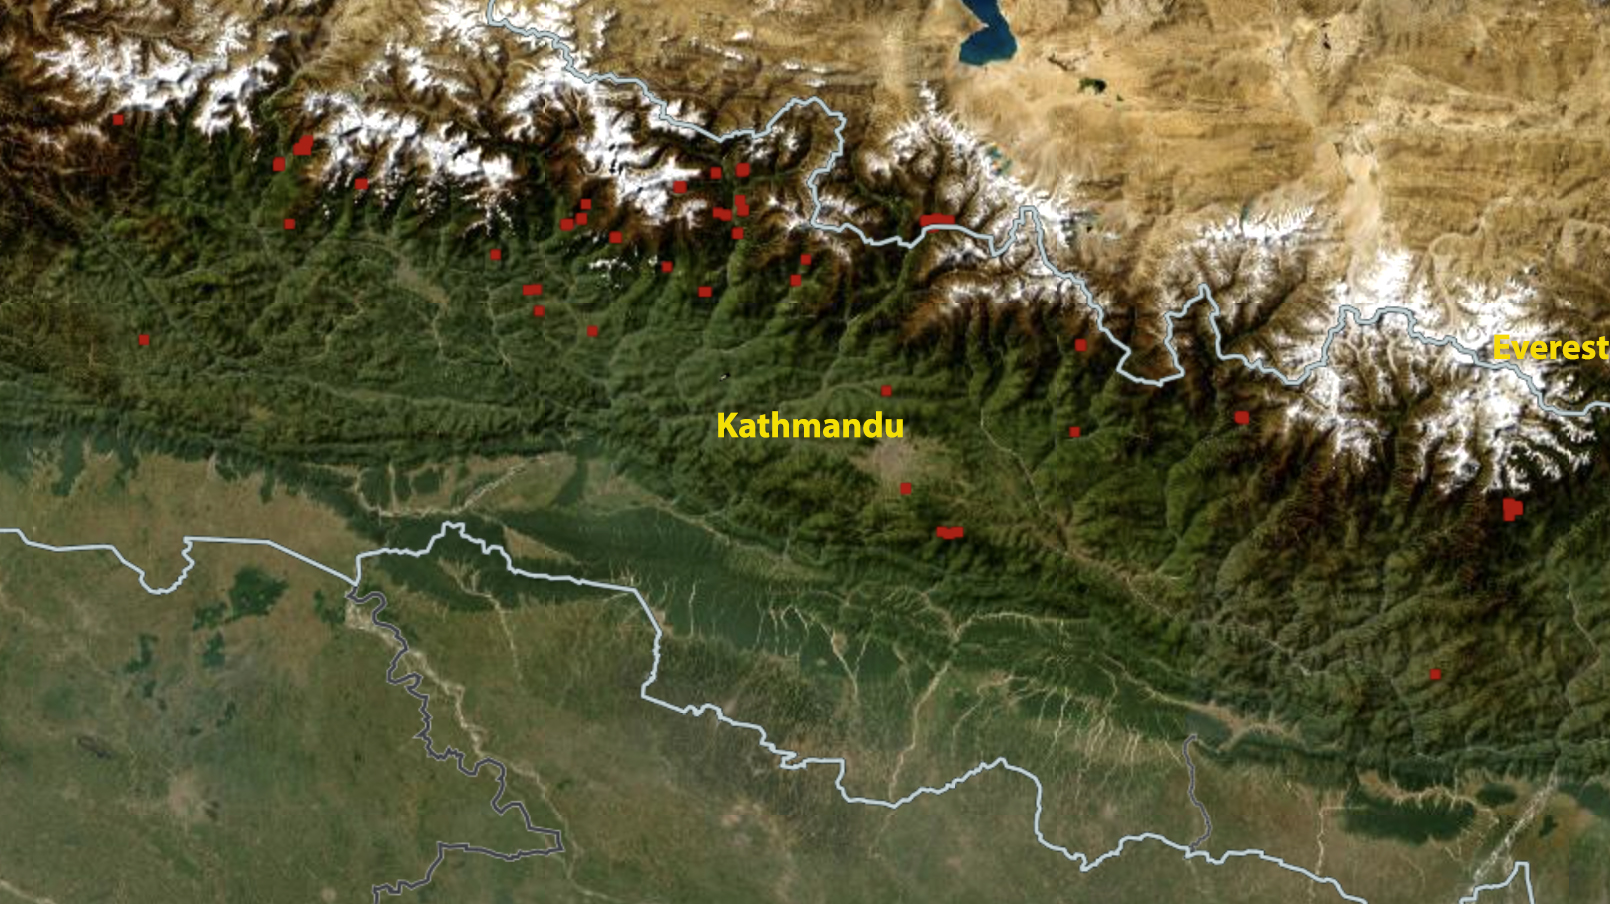
NASA FIRMS view of fire locations in Nepal on Jan. 23, 2025, each red dot is a fire, note most are at higher elevations including several near the Everest region.
There have been a few small snow events early in each winter, but the snow cover does not persist indicating that ablation has continued even above 6000 m on Mount Everest. Snow cover loss during winter at these altitudes is primarily the result of sublimation , with losses observed up to 2.5 mm per day (Tenzing et al 2023).
The 2024 winter season was different than the high snow lines in 2020/21 that resulted from extraordinary January heat wave, as there was not a noteworthy heat wave (Pelto et al 2021). Instead a lack of any significant precpipitation was critical with less than 25 mm of precipitation at Everest Base Camp from Jan.1-March 31, 2024 and above normal temperatures for significant periods. The high glacier snow lines persisted into the monsoon season of 2024. The post-monsoon season in 2024 was warm and wet, leading to above average snow line elevations in November 2024.
In December 2024, Nepal was 20-25% of normal with drier conditions in the east. This accompanied above average temperatures, though not as high as in December 2023, leading to extreme drought in several provinces including Koshi Province (Nepal DHM). January, 2025 has continued to be dry, with consistently warm conditions. This has enabled high glacier snow lines to persist and rise from early December into early February, 2025.
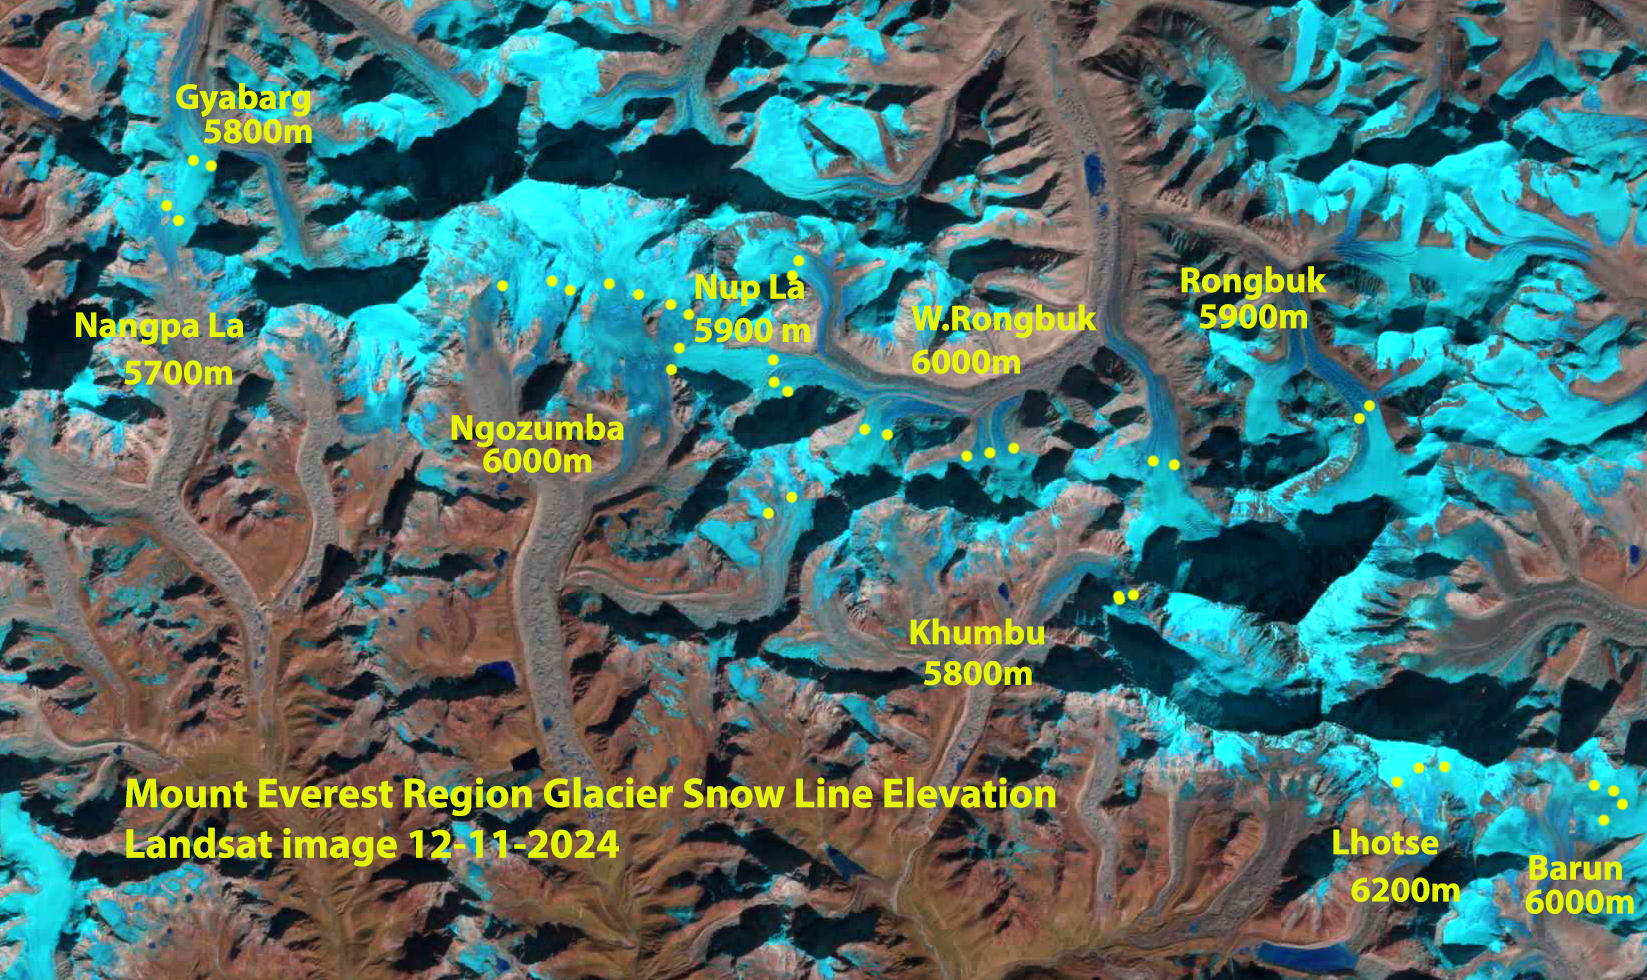
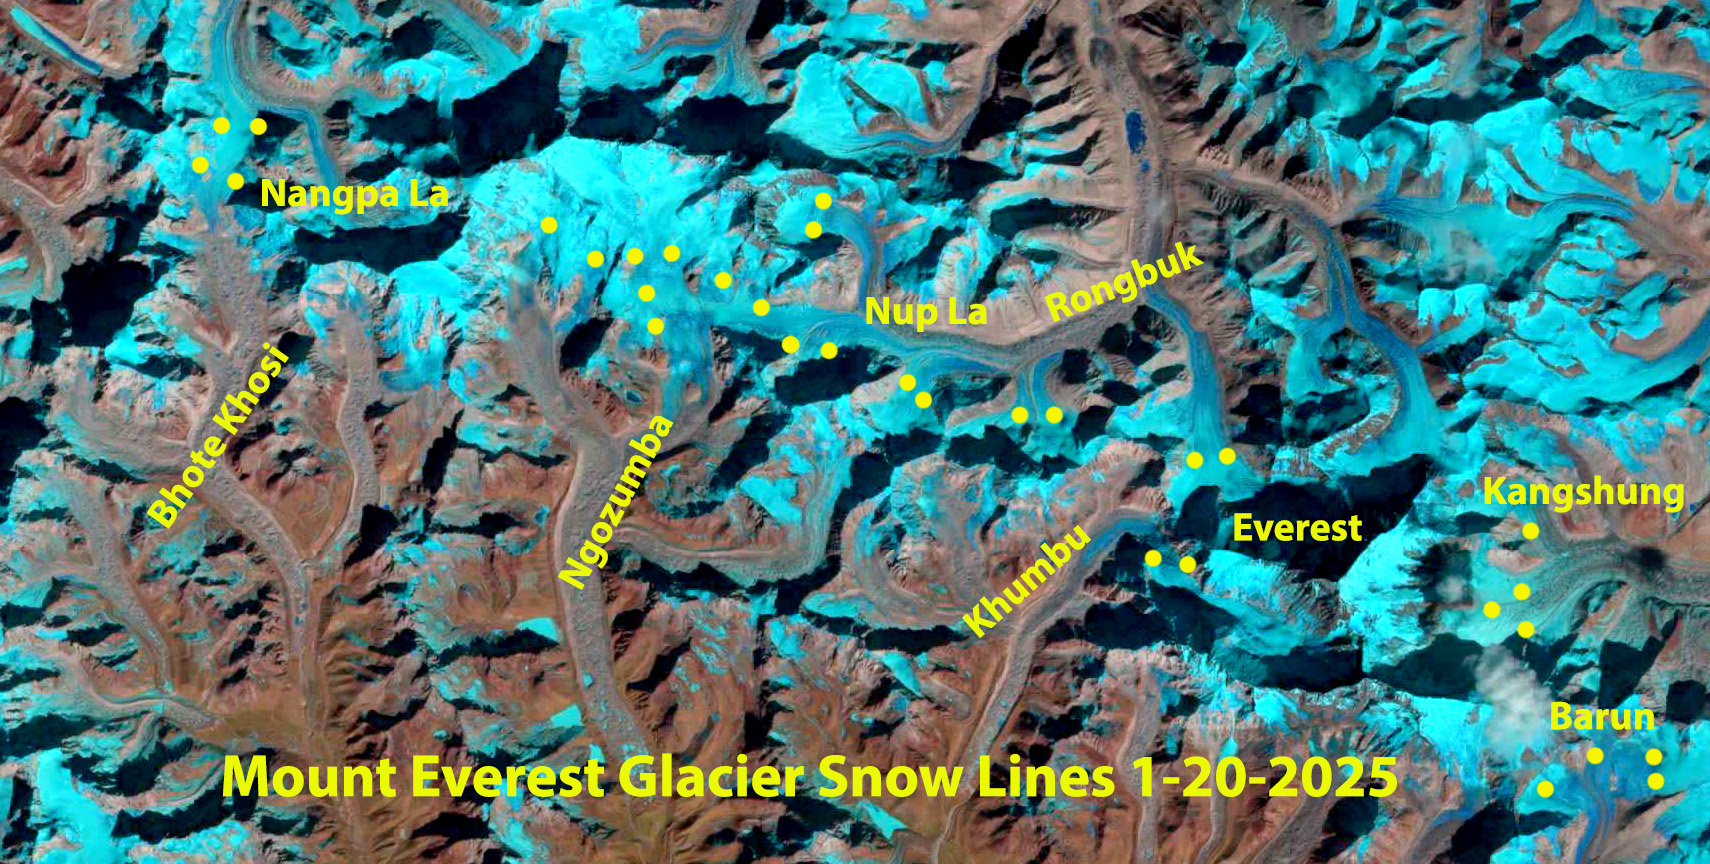
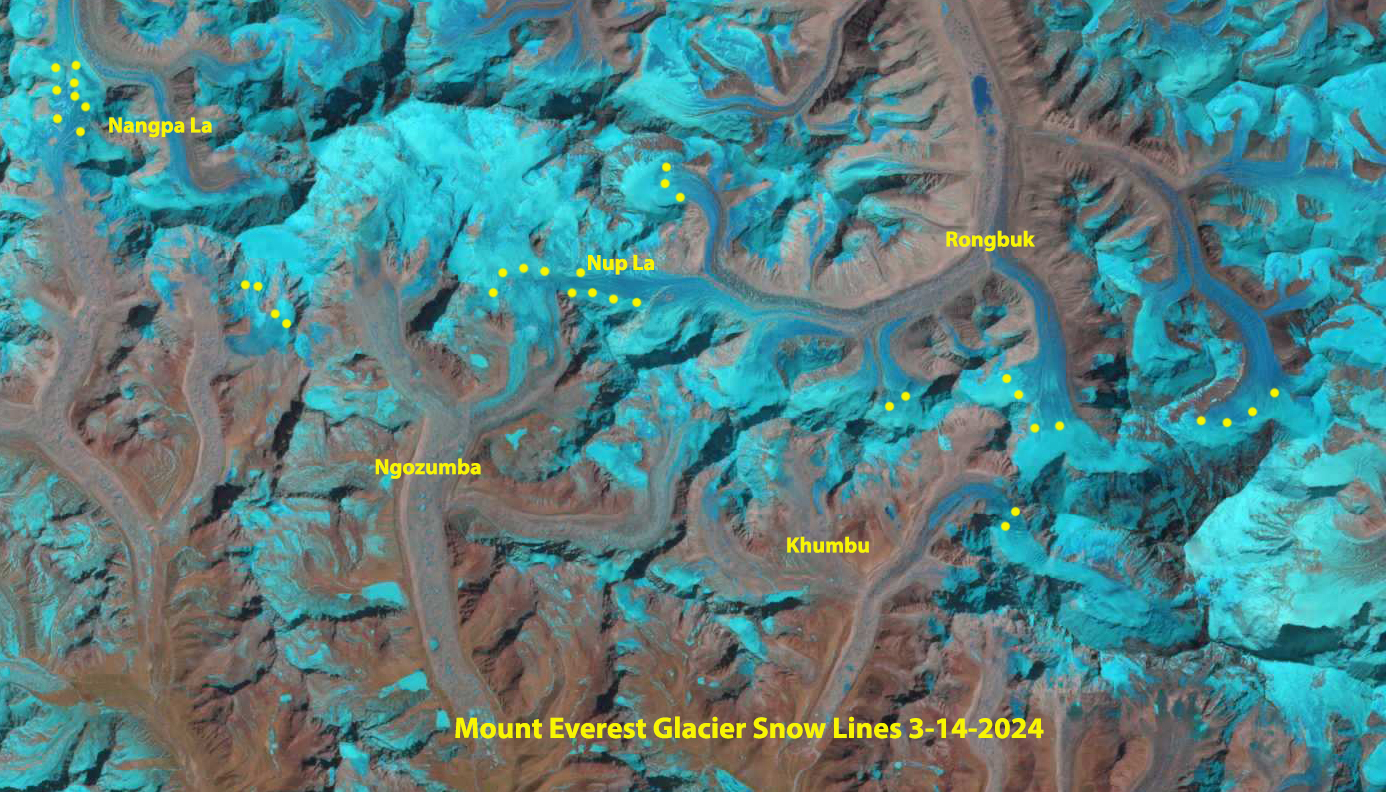
The snow line on Mount Everest Region glaciers on Dec. 11, 2024 indicated by yellow dots on the Landsat image. Note that Nangpa La and Nup La-two high passes (5800-5900 m) are snow covered. The average snow line is 5950 m.The snow line on Mount Everest Region glaciers on Jan. 20, 2025 indicated by yellow dots on the Landsat image. Note that Nangpa La and Nup La-two high passes (5800-5900 m) both have a narrow band of snow cover. The average snow line is 6050 m.The snow line on Mount Everest Region glaciers on May 1, 2024 indicated by yellow dots on the Landsat image. Note that Nangpa La and Nup La-two high passes (5800-5900 m) are both snow free. The average snow line is 6050 m.The snow line on Mount Everest Region glaciers on March 14, 2024 indicated by yellow dots on the Landsat image. Note that Nangpa La and Nup La-two high passes (5800-5900 m) are both snow free. The average snow line is 5950 m.
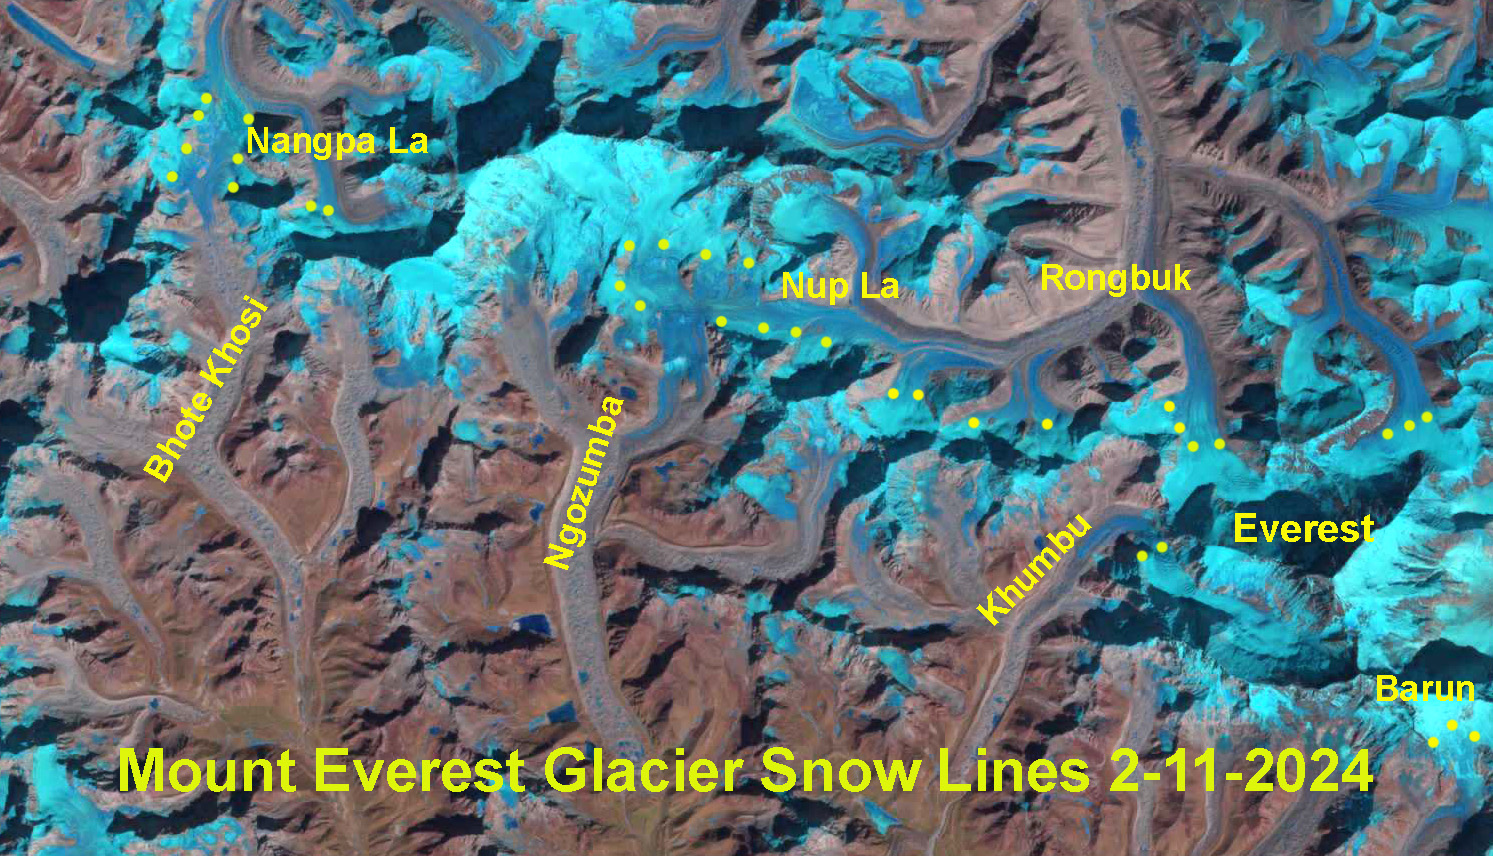
The snow line on Mount Everest Region glaciers on Feb. 11, 2024 indicated by yellow dots on the Landsat image. Note that Nangpa La and Nup La-two high passes (5800-5900 m) are both snow free. The average snow line is 6000 m.
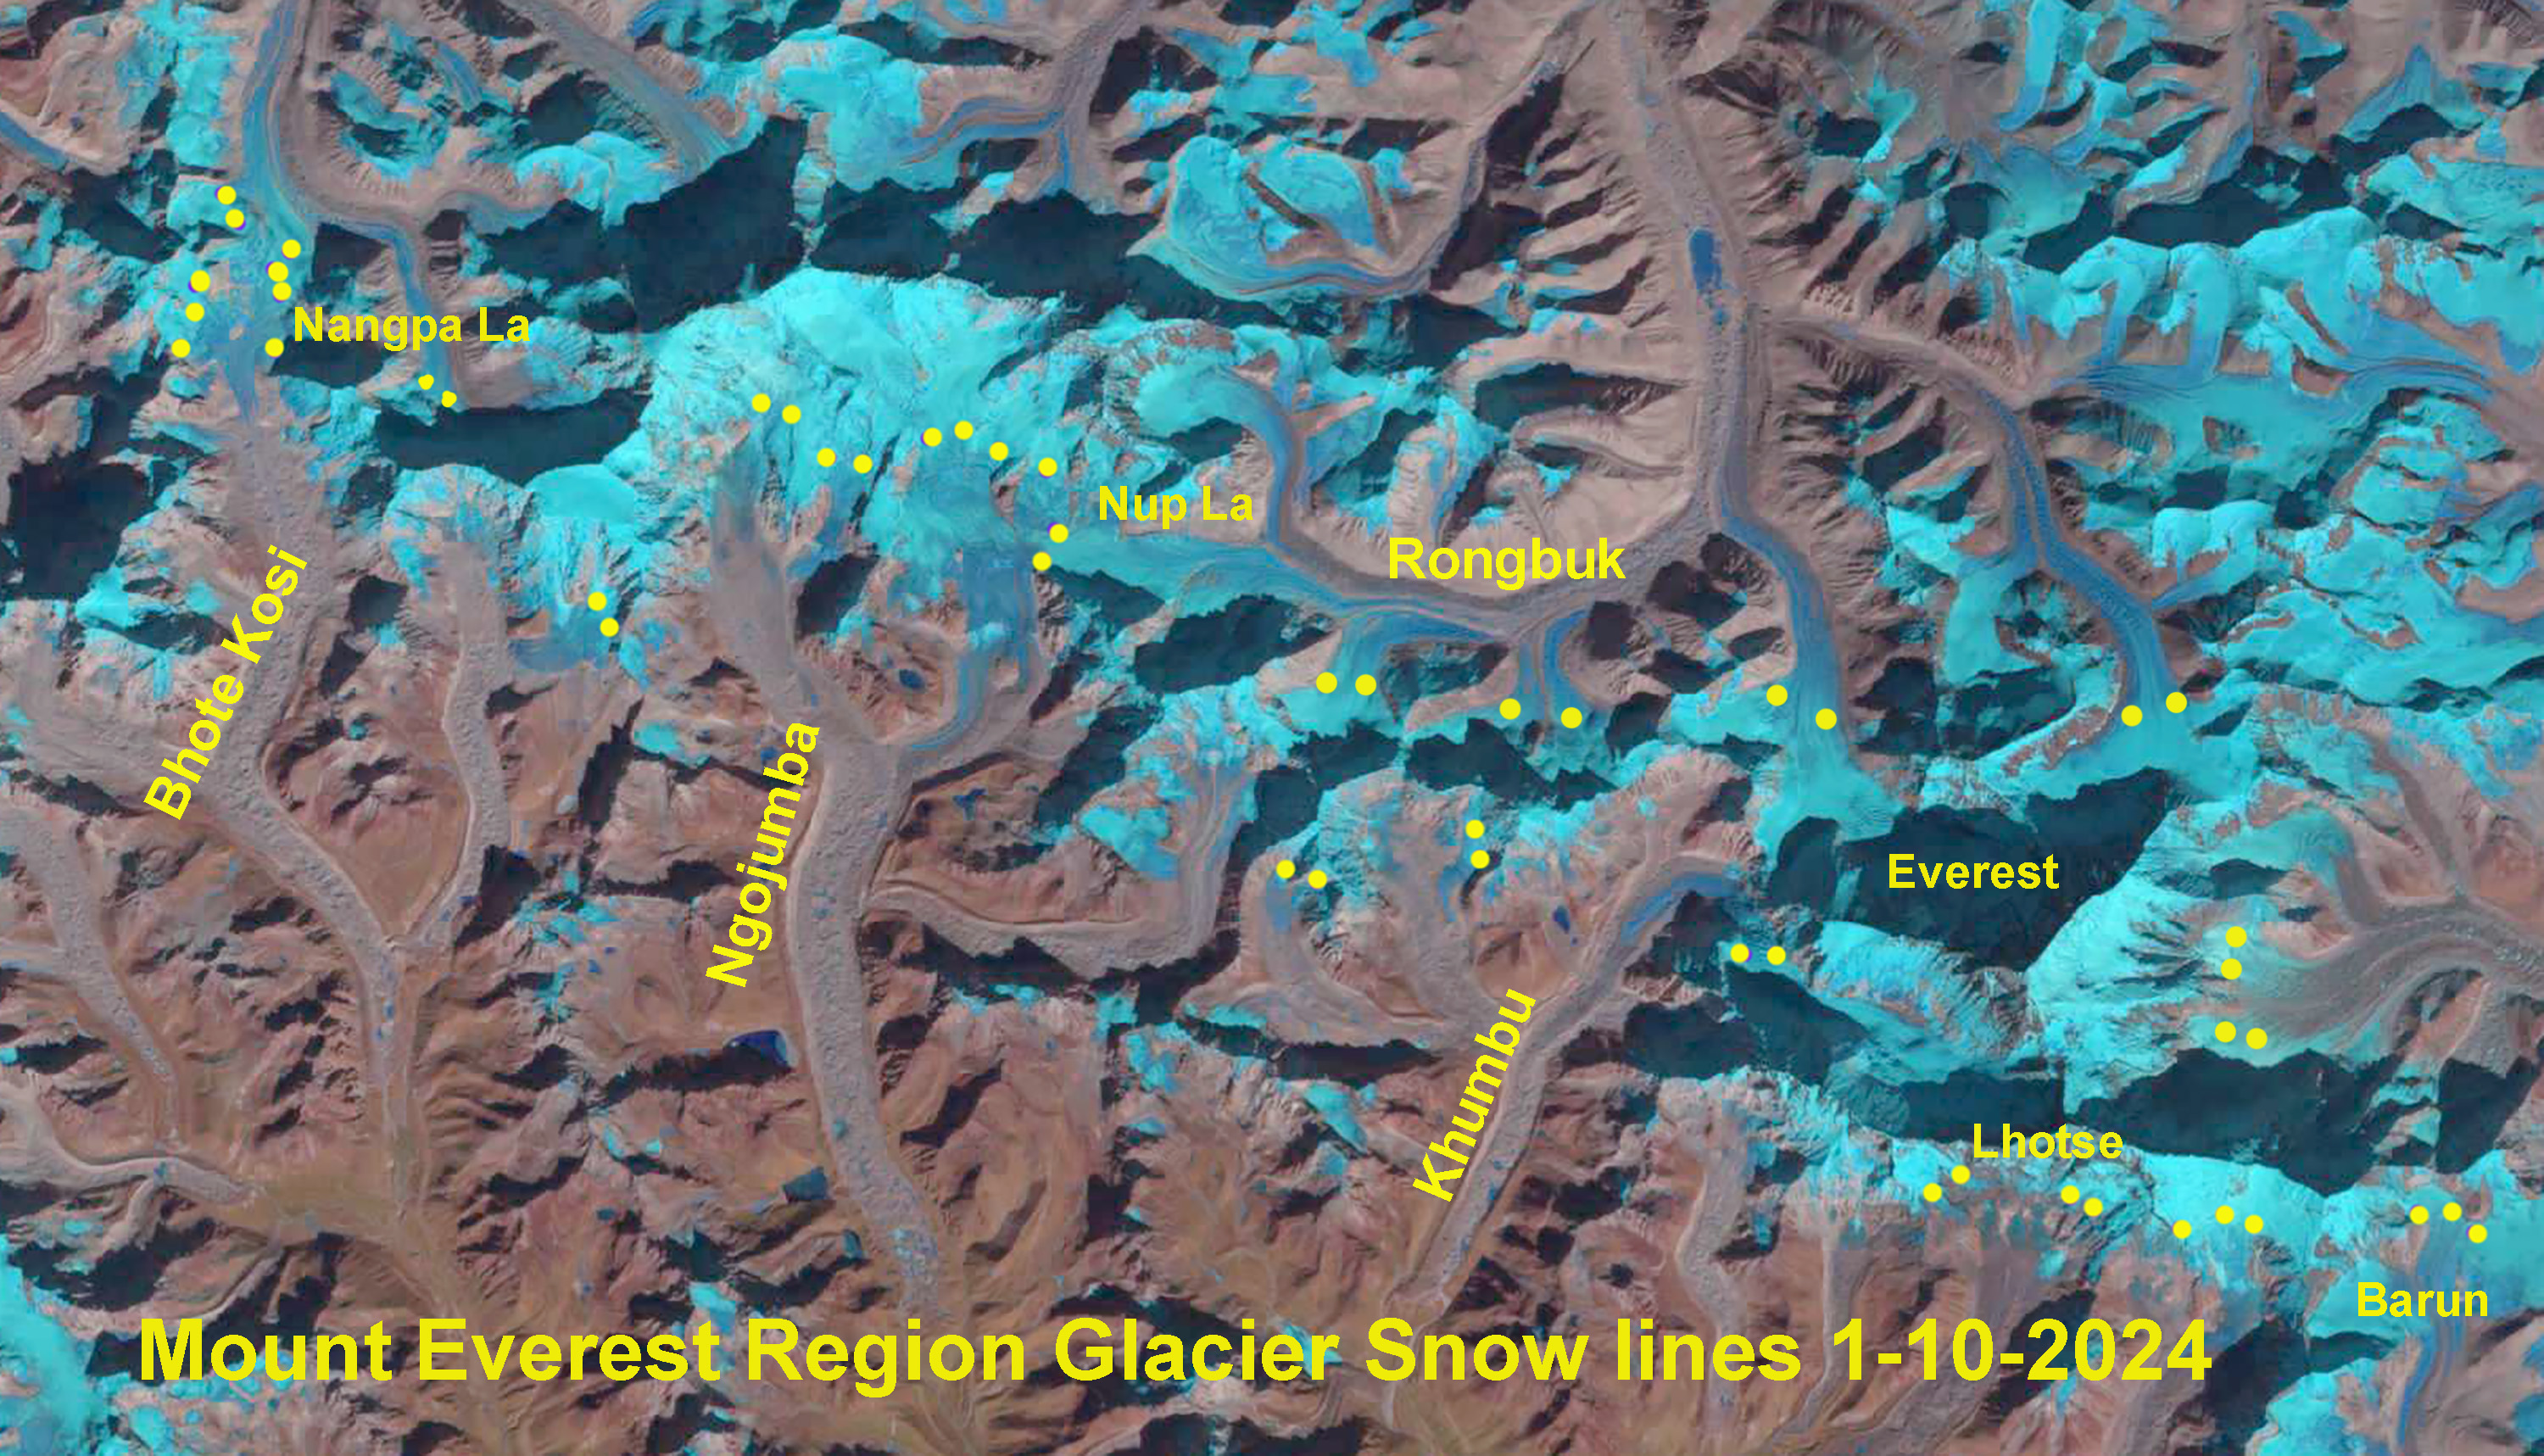
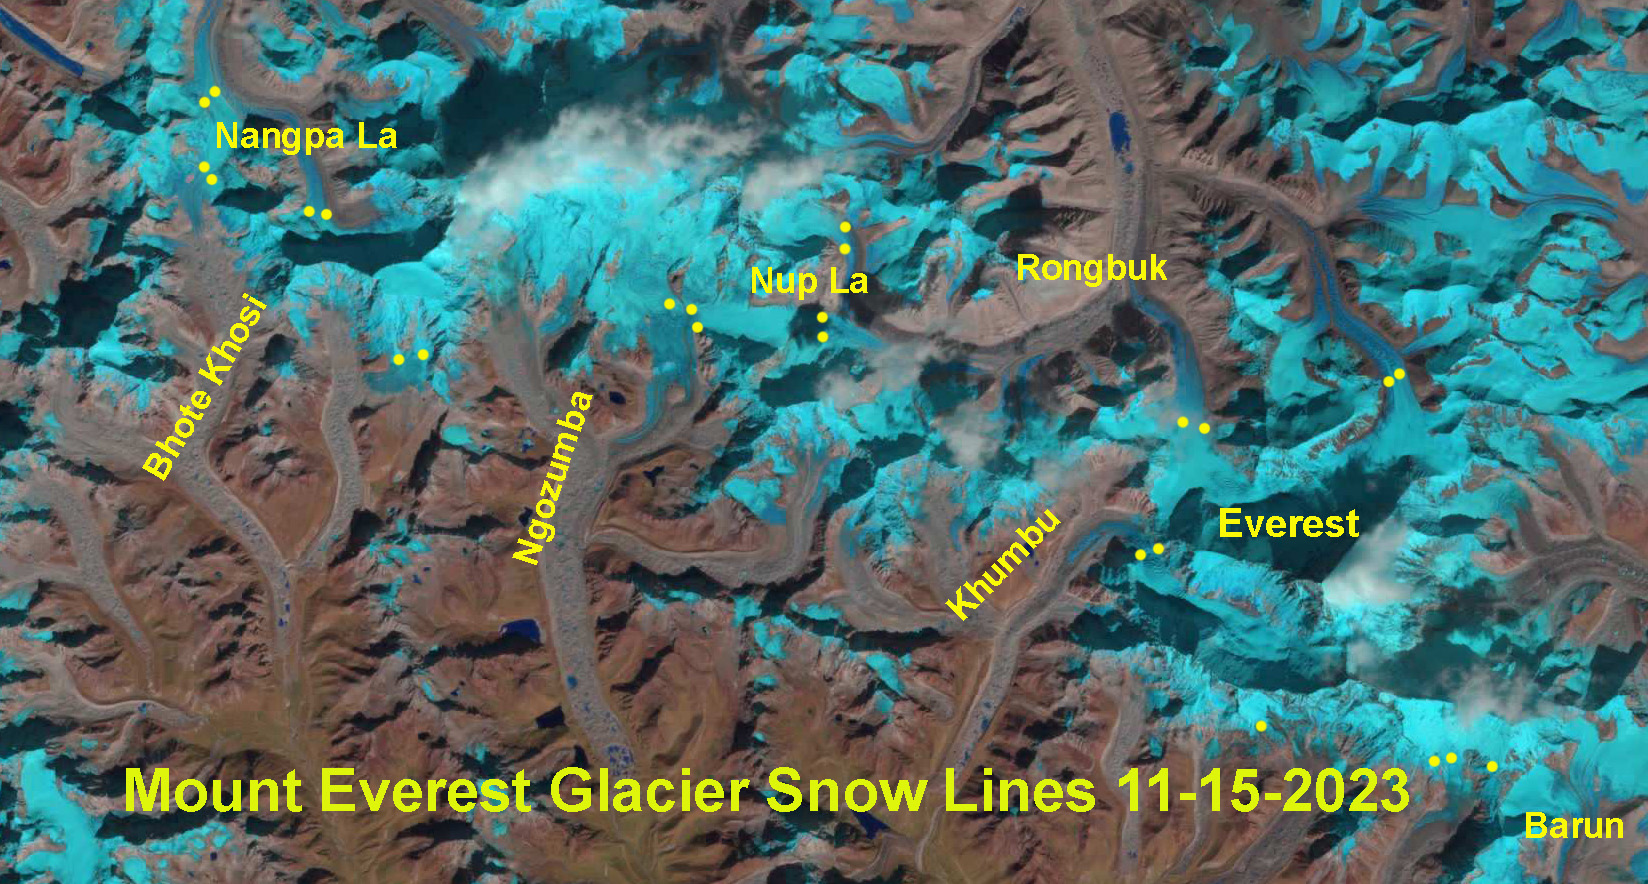
The snow line on Mount Everest Region glaciers on Jan. 10, 2024 indicated by yellow dots on the Landsat image. Note that Nangpa La and Nup La-two high passes are both snow free. The average snow line is 6000 mThe snow line on Mount Everest Region glaciers on Nov. 15, 2023 indicated by yellow dots on the Landsat image. Note that Nangpa La and Nup La-two high passes are both snow covered. The average snow line is 5800 m.The snow line on Mount Everest Region glaciers on Oct. 30, 2023 indicated by yellow dots on the Landsat image. Note that Nangpa La and Nup La-two high passes are both snow covered. The average snow line is 5700 m.
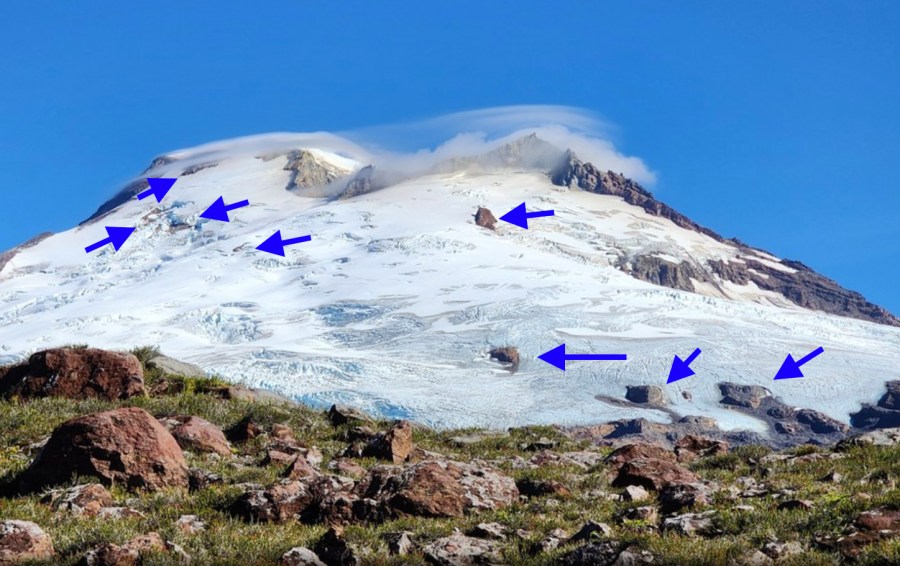
Recent glacier thinning due primarily to warm summers has exposed new bedrock knobs on upper portions of Deming, Easton and Squak Glacier on Mounty Baker, Washington
Find a location where temperatures are cold for at least 7 months of the year. This location also needs to have substantial snowfall and ideally where addtiional snow is added via avalanches or wind depostion. With these ingredients on hand, let stand for a few decades, while the snow accumulates to a thickness of at least 20 m. A key step in the recipe is the transformation of snow to ice under its own weight and with some meltwater percoloation and refreezing. Unlike bread dough you do not need stir or kneed during this period. Once there is a volume . For the glacier to persist the glacier must retain accumulation across a significant portion of its surface by the end of summer. To maintain its size we have observed this percentage to vary from 50-70% on North Cascade glaciers. The lack of a persistent accumulation zone will lead to loss of that glacier. of 500,000 m3 you are either a glacier or at the threshold of being a glacier depending on how steep the underlying slope is. Unlike rolling out a pie crust, this does not need to be an even thickness, or made on a flat surface. As the glacier matures it will develop crevasses indicating movement, which is an essential characteristic of a glacier. It is not a passive feature, its movement allows it to begin to sculpt its landscape.
Current Glacier Loss in North Cascade Range, Washington
Many centuries or millenia later, the glacier has become a critical part of the landscape. Yet, changing climate is leading to the loss of many. In the North Cascades glaciers have been losing close to 1% of their volume annually over the last 40 years, with the rate rising to over 2% in the last decade. The glaciers cover 200 km2 almost all of which are in steep high elevation Wilderness areas not proximate to roads. In 2010 we noted that 2/3 of North Cascade glaciers could not survive current climate. Today this percentage has increased to more than 90%. There are 31 glaciers in the range that I completed observations on in the 1980s that are now gone. Our annual field expedition has noted the glaciers losing ~1.5 m of thickness annually in the last decade.
Deglaciated area below Easton Glacier, Mount Baker, WA in 2023.
Are there any Preservatives we can add to the Recipe?
What would it take to preserve the Easton Glacier in the North Cascades?
The largest snowmaking operation in North America is at Killington Ski Area, VT. At maximum capacity they can convert 35,000 m3 of water into snow per day. Given that Easton Glacier has an area of 2.5 km2 and has been losing 1.5 m water equivalent thickness per year, 3.75 million m3 of water equivalent snow has to be produced.This would take 108 days at maximum capacity of the more than 2000 snow guns. This ignores enviornmental laws and the logistics of water supply, piping, snow gun placement and electricity. This all in an environment of harsh weather with avalanches and crevasses.
To cover the glacier with geotextiles during the summer, requires 2.5 million square meter of material that would be to installed each summer and removed each winter to allow accumulation, of course summer recreation would not be practical on the glacier. The geotextiles do not last long in these conditions and cost ~$2 per square meter. How to anchor these in place and connect on a crevasse glacier would be very difficult, which is why usually only a portion of the glacier near the terminus is covered, which does not help the overall situation of glacier loss.
There are many more glaciers in this range and around the world where this same confounding logistical challenges make any artificial attempts at preservation ridiculous beyond a few isolated glaciers that are already close to existing infrastructure.
When I began this work in 1984 solar power and wind power did not exist, these are not the only renewable sources of power, and just one of many approaches to reducing CO2 emissions, but they are illustrative of rapid growth from insignificance. The Renewalbes 2014 Global Status Report and the Renewables 2024 Global Status Reports provides measures of renewaable energy production over the last decade. Global capacity for Solar Photovoltaic energy production has risen from 4 GW in 2004 to 190 GW in 2014 and then to 1600 GW in 2023. Global Capacity for Windpower has risen from 48 GW in 2004 to 370 GW in 2014 and in 2023 was 1020 GW. In 2023 alone over 500 GW was added to these two sources combined. See below for charts from this report on increased capacity. This is a preservative under development that can work with continued emphasis and in concert with other items such power grid infrastructure improvement and electric/hybrid automobile manufacturing expansion.
Steffen Glacier calved off the Z group of icebergs at start of December following on a March prodution of X and Y bergs and a December-February 2023/24 breakoff of A,B,C. The Z icebergs have an area of 3 km2, false color Sentinel image.
Steffen Glacier is the largest south flowing outlet of the 4000 km2 Northern Patagonia Icefield (NPI). On December Dec. 6, 2023 the terminus tongue has a narrow unsupported section that appears poised to calve (C). By Dec. 26, 2023 the glacier has calved berg C (0.4km2 ), joining other large bergs remaining from previous years D, E and F. Two more pieces A and B appear poised to calve. By Feb. 9 2024 berg B had calved, and by Feb. 24 berg A had calved, together they are 0.3 km2. On April 14 two more large bergs X and Y have calved from the terminus. Berg X is the largest of the year at 0.6 km2, berg Y is 0.2 km2 . Terminus retreat from Dec. 2023-April 2024 is 1.5 km. In noted in April that the terminus tongue was narrow and unsupported (Pelto, 2024) , indicating that more large icebergs should be expected in the 2025 summer season, and in December this happened releasing several icebergs Z1, Z2 and Z3 with a combined area of 3 km2 The glacier retreated 2.6 km as a result of this calving event.
Steffen Glacier in 2024 False Color Sentinel images illustrating calving events yielding bergs A,B,X and Y that have a combined area of 1.5 km2.Green arrow is Dec. 2023 terminus and yellow arrow April 2024 terminus. Exploradores terminus area on east side collapsing in 2023 and 2024, yellow dots indicate glacier edge, with a melange of bergs beyondin this false color Sentinel image.
Exploradores Glacier is an northern outlet glacier of the Northern Patagonia Icefield. In 2016 Exploradores Glacier had a 12 km2 terminus lobe with a couple of small proglacial lakes with a total area of ~1 km2. The terminus lobe of the Exploradores Glacier is now collapsing, this is a process that has already occurred at Steffen Glacier, San Quintin Glacier and Colonia Glacier. The terminus lobe is relatively stagnant as indicated by the minimal surface slope. The result will be a new substantial proglacial lake. In 2023 and 2024 an active zone of calving has developed on the east side of the terminus, yellow dots, with an area of 2.1 km2. This appears ready to continue expanding west across the glacier tongue expanding this embayment.
Reichert Glacier in false color Sentinel images illustrationg retreat in 2024 to yellow arrows from pink arrows due to calving that also generated many small icebergs.
Reichert Glacier is an outlet glacier of the Northern Patagonia Icefied that retreated 6.7 km from 1987-2015. Then was nearly stationary to 2023, with a 750 m retreat from 2022 to 2024 and an active calving period spring 2024 note new icebergs in the lake. The terminus is retreating into a narrower fjord reach,, with a pinch point 1.5 km behind the terminus, that should provide short term stability.
Mount Everest Region, Nepal glacier snow lines on Sentinel image from 11-12-2024. Mean elevation of snow lines is 5800 m.
As the post-monsoon period progresses, glacier snow lines have been rising in the Himalaya. Will this be similar to last year and in 2020/21 when the snow line on many glaciers remained high right through much of the winter? Here we examine Sentinel 2 imagery from Kanchenjunga Glacier on the eastern border of Nepal to the Gangotri Glacier in Uttarakhand, India. In November snow lines are averaging from 5500 m to 6000 m (yellow dots are snowline). In each location there is clear upward shift of the snow line since the beginning of October, 2024.
The rising snow lines indicate significant ablation is occurring at least up to that point. There has been a trend in the last decade where ablation conditions are extending into the winter season most years (Pelto et al 2022). Will the winter 2024/25 follow this trend?.
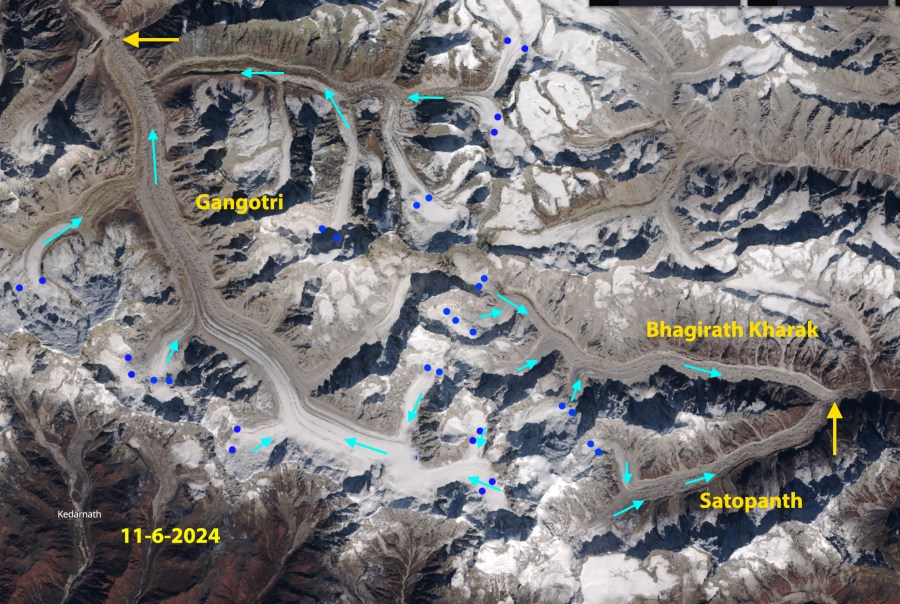
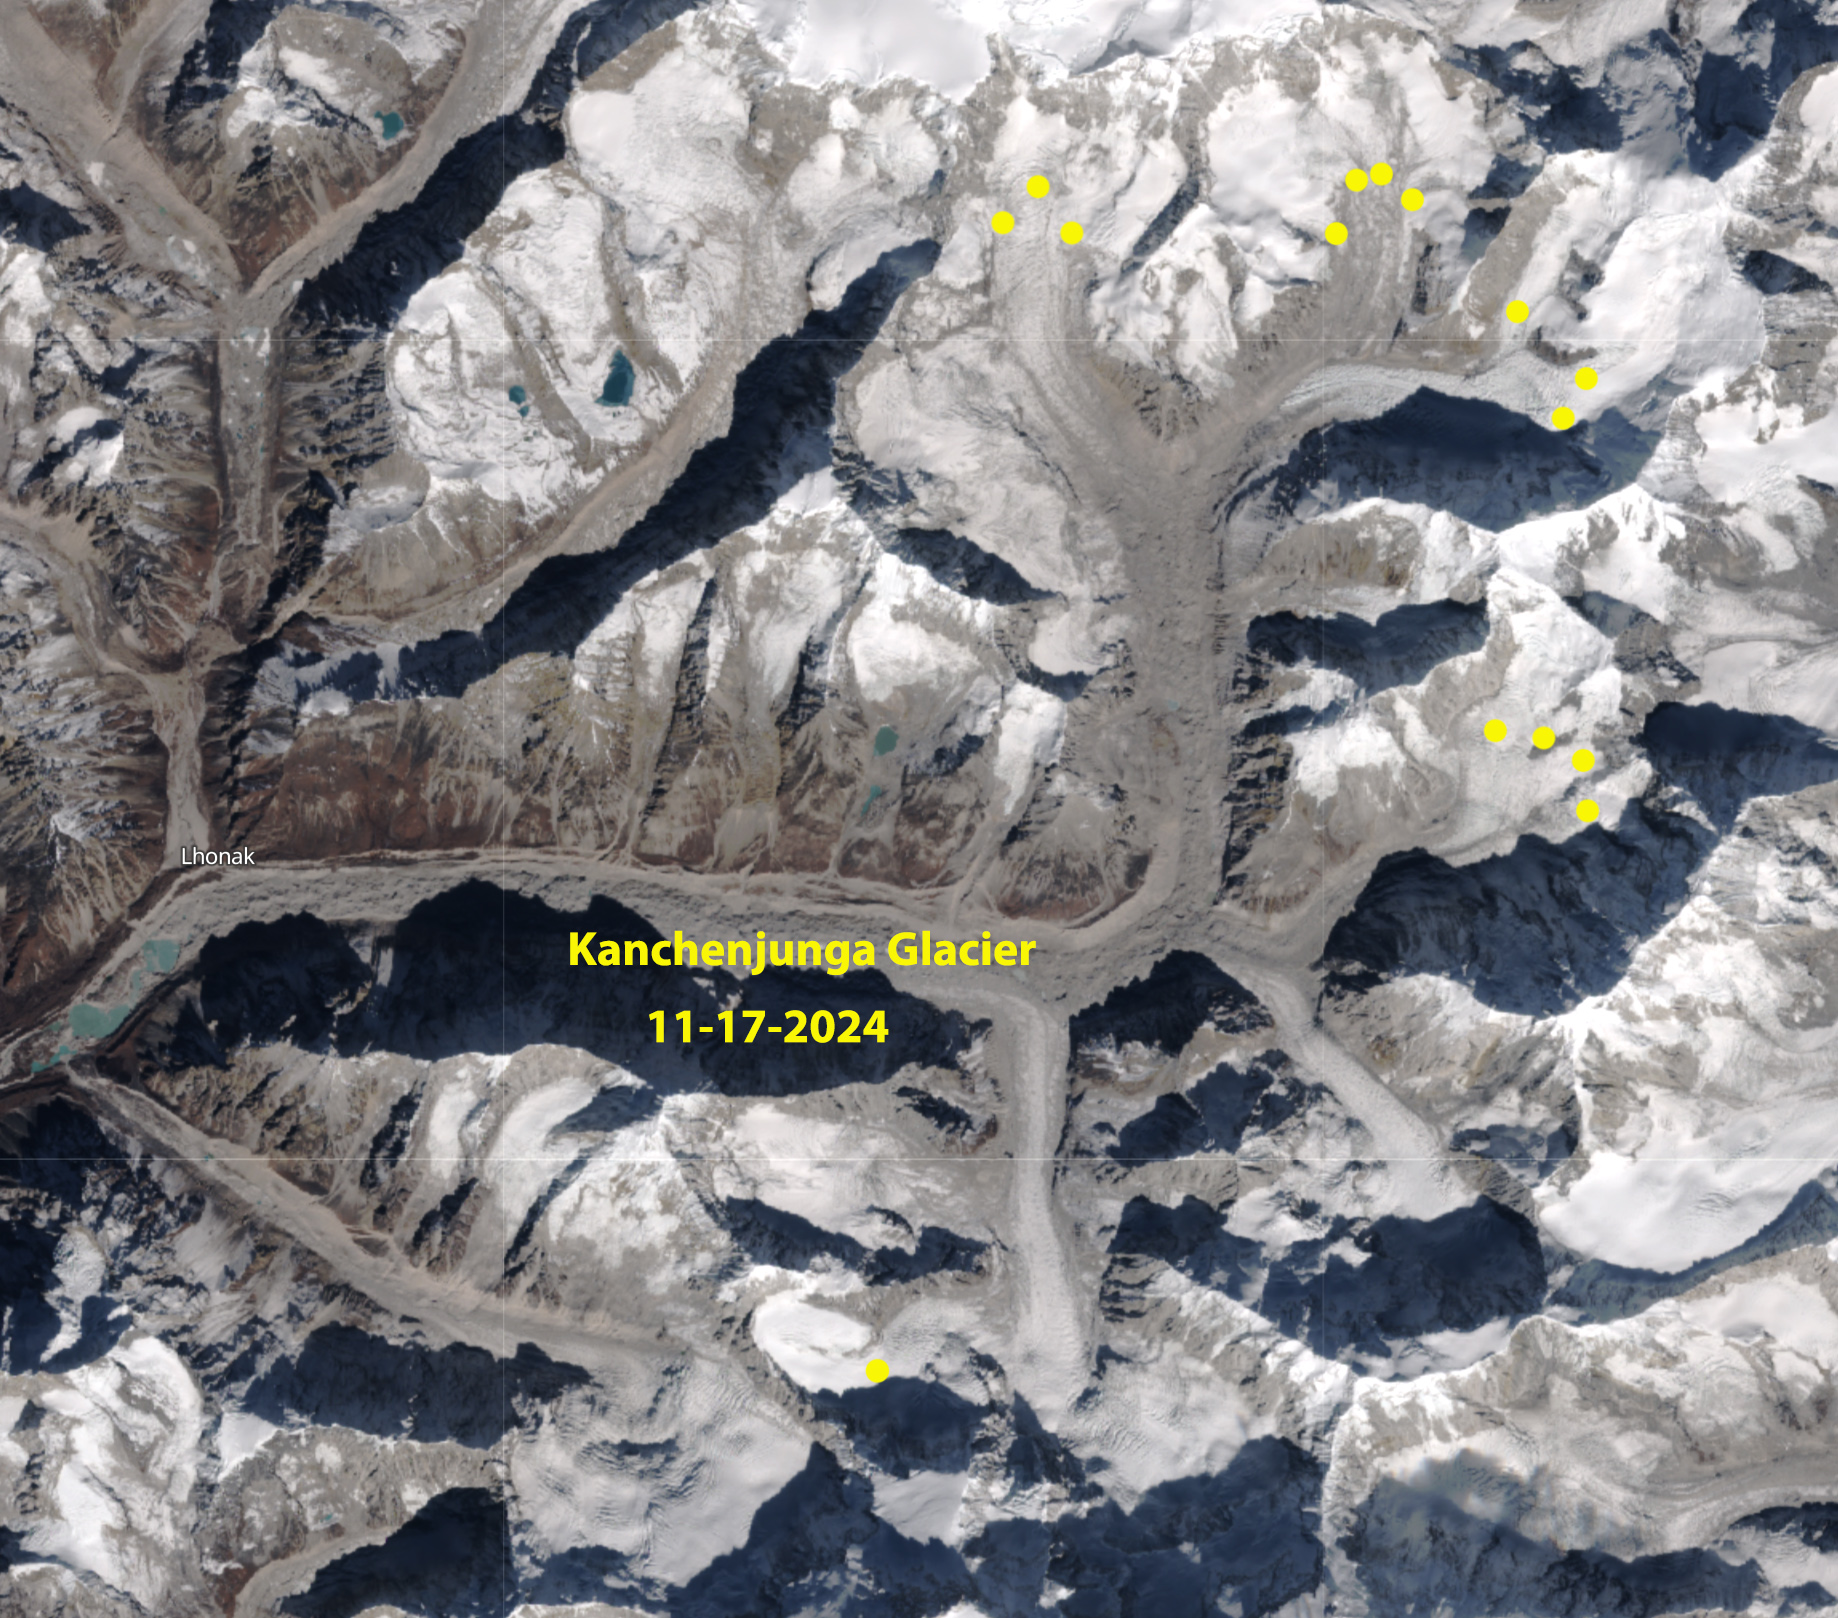
Kanchenjunga Glacier with the November 17, 2024 snow line averaging 6000 m.Langtang Glacier, Nepal with the snow line on November, 17 2024 averaging 5500 m.Gangotri, Satopanth and Bhagirath Kharak Glacier snow line on Sentinel 2 image from 11-06-2024. Mean elevation is 5500 m.
Yakutat, Alsek and Grand Plateau Glacier retreat from 1984 to 2024 has led to the three lakes expanding from 130 km2 to 240 km2 as illustrated by this pair of Landsat images. Fastest lake expansion in the nation in this period.
Three adjacent glaciers terminating on the coastal plain near Yakutat, Alaska have had a spectacular retreat in the last 40 years leading to rapid lake growth; Yakutat Glacier, Alsek Glacier and Grand Plateau Glacier. This is the story of the most rapid area of lake growth in the United States this century.
Alsek Glacier descends from the Fairweather Range terminating in Alsek Lake on the coastal plain. In the early part of the 20th century the glacier terminated at Gateway Knob (G) near the outlet of Alsek River from Alsek Lake, with just a small fringing lake present (Molnia, 2005). At that time it had a joint terminus with Grand Plateau Glacier. In 1960 the glacier had a single terminus downstream of an unnamed island in Alsek Lake, that Austin Post (USGS Glaciologisst) told me reminded him of a boats prow. This “Prow Knob” (P) much like Gateway Knob a century ago stabilized the terminus (Pelto, 2017). The glacier retreated 5-6 km by 1984 from Gateway Knob with the lake growing to an area of 45 km2. From 1984-2024 the retreat has been: 5.3 km for the northern terminus, 5.5 km for the southern terminus and 7.8 km for the northern arm of Grand Plateau Glacier. Alsek Lake has grown from 45 km2 to 75 km2 since 1984. In Octobrer 2024 there remains a narrow connection to Prow Knob that will not survive another year.
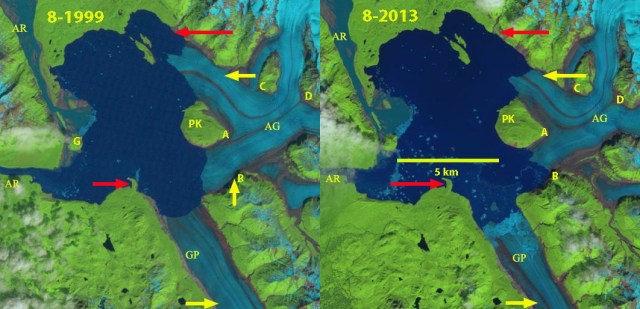
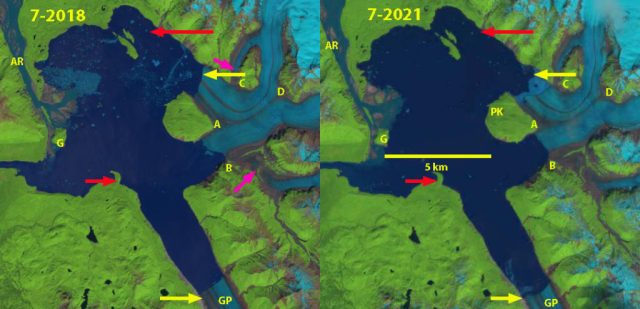
Alsek Glacier retreat from 1999-2013 in Landsat images. Red arrows mark the 1984 terminus location, yellow arrows the 2022 terminus location, AR=Alsek River, GP=Grand Plateau, PK=Prow Knob, G=Gateway Knob, A=glacier junction, B=tributary separation, C=tributary separation, D=tributary confluence.
Alsek Glacier retreat from 2018-2021 in Landsat images. Red arrows mark the 1984 terminus location, yellow arrows the 2022 terminus location, pink arrows indicate tributary separation, AR=Alsek River, GP=Grand Plateau, PK=Prow Knob, G=Gateway Knob, A=glacier junction, B=tributary separation, C=tributary separation, D=tributary confluence.
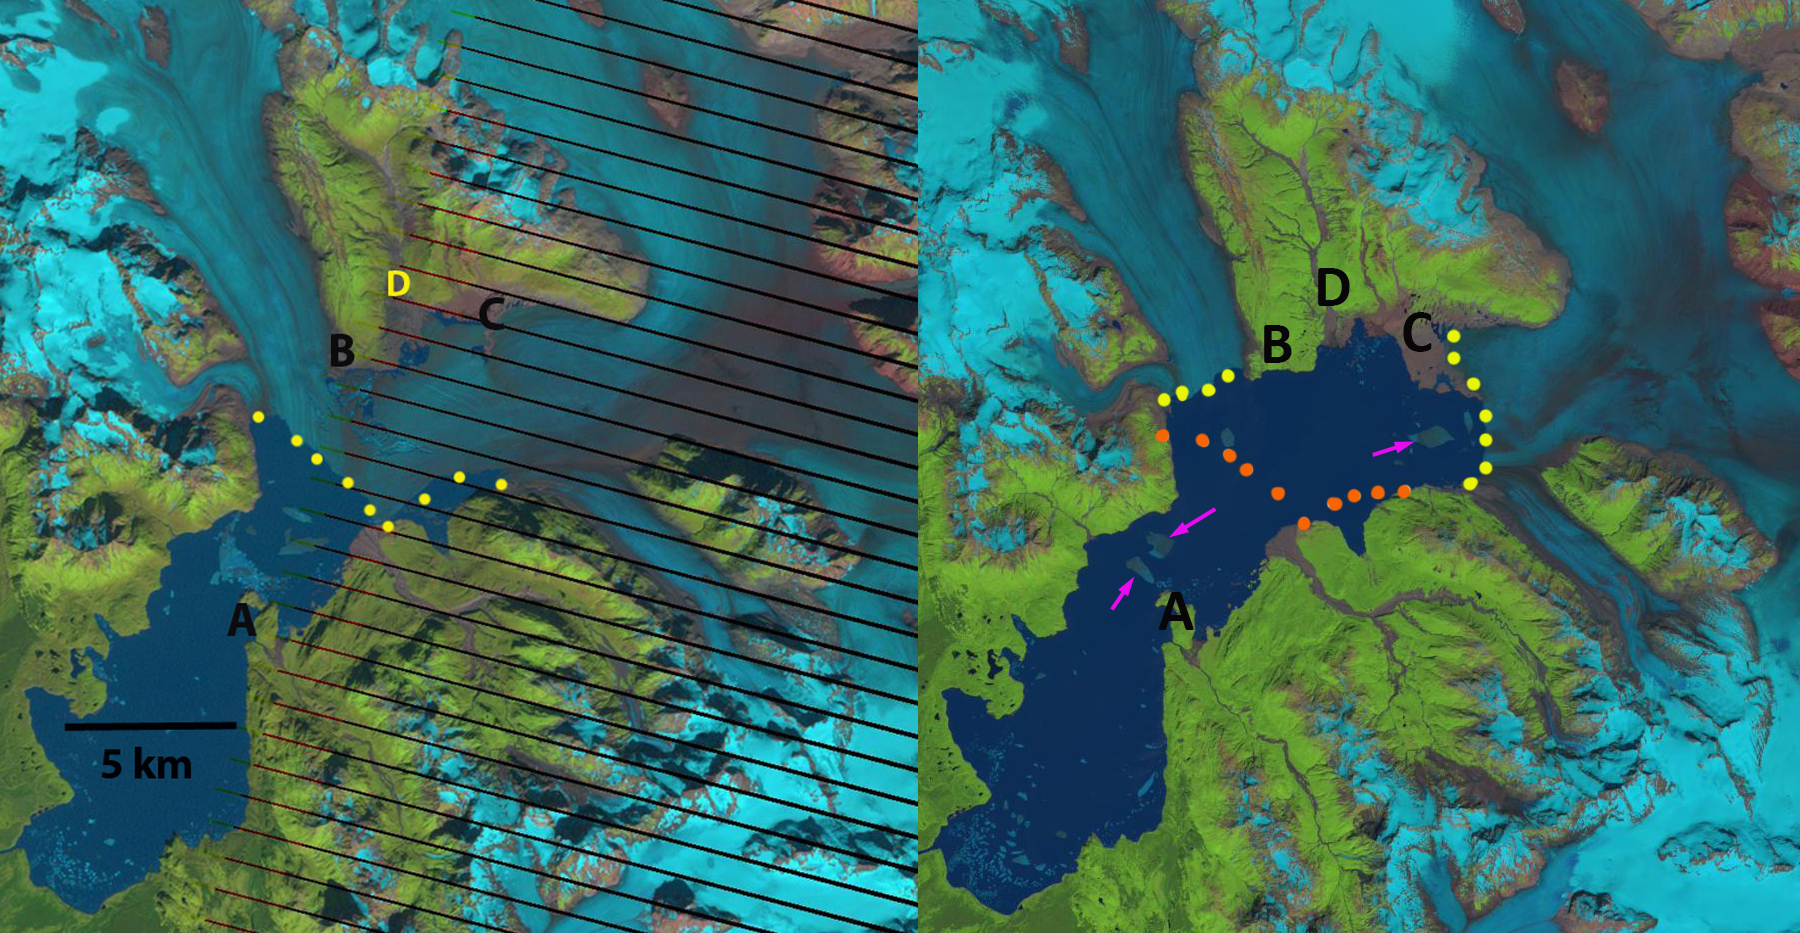
Yakutat Glacier, Alaska experienced a spectacular retreat losing 45 km² from 2010-2018, as a result of rising ELA leading to rapid thinning of the lower glacier (Truessel et al, 2013). The Yakutat Glacier during the 1894-1895 Alaskan Boundary Survey ended near a terminal moraine on a flat coastal outwash plain. By 1906 the glacier had retreated from the moraine and a new lake was forming, Harlequin Lake. By 1984 the lake had expanded to an area of 50 km2. The 2018 image compares the 2010 position (yellow dots) with 2018 (orange dots), indicating an area of 45 km² lost in less than a decade (NASA EO, 2018). There are some small icebergs in 2018. By 2024 further retreat has expanded the total lake area to 105 km2. The main terminus retreated 7 km. The ability to produce icebergs as large as in 2015 has been lost as the calving front has been restricted by the Peninsula which is now 3 km long, leaving less than a 3 km wide calving front. The narrower calving front and reduced water depth should in the short term reduce retreat. Truessel et al (2015) modelling indicated a reduced rate of retreat from 2020-2030, which supports the expected reduced calving. Their model also indicates the glacier will disappear between 2070 and 2110 depending on the warming scenario.
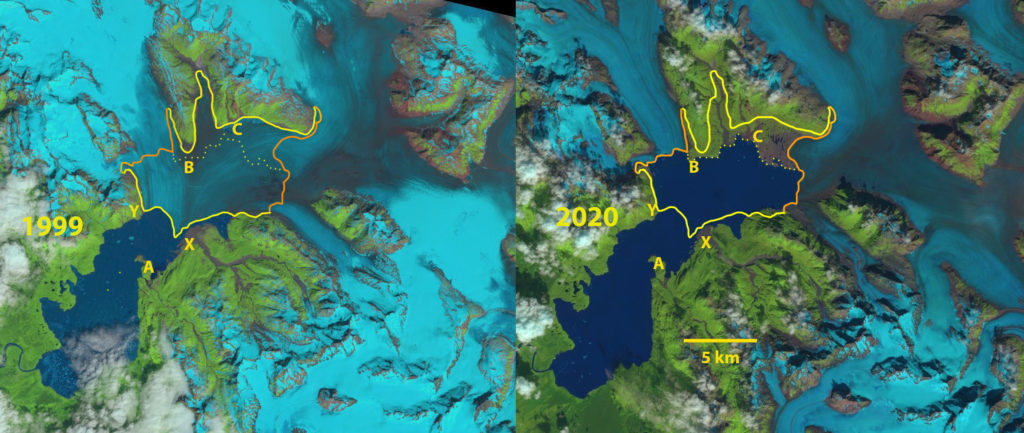
Expansion of Harlequin Lake due to retreat of Yakutat Glacier indicated on these 2010 and 2018 Landsat images. Yellow dots mark the ice front, orange dots the 2010 margin in 2018.Expansion of Harlequin Lake due to retreat of Yakutat Glacier, yellow boundary marks the deglaciated region on these Landsat images from 1999 and 2020.
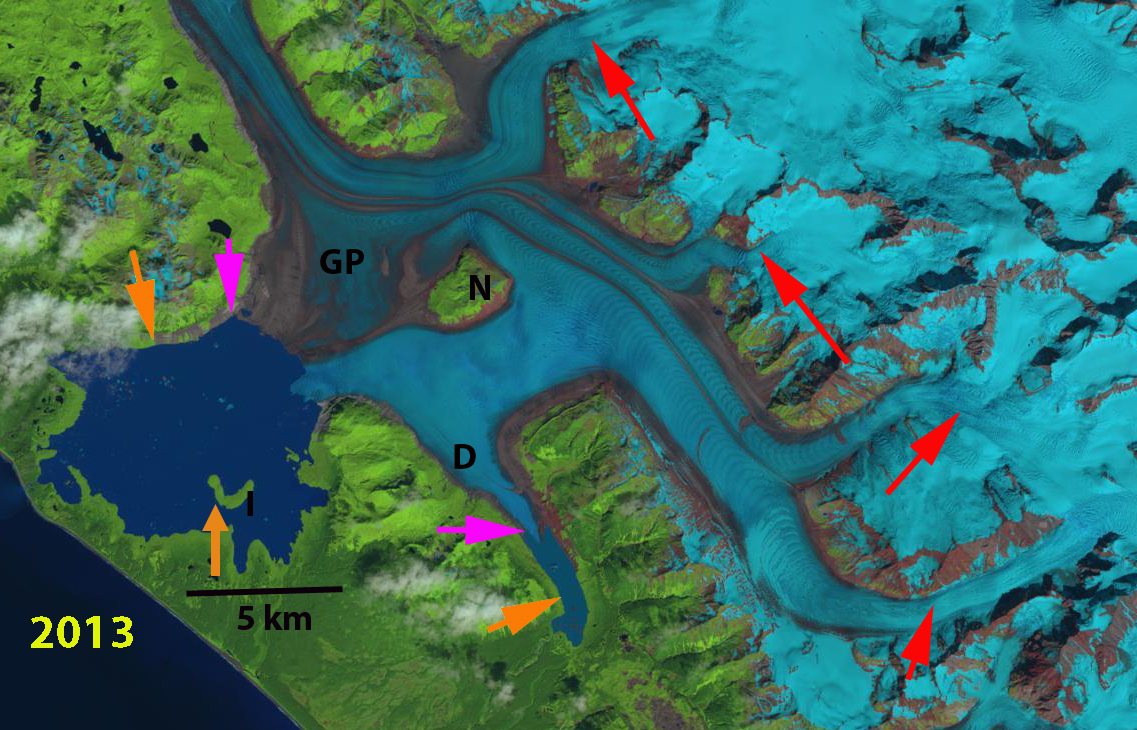
Grand Plateau Glacier drains southwest from Mount Fairweather in southeast Alaska. The glacier advanced during the Little Ice age to the Alaskan coastline. Early maps from 1908 show no lake at the terminus of the glacier. The 1948 map (below) shows three small distinct lakes at the terminus of the main glacier and a just developing lake at the terminus of the southern distributary terminus (D). The distance from the Nunatak (N) to the terminus was 11 km in 1948. The lake at D is 400 m wide.In 2024 the lake area has grown further to 49 km2, as a result of a retreat of 8 km since 1948 and 5.5 km since 1984. Today a second island is emerging at the terminus, Point A. The distributary tongue to the southeast now terminates in a lake that is now 5.2 km long, a 4.8 km retreat since 1948 and 2.6 km since 1984. The combination of higher snowlines and increased calving into the terminus lake will continue to lead to retreat of this still mighty river of ice (Pelto, 2024).
There will be continued glacier retreat and lake expansion in 2025, as the new lake district continues to expand as a result of climate change. Loso et al (2021) note that retreat of Grand Plateau Glacier will change the outlet of Alsek Lake from Dry Bay to the Grand Plateau Lake, creating one larger lake.
Grand Plateau Glacier retreat from 1984 to 2013 in Landsat images. Main tributaries indicated by red arrows also showing snowline. Orange arrows indicate 1984 terminus and pink arrows 2013 terminus.
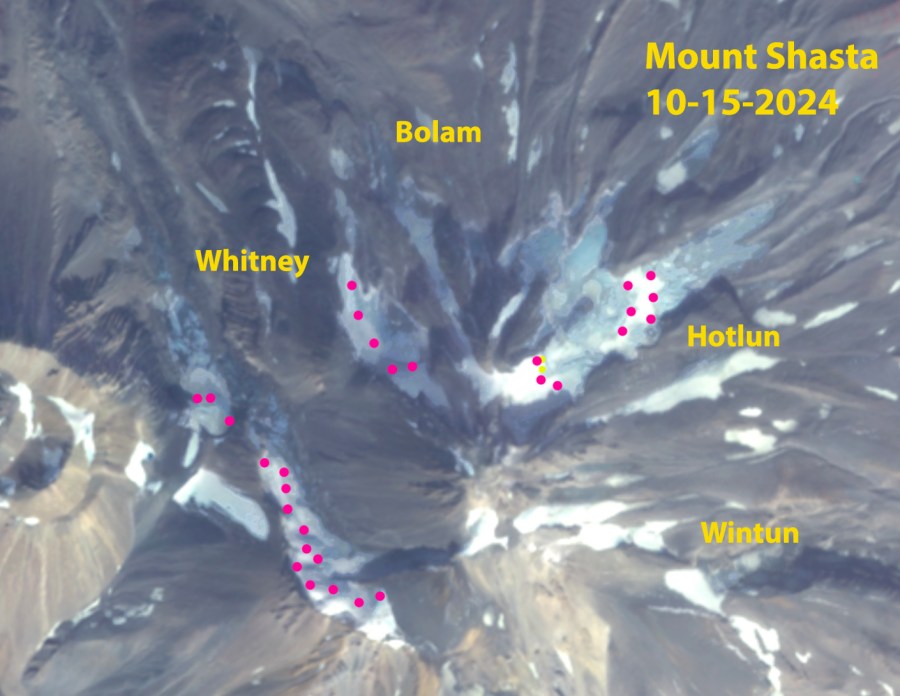
Snow cover extent on Mount Shasta glacier as the melt season ends in 2024. Oct. 15, 2024 Sentinel image, red dots indicate outline of snowcover areas ~25% of glacier area.
In 2021 and 2022 winters of below average snowfall , 4.50 m and 3.61 m at Snow Bowl, were followed by summers of persistent heat and several notable heat waves that left the glaciers of Mount Shasta nearly bare of snowcover, the resulting rapid volume loss and fragmentation of the glaciers was noted in detailed reports (Patel, 2021; Pelto, 2022). In 2021 less than 5% of the glaciers retained snowcover, and in 2022 less than 10% was retained.
In 2023 and 2024 a pair of winters with much above normal snowfall, 8.51 m and 8.43 m inches at Snow Bowl blanketed the mountain. How much of this snow has been retained by the glaciers as the 2024 melt season concludes.
Snow cover extent in September 2021 is less than 5% on Mount Shasta glaciers in this Sentinel image.
The summer of 2023 featured persisten warmth that led to ….In 2024 the melt season was again warm with the mean departure being 1.5-2.0 C in the Mount Shasta area. Regional Climate Center ACIS maps of the temperature anomaly for June-August provide a comparison of summer temperature for 2021-2024. Examining the remaining snowcover extent on Oct. 15, 2024 illustrates that
Summer temperature anomaly (in oF), for 2021-2024 for California. Each summer the departure has exceeded 1 C in the Mount Shasta region.ACIS maps
For Cascade range glaciers to maintain equilibrium they need 60% snowcover at the end of the melt season. Examining the remaining snowcover extent on Oct. 15, 2024 illustrates that the three primary glaciers Bolam, Hotlum and Whitney have 25% snowcover remaining. This indicates signficant loss of volume in 2024, though less than 2021 or 2022. This will drive continued thinning, retreat and loss of glaciers.
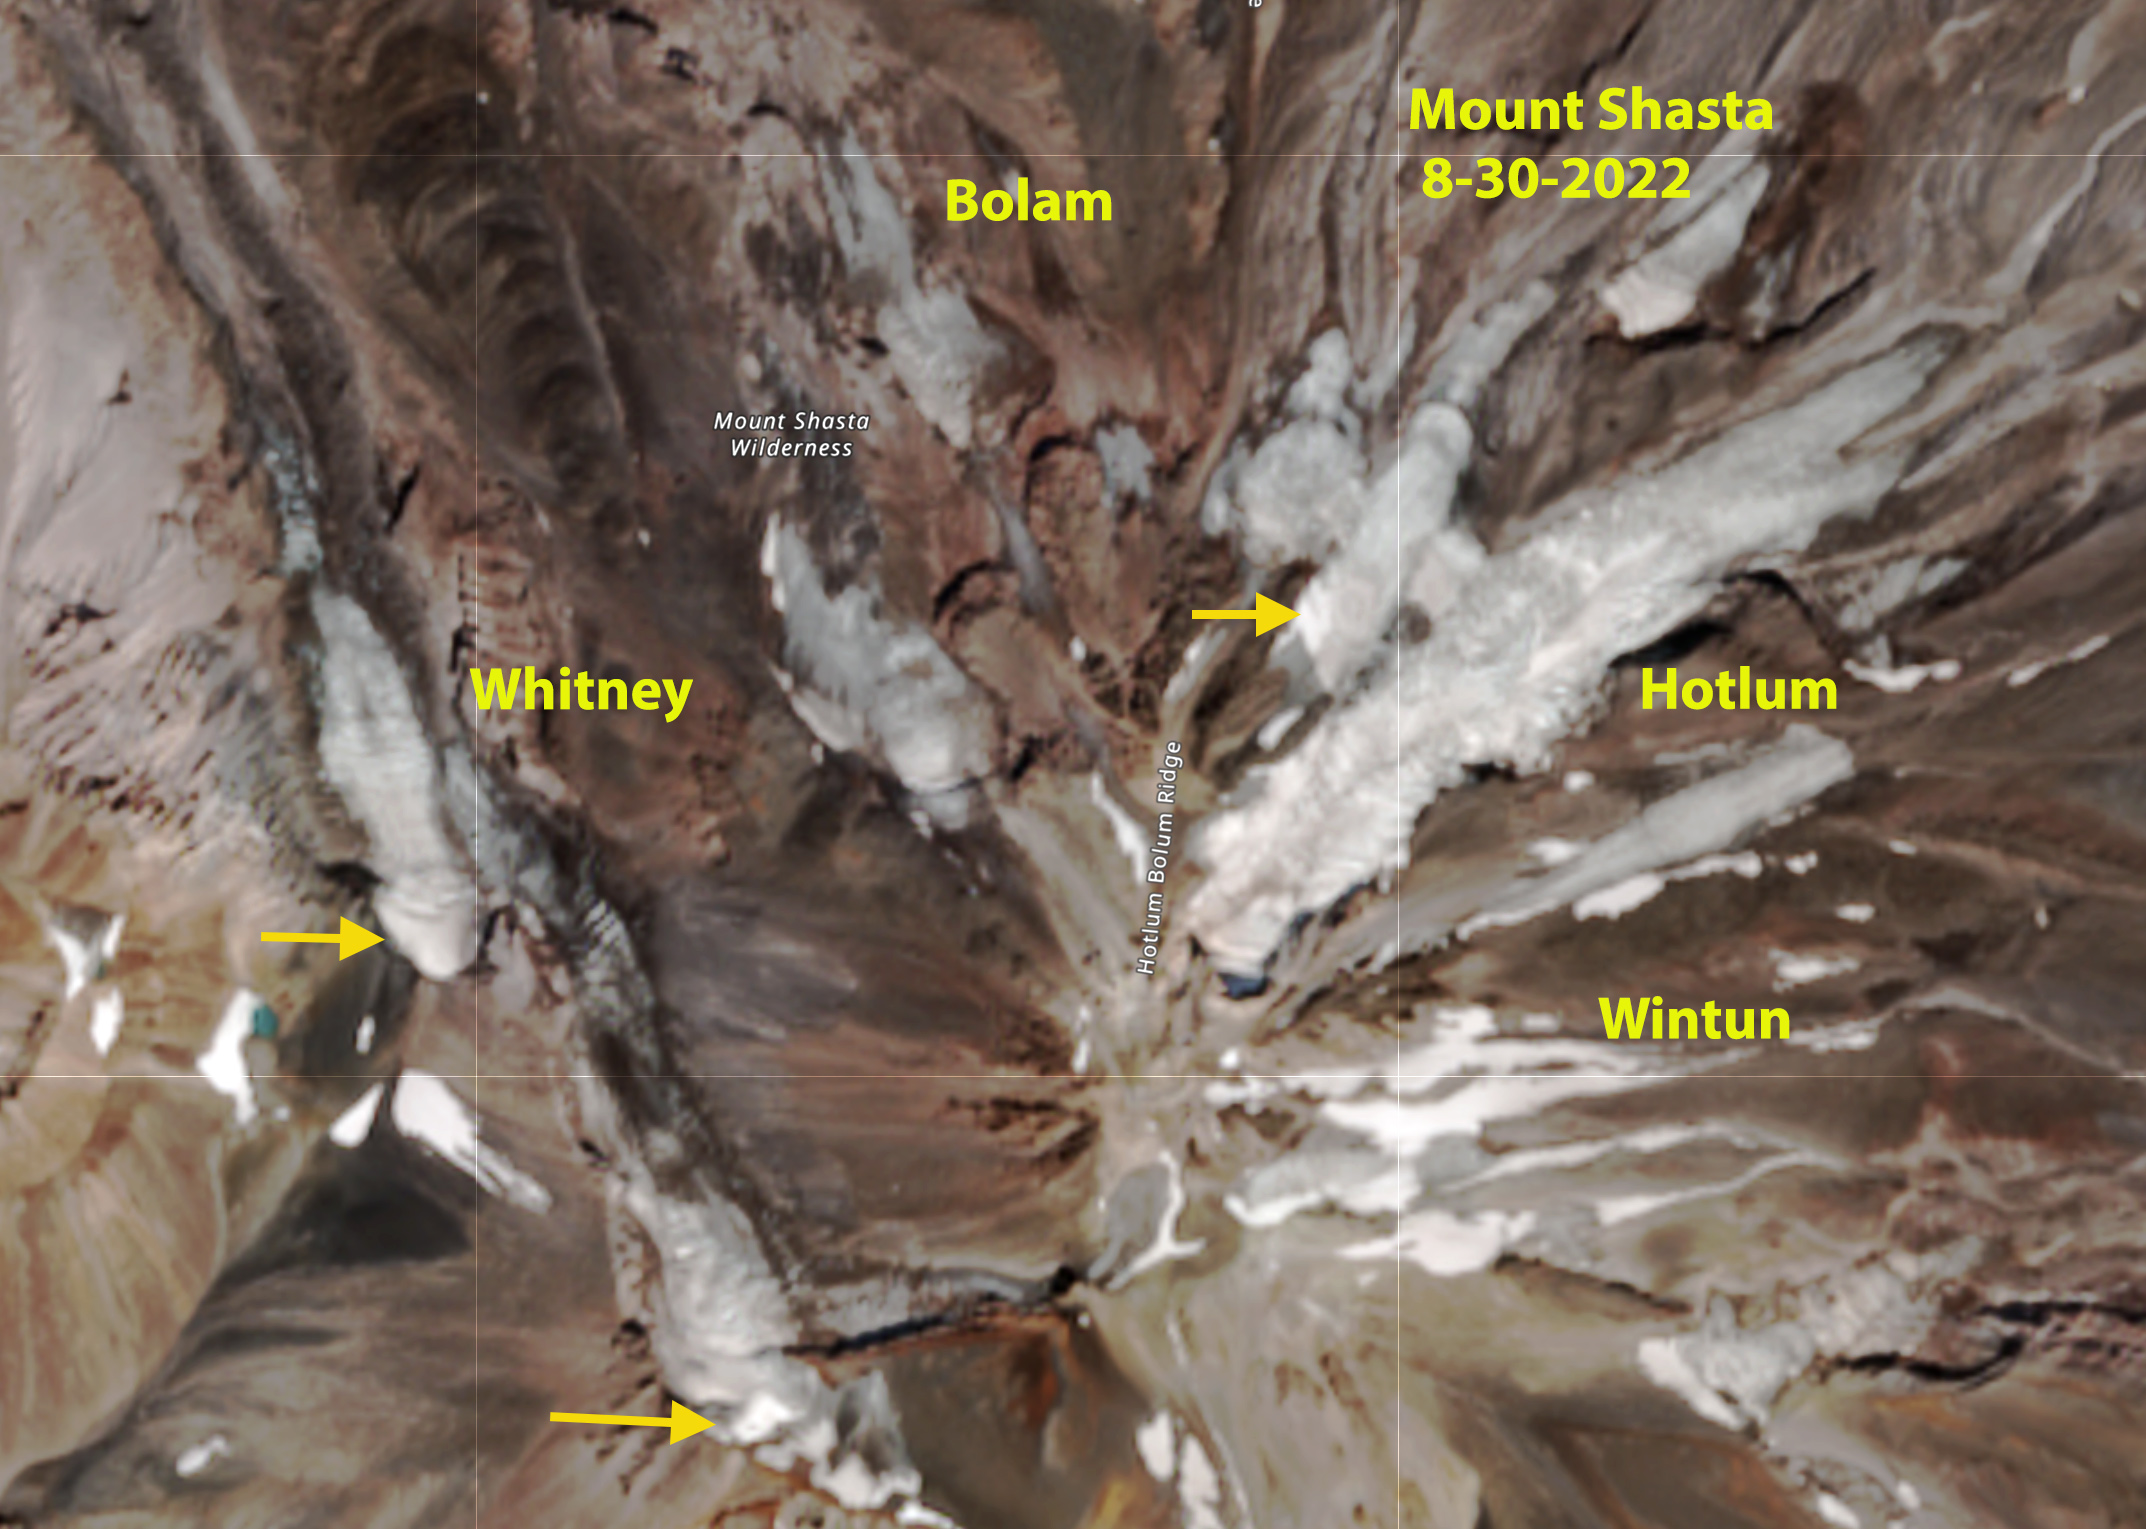
Snowcover extent on Aug. 30, 2022 on Munt Shasta Glaciers. Yellow arrows indicate that less than 10% of the glaciers are snowcovered.
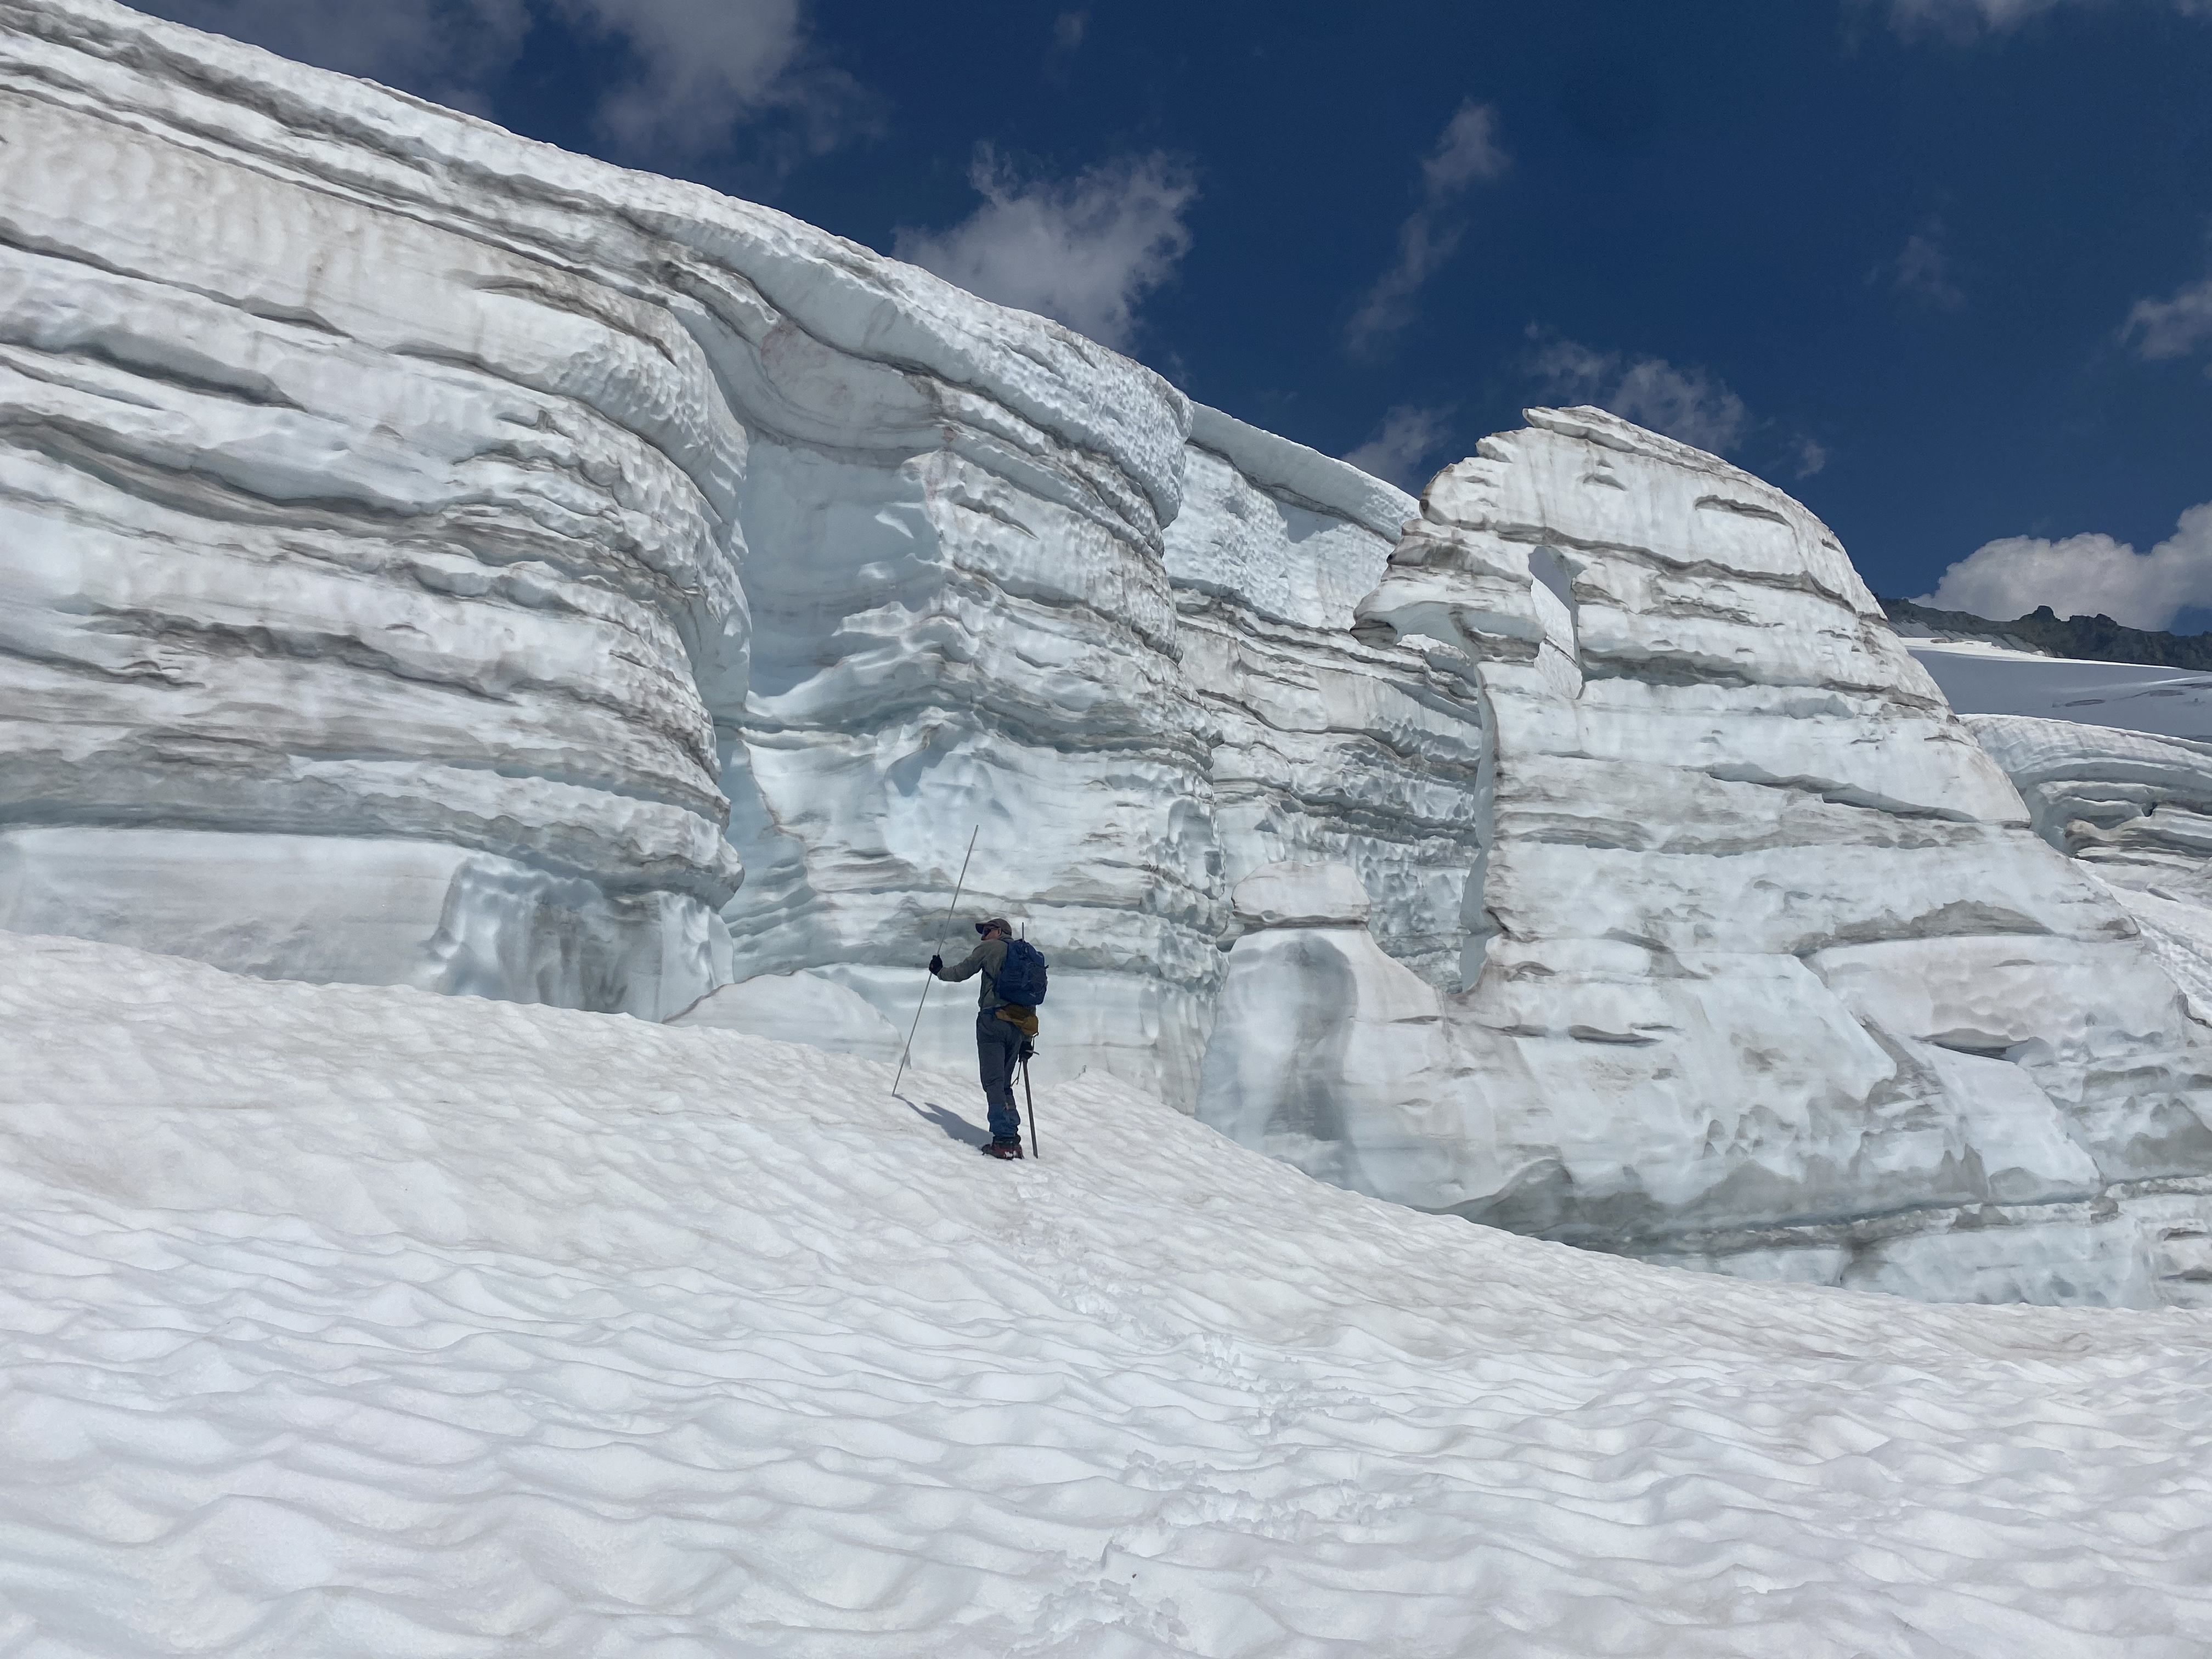
Serac on Easton Glacier at 2400 m indicating retained snowpack from previous years.
Climate Conditions Summary
The winter season of 2023/24 yielded a low snowpack across the North Cascades. Snowpack at six longer Snotel stations was 0.63 m w.e on April 1, vs. a 1984-2024 average of 1.02 m. This was the third lowest snowpack of this period, with 2005 and 2015 being lower. The melt season in May and June was cool, helping extend the low snowpack at elevations above 1500 m. July rivaled 2015 for the warmest of the last 50 years, quickly melting back the snowpack by the start of August. The end of the melt season was fairly typical with several new snowfalls and periods of heat. The main melt season for the glaciers is June-September and this year the average temperature was 18.3 C, which is 1.3 C above the long term mean. This was the fourth year in a row above 18 C and thus the fourth consecutive year of large glacier mass balance losses. The cumulative impact is glacier recession, thinning, loss of a number of glacier and overall steeper/dirtier ice. We conducted detailed field work on eight glaciers.
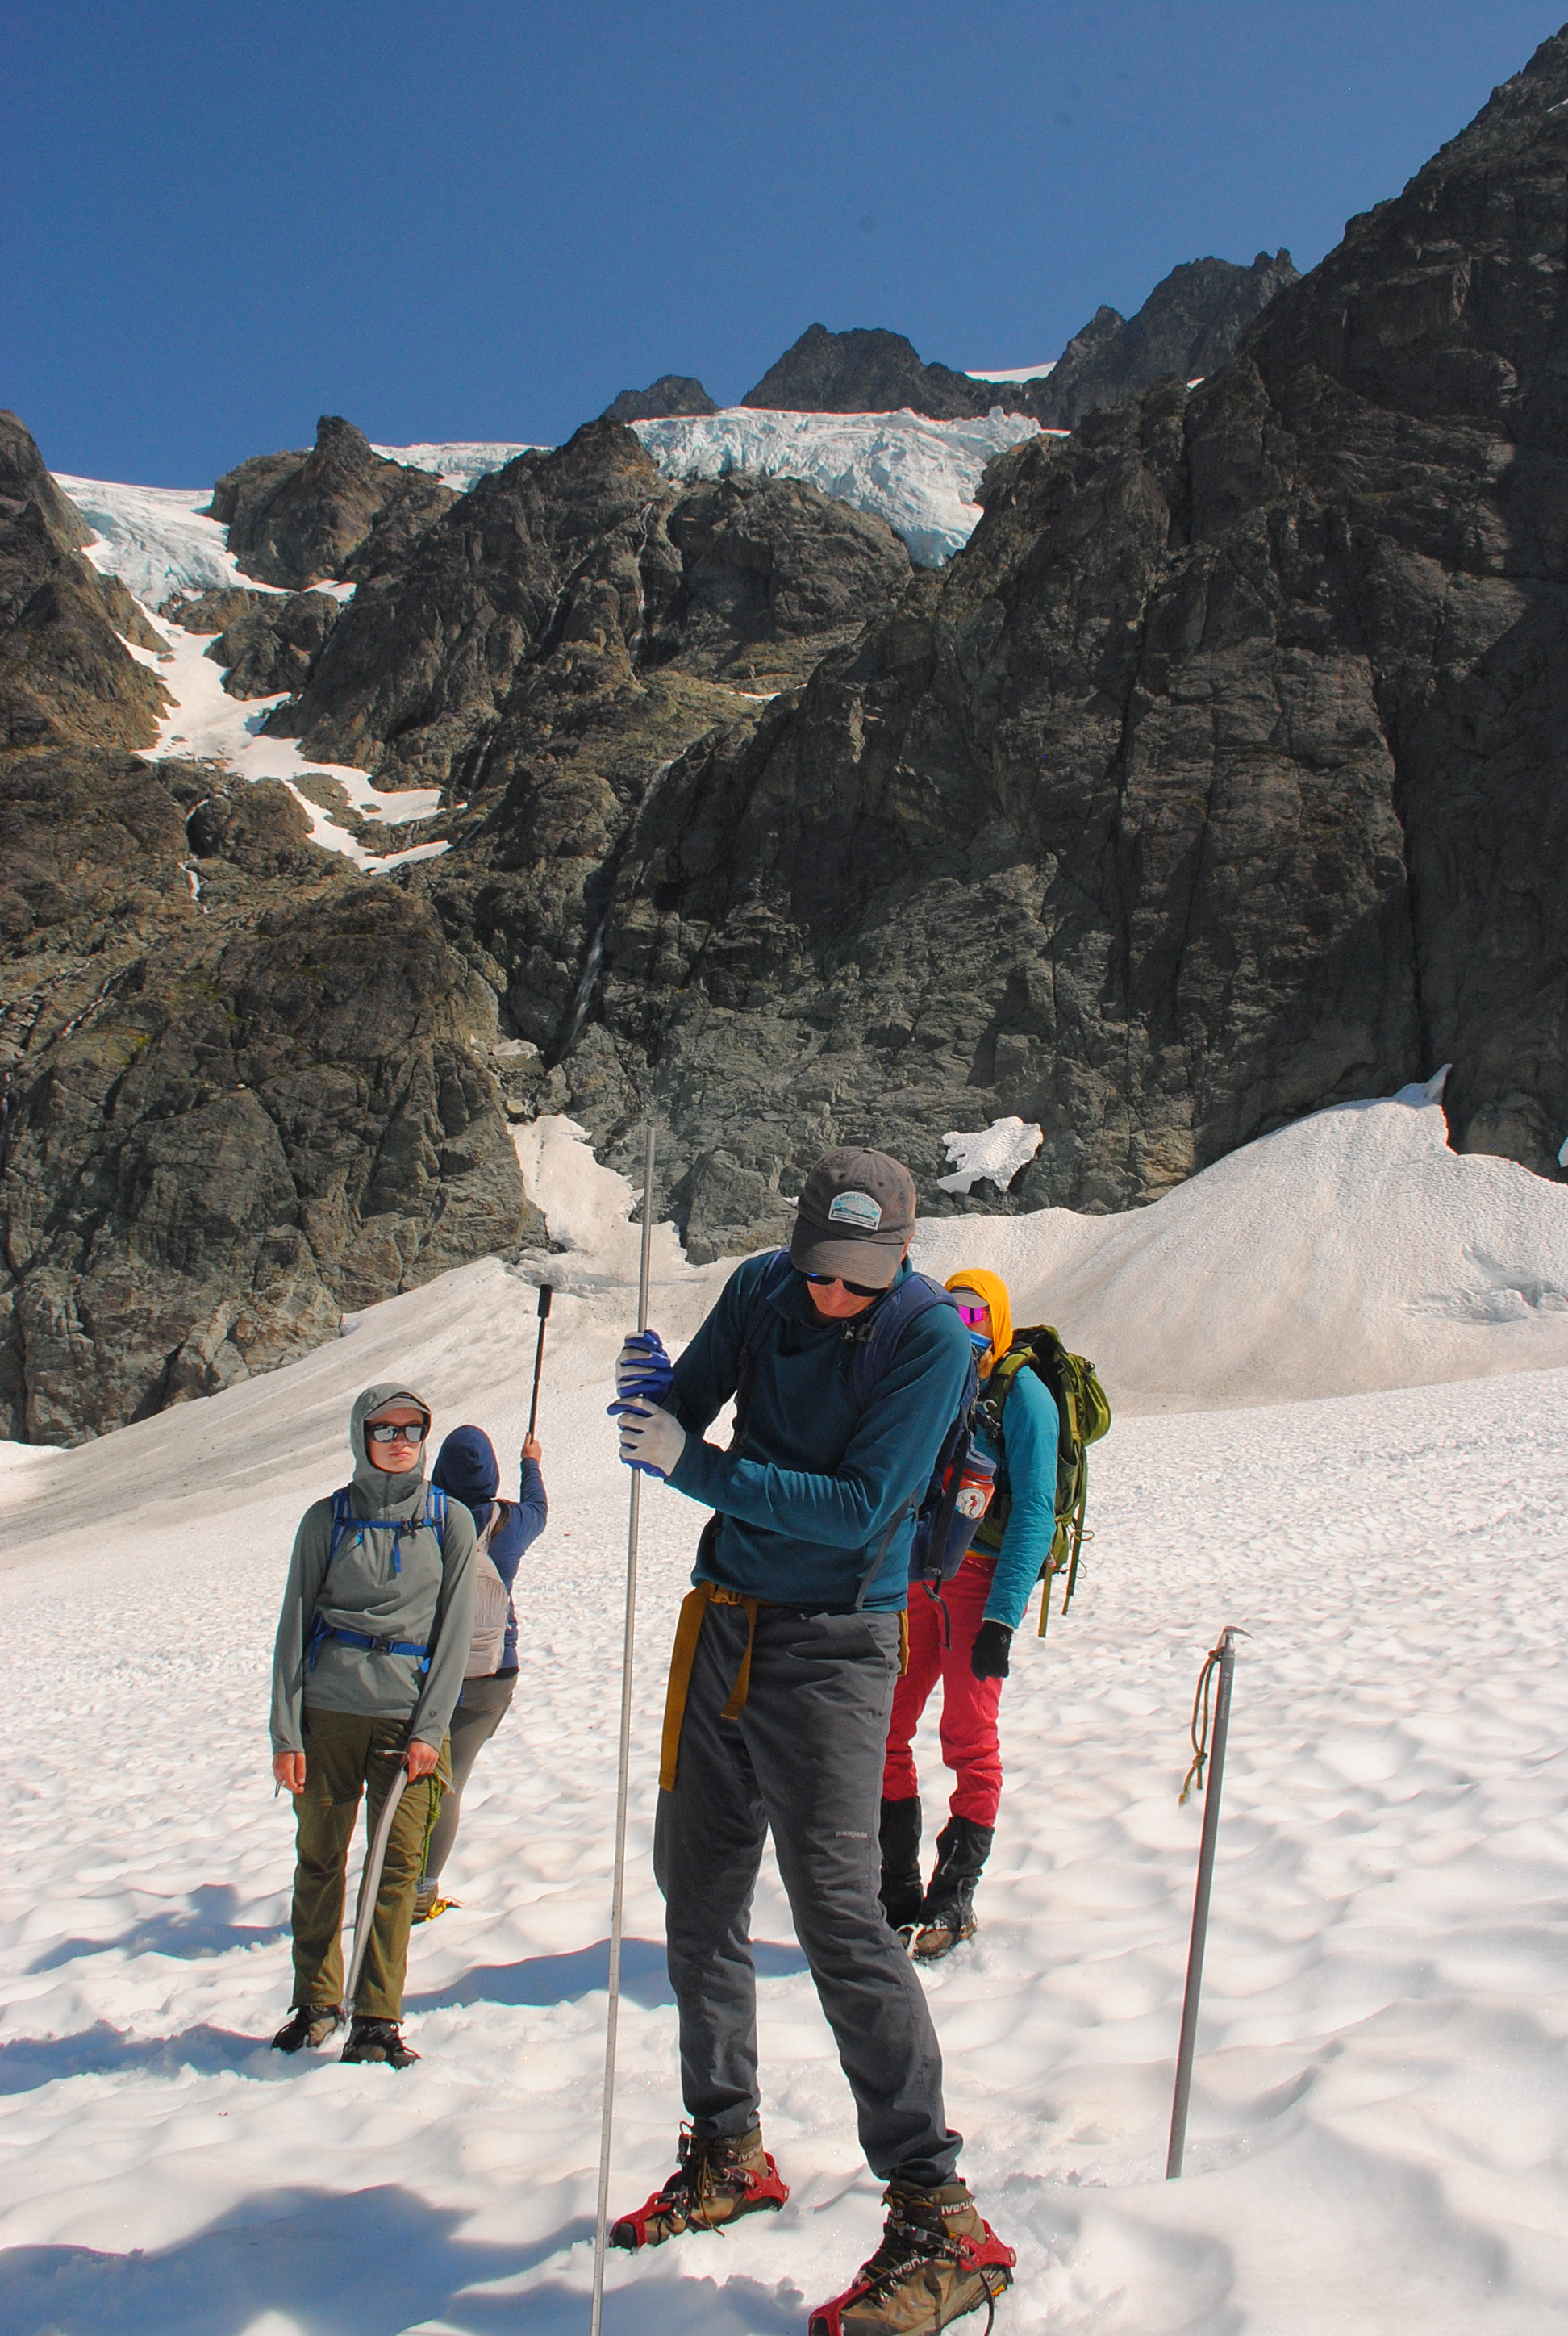
Probing snow pack depth on Lower Curtis Glacier. The 12 foot segmented steel probe cannot penetrate the icy surface from the previous summer.
Glacier Mass Balance
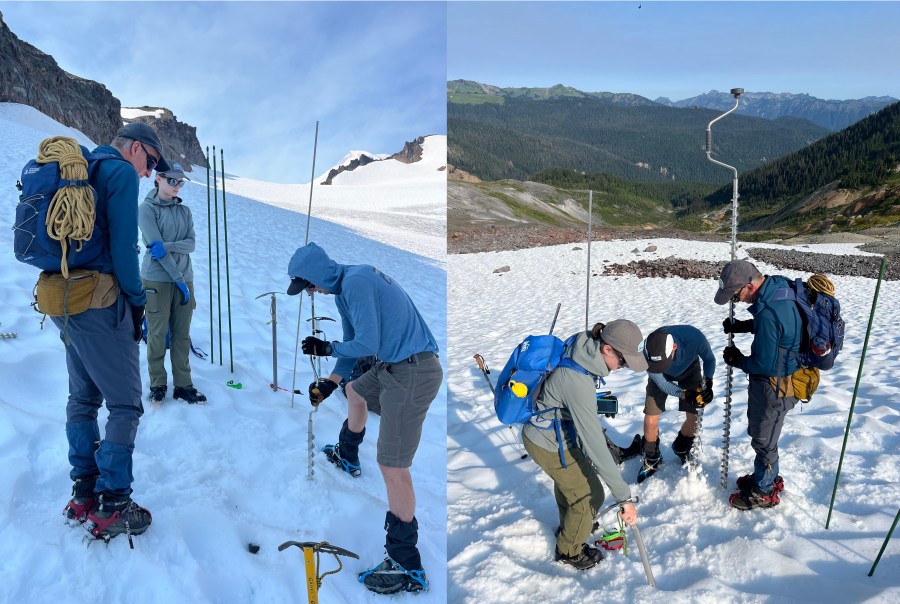
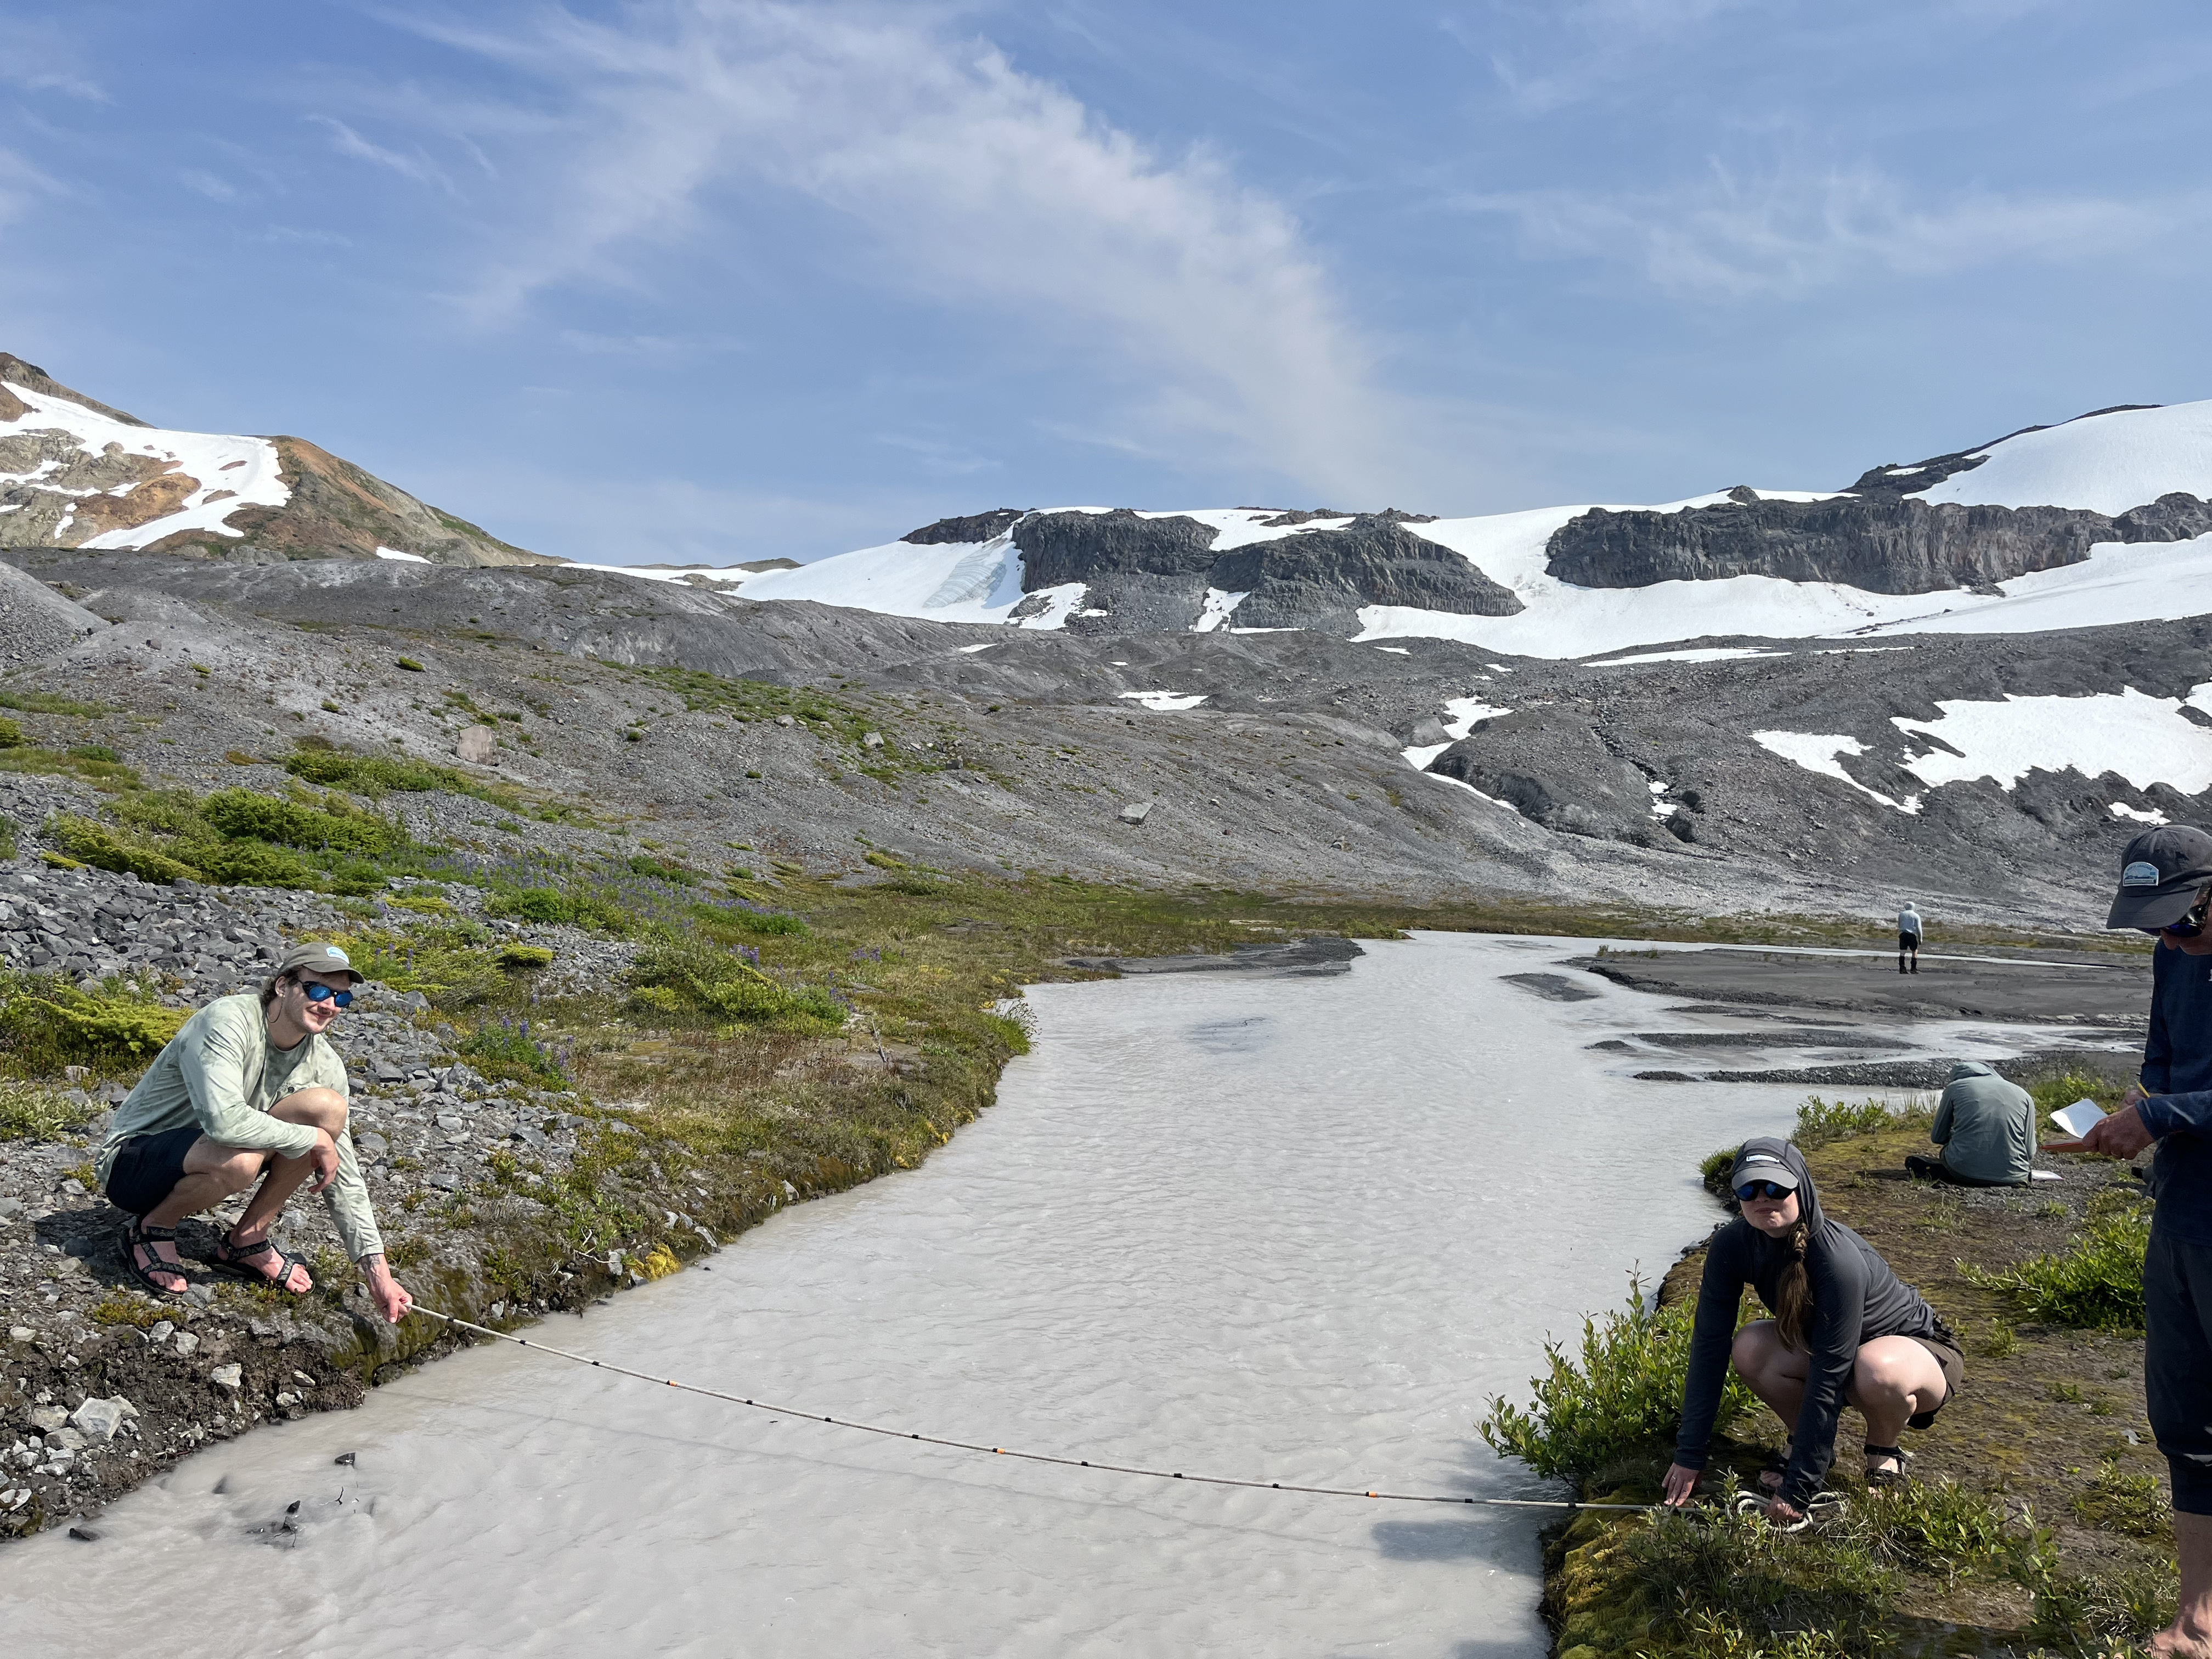
Annual mass balance is the difference between the mass of snow and ice accumulation on the glacier and the ablation of snow and ice on the glacier during a year. The data is reported in the average change across the glacier in water equivalent thickness. In 2024 we again utilized probing snow depth with a 12 foot long segmented steel probe (520 measurements), annual layer thickness measurement in vertically walled crevasses (140 measurements), and mapping snow line position in the field. To assess ablation we used snow line migration in satellite imagery and ablation stakes drilled into the glacier. The mass balance at the snowline is 0 m w.e., and as it transects areas of known snow depth that identifies ablation rate.
Ben Pelto deploying his ice augur to emplace ablaiton stakes on Sholes Glacier, Katie Hovind and Mauri Pelto assisting.Jill and Mauri Pelto in front of Columbia Glacier that has retreated forming a new lake. Avalanche accumulation on west side only snowcover retained by end of summer.
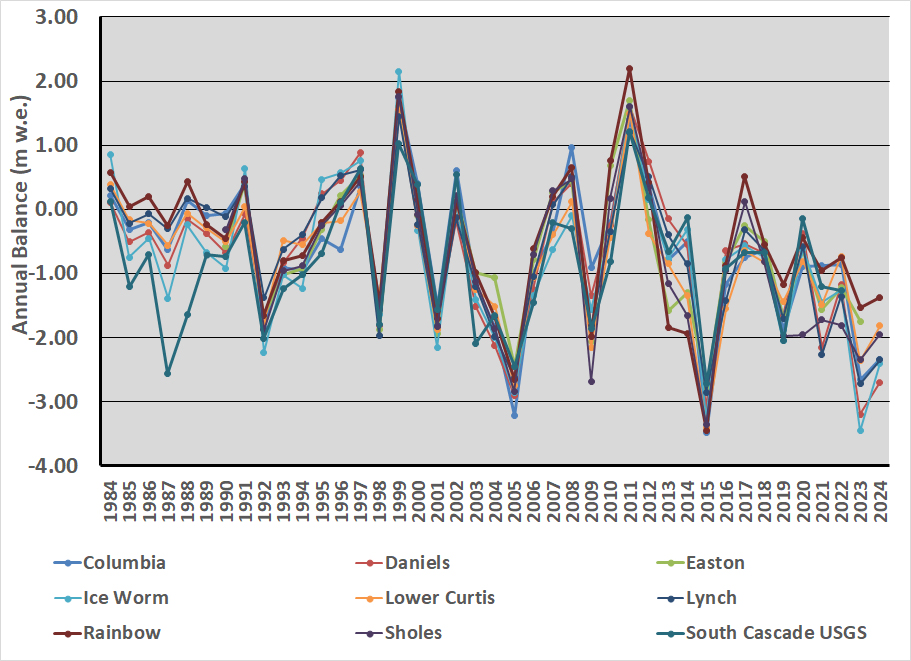
All eight glaciers had a negative balance exceeding 1.3 m w.e., with an average of -2.09 m w.e., this is equivalent to at ~2.25 m of glacier thinning. The loss during the last four years is unprecedented with 8 m of average thickness lost from 2021-2024. This is greater than the entire decade of loss for 184-1993, 1994-2003 or 2004-2013. The acceleration of loss continues even as the glaciers lose their highest melting terminus regions. This is an indication that none of the glaciers are approaching equilibrium. The cumulative mean mass balance loss has been -28.89 m w.e., ~33 m in thickness. This represents the loss of ~40% of volume of the glaciers we have observed, 1% loss per year overall but over 2% per year in the last decade.
Annual mass balance time series for the eight glaciers we monitor and the USGS monitored South Cascade Glacier. In 2024 Columbia=-2.34, Daniels=-2.70, Easton=-1.74, Ice Worm=-2.40, Lower Curtis=-1.82, Lynch=-2.35, Rainbow=-1.38, Sholes=-2.35.
The deglaciated area exposed by the retreat over the last four decades is substantial and is most visible below Easton Glacier. The retreat of 620 m since 1990, has included a retreat of over 100 m in the last two years. The thinning of this glacier along with neighboring Squak and Deming have led to emergence of bedrock areas high on the glacier as well.
Deglaciated area below Easton Glacier from the 1990 advance moraine to 2024.Bedrock areas that are emerging and expanding above 2100 m on the upper portions of Deming-Easton and Squak Glacier. Only one of these (upper right) existed before 2010.
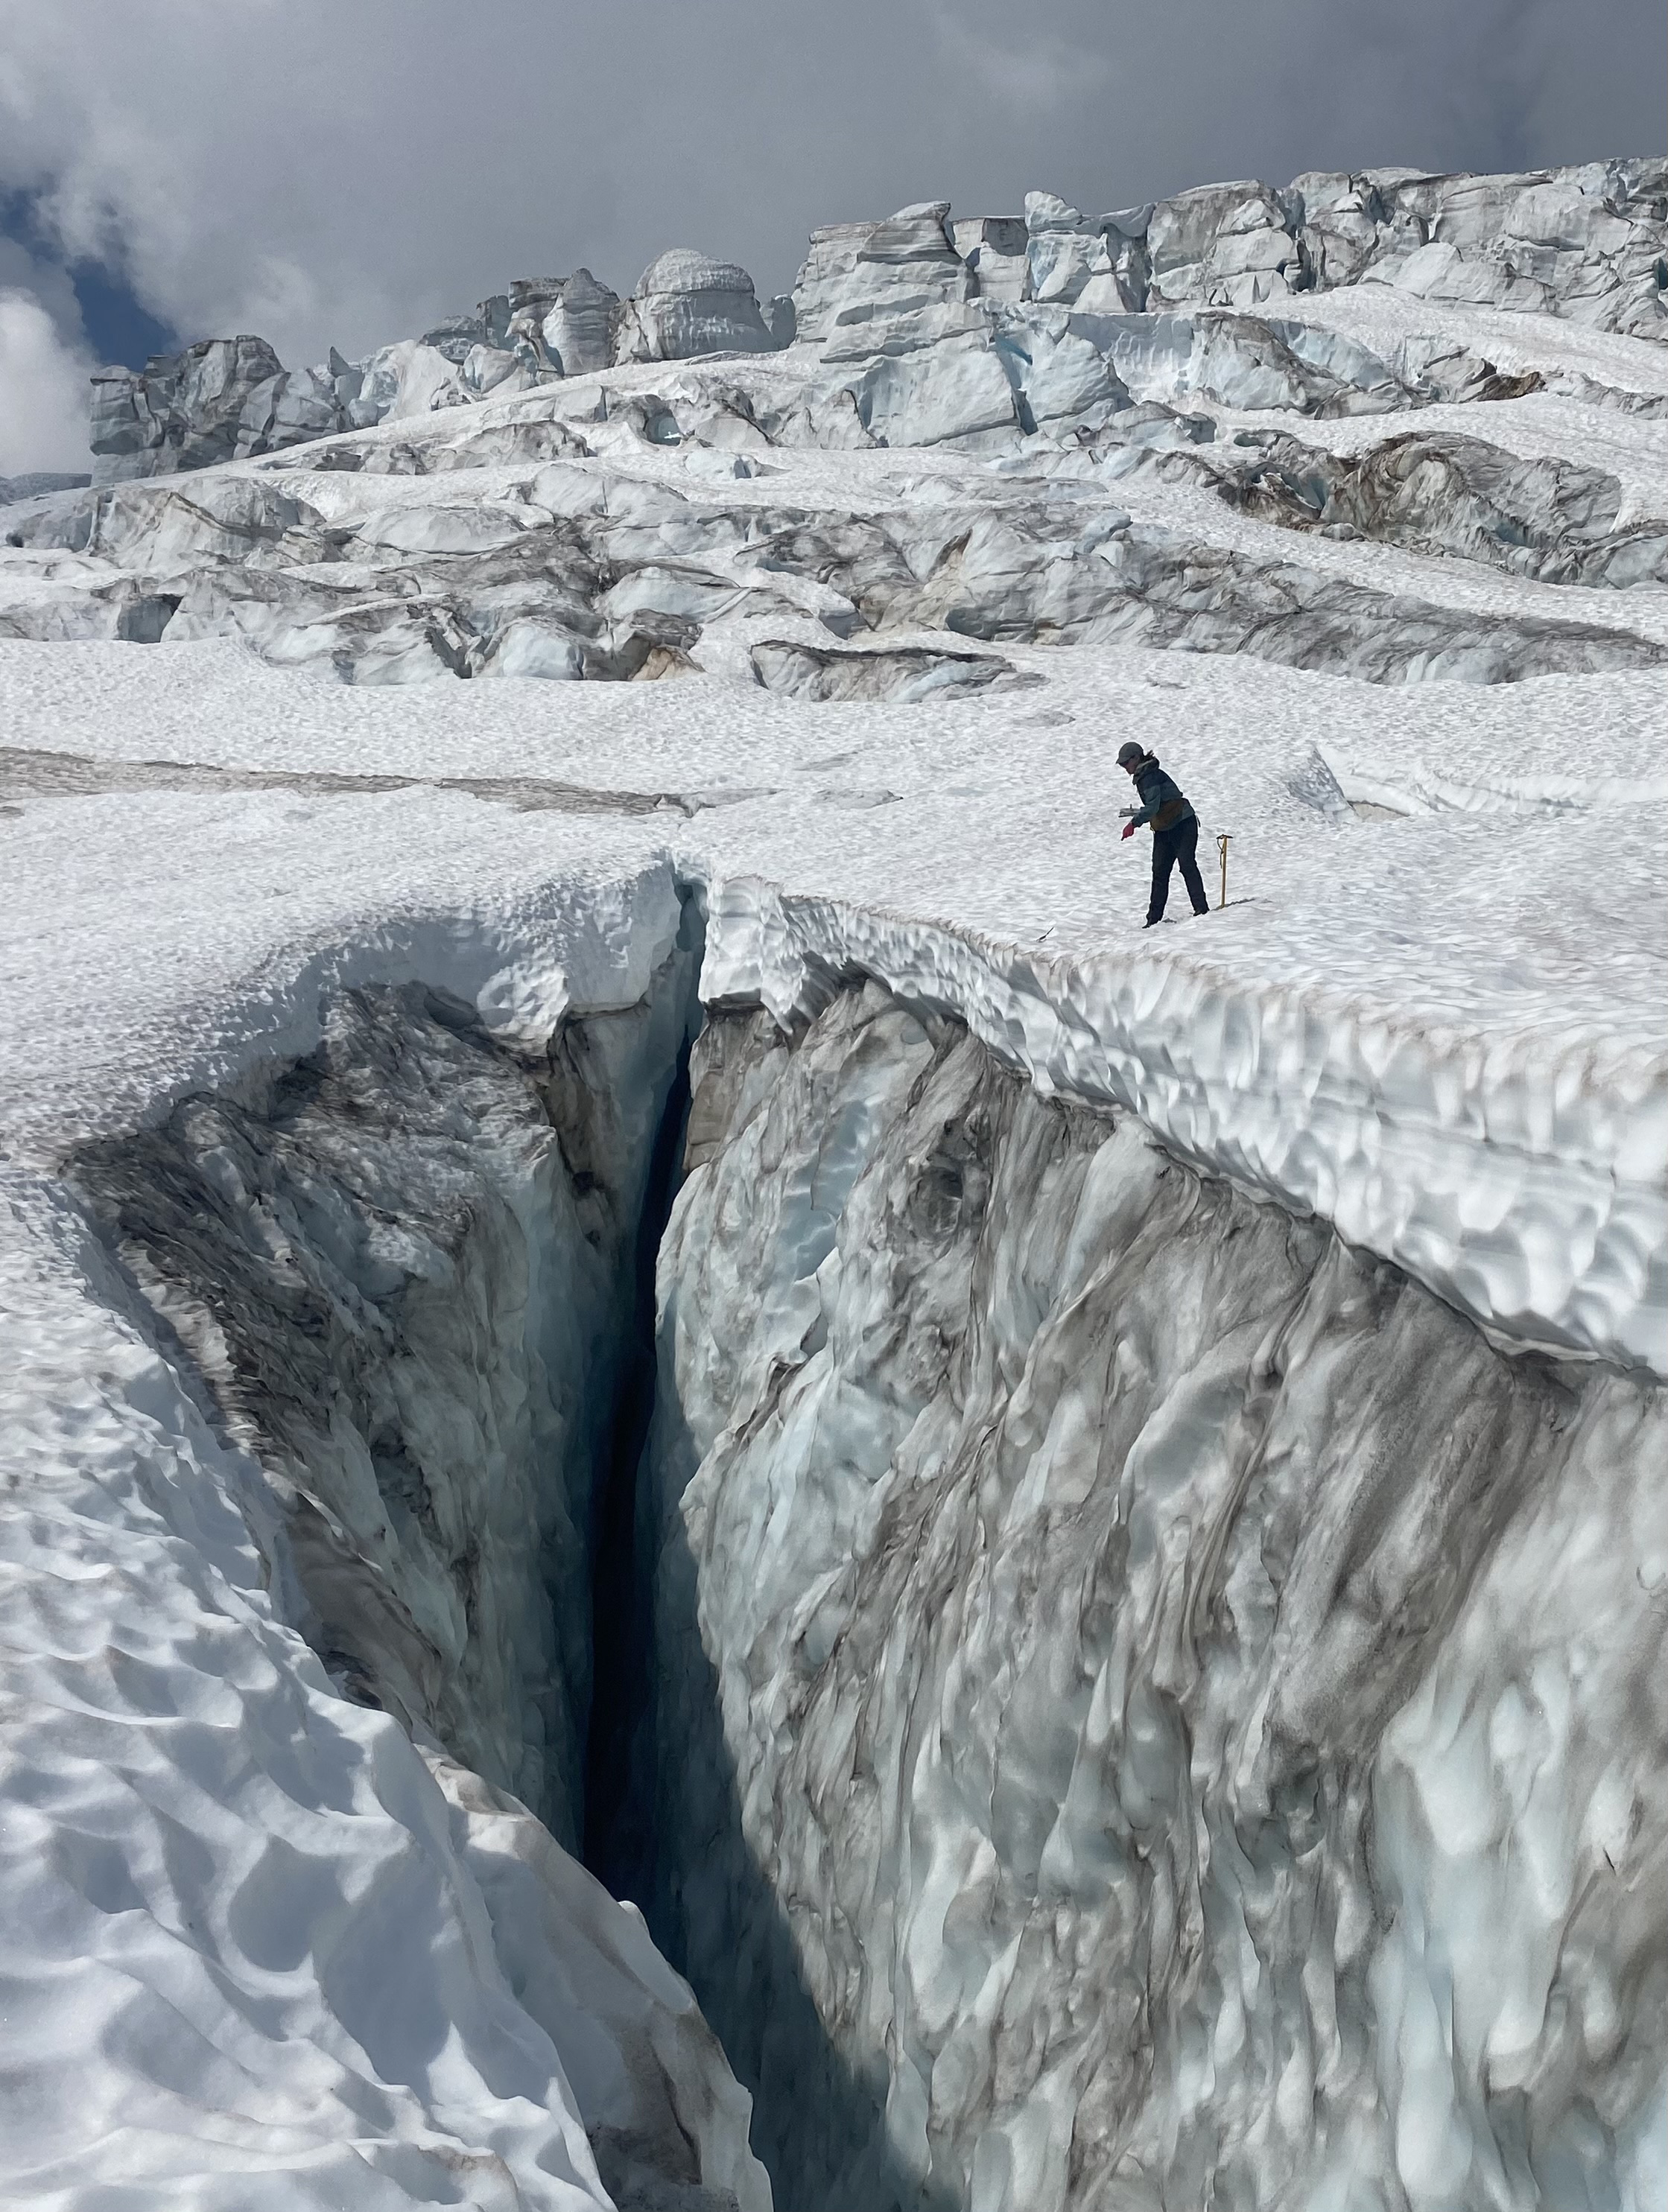
Glacier Crevasses
We have been assessing the depth and distribution of crevasses on several glaciers annually since 2013. We have noted a decline in the number of crevasses in specific icefall regions, such as on Lower Curtis, Rainbow and Easton Glacier. The depth also decline rapidly with glacial thinning during the last decade. In the main icefall on Easton Glacier in 2024 at 2300 m were the deepest crevasses we found at ~30 m. Below is Jill Pelto measuring crevasse depth using a camline.
Glaciers Lost
There are 31 active glaciers across the North Cascades that we observed since the 1980s that have now disappeared. The list below indicates the year they were lost, the area of the glaciers in the GLIMS inventory for initial area (1958-1984), 2015 area, and the area of the former glacier in 2022/24. This is not a complete list of glaciers lost in the North Cascade Range. The rate of loss is clearly accelerating.
When a glacier’s volume becomes too limited to generate motion, a combination of thickness below ~15-25 m, and area less than 0.02-0.05 km2, it is no longer a glacier.
North Cascade glaciers that we observed as glaciers in the 1980s that are now gone. The first two areas reported come from GLIMS.org inventories, and the last area and year of loss come from our observations.
Glacier Runoff
We directly measured runoff below Sholes Glacier and in the basin of former Ice Worm Glacier. In each continued glacier recession is reduing glacier runoff. The increased rate of melt is, exceeded by the reduced area available for melting. The result is declining summer streamflow and increased late summer stream temperatures.
The 2024 field season was our 41st, from the glaciers perspective it was the fourth consecutive year of exceptional mass loss, leading to thinning, retreat and glacier loss.Below are images from the field season and reflections on each from the varied perspectives of our field team and field partners.
Coleman Glacier, Mount Baker at the golden hour as we just finished work.
Jill Pelto: During the field season our typical day involves getting up with the sun and working out on a glacier until early evening. Going to Coleman Glacier on Mt. Baker this year was special because we got to work on it during golden hour, a rare thing to experience. We had the glacier to ourselves, and the nearby big camping area — despite this being a popular destination for ice climbers. This is only my third time in sixteen years working on this glacier, and its significant loss since we last saw it in 2019, when I sat and painted on it, was so apparent. But in spite of that, I was feeling joyful to be there — something about four of us out there on our own taking measurements as the summer sun set was so magical. I was so grateful to be there at that moment and experience this landscape as it is now.
Saddle at top of Rainbow Glacier looking to summit of Kulshan (Mount Baker). Ben, Jill and Mauri Pelto a combined 70+ years of experience on these glaciers.
Mauri Pelto: Climate change has led to increased glacier melting on all of the glaciers we have observed. A combined 70+ years of field experience that Ben, Jill and I have provides a context that is crucial. The increased melt is apparent in the streams flowing across the surface very few meters carrying meltwater to the rivers and then the sea. This summer we saw the beauty of the final stages of decay of a glacier melting away in the ice caves that transected the former Ice Worm Glacier (image below). The cave started at the top of the glacier and continued right to the bottom, by next summer that too will be gone. The colors and atmosphere in the cave were spell binding. The landscape remains beautiful, but is losing the glaciers that are a powerful, beautiful and dynamic part of this landscape.
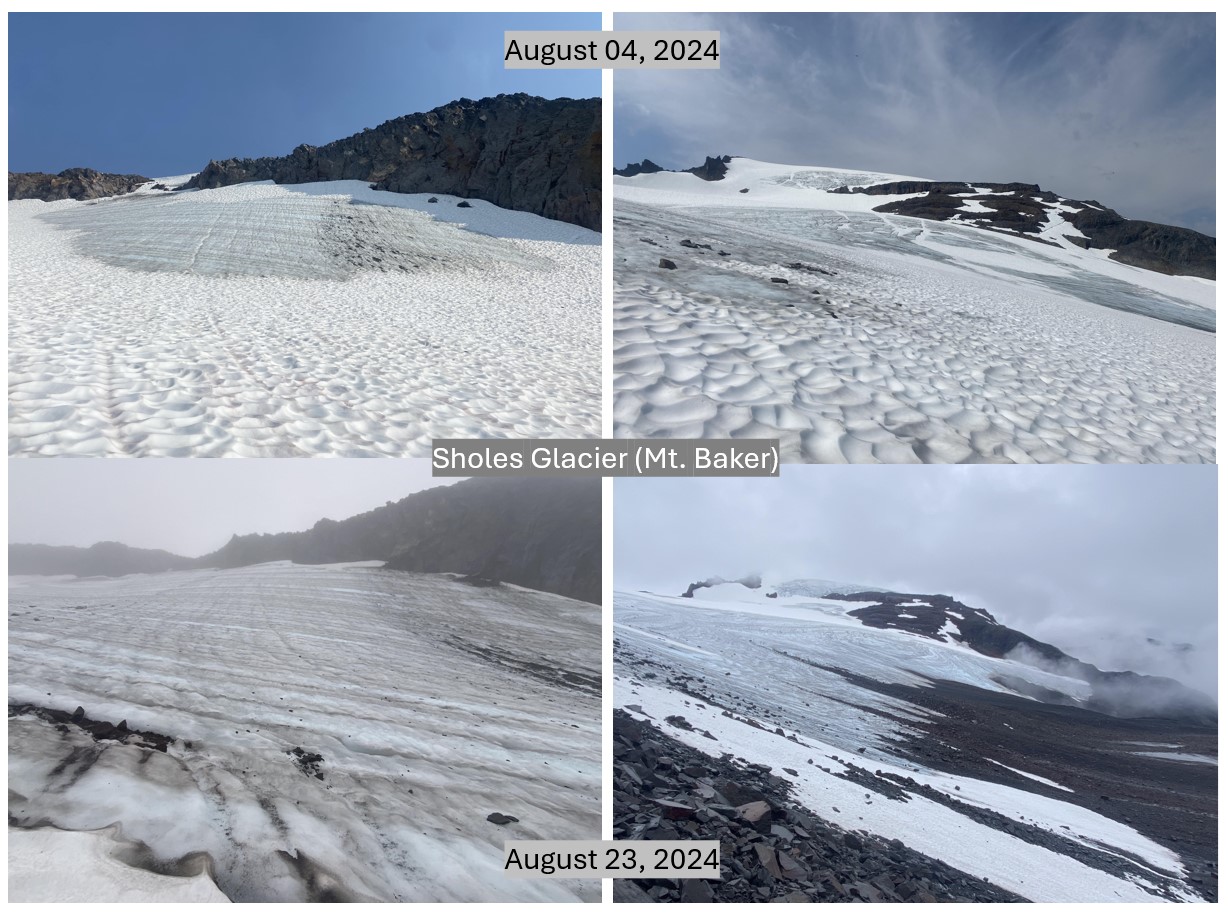
Katie Hovind: Nestled along Ptarmigan Ridge, overlooking Kulshan’s glacier-flanked slopes, was our longest campsite of the field season. Unzipping my tent to an increasingly familiar skyline four mornings in a row, I found myself developing a relationship with this place. I noticed patterns and changes alike, discovering not just the place but a sense of home in it. We followed transects across the Sholes, probing up and down the glacier; we explored a collapsed ice cave near its terminus, blue ice towering over me, ancient wisdom frozen in the dripping layers I ran my hands along; we took water measurements from the stream it feeds, pausing for a break next to the fresh melt as I sketched the textures of rock and snow and ice. We commuted across it twice to the Rainbow Glacier, a trek familiarizing me with the Sholes’ sweeping slopes and views; and we screwed an ice auger deeper than we could see, dropping stakes 3-4 feet below the surface. 19 days later, I returned to the coordinates of those four stakes, which were now all exposed, one sticking up to just over 3 feet above the surface. Reeling as I walked across the glacier I’d gotten to know, the near-incomprehensible volume of loss I saw. A feeling of belonging is so integral to caring. And then comes the question of how to transmit that connection, to spread to others the same sense of responsibility to protect a place? Being lucky enough to experience even a handful of days taking in just a small degree of the Sholes’ nuances, I felt deeply just how wrong and quick the melt is. But from the outside looking in, without any prior reference points, the severity of the glacier shrinking could be overlooked. Through these comparison photos, I hope to share just a glimpse, beauty and grief and all, of what it means to understand and love a glacier.
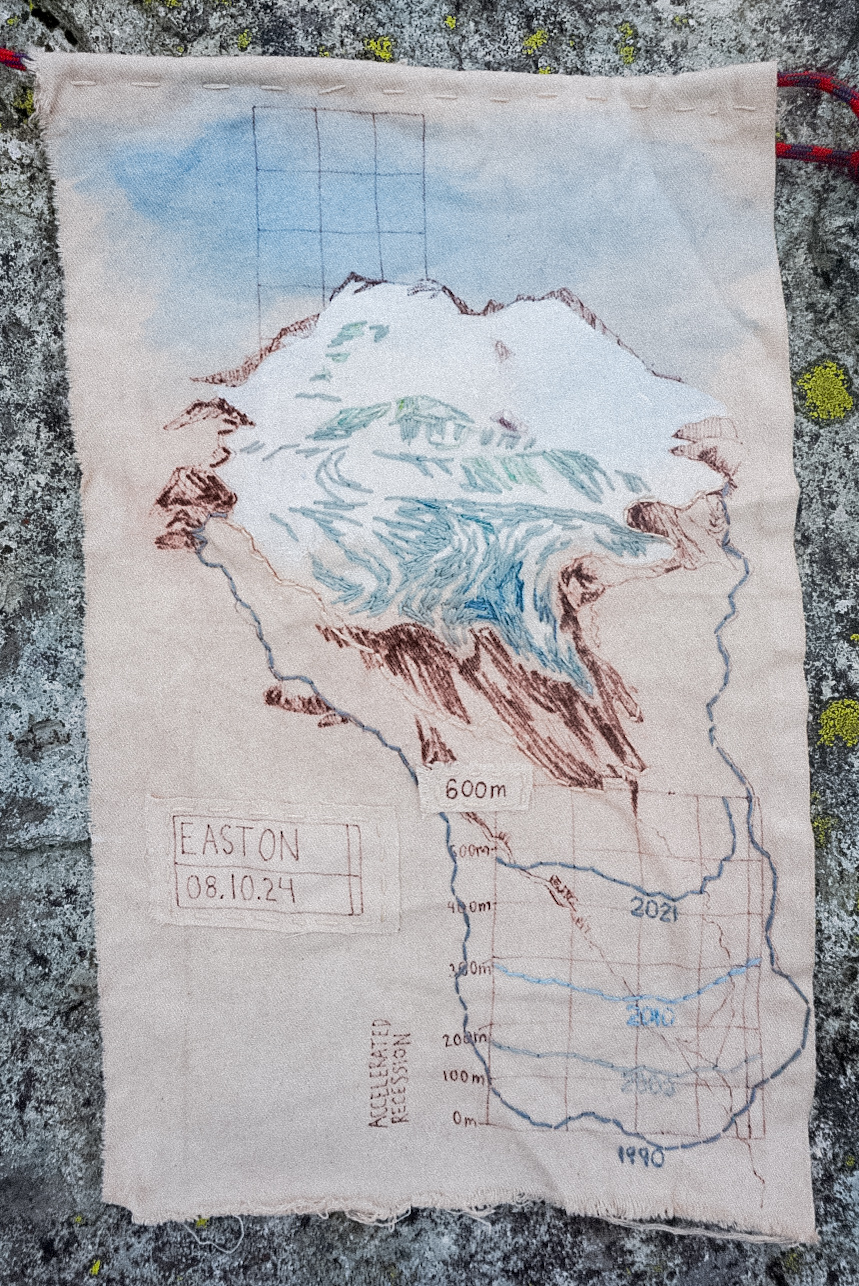
Emma Murray: Just a few minutes into our hike from camp to the Easton glacier, Science Director Mauri Pelto pointed out the rock that marked the spot where he put his crampons on in 1990. Looking up the valley, the ice felt SO far away. This glacier has retreated almost 600m in my lifetime already. In response to the melting at each of the six glaciers I visited during my time with the Project, I added paint, pen, and thread to canvas. These flags are both white-flag surrenders to all the melting we cannot stop and blowing-in-the-wind prayers for us all to act in the ways we can. I hope these pieces help people to visualize and feel the difference between where the ice was and where it is now. I think feeling that loss is groundwork for our urgent conversations about climate solutions, which can be uplifting and cool and pragmatic and creative!
Shari Macy: Mauri Pelto, peers into the melting terminus of the Lower Curtis Glacier; located on the southern slopes of Mount Shuksan in the North Cascades of Washington State. As founder of the North Cascade Glacier Climate Project, he has been measuring these shrinking giants since 1984. This image, to me, shows a man and what he dedicated his life to studying. A passion that drove him to spend over 700 nights in tents, camped out next to the glaciers of the North Cascades. These glaciers could use a lot more people like Mauri. Does everyone need to backpack to remote glaciers every summer? No. He already does. However, we could all be a little more dedicated to the health of our planet, our home. Our one and only. Our children’s one and only.
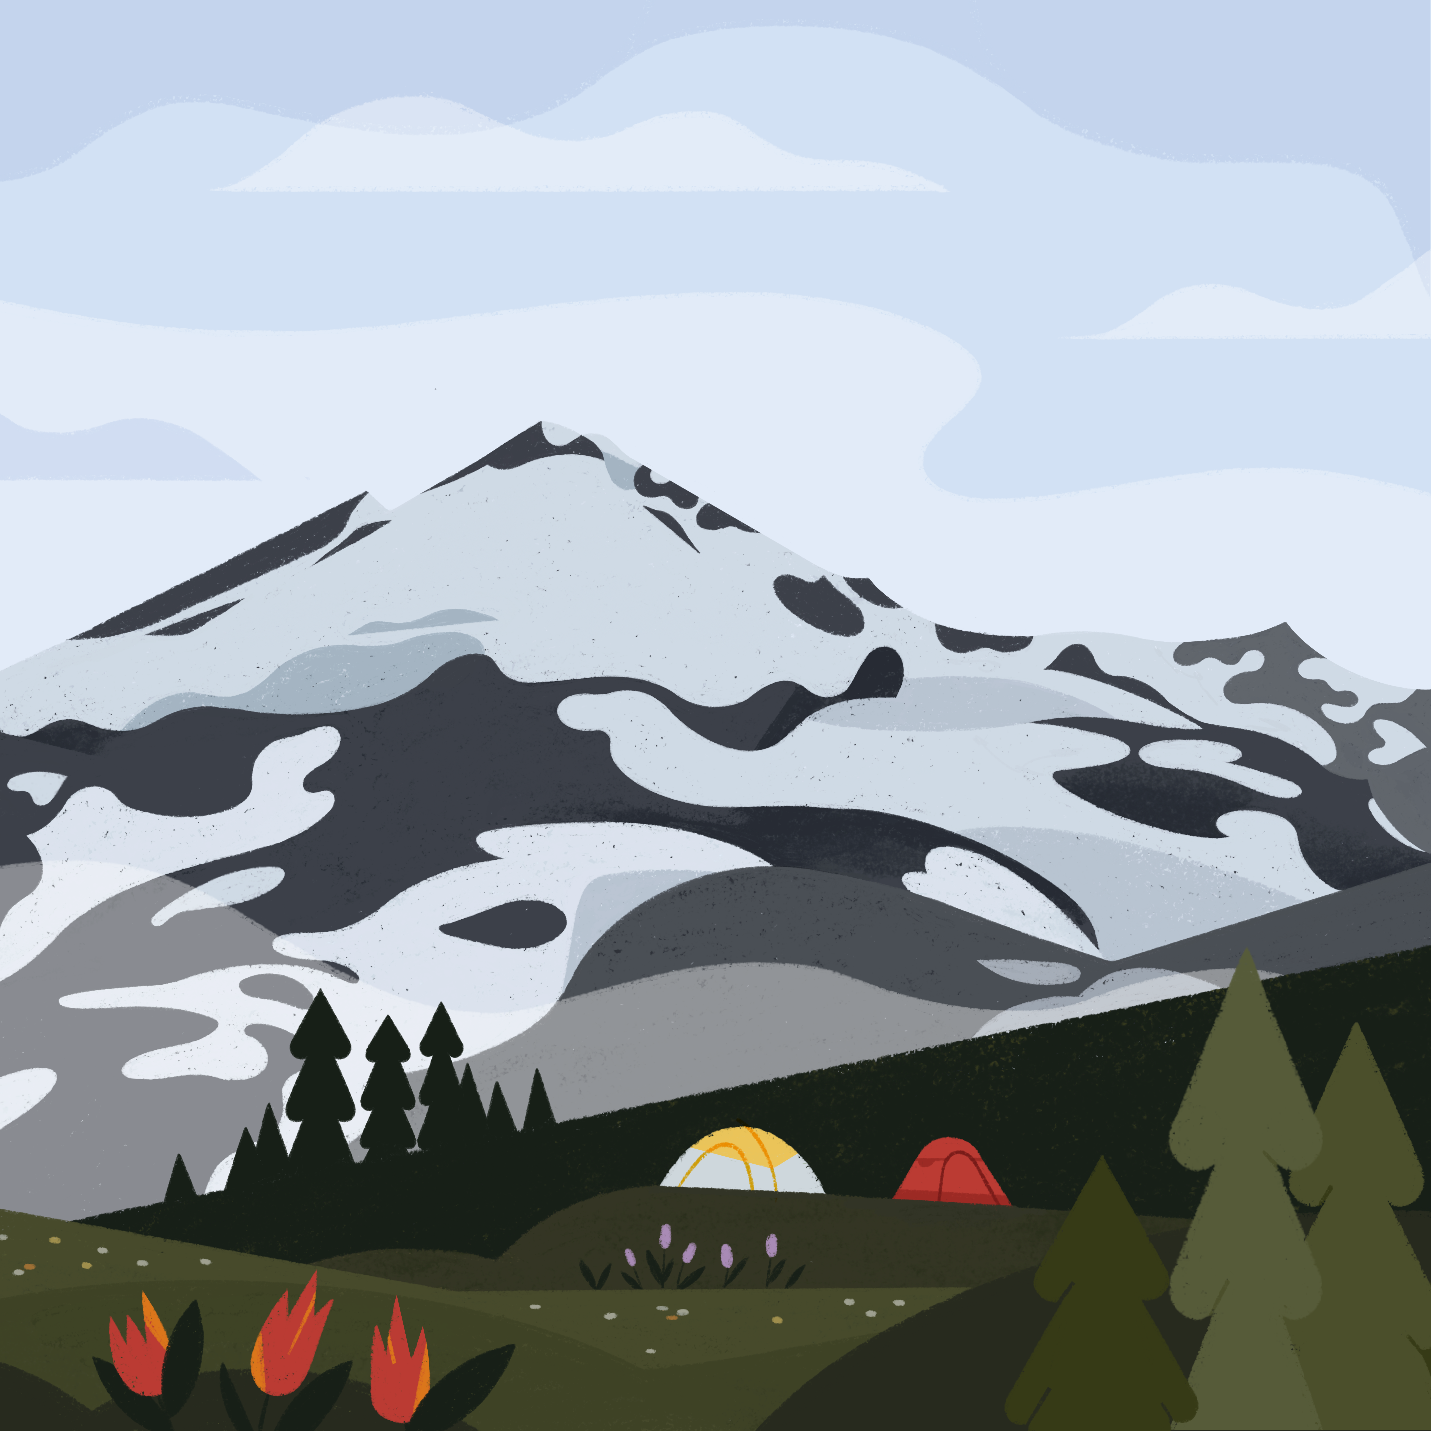
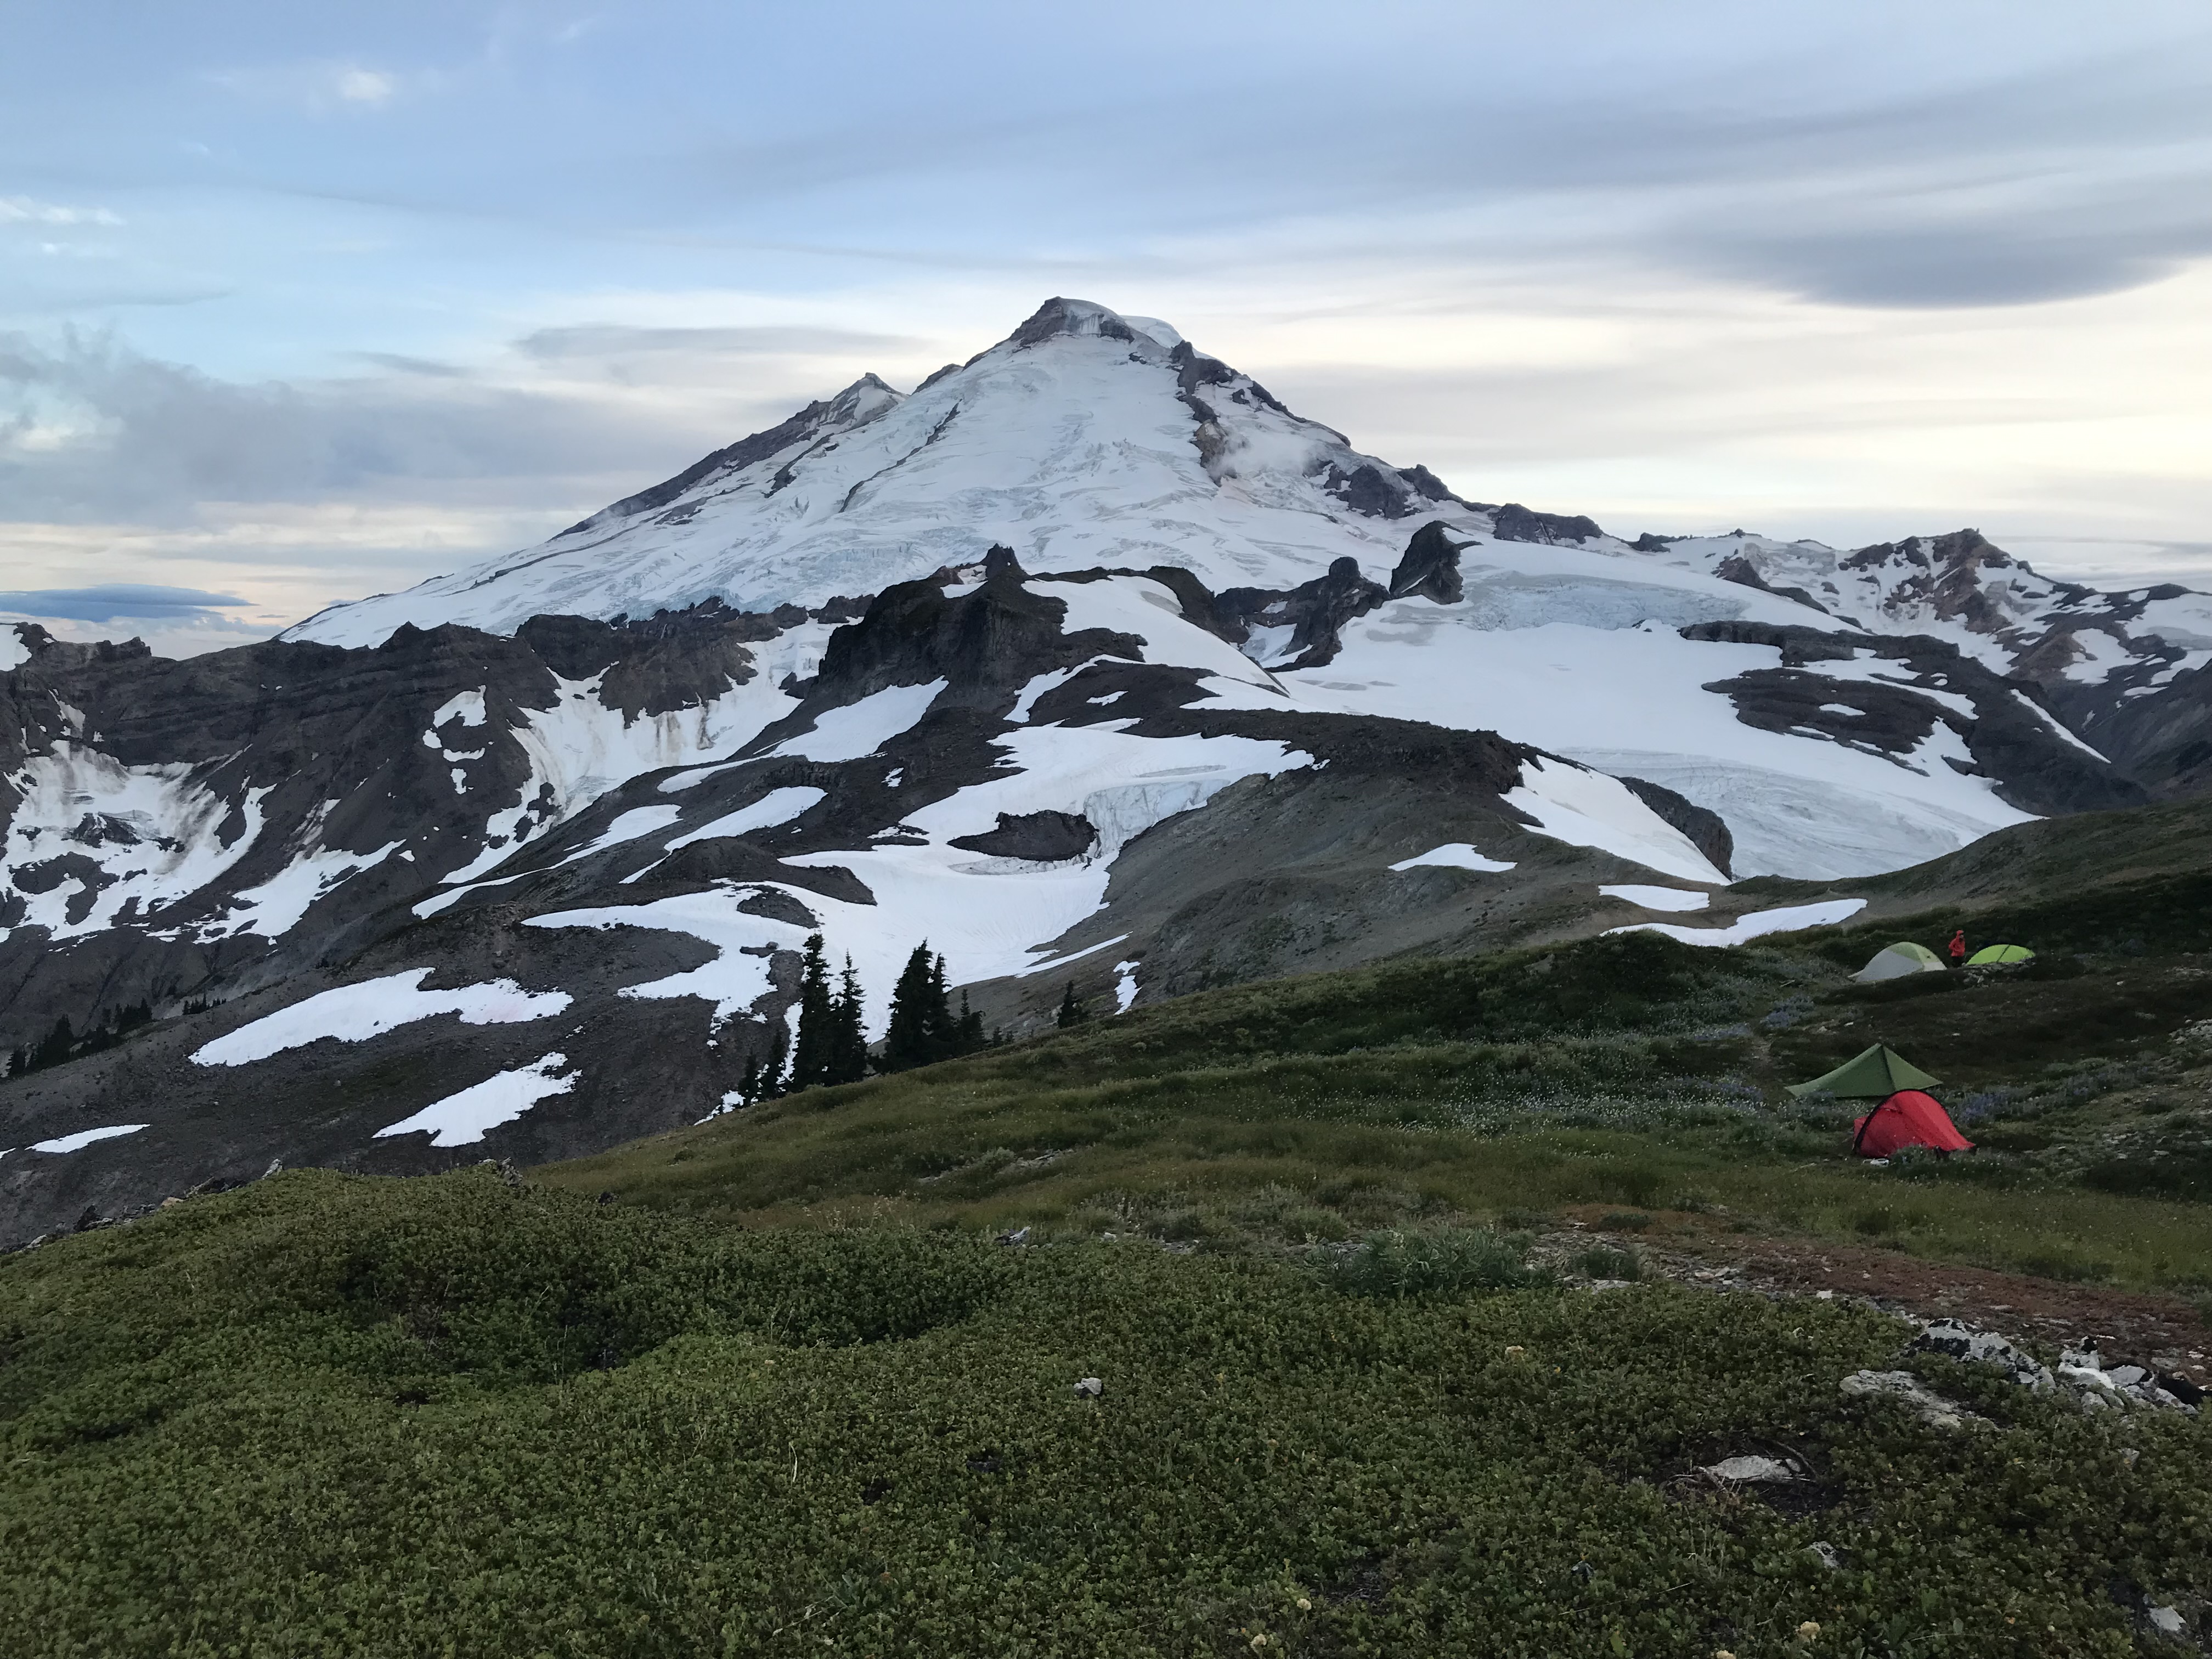
Megan Pelto: To me, Mt. Baker represents the North Cascades. Camping next to its looming presence makes me aware of how impactful it is, its glaciers helping support the ecosystem and the wildlife that surround it. Getting to be present in this wilderness feels like a gift and a chance to both disconnect and reconnect. Everything you have is contained in one little tent and the experience of camping in this landscape is magical. I wanted to capture that with our colorful little tents tucked into grassy hills with Baker above us. I have been able to visit this landscape over the past 10 years, and while the glaciers change each year, many things have remained peacefully the same.
Ben Pelto: Disappearing glaciers remind me of grandparents—I’m saddened by their decline, yet deeply grateful for the time I still have with them. This year, being in the field was especially meaningful, surrounded by an incredible group of people, just experiencing the mountains and soaking it all in. What I find hardest about glaciers vanishing is not just the loss of ice, but the disappearance of their dynamism and beauty from the landscape. These ancient giants bring a sense of magic and power to the mountains, and it breaks my heart to think that my children or grandchildren might never witness them as I have.
Cal Waichler: This season I ask what it means to be a voice for glaciers. How can I transmit my gratitude that I can stand on this earth, breathe glaciers’ breezes, seep in icy blue and alpenglow rose, pop alpine huckleberries in my mouth, and notice the shrinking snow and dissolving ice, while also alerting people to their vulnerabilities? Glaciers are a throughline in my explorations and art. I am so utterly enchanted by them. The awe and creative inspiration they bring to my life is a great gift. As a voice for shrinking glaciers, what stories can I share that will enchant other people with them? What will make us care enough to enact climate change mitigation and adaptation, and vote for climate leaders? Here, a snapshot of those most transient and irreplaceable things.