Burroughs Glacier, Alaska Vanishing

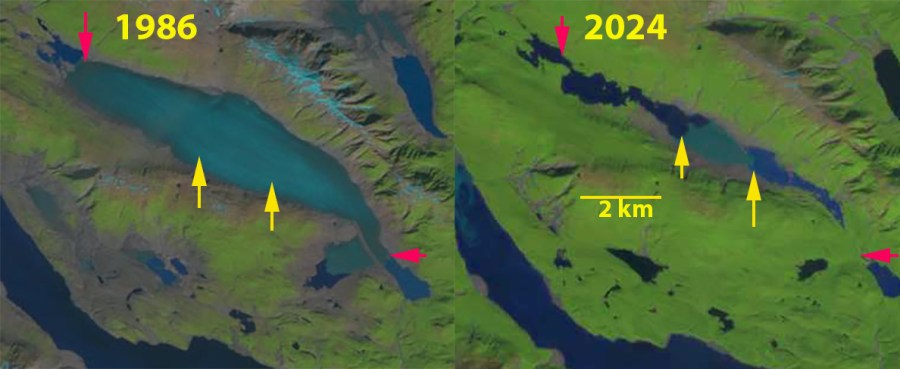
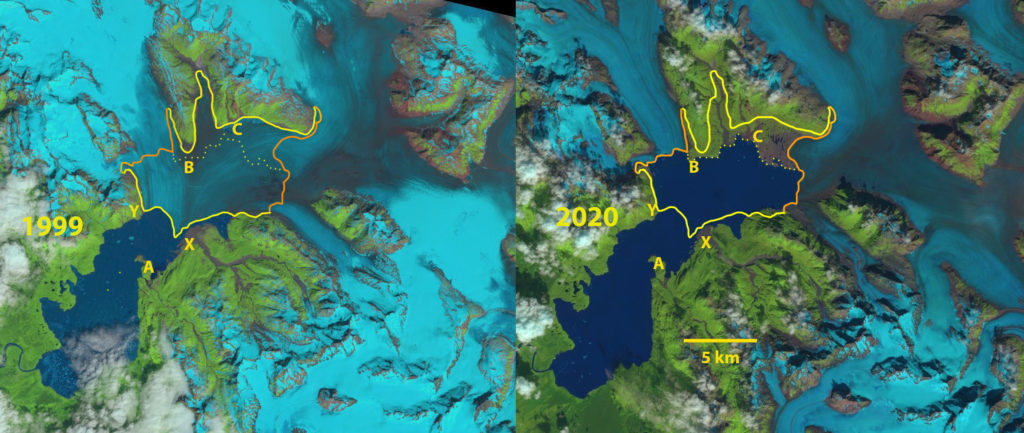
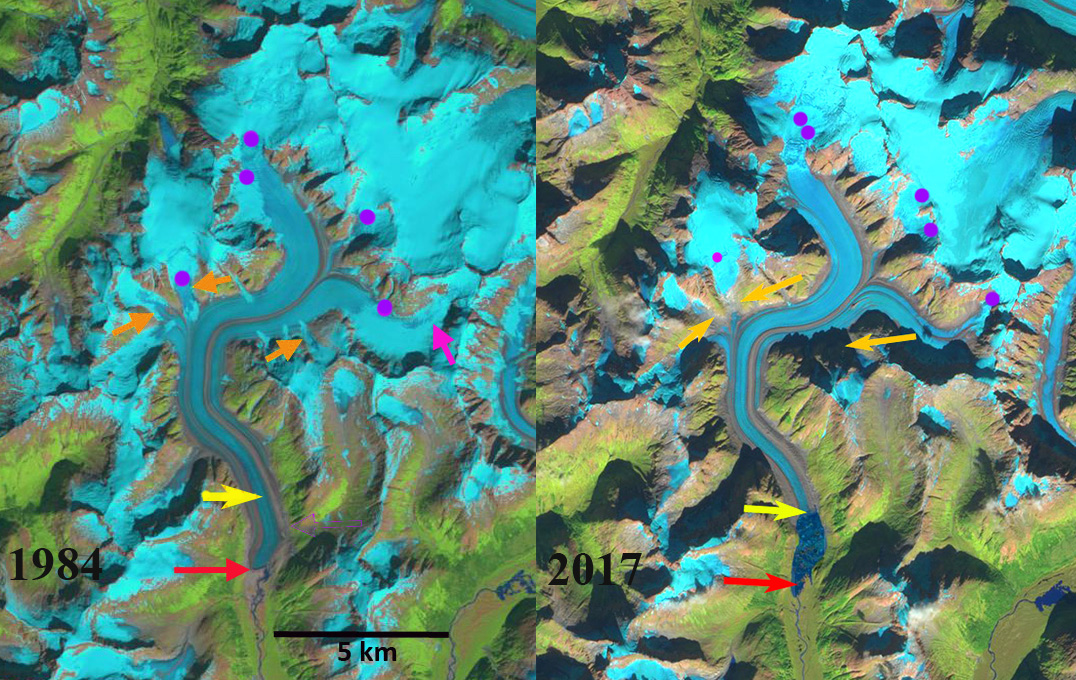
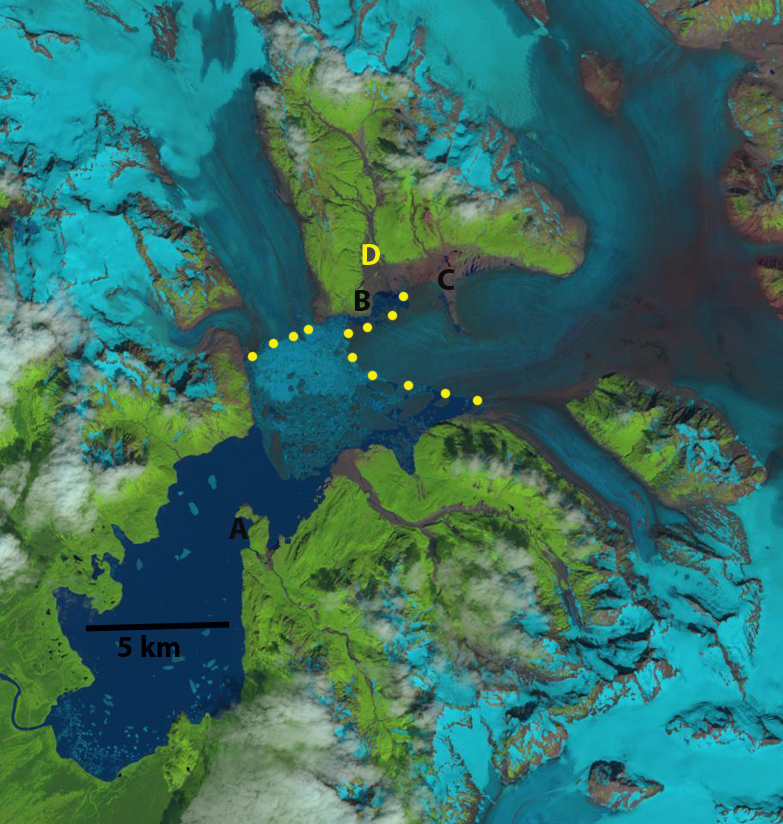
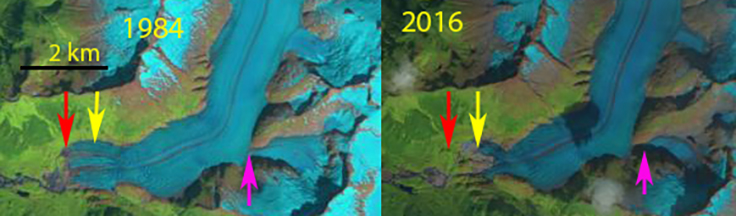
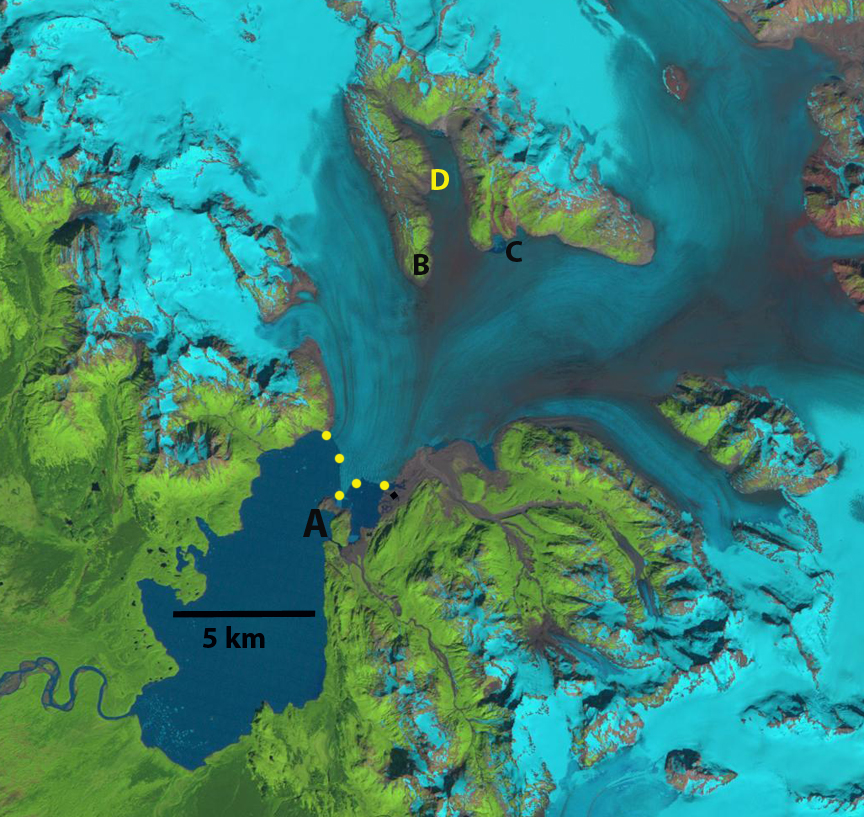
Burroughs Glacier in 1986 and 2024 Landsat images. The red arrow marks terminus in 1986 and yellow arrows the 2024 terminus. Yellow dots mark the outline of the glacier in 2022. Glacier area declined from 12.5  km² to 1.2 km² during this 38 year period.

Burroughs Glacier in Glacier Bay National Park, Alaska has been retreating since 1892 when it was part of the Muir Glacier complex. The glacier is named for naturalist John Burroughs, who accompanied John Muir to the areain 1899 on the Harriman Expedition. The glacier is unusual in that it has not had an accumulation zone this century, where snow persists through the year. Without an accumulation zone a glacier cannot survive (Pelto, 2010)Mickelson (1971) summarized the retreat of the glacier from 1892-1960. In 1892 the Burroughs ice plateau was assessed as a 10 km by 25 km ice cap. By 1960 it had thinned by as much as 750 m and its calving margin had retreated 27 km. In the 1960s crevasse extension were still active (Taylor, 1963). By the end of the 1970’s the glacier was essentially stagnant (Molnia, 2008). In 1982 I briefly visited the western terminus, which provided a still imposing slope, made more so by the rain and clouds lowering onto its surface, active crevasses were still evident indicating some movement. John Burroughs in writing the narrative of the Harriman Expedition noted about vanishing glaciers “It is dead or motionless, and is therefore free from crevasses. Its rim comes down to the gravel like a huge turtle shell and we stepped up on it without difficulty. (page 45)”.

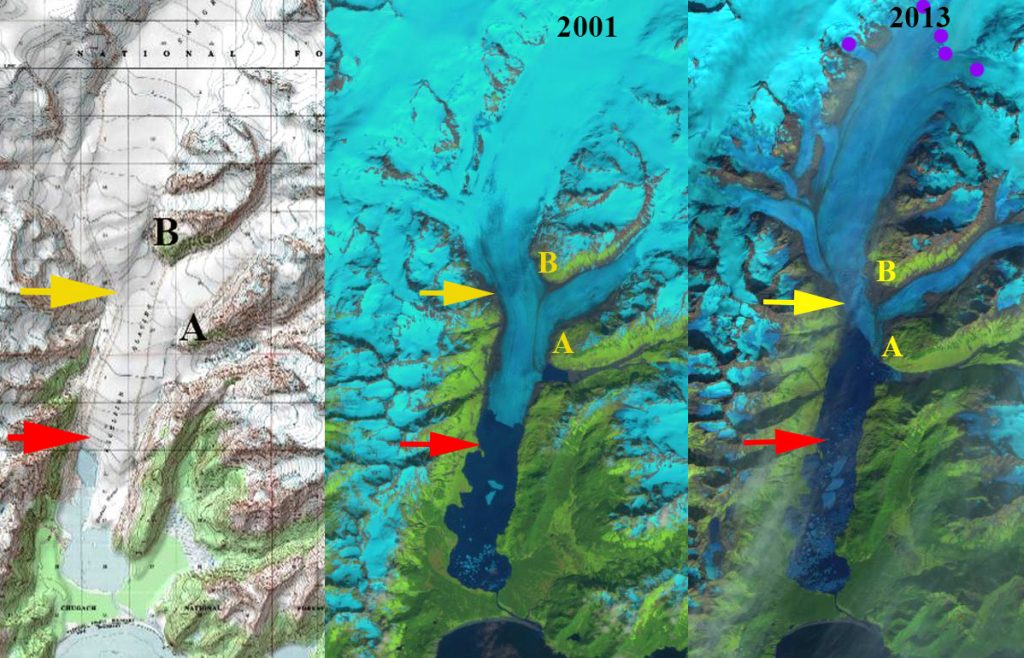
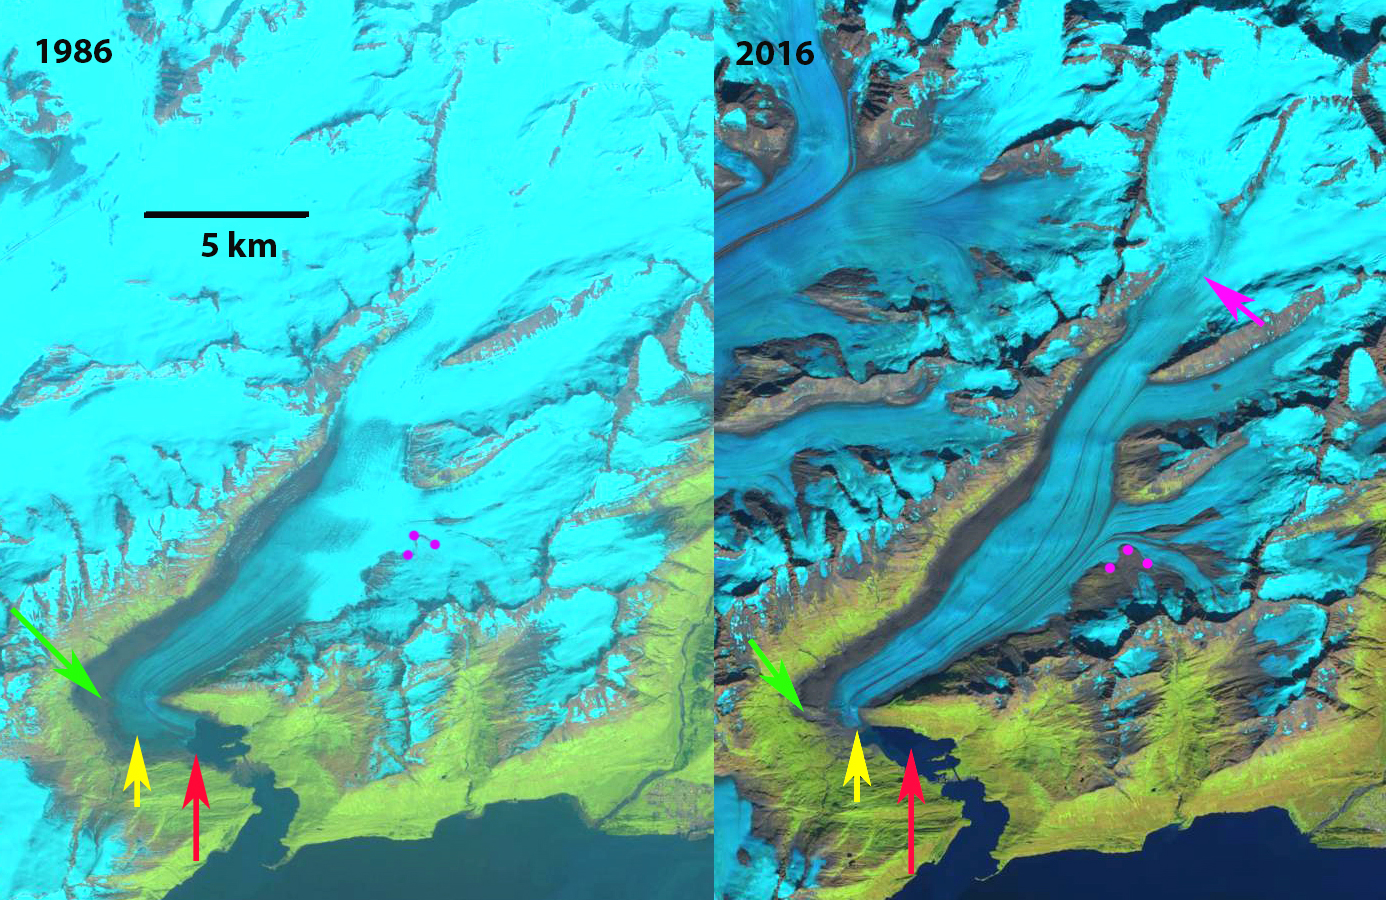
Here we examine the glacier in Landsat imagery from 1986 to 2024to illustrate the retreat, the lack of snowcover  and the thinning. In the 1948 map of Burroughs Glacier, the glacier is 12.1 km long, and much of the glacier is already stagnant, the glacier has both a north and south terminus, purple arrows.

burroughs map

Burroughs Glacier in 1948 USGS map. Purple arrow indicate terminus locations. Former Plateau Glacier (P).

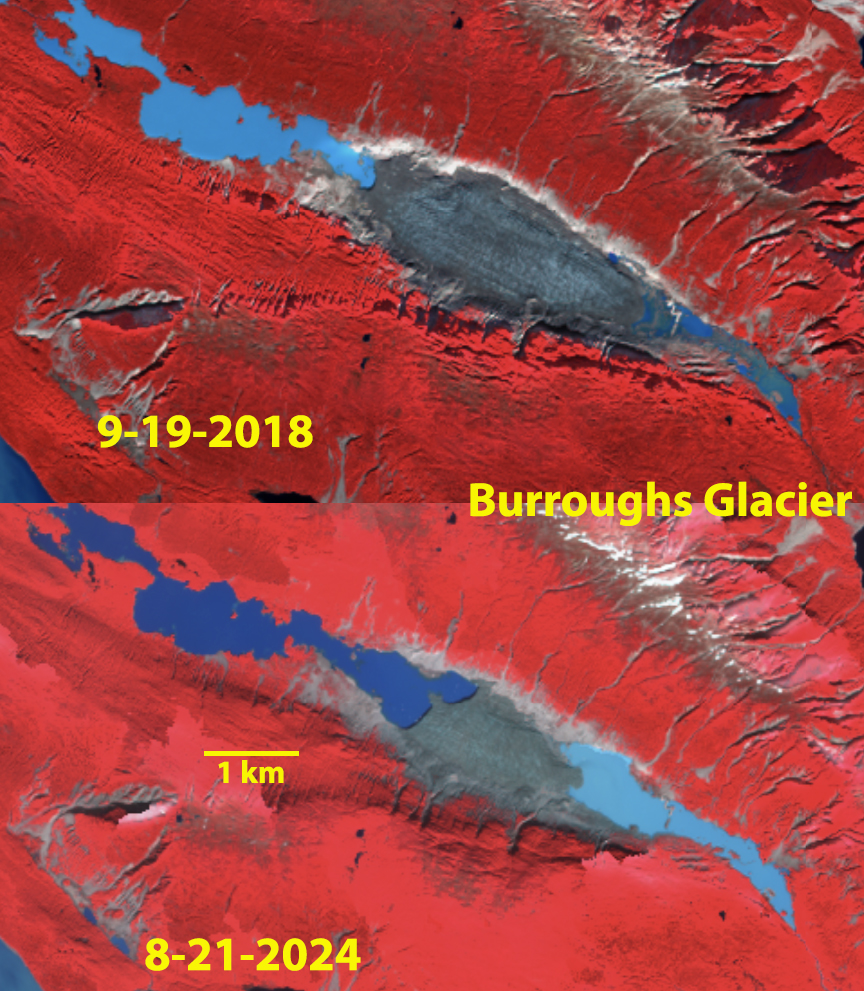
In 1948 Burroughs Glacier has an area of 22 km² and is 12.5 km long, with the crest of the glacier at 425 m. In 1986 Burroughs Glacier has an area of 12.5 km² and has no snowcover by mid-summer. The glacier terminates in proglacial lakes at both the north and south terminus and is 9 km long, purple arrows indicate 1948 terminus. In 2004 Burroughs Glacier again lacks any snowcover. The southern terminus has retreated 2.2 km from the lake, and the northern terminus has retreated into a second lake basin. The glacier is 6.3 km long, half of its length in 1948. In 2010 snowcover is lacking and retreat has continued shrinking the glacier to 5.4 km in length.  The glacier was assessed with an area of 2.9 km² and a median elevation of  313 m (1025 feet) by GLIMS, in 2010.  In 2013 the glacier lacks snowcover in this September Landsat image even though snow has returned to the surrounding mountains. This indicates how far below the snowline the glacier lies. Portions of a glacier are supposed to be the first locations that receive snowcover. The terminus has continued to retreat and the glacier was 4.6 km long in 2013. The northern terminus was retreating into a third basin of the proglacial lake. By 2018 the glacier area has been reduced to 2.7 km², then 1.5 km² in 2022 and 1.2 km² in 2024., 5.5% of its area remaining from 1948, 10% of its area from 1986 and 1% of the 1892 area.  The length of the glacier in 2024 is 2.3 km, only 50% of the length just a decade ago, and ~20% of the 1948 length.

Thinning of this glacier from 1948-2016 is evident from a comparison of topographic maps. Thinning in remaining glacier are averages 225 m during this period, that is a rate of ~3.3 m/year. Larsen et al (2007) had found a thinning rate of ~3 m/year for the 1948-2000 period. Satellite imagery allows identification of glacier area, which declined at a linear rate from 2004-2024, correlation coefficient of 0.98. This his linear rate indicates the glacier will disappear in 2029 or 2030.

Burroughs Glacier has not been in equilibrium with climate the past century. Its retreat has been hastened by the rising snowline of the last decade note by Pelto et al (2013) on Brady Glacier. This glacier area has declined by 90% since 1986, with volume loss being even larger.  Retreat usually increases as elevation declines and as the size of the remnant ice declines. There is no debris cover or persistent snowcover to slow the loss.

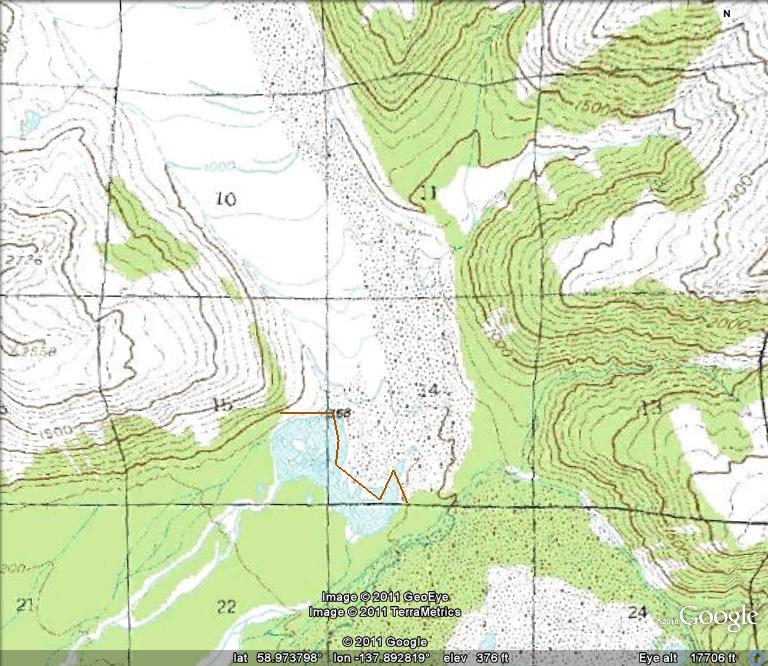
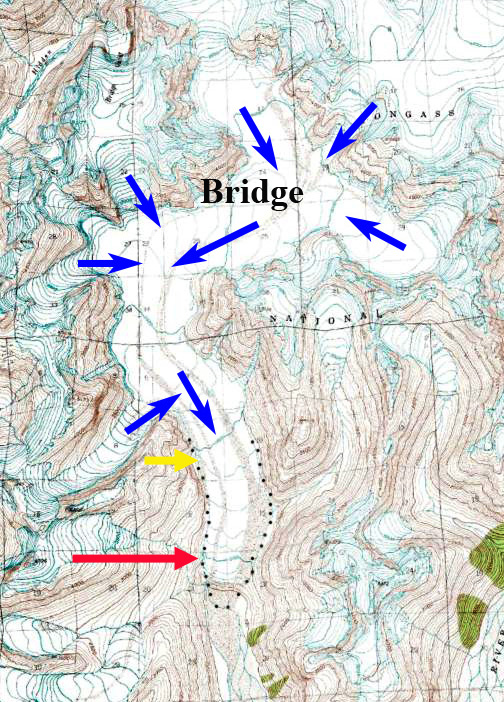
Overlay of 1948 (blue labeled contours) and 2014 elevation map (brown labeled contours) for Burroughs Glacier.

Burroughs Glacier area from Landsat and Sentinel images from 2004 to 2024. This is a strongly linear decrease, that projected beyond 2024 hits bottom in 2029 or 2030.

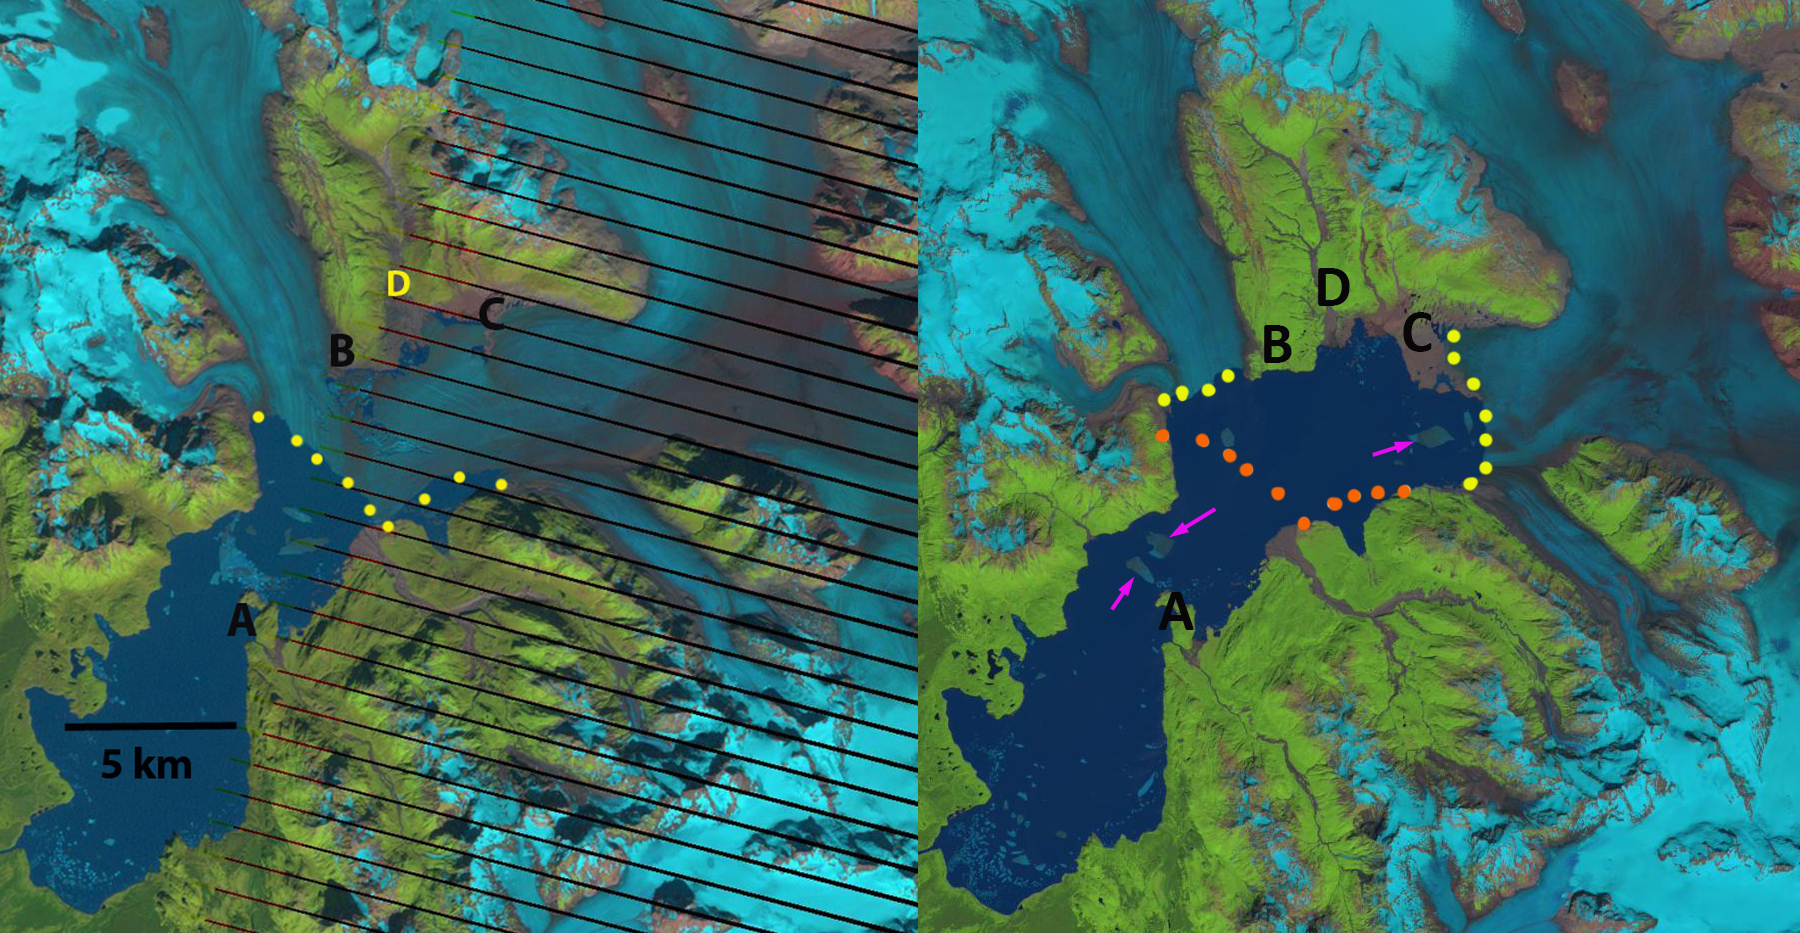
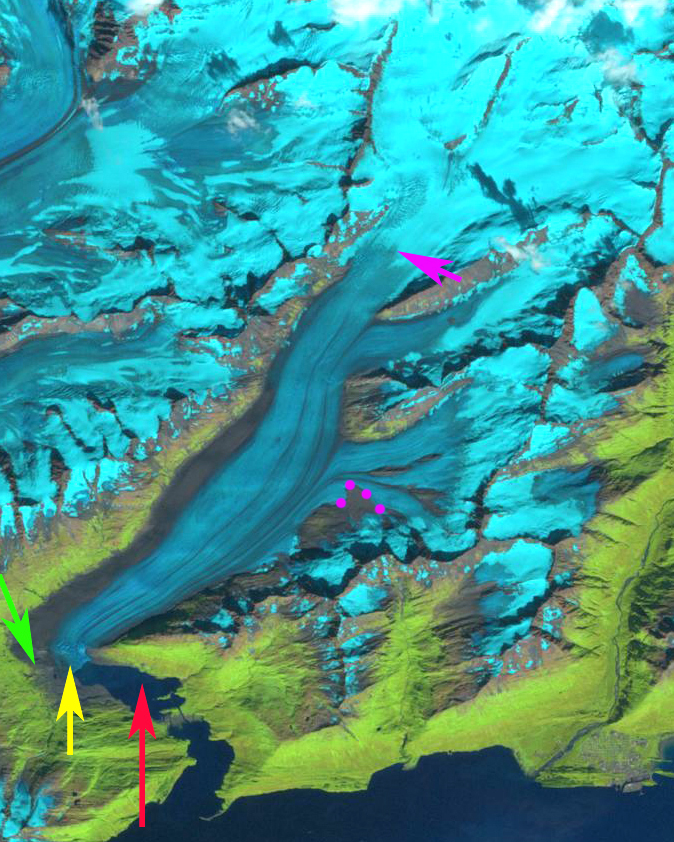
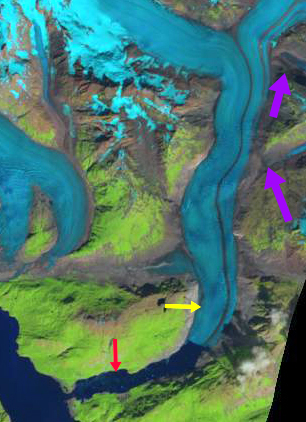
2004 Landsat image of Burroughs Glacier. The red arrow marks the west margin in 1986 and the yellow arrow the east margin.

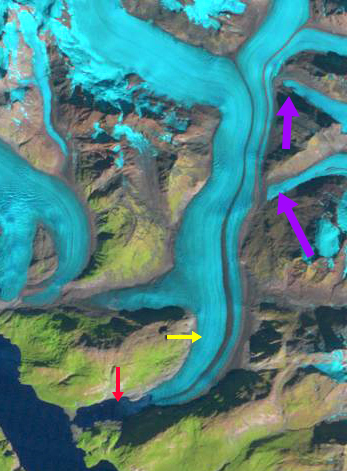
2010 Landsat image of Burroughs Glacier. The red arrow marks the west margin in 1986 and the yellow arrow the east margin.

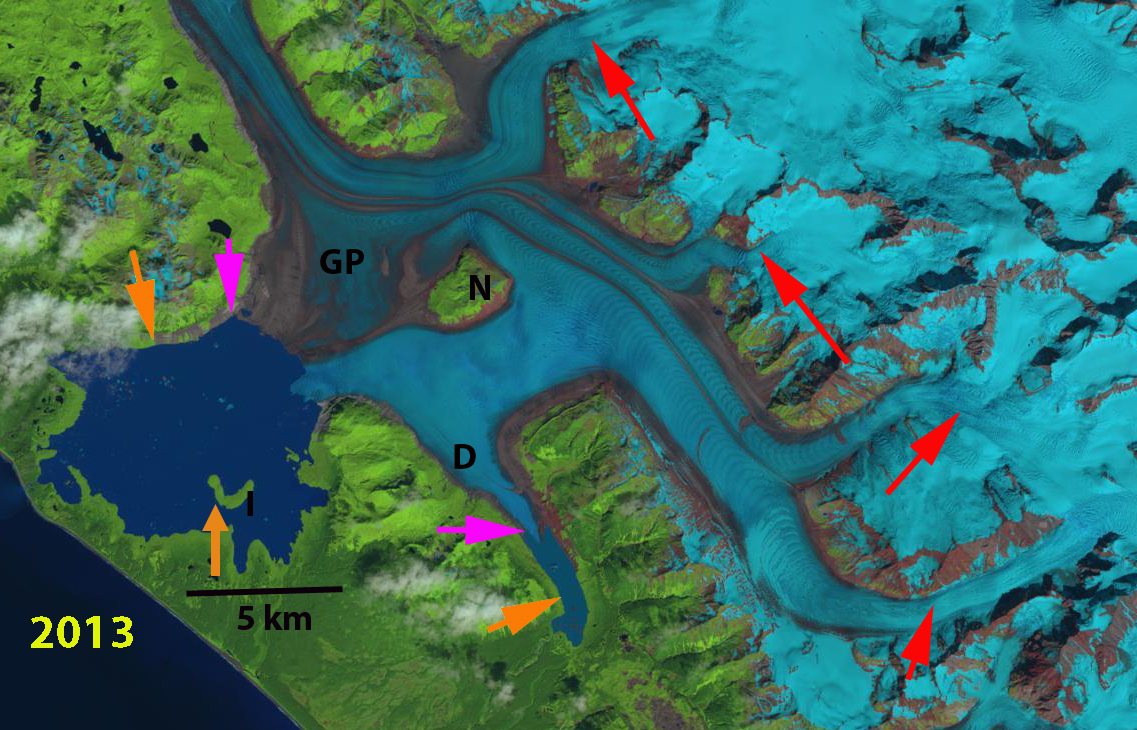
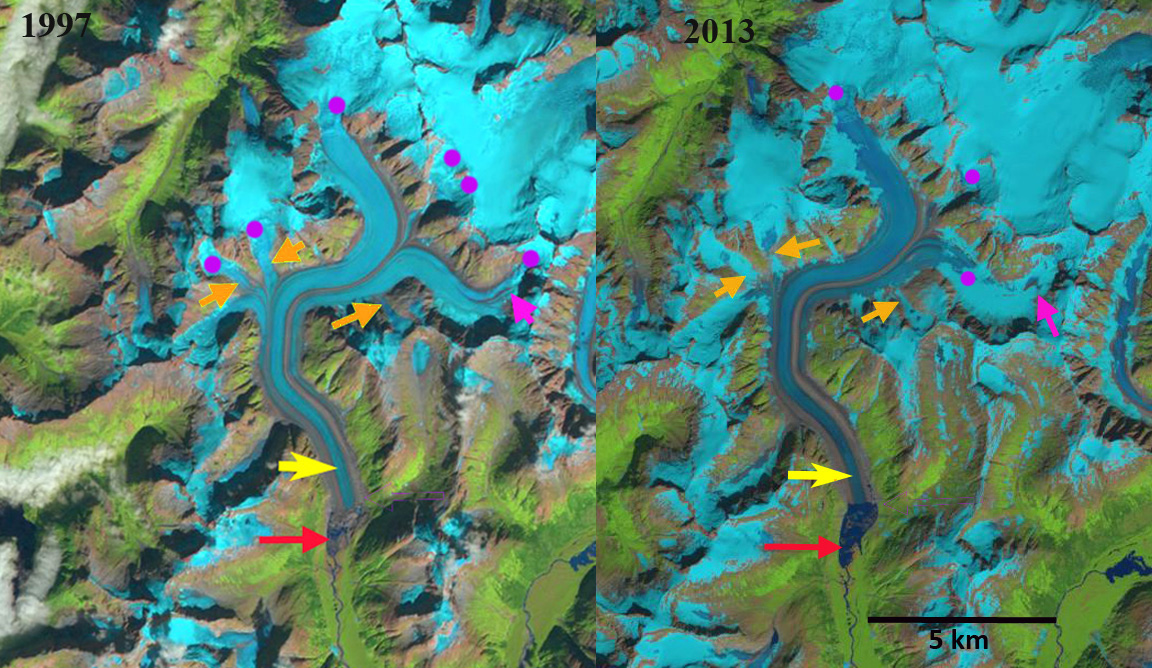
2013 Landsat image of Burroughs Glacier. The purple arrows mark the 1948 margin, red arrow the west margin in 1986 and the yellow arrow the east margin in 1986, pink arrows the 2013 margin.

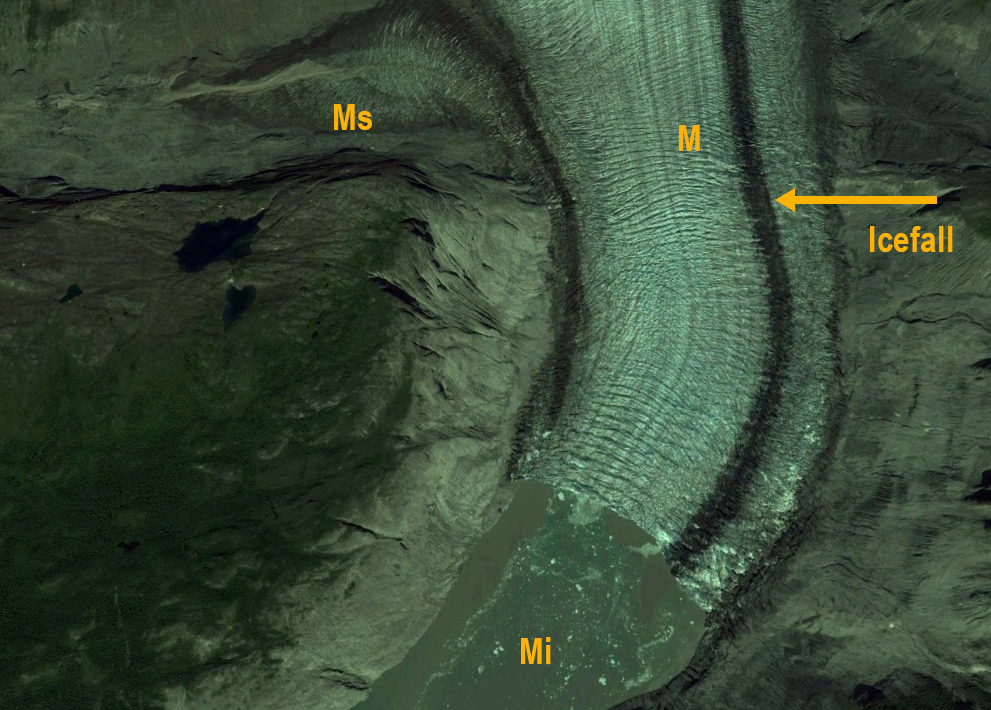
2022 false color Sentinel image of Burroughs Glacier. The ice is dirty but not debris covered at this point, glacier area 1.5 km2.

2018 and 2024 false color Sentinel image of Burroughs Glacier. The ice is dirty but not debris covered. Area declined from 2.7 km2 to 1.2 km2

Glacier Retreat on Yakutat Foreland, Alaska Generates Fastest Lake Growth in United States

Yakutat, Alsek and Grand Plateau Glacier retreat from 1984 to 2024 has led to the three lakes expanding from 130 km2 to 240 km2 as illustrated by this pair of Landsat images. Fastest lake expansion in the nation in this period.

Three adjacent glaciers terminating on the coastal plain near Yakutat, Alaska have had a spectacular retreat in the last 40 years leading to rapid lake growth; Yakutat Glacier, Alsek Glacier and Grand Plateau Glacier. This is the story of the most rapid area of lake growth in the United States this century.

Alsek Glacier descends from the Fairweather Range terminating in Alsek Lake on the coastal plain. In the early part of the 20th century the glacier terminated at Gateway Knob (G) near the outlet of Alsek River from Alsek Lake, with just a small fringing lake present (Molnia, 2005). At that time it had a joint terminus with Grand Plateau Glacier. In 1960 the glacier had a single terminus downstream of an unnamed island in Alsek Lake, that Austin Post (USGS Glaciologisst) told me reminded him of a boats prow. This “Prow Knob” (P) much like Gateway Knob a century ago stabilized the terminus (Pelto, 2017).  The glacier retreated 5-6 km by 1984 from Gateway Knob with the lake growing to an area of 45 km2. From 1984-2024 the retreat has been: 5.3 km for the northern terminus,  5.5 km for the southern terminus and 7.8 km for the northern arm of Grand Plateau Glacier. Alsek Lake has grown from 45 km2 to 75 km2 since 1984. In Octobrer 2024 there remains a narrow connection to Prow Knob that will not survive another year.

Alsek Glacier retreat from 1999-2013 in Landsat images. Red arrows mark the 1984 terminus location, yellow arrows the 2022 terminus location, AR=Alsek River, GP=Grand Plateau, PK=Prow Knob, G=Gateway Knob, A=glacier junction, B=tributary separation, C=tributary separation, D=tributary confluence.

Alsek Glacier retreat from 2018-2021 in Landsat images. Red arrows mark the 1984 terminus location, yellow arrows the 2022 terminus location, pink arrows indicate tributary separation, AR=Alsek River, GP=Grand Plateau, PK=Prow Knob, G=Gateway Knob, A=glacier junction, B=tributary separation, C=tributary separation, D=tributary confluence.

Yakutat Glacier, Alaska experienced a spectacular retreat losing 45 km² from 2010-2018, as a result of rising ELA leading to rapid thinning of the lower glacier (Truessel et al, 2013).  The Yakutat Glacier during the 1894-1895 Alaskan Boundary Survey ended near a terminal moraine on a flat coastal outwash plain. By 1906 the glacier had retreated from the moraine and a new lake was forming, Harlequin Lake.  By 1984 the lake had expanded to an area of 50 km2. The 2018 image compares the 2010 position (yellow dots) with 2018 (orange dots), indicating an area of 45 km² lost in less than a decade (NASA EO, 2018). There are some small icebergs in 2018.  By 2024 further retreat has expanded the total lake area to 105 km2.  The main terminus retreated 7 km. The ability to produce icebergs as large as in 2015 has been lost as the calving front has been restricted by the Peninsula which is now 3 km long, leaving less than a 3 km wide calving front.   The narrower calving front and reduced water depth should in the short term reduce retreat. Truessel et al (2015) modelling indicated a reduced rate of retreat from 2020-2030, which supports the expected reduced calving.  Their model also indicates the glacier will disappear between 2070 and 2110 depending on the warming scenario.  

Expansion of Harlequin Lake due to retreat of Yakutat Glacier indicated on these 2010 and 2018 Landsat images. Yellow dots mark the ice front, orange dots the 2010 margin in 2018.
Expansion of Harlequin Lake due to retreat of Yakutat Glacier, yellow boundary marks the deglaciated region on these Landsat images from 1999 and 2020.

Grand Plateau Glacier drains southwest from Mount Fairweather in southeast Alaska. The glacier advanced during the Little Ice age to the Alaskan coastline. Early maps from 1908 show no lake at the terminus of the glacier. The 1948 map (below) shows three small distinct lakes at the terminus of the main glacier and a just developing lake at the terminus of the southern distributary terminus (D). The distance from the Nunatak (N) to the terminus was 11 km in 1948. The lake at D is 400 m wide.In 2024 the lake area has grown further to 49 km2, as a result of a retreat of 8 km since 1948 and 5.5 km since 1984. Today a second island is emerging at the terminus, Point A. The distributary tongue to the southeast now terminates in a lake that is now 5.2 km long, a 4.8 km retreat since 1948 and 2.6 km since 1984. The combination of higher snowlines and increased calving into the terminus lake will continue to lead to retreat of this still mighty river of ice (Pelto, 2024).

There will be continued glacier retreat and lake expansion in 2025, as the new lake district continues to expand as a result of climate change.  Loso et al (2021) note that retreat of Grand Plateau Glacier will change the outlet of Alsek Lake from Dry Bay to the Grand Plateau Lake, creating one larger lake. 

Grand Plateau Glacier retreat from 1984 to 2013 in Landsat images. Main tributaries indicated by red arrows also showing snowline. Orange arrows indicate 1984 terminus and pink arrows 2013 terminus.

Seward, Alaska Area Coastal Glacier Change 1986-2023

Change in terminus position of coastal glaciers in the Sewqrd region. On this 2023 Landsat image yellow dots are ther 2023 terminus and red dots the 1986 terminus.

Turn east along the coast from Seward Alaska and you are offshore of the Sargent Icefield, turn west and you are offshore of the Harding Icefield. Each has several large glaciers that were either tidewater or end in lakes separated from the ocean by a narrow coastal zone. Here we compare the response to climate change of seven of these glaciers from 1986-2023.

Change in terminus position of coastal glaciers in the Sewqrd region. On this 1986 Landsat image-yellow dots are ther 2023 terminus and red dots the 1986 terminus.

Travelling south down Resurrection Bay and turning east you enter into Day Harbor, at the head of which is the outlet for Ellsworth Glacier. The glacier terminates in an expanding lake that was 3.5 km long in 1986 and in 2023 is 8 km long. The 4000 m retreat generated some large icebers still in the lake.

Elsworth Glacier retreat from 2016-2020 leading to quick lake expansion in Landsat Images

Travelling east from Day Harbor 15 km brings you into Johnstone Bay. Excelsior Glacier termiates just inland from the coast is a rapidly expanding lake. The lake was 5 km long in 1986, and by 2023 is 10.5 km long, a retreat of 5500 m. The glacier has separated with the Roan Glacier terminus to the east retreating from the lake. The Excelsior Glacier terminus currently is steep and nearing the north end of the lake.

Rapid expansion of Big Johnstone lake due to Excelsior Glacier retreat. Map from 1950, Landsat images 2001 and 2013.

Heading south down Resurection Bay on the western shore is Bear Glacier. From 1950-1986 the glacier retreated 160 m, and by 1980 the terminus was calving small icebergs into an ice-marginal lake that was beginning to develop. As thinning continued, much of the terminus became afloat by 2000. Bruce Molnia, USGS observed that passive calving, characterized by the release of large tabular icebergs from Bear’s low gradient, floating terminus became frequent. Between 2000 and 2007, the terminus retreated about 3.5 km, yielding large icebergs that floated in the lake. The amount of calving has declined from the period of more rapid retreat from 2002-2008. Black et al (2022) reported Bear Glacier retreating 5170 m. losing 17.28 km2 of area from 1984-2021. From 1986 to 2024 the glacier has retreated 6200 m, leading to a lake with an area of km2.

The retreat of Bear Glacier from 1986 to 2024 leading to growth of the lake to 22 km2, in Landsat images.

Continuing around Aialik Peninsula and traveling north into Aialik Bay, along the western shore is Pedersen Glacier. The glacier drops quickly from the plateau of the icefield through a pair of icefalls terminating in a lake at 25 meters above sea level.  Giffen et al (2014) observed that Pedersen Glacier retreated slow but steady from 1951-1986 at 706 m (20 m/a) and 434 m (23 m/year) from 1986-2005. Black et al (2022) reported a retreat of 3170 m and loss of 4.25 km2 from 1984-2021. We note a 3500 m retreat from 1986-2023.

Pederse Glacier retreat in Landsat images, leading to rapid lake expasion to 4 km2.

At the head of Aialik Bay is the tidewater Aialik Glacier. This glacier advanced 180 m from 1950-1986.From 1986-2006 the glacier retreated 290 m. Black et al (2022) observed the terminus was stable from 2000-2021 despite ongoing receession of the eastern margin of the glacier.

The Holgate Arm extends off of Aialik Bay on the west shore just south of Pedersen glacier. This tidewater glacier retreated 250 m from 1950-1986. The glacier has had several small periods of advance and retreat since 1986. Black et al (2022) note a period of advance from 2010-2021, the terminus has begun a small retreat from 2021-23 and is now just behind the 1986 position.

Northwestern Glacier is at the head of Northwestern Fjord off of Harris Bay, the next Bay west of Aialik Bay. This tidewater retreated 5200 m from 1950-1986, and an additional 1600 m since 1986. This retreat has led to a separation into two primary arms of the glacier. The rate of retreat has slowed since 2000 and the glaciers tidewater connection is limited, and will likely cease with even further minor retreat.

The Harding and Sargent icefield both have limited accumulation area above 1500 m. This means that they are prone to complete loss with a limited rise in snowline elevation. This is similar to the Juenau Icefield situation, where our research has indicated accelerated losses (APNews).

Grand Plateau Glacier, Retreat, Lake Expansion and Island Formation

Grand Plateau Glacier on June 15, 2024 Sentinel image, illustrating 5.5 km retreat from Island (I) where terminus was located in 1984. N illustrates nunatak the glacier terminated 11 km from 1948 terminus. Point A is new island emerging at terminus. The Lake that barely existed in 1948, has more than doubled in size since 1984 to 49 km2.

Grand Plateau Glacier drains southwest from Mount Fairweather in southeast Alaska. The glacier advanced during the Little Ice age to the Alaskan coastline. Early maps from 1908 show no lake at the terminus of the glacier. The 1948 map (below) shows three small distinct lakes at the terminus of the main glacier and a just developing lake at the terminus of the southern distributary terminus (D). The distance from the Nunatak N to the terminus was 11 km in 1948. The lake at D is 400 m wide.

gp-terminus
USGS 1948 topographic map of area Illustrating three small disconnected proglacial lakes at the terminus (I).
USGS 1948 topographic map of area Illustrating distribuatry tongue
Grand Plateau Glacier in 1984 Landsat image indicating 1984 terminus at orange arrows, 2013

Landsat images from 1984 indicates the fromation of a single connected proglacial lake with an area of 24 km2. Key reference points in each image are the Nunatak, N, and and Island, I. The retreat from 1984-2013 is evident with the orange arrows indicating the 1984 terminus and pink arrows showing the 2013 terminus location. The distance from the Nunatak to the terminus is 8.5 km in 1984 and 4 km in 2013. On the north shore of the lake the retreat between arrows is 2.7 km from 1984-2013. From the island the glacier retreated 3.3 km from 1984-2013, with the lake expanding to 43 km2. The distributary tongue (D) retreated 2.2 km from 1984-2013. The retreat was driven by higher snowlines in recent years, the snowline had been reported at 1000 m in the 1950’s. Satellite imagery of the last decade indicates snowlines averaging 1500 m, red arrows. The glacier snowline is evident in Landsat imagery in 1984 and 2013 red arrows.

In 2024 the lake area has grown further to 49 km2, as a result of a retreat of 8 km since 1948 and 5.5 km since 1984. Today a second island is emerging at the terminus, Point A. The distributary tongue to the southeast now terminates in a lake that is now 5.2 km long, a 4.8 km retreat since 1948 and 2.6 km since 1984. The combination of higher snowlines and increased calving into the terminus lake will continue to lead to retreat of this still mighty river of ice. This retreat parallels that of nearby Alsek Glacier and Yakutat Glacier. The rapid growth of the three lakes since 1984 when I visited them is amazing.

La Perouse Glacier, Alaska Lake Formation Retreat Acceleration

La Perouse Glacier in 2018 and 2023 Landsat images indicating the six developing proglacial lakes (1-6). The lakes in 2023 have a combined area of 1.3 km2. Debris cover has expanded notably at Points D.

La Perouse Glacier flows from the Fairweather Range to the Pacific Coast. The glacier advanced to the coast in the mid-late 19th century and has remained tidewater on the coast since (Gaglioti et al 2019). I first saw this glacier in 1982 and its terminus stretched 3.5 km along the coast, a second terminus ended inland and was 3.2 km wide. Both of the terminus are piedmont fed by a significant accumulation area above 2300 m, that flows through a spectacular icefall from 1100 to 1800 m. This high accumulation zone helps make the glacier more resilent to warming temperature (Pelto, 1987). Berthier et al (2010) noted a ~0.5 m/loss average loss for glaciers in this region from 1962-2006, which has generated this retreat. The glacier because of its size and large piedmont lobe is slow to respond to climate change, 20 km2 coastal lobe and 10 km2 inland lobe.

La Perouse Glacier coastal terminus area indicating the three developing proglacial lakes, yellow arrows. False color Sentinal images.

Up to 2018 the coastal terminus was thinning, but had not experienced significant recession or proglacial lake development. There was significant marginal recession by 2018 exposing a forest overrun by the glacier in the 1860’s (Gaglioti et al 2019). In 2018 the inland terminus had developed 3 proglacial lakes wiyth a combined area of 0.4 km2. By 2023 the inland terminus lakes spread across 90% of the width of the terminus, with a combined area of 0.7 km2. In 2023 the main terminus had developed three proglacial lakes each, #1 at 0.12 km2, #2 at 0.16km2 and #3 at 0.36 km2. Lake #3 has numerous bergs indicating the ability to rapidly expand by calving, due to having a greater water depth. In just five years the debris covered area has expanded notably. This combination of expanding glacial lakes and debris cover is an indication of ongoing rapid decline. The changes here are simialr to that at nearby Brady Glacier and progressing on the same trend as Fingers Glacier. Look for further lake development in 2024 particularly in the coastal lobe.

Baird Glacier, Alaska Terminus Tongue Breaks Off April 2024

Baird Glacier terminus tongue gone in April 26, 2024 Landsat image. Red arrow indicates now joined 5 km2 proglacial lake. Yellow dots terminus of Baird and North Baird Glacier

Baird Glacier drains the west side of the Stikine Icefield in southeast Alaska. It is the only glacier of the Stikine Iceifield that did not retreat significantly from 1960-2010. Pelto et al (2013) predicted the onset of significant retreat of this glacier, which like Brady Glacier had been slow to begin retreat despite thinning that was evident when I visited the glacier in 1984. The proglacial lake that has emerged with retreat has an area of 3.25 km2 and the glacier retreat is 2800 m from 1990-2024. The North Baird Glacier separated from Baird Glacier in 2019, with a proglacial lake extending downvalley to the tongue of Baird Glacier that separated this lake from the Baird Glacier proglacial lake until April 2024.

Baird Glacier in Landsat images from 1990 and 2023 illustrating retreat and proglacial lake expansion.
Baird Glacier in false color Sentinel images from September 10 2023 and May 2 2024. Proglacial lake (PGL) expanded from 3.2 to 5.1 km². Tongue extending upvalley toward North Baird Glacier (NB) broke up in late April, yellow arrow.

Baird Glacier in false color Sentinel images from July 2022 and July 2023. Proglacial lake (PGL) expanded from 3.00 to 3.25 km² width of tongue extending upvalley toward North Baird Glacier (NB) has declined from 700 m to 400 m.

In 1990 the Baird Glacier was sitting on an outwash plain, with no lake at the terminus. The North Baird Glacier was 1 km wide where it joined the Baird Glacier. By 2015 the glacier has retreated 750 m and the lake (PGL) has an area of ~1 km².  In 2022 the glacier has retreated leading to a lake expansion to 3.00 km². In July 2023 the tongue of ice extending across the front of the North Baird Glacier valley has thinned 40% since July 2022. The tongue remained throughout 2023 into April of 2024 before breaking up. This leaves the main terminus of the glacier more vulnerable to further rapid calving retreat. Baird Glacier is catching up to the rest of the Stikine Icefield that has experienced significant retreat, Dawes GlacierPatterson Glacier and Great Glacier. With Sawyer Glacier retreating from tidewater in 2023.

Bridge Glacier, Southeast Alaska Retreat & Lake Formation

Bridge Glacier in Landsat image from 1984 and Sentinel image from 2017. The red arrow indicates the 1984 terminus where no lake exists, yellow arrow is 2017 terminus, orange arrows are selected tributaries and purple dots the snowline. 

Bridge Glacier drains the same icefield as the Wright and Speel Glacier 45 km southeast of Juneau, Alaska. Here we examine the changes in this glacier from 1984-2017 using Landsat and Sentinel imagery.

In 1984 the glacier ended on an outwash plain at the head of a branch of Speel River. The red arrow indicates the 1984 terminus for each image, the yellow arrow the 2017 terminus and the orange arrows three tributaries feeding the glacier.  The purple dots indicate the snowline at 1200 m. In 1984 all three tributary glaciers fed Bridge Glacier and the glacier has no proglacial lake at the terminus. In 1997 a lake basin is beginning to develop, though it is still largely filled by ice. The eastern tributary pink arrow, has lost all of its snowpack. The three tributaries at the orange arrows are connected to Bridge Glacier still and the snowline is at 1250 m. In 1999 the proglacial lake has formed and has length of 1 km, the lake has expanded south and north of the 1984 terminus position, and does not entirely represent glacier retreat.  In 2013 the glacier has retreated 1200 m from the 1984 position and the lake is still expanding. The orange arrows indicate that none of the three tributaries are still connected to the main glacier. The glacier in a sense is losing its income flow from these subsidiaries. The eastern tributary has retained some snowcover with six weeks left in the melt season in 2013, but this is mostly gone a month later, the snowline is at 1100 m. nbsp; Total retreat from 1984 to 2017 is 1900 m. In 2017 the snowline is at 1300 m, and the separation of the tributaries is by more than 500 m in each case. The snowline has been high by the end of each summer from 2014-2017 indicating retreat will continue. The retreat of this glacier is the same story as seen at nearby PattersonGilkey and Norris Glacier.

.

Bridge Glacier in Landsat images from 1997 and 2013. The red arrow indicates the 1984 terminus , yellow arrow is 2017 terminus, orange arrows are selected tributaries and purple dots the snowline. 

Bridge Glacier in USGS map when it ended on the outwash plain in 1948.


Pedersen Glacier, Alaska Rapid Retreat 1994-2015

Pedersen Glacier Kenia Peninsula, Alaska retreat from Landsat images in 1994 and 2016. The red arrow indicates 1994 terminus, yellow arrow is 2016 terminus, orange arrow indicates northern tributary and purple dots indicates snowline. 

Pedersen Glacier is an outlet glacier of the Harding Icefield in Kenai Fjords National Park near Seward, Alaska. The glacier drops quickly from the plateau of the icefield through a pair of icefalls terminating in a lake at 25 meters above sea level.  The Harding Icefield glaciers that drain east are in the Kenai Fjords National Park, which has a monitoring program.  Giffen et al (2014) observed that from 1950-2005 all 27 glaciers in the Kenai Icefield region examined retreated.  Giffen et al (2014) observed that Pedersen Glacier retreated slow but steady from 1951-1986 at 706 m (20 m/a) and 434 m (23 m/year) from 1986-2005. Here we compare a 1994, 2013, 2015 and 2016 Landsat imagery illustrating a rapid increase in retreat rate from the previous periods.

In 1994 the terminus proglacial lake at the terminus is small and much of the terminus is on land.  The snowline in 1994 is at 550 m.  The tributary entering from the north, orange arrow, is 400 m wide as it reaches Pedersen Glacier.  In 2005 the Google Earth image below indicates extensive terminus crevassing, indicating substantial terminus velocity, and that the retreat is driven by calving.  In 2005 the lake is now 1.1 km long on its center axis.  By 2015 the glacier has retreated 2600 m since 1994, a rate of 125 m/year, much faster than before.  The snowline is average 800 m.  The northern tributary is now barely reaching the main glacier and has a width of 150 m. Note there was a medial moraine separating the tributary from the main glacier in 1994 and now this is merely a lateral moraine. This tributary is not particularly impacted by calving losses and indicates a rising snowline is also a source of mass loss for the glacier. A comparison of the 2013, 2015 and 2016 terminus indicates the recession has remained rapid.  The glacier is approaching the base of an icefall that would represent the inland limit of the lake and the end of rapid retreat.  The snowline in 2013 averages 850 m and is at 800 m on Sept. 30 2016. The glacier follows the pattern of nearby Bear GlacierYakutat GlacierHarris Glacier and the inital phase of retreat on Brady Glacier.

Pedersen Glacier Kenia Peninsula, Alaska retreat from Landsat images in 2013 and 2015. The red arrow indicates 1994 terminus, yellow arrow is 2015 terminus, green arrow indicates 2016 terminus and purple dots indicates snowline. 

Pedersen Glacier in 2005, note crevassing at the terminus, pink arrow. The northern tributary is indicated by orange arrow and green arrow indicates 2016 terminus position. 

Yakutat Glacier Terminus Collapse, 10 km retreat 1987-2016

Landsat images from 1987 and 2016 with terminus indicated by yellow dots. Point A indicates the 1987 terminus location and Point E the 2016 terminus location. 

The Yakutat Glacier during the 1894-1895 Alaskan Boundary Survey ended near a terminal moraine on a flat coastal outwash plain. By 1906 the glacier had retreated from the moraine and a new lake was forming. Harlequin Lake. Surveys of the terminus of the glacier indicated a retreat of 1 kilometer in that decade. From 1906-1948 the glacier retreated an additional 5 km. From 1948-1958 the glacier retreated 3.6 km. The retreat is evident in comparing the Yakutat B-3 quadrangle, from 1958 photography, and Landsat imagery from 1987, 2010, 2013 and 2016. Points A-E are the same in each image and the yellow dots are the terminus. In 1987 the terminus was just retreating from a peninsula marked A, the valley at D was filled with ice, there was no break in the surface at C and B was well inland of the terminus. By 2010 the glacier had retreated from A, the valley at D was deglaciated, a small strip of bedrock-sediment was exposed at C from what had been beneath the glacier, and B was still well inland of the terminus. By 2013 the northern arm of the glacier had retreated 6.4 km from the peninsula at A toward the peninsula at B. The central arm of the glacier toward C had retreated 7.5 km and the retreat on the southern edge of the glacier was 6.5 km. The glacier had retreated on average more than 6.6 km in 27 years, a rate of 240 m/year.  From 2013 to 2016 the glacier had retreated from Point B to Point C on the northern side and to Point E on the southern side this is a distance of 10.2 km in thirty years 340 m/year. 

Recently the glacier has been the focus of a study by the University of Alaska, Faribanks they have set up a time lapse camera to record frontal changes. The goal is to understand the controls on calving into Harlequin Lake of this glacier. More amazing than the retreat has been the observed thinning of the glacier. The glacier has thinned by more 200 m on average according to the preliminary thickness change maps from the UAF project (Truessel et al 2013) and updated by Truessel et al (2015). The Yakutat Glacier does not have a high accumulation zone and the recent increase in the snowline elevation and thinning of the glacier have led to a substantial shrinking of the accumulation zone and thinning of the glacier in the accumulation (Truessel et al 2013). This glacier does not have a persistent significant accumulation zone and cannot survive (Pelto, 2010), Truessel et al (2015). modelling suggests the glacier will disappear between 2070 and 2110 depending on the warming scenario.  For a calving glacier to be in equilibrium it needs to have at least 60 % of its area snowcovered at the end of the summer. The glacier is in the midst of a large ongoing retreat. The retreat rate and calving mechanism is similar to that of Grand Plateau Glacier, Bear Lake Glacier and Gilkey Glacier. However, unlike these Yakutat Glacier lacks an accumulation zone, a better analog is East Novatak Glacier, which also has a lower elevation accumulation zone.


Yakutat terminus map


2010 Landsat image with terminus indicated by yellow dots.


2013 Landsat image with terminus indicated by yellow dots.


Shoup Glacier, Alaska Retreat, Thinning, Velocity Decline

Shoup Glacier comparison in 1986 and 2016 Landsat images.  The glacier retreated 1900 m in this interval.  Red arrow is 1986 terminus, yellow arrow the 2016 terminus, green arrow rock rib emerging from beneath glacier, purple dots a landslide deposit, and purple arrow the snowline.

Shoup Glacier is between the Columbia Glacier and Valdez draining from the Chugach Mountains in southern Alaska.  The glacier was a tidewater terminating glacier until 1953 (McNabb et al, 2014).  From 1985 to 2011 McNabb et al (2014) noted a 1.7 km retreat.  The retreat was enhanced by significant lacustrine calving in an expanding tidal lagoon.  Here we examine Landsat and Sentinel images from 1986-2016 to identify recent and potential future changes.

In 1986 the glacier extends to the red arrow in the midst of a tidal lagoo. The glacier is 2.5 km wide at the sharp bend in the glacier 2.5 to 3 km from the terminus, green arrow.  There is significant crevassing at this bend indicating an increase in slope.  There is an landslide/avalanche deposit near the junction with a tributary, purple dots.  By 2002 the glacier has retreated 1.5 km since 1986, the minor ice cliff at the terminus indicates the glacier ends in shallow water near the end of the tidal lagoon.  The glacier is now 2 km wide at the sharp bend.  The landslide deposit, purple dots,  has shifted little since 1986. The snowline is at 1200 m in 2002.  By 2016 the glacier has retreated an additional 400 m since 2002, 1900 m since 1986.  The glacier no longer terminates in the lagoon.  A bedrock rib at the sharp bend has been exposed and the glacier is only 500 m wide now and this bend is just 500 m from the terminus, green arrow.  A closeup of this rib in a 2016 Sentinel image indicates why the crevassing had occurred, it is also clear this is an extension of the ridge that runs east from the glacier.  This is a band of erosion resistant rock.  This suggests that a basin exists above the this bedrock rib/ridge and a new lake will form.  The glacier slope from the green arrow for the next 2 km upglacier is quite low 1/40, again indicative of a basin beneath the lower glacier.  There is an increase in crevassing 2 km above the current terminus,  suggesting another increase in surface slope and the probable limit of the basin.  In 2016 the snowline is at 1250 m.  The landslide deposit remains little changed since 2002, indicating a low velocity in this region.  Burgess et al (2013) indicates the velocity of the Shoup Glacier near the terminus is in the range of 100 m annually.  The tributary is clearly significantly less. The low velocity, thinning and retreat indicates the glacier is continuing to lose volume via surface melting, despite no longer calving as Larsen et al (2015) have indicated is the prime mechanism for ice loss.  The retreat of this glacier is similar to that of nearby Valdez Glacier.

Shoup Glacier comparison in 2002 Landsat image.  Red arrow is 1986 terminus, yellow arrow the 2016 terminus, green arrow rock rib emerging from beneath glacier, purple dots a landslide deposit, and purple arrow the snowline.

Shoup Glacier terminus in 2016 Sentinel 2 image.  Green arrows indicate rock rib. 

Herbert Glacier Retreat, Alaska 1984-2016

herbert compare 2016

Comparison of Herbert Glacier terminus position in Landsat images from 1984 and 2016. Red arrow 1984 terminus, yellow arrow 2016 terminus and pink arrow a tributary that has separated. 

Herbert Glacier drains the west side of the 4000 square kilometer Juneau Icefield in Southeast Alaska.  It is the glacier just north of the more well known Mendenhall Glacier and just south of Eagle Glacier.  It is also the first glacier I ever visited, July 3, 1981 during my first field season with the Juneau Icefield Research Program.  Here we examine the changes from the August 17, 1984 Landsat 5 image to a Sept. 1, 2016 Landsat 8 image.

The glacier descended out of the mountains ending on the coastal plain in 1948.  In 1984 we examined the terminus of this glacier, which was in the small proglacial lake at 150 m.  Herbert Glacier has retreated 600 m since 1984.  The width of the terminus has also declined. The pink arrow indicates a tributary that no longer feeds the main glacier.  The retreat has not been enhanced by iceberg calving as is the case at Mendenhall Glacier. The overall retreat is also less than Eagle Glacier. In the Google Earth images below from 2005 and 2013 the retreat is 200 m, the terminus has fewer crevasses in 2013 suggesting a reduced velocity and faster retreat to come. The annual equilibrium line on the glacier has averaged 1150 m from 2003-2016. By contrast in August 1984 I skied to the top of the icefall and could see the snowline was at 1000 m. This leaves the glacier with an AAR of 0.45, too low to sustain equilibrium, retreat will continue. In 2015 and 2016 the snowline rose to over 1400 m by the end of the melt season, indicating two years of large mass loss, which will drive further retreat. The higher snow line elevation has been observed across the icefield Pelto et al (2013).herbert tsl

Transient snow line in Early Sept. of 2015 and 2016.  The snow line is at the top of the icefalls, at 1400-1450 m. 

herbert 2005

2005 Google Earth Image, red line is 2005 margin, yellow line is 2013.

herbert 2013 ge

2005 Google Earth Image, red line is 1984 margin, yellow line is 2005.herbert glacier 2012

Herbert Glacier Terminus in 2012 

McBride Glacier Increased Retreat and Harbor Seals, Glacier Bay, Alaska

mcbride compare

McBride Glacier (M), its secondary terminus (Ms), MCbride Inelt (MI) and Riggs Glacier (R) in Landsat image comparison from 1985 and 2015.  The red arrows indicate the 1985 terminus location and the yellow arrows the 2015 terminus location.  Main terminus 4.4 km retreat, secondary terminus 2.7 km retreat.

McBride Glacier was part of the Muir Glacier complex in Glacier Bay, Alaska, until the 1960’s when it separated from Muir and adjacent Riggs Glacier.  Riggs Glacier and Muir Glacier are no longer calving tidewater glaciers, while McBride has continues to terminate in a tidewater inlet.  Riggs Glacier’s retreat from the sea was complete by 2009.The continued rapid retreat of McBride Glacier is enhanced by calving. Calving generates icebergs, the number of icebergs has had a direct relationship with number of harbor seals. The number of harbor seals observed has declined substantially in Glacier Bay since 1993 (Glacier Bay NPS).  In particular the population has declined in front of Muir Glacier which no longer calves, while a smaller population has remained in front of McBride Glacier (Womble et al, 2010).  Here we examine Landsat imagery from 1985 to 2015 to quantify the retreat and estimate how long until this glacier too will no longer calve.

Inn 1985 the main glacier terminated 1.3 km from Muir Inlet, with a narrow connecting stream to Muir Inlet.  The secondary terminus extended west down a separate valley, 3.75 km from the main glacier nearly reached the Riggs Glacier. The snowline was at 900 m.  By 1996 the main terminus had retreated 1.1 km, and the connection with Muir Inlet had expanded to 200 m.  The secondary terminus had narrowed but still nearly reached Riggs Glacier. There are two tributaries from the east at purple arrows connected to main glacier. By 2013 the glacier has retreated an additional 2.0 km and reached a northward turn in the inlet, The secondary terminus had mostly disappeared extending only 1.25 km from the main glacier.  The eastern tributaries, purple arrows, had both retreated and detached from main glacier. By 2015 the glacier had retreated 4.4 km since 1985 including 1.3 km since 2013.  The glacier now terminates at the head of a 6 km long inlet. The glacier is still actively calving, which is good for the harbor seals.  However, a small icefall 0.8-1.1 km from the current terminus indicates a possible location for the end of the tidewater portion of this valley, note orange arrow in Google Earth image below. The retreat of the secondary terminus has been 2.7 km during this same period, without any calving. In 2013 and 2015 the snow line was above 1000 m, which as on nearby Brady Glacier is well above the equilibrium average which will continue to drive retreat Pelto et al, 2013).  In 2016 southeast Alaska has had its hottest spring, which will continue this chapter.

Counting harbor seals is a task completed by the Glacier Bay NPS, they follow two populations the larger in John Hopkins Inlet off of Glacier Bay and the other in Glacier Bay proper.  Both have declined by over 80% since 1992.  In 2009 there were 200 harbor seals in McBride inlet Glacier Bay NPS.  Glaciers are part of the local ecosystem where they exist, glacier changes do result in broader ecosystem changes, in this case harbor seals is one monitored example.  The NPS prepares annual reports on glacier change in the region and notes widespread thinning in the region since 1995 and a 15% decline in glacier area in the last half century Loso et al (2014). The team of N.Loso, A.Arendt, C Larsen, N.Murphy and J.Rich have produced annual reports in recent years with valuable detail on changes of glaciers across Alaskan National Parks.

mcbride Glacier 2013

1996 Landsat image indicating terminus positions from 1985, read arrow and 2015 yellow arrow.  The purple arrow indicates tributaries attached to main glacier.

mcbride Glacier 1996

2013 Landsat image indicating terminus positions from 1985, read arrow and 2015 yellow arrow.  The purple arrow indicates tributaries detached from main glacier.

mcbride ge

2014 Google Earth image indicating the icefall in relation to 2014 terminus.  The icefall has increased calving and a 100 m increase in elevation.  This is certainly a location where the valley bottom rises, and may be the end of the tidewater reach of the inlet.