Hall Peninsula Ice Cap, Baffin Island Retains No Snowcover in 2023 Fosters Fragmentation

Hall Peninsula Ice Cap east of Popham Bay is snow free on 8-14-2023. Comparison of Landsat images from 2014 and 2023 arrows indicate four locations where the ice cap is fragmenting and at each Point D is an emerging/expanding bedrock area amidst the ice cap.

Hall Peninsula is host to many glaciers and ice caps, almost all unnamed. Here we examine the largest ice cap on the Peninsula using Landsat and Sentinel images. This ice cap is shrinking like Grinnell Ice Cap and Terra Nivea Ice Cap due to limited retained snowcover most years.

The center of the ice cap is just over 1000 m in elevation. By early August in 2023 the ice cap had lost all snowcover. The emergence and expansion of a dozen bedrock areas amidst the ice cap indicates the ice cap is thinning across most of its extent. At Arrow C and E the ice cap has fragmented. At Arrow A and B the fragmentation is nearly complete. Given the lack of any retained snowcover in several recent years, this ice cap will not survive current climate conditions.

Hall Peninsula Ice Cap on 8-6-2023 in Sentinel images. Arrows indicate locations of fragmentation. Point D marks expanding bedrock areas amidst the ice cap.

Terra Nivea Ice Cap Expanding Bedrock Outcrops and Proglacial Lakes

Terra Nivea Ice Cap in Sentinel false color images from 2017 and 2022. Point A=bedrock outcrops expanding. Point L=expanding proglacial lakes. Red arrow=supraglacial stream chanels, yellow arrow=annual layers, green arrow=location where ice cap will separate.

Terra Nivea Ice Cap is the southern most Ice Cap in North America, on the Terra Incognita Peninsula of Baffin Island. Mercer (1956) noted that the ice cap accumulation during most years was via superimposed ice, though some years snow did endure at the top of the ice cap. Paspodoro et al (2015) observed a 34% reduction in ice cap area from 1958-2014 with an acceleration after 2007. Here we note a lack of retained snow, firn or superimposed ice on the northern portion of the ice cap in 2017 and 2022. The lack of retained accumulation as snow or ice results in rapid thinning that is leading to bedrock expansion within and at the margin of the ice cap and the expansion of peripheral proglacial lakes.

Point A marks specific locations where bedrock areas amidst the ice cap are expanding. This expansion will lead to separation of the ice cap at the green arrows soon. The ice cap was 1.9 km wide at this point in 2017 and 1.5 km in 2022. Point L marks locatsions of proglacial lake expansion. The yellow arrows indicate annual layers even at the summit area, which would not be visible if superimposed ice was forming. The red arrows indicate supraglacial stream channel that lead all the way to the summit region. For an ice cap retaiining firn or superimposed ice, the channels would begin below that margin. This illustrates that during the the 2017-2022 there was no retained accumulation on Terra Nivea Ice Cap. This is true of the rest of the ice cap as well. Here in order to better visualize change, the focus is just on the northern portion.

This same story is playing out on Grinnell Ice Cap.

Terra Nivea Ice Cap in Sentinel false color images from 2017 and 2022 illustraing separation region. Point A=bedrock outcrops expanding. Point L=expanding proglacial lakes.  Green arrow=location where ice cap will separate.


The Disappearance of Multiple Baffin Island Glaciers 2002-2019

Glaciers at Point A and B have melted completely away.

The commemoration of a single disappearing glacier in Iceland, Okjokull has brought attention to what is quite a common event this decade, glacier disappearance. Here we report on a number of glaciers in the southern part of the Cumberland Peninsula, Baffin Island  that have either disappeared or separated into several parts  from 2002-2019. Way (2015) noted that on the next peninsula to the west, Terra Nivea and Grinnell Ice Cap had lost 20% of their area in the last three decades. The retreat and disappearance of ice caps in the area have led to a INSTAAR project at UColorado-Boulder examining vegetation that had been buried and is now being exposed.  This year the high snowlines by early June have led to the near complete loss of snowpack across glaciers of the region.  The melt rate of the exposed ice is higher than that of the snowcovered portion of the glaciers.

In the first image a small valley glacier at Point A has melted completely away.  At Point B a small plateau glacier is gone.  At Point C a remanent is left, though it cannot survive long now.  Below  the slope glacier at Point F is gone.  The plateau glacier at point G is gone.  The niche glacier at point E has separated into three small parts.

Glaciers at Point F and G have melted completely away.

Glacier at Point H has melted completely away.

At Point H a plateau glacier has been lost. At Point I two interconnected glaciers have separated into five smaller glaciers. Below the plateau glaciers at Point J and L have been lost.  At Point K a combination icecap-valley galciers has now separated into three parts.  At Point M an interconnected ice cap now consists of of six small glacier parts. The plateau glacier an Point N has been lost.  The slope glacier at Point O has been lost.  The disintegration and separation has been noted at other locations in the region such as Coutts Ice Cap and Borden Peninsula.

Glaciers at Point J and L have melted completely away.

Glaciers at Point N and O have melted completely away.

Penny Ice Cap Northern Outlet Retreat, Baffin Island

Penny Ice Cap Northern Outlet Glacier #43 in 1989 and 2016 Landsat images. Red arrow indicates 1989 terminus, yellow arrow 2016 terminus.  Two peripheral ice masses are at Point A and B. 

The primary northern outlet from the Penny ice Cap is an unnamed glacier, noted as #43 in the recent study by Van Wychen et al (2015). it is one of two large tidewater outlet glaciers on Baffin Island. Here we examine the response driven by climate change of this glacier from 1989 to 2016 using Landsat and Sentinel Imagery. Van Wychen et al (2015) observe that it is one of the two largest discharging glacier on the island and the Penny Ice Cap, with Coronation Glacier.  They observed peak velocities of over 100 m/year, 20 km upglacier of the terminus, declining to less than 20 m/year in the lower 10 km of the glacier.  Zdanowizc et al (2012) noted that in recent years the ice cap has experienced heightened melt, a longer melt season and that little retained snowpack survives the summer, that most of the retained accumulation is refrozen meltwater  or superimposed ice.  Geodetic methods indicate surface lowering of up to 1 m/year on all ice masses on Baffin Island and Bylot Island between 1963 and 2006 (Gardner et al.2012).

In 1989 the glacier terminated 1 km south of a terminal moraine peninsula that extends most of the way across the fjord. By 2014 glacier retreat is accompanied by the formation of two deltaics areas in front of the glacier, orange arrows in images below.  It is not clear if these are islands, a shoal in the fjord or the head of the fjord. Retreat from 1989 to 2016 is 900 m on the west side of the terminus, 600 m on the east side.  Two peripheral ice masses at Point A and B lack snowcover in 2016 and have lost area as well.  Extensive transverse crevasses develop in the last 700 m upglacier of the terminus, indicating the force imbalance that enables and enhances calving at the ice front, yellow arrow.  The reduced retained snowpack on the Penny Ice Cap is leading to reduced discharge and glacier retreat.  With a high snowline in 2016 indicated by the lack of retained snowpack on ice masses at Point A and B, it is clear this trend is ongoing. The impact is less dramatic than those noted in the Clephane Bay area of Baffin Island.

Penny Ice Cap Northern Outlet Glacier in 2016 Sentinel 2 image.  Yellow arrow indicates crevassing triggered by calving processes, orange arrows developing deltaics areas. 

A 2014 Google Earth image of glacier front. Red arrow indicates 1989 terminus, yellow arrow 2016 terminus and orange arrows deltaic land areas building. 

Clephane Bay Ice Cap, Baffin Island Being Erased from Map

clephane bay compare

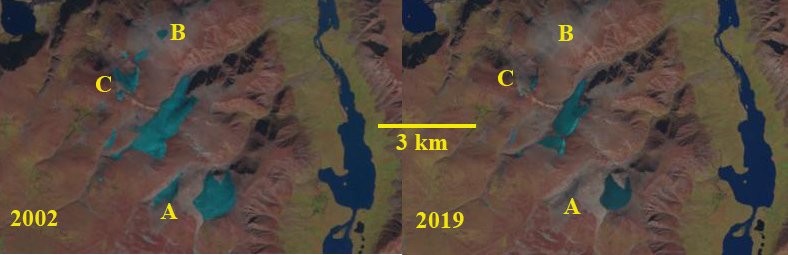
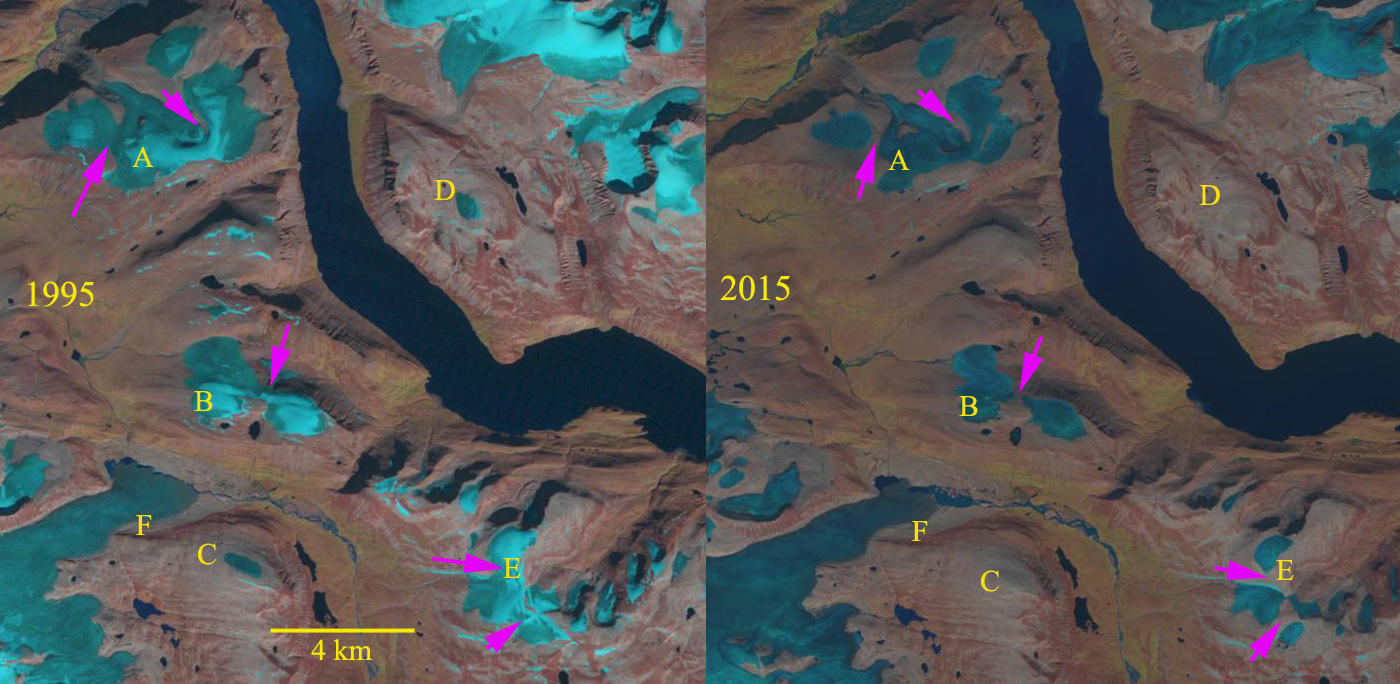
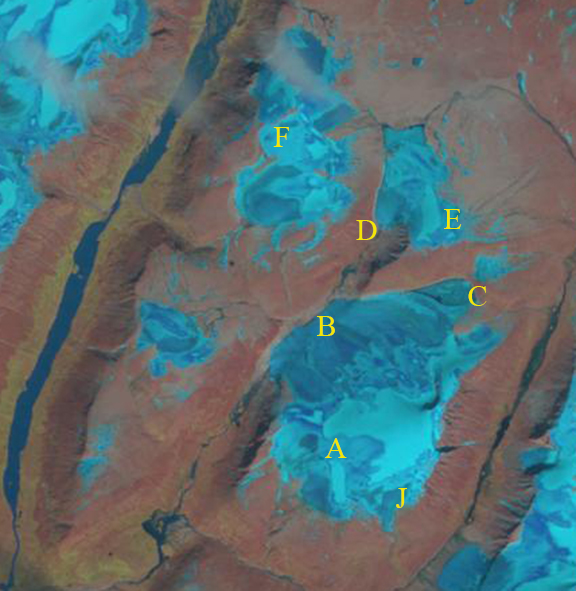
Comparison of 1995 and 2014 Landsat images of ice caps A, B, C, D and E.  Pink arrows indicate where A, B and E separated. C and D have disappeared.  F is an outlet glacier with a retreating terminus.

The southern part of the Cumberland Peninsula on Baffin Island features many small ice caps. Here we examine the disappearance of two and the separation of two others from 1995 to 2014. Way (2015) noted that on the next peninsula to the west, Terra Nivea and Grinnell Ice Cap had lost 20% of their area in the last three decades. The retreat and disappearance of ice caps in the area have led to a INSTAAR project at UColorado-Boulder examining vegetation that had been buried and is now being exposed. Gardner et al 2011 and Sharp et al (2011) both note that the first decade of the 21st century had the warmest temperatures of the last 50 years, the period of record. They identified that the mass loss had doubled in the last decade versus the previous four for Baffin Island. This is causing ice caps like Dexterity and those around Clephane Bay to melt away

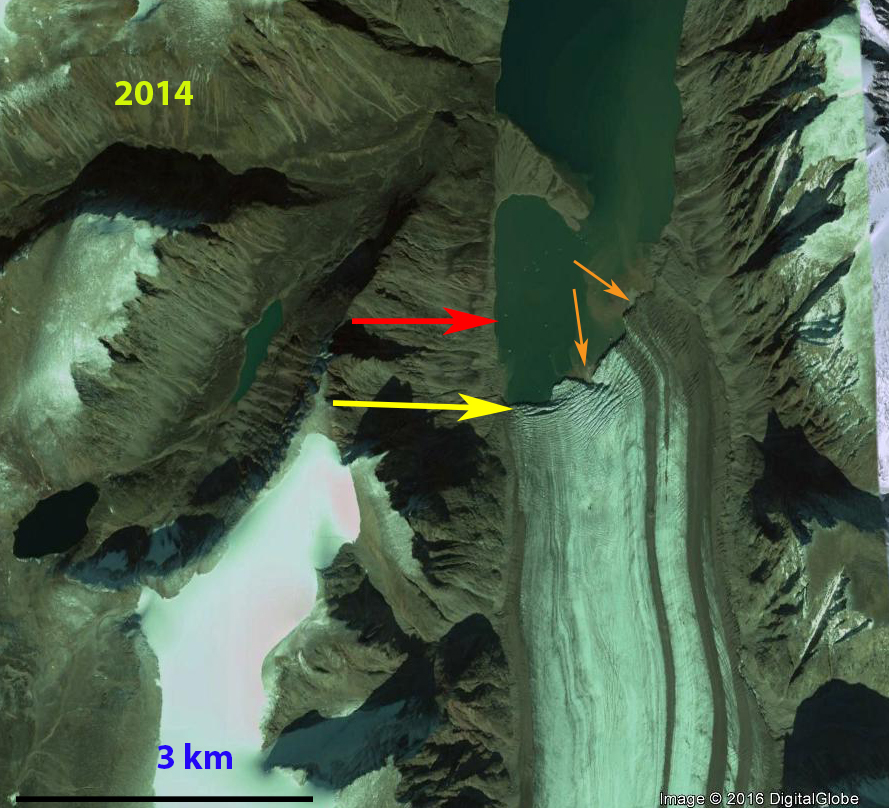
In 1995 ice caps A-E are each a single coherent ice cap, there are narrow points of connection between sections on A, B and E.  Ice Caps C and D are simple ice caps between 500 and 800 m across on their widest axis.  The terminus of the outlet glacier at F is an expanded lobe.  Only Ice Cap A has a significant area above 800 m.  The rate of loss from 1995 to 2002 is not as rapid as after, C and D still exist, A,B and E are still connected as a contiguous ice mass. In 2013 ice cap C and D are gone.  The snowline is generally above A, B and E with only a small stripe of retained snow on each.  Ice cap A, B and E have each separated into multiple parts.  In 2014 there is no retained snow on the ice caps, pink arrows indicate the location of separation for ice caps A,B and E. In 2014 the terminus lobe at Point F has lost half of its area, retreat in distance will not accelerate. The lack of retained accumulation most years indicates no accumulation zone and the ice caps cannot survive without that.  The only clear image in 2015 indicates a  snowcover  in August, but this appears to be from a summer snow event.

clephane bay map

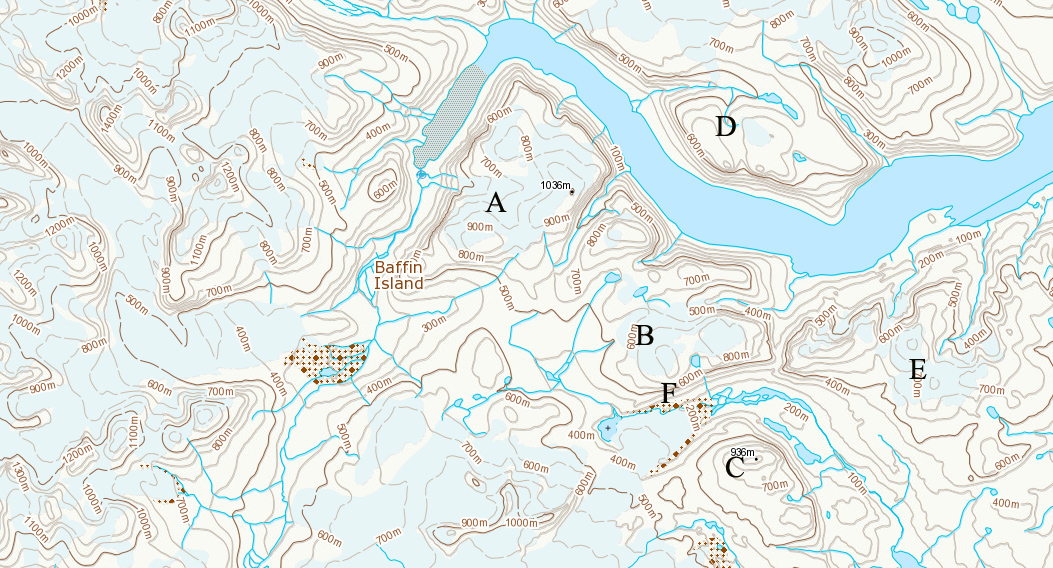
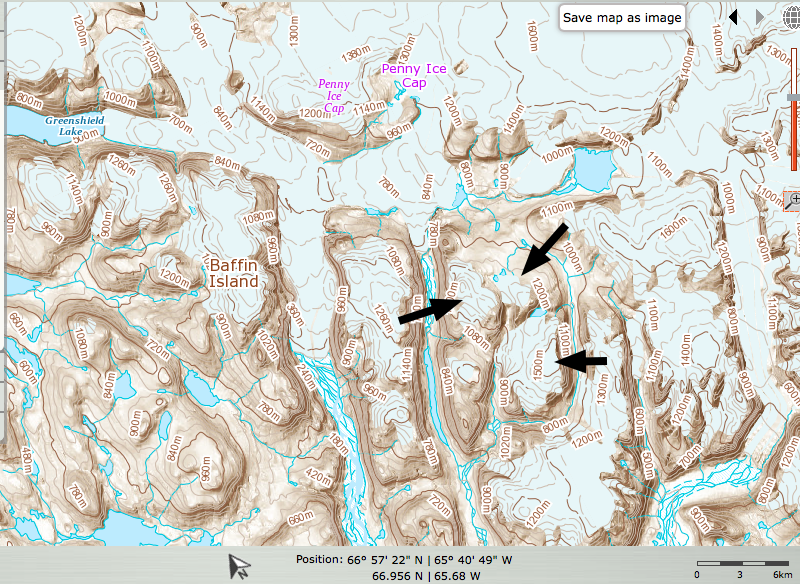
Canada Toporama map of the region.

clephane bay 2000

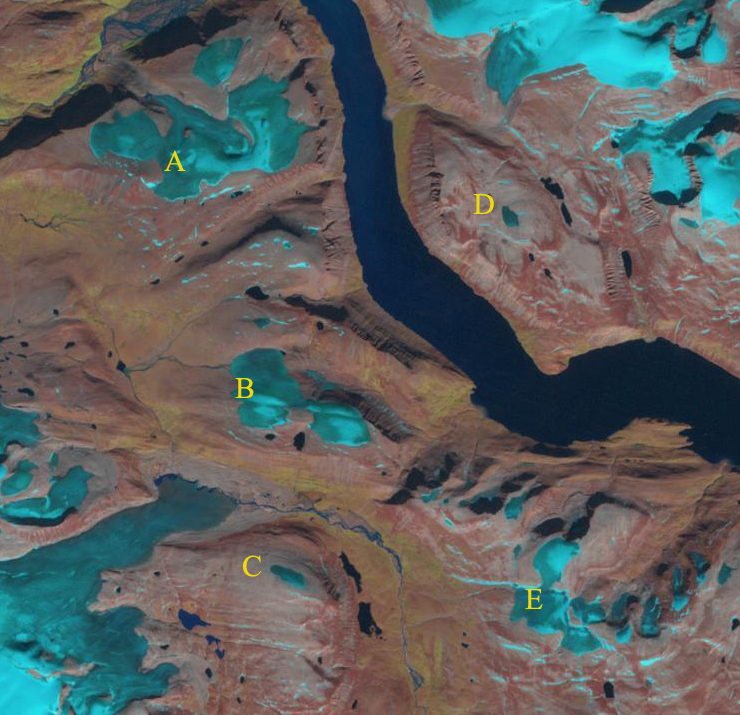
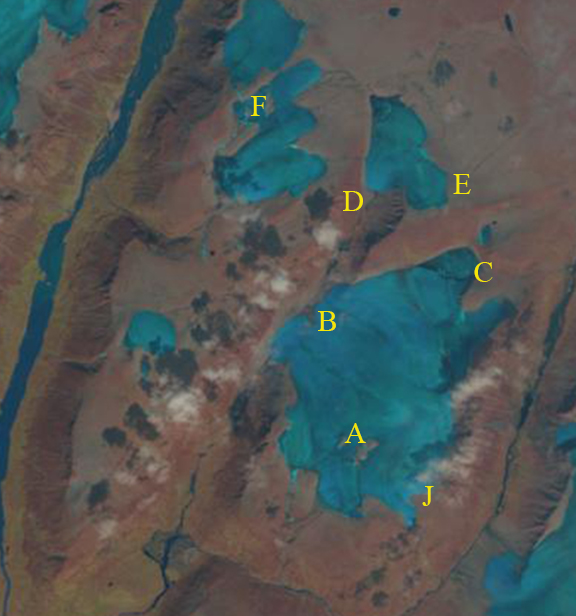
2002 Landsat image limited retained snowpack

clephane bay 2013

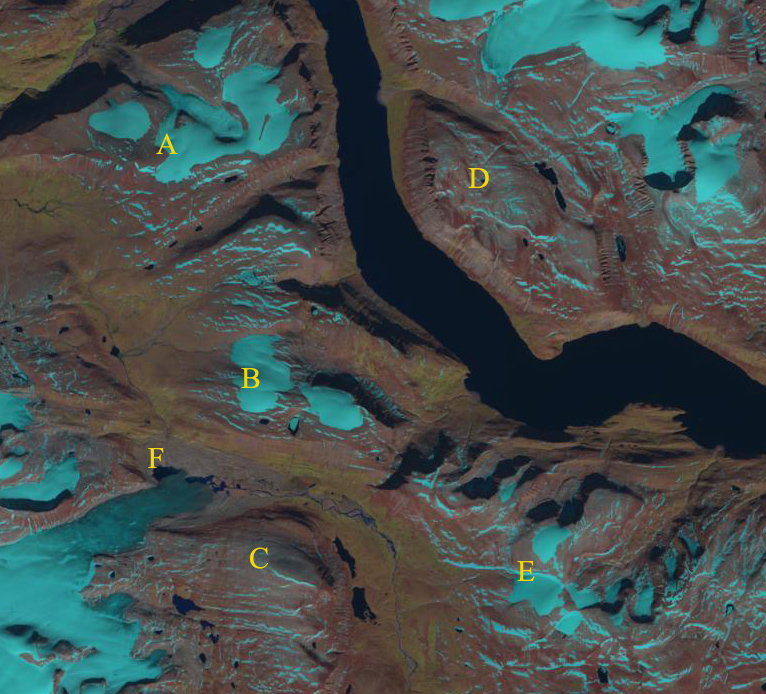
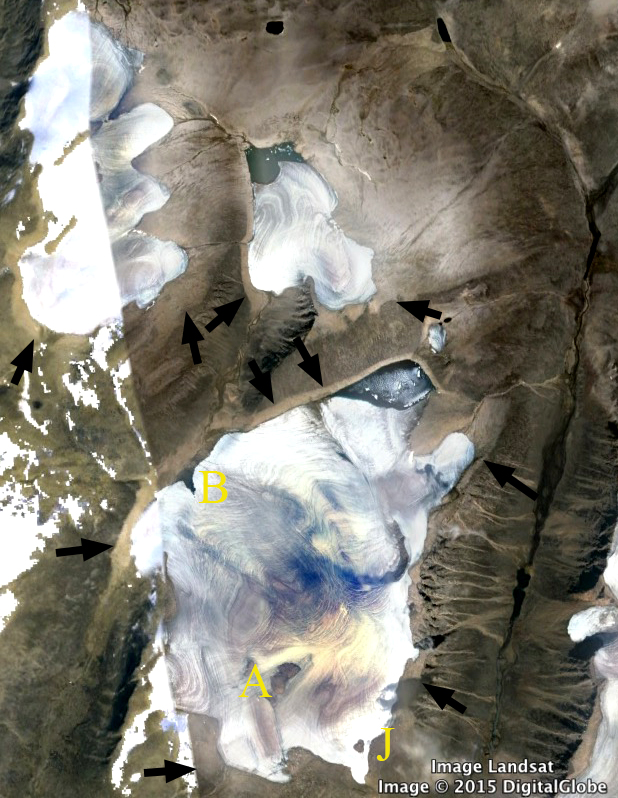
2013 Landsat image no retained snowpack.

clephane bay 2105

2015 Landsat image, appears that a summer snowstorm has spread snow across ice covered regions above 500 m.


Auyuittuq National Park Ice Cap Downwasting, Baffin Island

Just south of the Penny Ice Cap on Baffin Island in Auyuittuq National Park there are a large number of small ice caps.  We focus on three of these ice caps east of Greenshield Lake.  The region has been experiencing rapid ice loss, with 50 % of the ice cap area lost in the last few decades (Miller et al, 2008).  Miller et al (2008) also observe that these are thin and cold glaciers frozen to their beds with limited flow. Way et al (2015) observed the loss of 18-22% of two larger ice caps on Baffin Island, Grinnell and Terra Incognita.  The ice cap losses are due to reduced retained snowpack. Zdanowicz et al (2012)  found that starting in the 1980s, Penny Ice Cap entered a phase of enhanced melt rates related to rising summer and winter air temperatures across the eastern Arctic. In recent years they observed that 70 to 100% of the annual accumulation is in the form of refrozen meltwater. However, if the snowline rises above the ice cap consistently, as happened at Grinnell Ice Cap than there is no firn to retain the meltwater and superimposed ice formation is limited.  Meltwater has difficulty refreezing on a glacier ice surface. The rise in temperature is illustrated by a figure from Way et al (2015), below

penny ice cap map

Map of region south of Penny Ice Cap from Canadian Topographic maps.

gic summer climate

Figure From Way et al; (2015)

In the 1998 Landsat image the two northern ice caps, with E and F on them, have very little retained any snowpack, but significant firn areas.  The larger ice cap has retained snowpack adjacent to Point A and considerable firn area as well. There is a trimline beyond the glacier margin apparent west of Point B due to recent retreat, but otherwise trimlines are not immediately evident.  In 2000 the two northern ice caps again have very little retained snow, and the larger ice cap retained snow near Point A.  In the 2013 Google Earth image black arrows on the image indicate trimlines recently exposed by glacier retreat.  There is no evident retained snow, and no retained firn is even evident. This suggests the ice caps lacks an accumulation zone.  A close up view, illustrates many years of accumulation layers now exposed, note the linear dark lines, black arrows.  The second closeup view illustrates the area around Point E and D that has been deglaciated.  There also are some new areas of expanded bedrock such as near Point A on the larger ice cap.  The 2014 Landsat image indicates the bedrock has expanded at Point A.  At Point B an area of bedrock is expanding into the ice cap.  At Point C the lake has expanded at.  Ice has melted away from Point D and E. At Point F a new area of bedrock has emerged within the ice cap.  At Point J the new bedrock seen in the 2013 Google Earth image has now expanded to the margin of the ice sheet.  These changes are a result of a thinning ice cap, largely due to increased ablation.  The lack of retained snow cover or firn confirms there is not a consistent accumulation zone and that these ice caps cannot survive current climate (Pelto, 2010).

baffin smi 1998 copy

1998 Landsat image

baffin smi 2000 copy

2000 Landsat image

baffin smi 2013ge copy

2013 Google Earth Image

baffinsmi closeup copy

Google Earth Closeup

baffinsmi closeup2 copy

Google Earth Closeup

baffin smi 2014 copy

2014 Landsat image